HOW DISTORTED IS CUBA'S TRADE?Evidence and Predictions from a Gravity Model
by
Claudio E. Montenegro *University of Maryland
and
Raimundo SotoGeorgetown University
January 21, 2000
* We are grateful to Roger Betancourt, Eliana Cardoso, Rodney Chun, Jaime de Melo, Zhen Kun,Javier León, Partha Mukhopadhyay, Lant Pritchett and Glenn Sheriff for their comments andsuggestions. Two anonymous referees from this Journal also provided valuable comments that greatlyimproved the paper. Remaining errors are, however, our own. Responsibility for the contents of thispaper is entirely that of its authors and should not be attributed to their affiliated organizations.
Abstract
Cuban trade has been historically distorted for two reasons: its membership in the socialist trade pact(CMEA) and the US embargo. Using a gravity model, this article explores the degree of distortionof the current Cuban trade structure and predicts its evolution, in the event the economy is liberalized.The econometric approach uses information on trade flows between 101 developing and developedcountries in the 1980-1991 period. The main results predict that 80% of Cuban exports and importswill switch away from current partners (in particular, Canada and Japan) towards the US, to reducetransportation and transaction costs. The results appear robust to specification, time period and tradedeterminants. The degree of distortion of Cuban trade has declined in the 1990-1991 period but,unless the US embargo is lifted, it will not converge to what world trade patterns predict.
1
1 The formal dismantlement of the CMEA came at the beginning of 1991, but trade deals were undertaken on acountry-by-country basis and in hard-currency prices since late 1990.
How Distorted is Cuba's Trade?
Evidence and Predictions from a Gravity Model
I. INTRODUCTION
The collapse of the CMEA in August, 1990 not only meant the end of several decades of
socialist barter-trade and the beginning of unforeseen reforms in East Europe, but also induced a
severe downturn to the Cuban economy, forcing the implementation of much postponed trade
reforms which many consider to be the first step towards the dismantlement of the socialist system
and the implementation of a full market economy (Mesa-Lago, 1993a; Preeg, 1993).1
The response of the Cuban authorities to the crisis has been mixed. On one hand, most of the
rhetoric of the economic emergency plan, the Special Period in Time of Peace, has called for a
reduction in the role of domestic and external markets and a return to tight planning, as well as the
enforcing of "socialist incentives" (Mesa-Lago, 1994). On the other hand, the acute shortage of
foreign currency and the loss of Soviet subsidies, has forced the government to tolerate an
unprecedented number of market activities traditionally regarded as "counter-revolutionary", initially
in the form of joint ventures with foreign capital to develop tourism and other foreign generating
activities --a direct way to finance fuel and food imports-- and, more recently, with the tacit
acceptance of the increasing role of the parallel economy, in which most transactions are conducted
in US dollars.
This forced opening of the Cuban economy poses an interesting question regarding the role
of trade in a future strategy of development. Although foreign commerce as of 1992 (the latest
2
2 For example, in 1988 85% of wheat and 50% of Cuban corn imports came from the USSR, incurring in hightransportation cost that could have been otherwise avoided if goods were imported from the US excess production.
information available) remained concentrated in former CMEA countries, it should be expected that
a comprehensive liberalization of the economy would relocate Cuban imports and exports to other
developed and developing countries, to benefit from its comparative advantages and reduce
transaction and transportation costs. In particular, if the American embargo is lifted, an important part
of imports and exports would be redirected to the US, in view of the short distance between the two
countries and the size of the American market.2 In addition, the integration of Cuba to international
markets will probably have an important effect on the trade structure of other Caribbean countries,
which might suffer from increased export competition, but could also benefit from the relocation of
Cuban imports toward less distant partners.
This paper explores these issues. First, we analyze the degree of distortion of Cuban trade
with regards to world trade patterns. To this end, we formulate a simple econometric model that
simulates, for a country in a similar situation to Cuba, the pattern of trade in terms of volume and
partner composition. We then measure how far Cuba is from that benchmark. Second, recognizing
that countries in the Caribbean Basin might share a particular trade structure as determined by
location, endowment, and access to foreign markets, the model is modified to discuss to what extent
the simulated structure of foreign trade of Cuba would differ from that of its neighbors. Third, using
predictions of the model for the 1980-85 and 1986-91 periods, we analyze the evolution of Cuban
trade to verify whether actual changes in trade structures reflect an increasing integration with world
markets.
The econometric approach, known as a gravity model, is relatively straightforward. We pose
a reduced-form specification which links the total volume of bilateral trade to the degree of economic
3
3 Gravity models have been successfully applied to EC countries (Fitzpatrick, 1984; and Oguledo and MacPhee, 1994),regional and sectoral analysis (Docclo, 1993; Eaton and Tamura, 1994), East European transition economies(Havrylyshyn and Pritchett, 1991), industrialized countries (Bröckner and Rohweder, 1991), and even for specificproducts (see Slama, 1983, for an analysis of flows of patent applications).
4 Anderson (1979) and Bergstrand (1985) provide general equilibrium foundations for gravity models under veryrestrictive conditions (product homogeneity and identical preferences and production functions in both countries).
development of the countries and transportation costs, as well as specific variables that might
influence trade, such as vicinity (neighbor countries), trade arrangements, landlocked territory, etc.3
Although rigorous theoretical foundations for this type of models can only be obtained under
somewhat restrictive assumptions4, they have outperformed more sophisticated models when
predicting bilateral trade and providing reliable results (Foroutan, Montenegro and Pritchett, 1994;
Frankel, Stein and Wei, 1994).
The paper is structured as follows: section two discusses the initial conditions which forced
the Cubans to integrate with market economies and portrays the level and composition of foreign
trade. Section three presents the econometric approach and discusses issues regarding the availability
of data and its limitations. Section four presents the econometric estimation. Section five presents
comparisons of actual Cuban trade with that simulated by the model, using two country samples (65
LDCs and 13 Caribbean countries) and two time periods (1981-85 and 1986-91) that help calibrate
the results. Section six sums up the conclusions.
II. ECONOMIC CRISIS IN CUBA AND TRADE RELOCATION
Despite recurrent mismanagement and planning problems, the Cuban economy grew at rather
high rates during most of the 1975-1985 period, when the economic authorities gradually introduced
a modest market reform. When measured by the gross social product (GSP), the economy grew at
an average rate of 8% per year and per-capita income doubled. It is estimated that by 1985, per-capita
4
5 These figures should be taken with caution because estimating Cuba's real GDP in foreign currency is difficult sincenational accounts follow the standard socialist material product methodology and also because the official exchangerate is evidently overvalued.
6 During the 1975-85 period, the Caribbean countries grew at an annual average rate of -1.1% (per capita), while theirtrade volumes decreased by 0.4% annually (World Bank, 1990).
7 These estimates, which exclude other transfers in the form of development and/or military aid, are based on acomparison of the international prices of the main export goods (sugar, nickel) and those actually paid by the USSR.A similar calculation is performed for Cuban oil imports.
GDP reached US$ 2,900, ranking Cuba among the richest countries in Latin America (see Table 1).5
In contrast, most developing countries, and in particular Cuba's Caribbean neighbors, exhibited low
growth and poor macroeconomic performance, especially in terms of their volume of trade.6 GDP
in Cuba expanded faster in the second half of the decade, at around 10% per year, largely fueled by
the continuing demand of sugar and other primary goods from the USSR and other CMEA partners,
and the willingness of the latter to pay subsidized prices. Total subsidies implicit in sugar, oil and
nickel prices in that period are estimated at around $15 billion, equivalent to 10% of GSP per year
(Mesa-Lago, 1993a).7
Trade, as in the case of most socialist economies, remained constrained by the CMEA
structure in which transactions were quoted in convertible rubles, but in fact were negotiated as
barter-trade agreements. Within these boundaries, Cuban exports concentrated heavily in sugar
(75%), minerals (5%), and tobacco (2%), while the main imports were fuels (35%) and machinery
and other capital goods (30%); trade with market economies was not more diversified in terms of
exports. Table 1 presents the aggregate composition of Cuban exports and imports, valued in
domestic currency, where the mono-export characteristic of the economy and the inability to diversify
exports is apparent. Despite substantial efforts devoted to diversification, "other" exports increased
their share from 5.5% in 1975 to only 9.5% in 1985.
5
8 Cuba's foreign debt with CMEA countries is not available before 1989, when it was estimated at R 15.4 billion withthe USSR and R 3 billion with the other countries. The official exchange rate in 1989 was R 1.58 per US dollar, whilethe commercial rate was R 0.50 to the dollar; hence, the total debt ranged between US$ 10 to 16 billion.
This pattern of trade --exports concentrated in primary goods and significant capital goods
imports-- does not deviate significantly from that of most developing countries with comparable per-
capita income levels. However, the composition of trade in terms of partners reflects an important
pattern and a worrisome evolution (see Table 2). Trade within the CMEA concentrated almost
exclusively in one partner, the USSR, with few transactions taking place with other socialist
countries. Moreover, during the 1980-85 period Cuban exports reoriented from the OECD and LDCs
toward socialist economies, in particular to the USSR, so that by 1985 almost 90% of all exports
were directed to CMEA countries, in contrast with only 68% in 1975. Given that trade with socialist
countries in non-transferable rubles required deficits in the balance of payments to remain under
control, imports from socialist economies increased also markedly in the period, though not as much
as exports.
The share of imports from the OECD countries, which diminished to only 11.3% of total
imports by 1985, reflects the increasing inability of Cuba to finance its substantial trade deficits in
hard currency. Since 1981 there was a tendency toward a continuous deterioration in the balance of
payments in hard currency, which depended heavily on Cuban re-exports of Soviet oil and sugar
proceeds. Not only did the USSR reduce the quota of oil to be sent to Cuba but also, as prices in
international markets declined, revenues from reexporting oil fell. As a result foreign debt
accumulated; the outstanding debt in hard currency was estimated around 12% of GDP in 1985 (see
Table 1).8 This level was low by Latin American standards, but due to Cuba's reduced capacity to
obtain hard-currency revenues from exports, it actually caused substantial financial distress to the
economy.
6
9 Mesa-Lago (1993a) estimates that the loss of CMEA subsidies in trade and commercial credit during the 1989-92period directly caused a drop in GDP of around 25%. Indirect effects on domestic production remain to be quantified.
In spite of the satisfactory macroeconomic performance in the 1975-1985 period, in 1986 the
Cuban authorities launched a revised program of economic control, the Proceso de Rectificación,
which called for a reduced role of market forces at both the external and domestic level. The reasons
for the reversal in market liberalization seems to be mainly ideological, although the increasing foreign
debt stemming from the trade deficit as well as a worsening income distribution, might have played
some role (Mesa-Lago, 1993a, pp. 133). The further deterioration in sugar prices and oil re-export
revenues led the Cuban authorities to reschedule debt obligations in 1985-86 and initiate a program
of economic austerity, which did not avoid the declaration of the debt moratorium in 1987.
Output growth targets for the 1986-90 period, in the range of 4 to 5% per year, could not be
achieved as the increasing difficulties in the trade with Eastern Europe rendered the target
unattainable. Nonetheless, the economy maintained some inertia and GDP grew at 2-3% per year.
The collapse of East European markets in 1990 and the reduction in subsidies from Russia (implicit
subsidies to Cuban exports fell from 10% of GSP in 1985 to zero in 1992) could not be compensated
by expanding exports to market economies, tourism revenues, and joint venture investment. As of
1993, the economy has completed a deep recessionary period, in which per capita GDP is estimated
to have declined by 45% (see Table 1). Exports to East Germany, Poland and Yugoslavia disappeared
altogether while oil imports barely reached one fifth of its 1988 level, insufficient to meet the
domestic demand for fuels. A key element in this dramatic economic downturn has been Cuba's trade
structure; its total dependence on Soviet sugar demands and cheap oil supplies made the economy
extremely vulnerable to trade disruptions.9 The debacle could have been worse were it not for
favorable trade pacts negotiated with Russia in 1990 and 1991, which softened the phasing out of
7
10 The countries are Colombia, Costa Rica, Dominican Republic, Guatemala, Honduras, Haiti, Jamaica, Mexico,Nicaragua, Panama, El Salvador, Trinidad and Tobago, and Venezuela.
transfers and allowed Cuba to seek new markets for its exports (such as Egypt, Syria or Argentina)
as well as new partners with which to continue barter trading of sugar for oil (the newly formed
republics of Central Asia and Iraq).
The distorted trade structure of Cuba not only reflects an excessive participation of the USSR
and other CMEA countries, but also an abnormal composition of that part of foreign trade which is
undertaken in international markets. This is a direct outcome of the US embargo which not only bans
direct trade between the two countries but also prohibits, under the Torricelli Bill, third country
subsidiaries of US companies from trading with Cuba and withholds assistance to countries which
grant preferential trade agreements to Cuba.
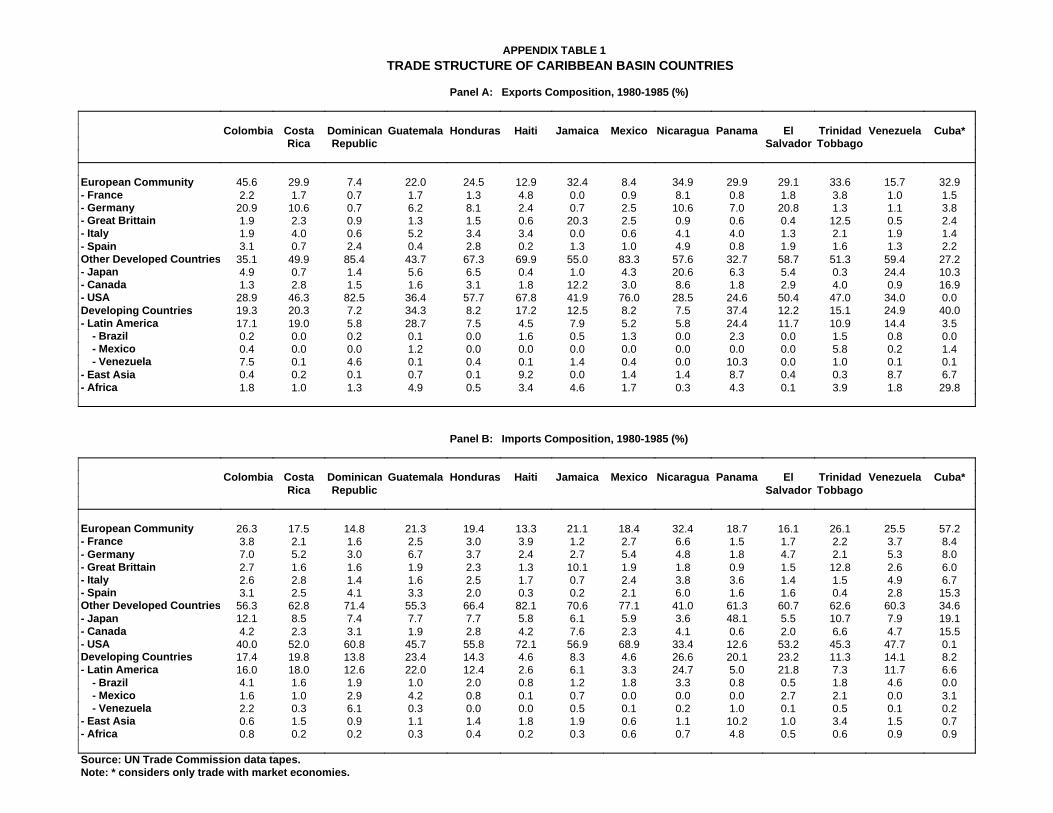
A comparison of trade patterns between Cuba and comparable market economies suggests
the magnitude of the distortion and helps assess the potential trade structure that would prevail were
Cuba to integrate with the world economy. Table 3 presents the trade structure of Cuba and a group
of 13 developing countries in the Caribbean region, for which trade data was available.10 This
"Caribbean Basin" sample portrays the average structure of trade of those countries which by size,
location, and endowment are comparable in economic terms to Cuba. Apart from group totals, we
have included the simple average of three countries potentially similar to Cuba in terms of location
and endowment (Jamaica, Dominican Republic and Trinidad and Tobago) to control for the presence
of economies larger than Cuba (e.g., Mexico, Venezuela) that would potentially bias the analysis. The
results, nevertheless, do not differ in any important respect.
The first element to be drawn from the table is the key role played by US trade in each of
these countries, and consequently, the importance for Cuba of the American embargo. On average,
8
half of total exports and imports in the region are exchanged with the US, while the composite of the
three countries trades slightly more. A second and related issue is the importance of Canada and
Japan in Cuba's trade, which in part substitute the American market; in comparative terms, none of
the Caribbean countries exchange more than 6% of total trade with Canada, while Cuba triples that
amount. Similarly, trade with Japan is much more important for Cuba than for the other countries,
even when considering that the group average is affected by the important volume of imports of
Panama (48% of total trade) and exports of Venezuela (25%); the difference is particularly important
when comparing the three-country composite, which export less than 1% of the total to Japan as
opposed to 19% for Cuba. A third element is the relative importance of the EC, which accounts for
more than 50% of Cuban imports, but is far less important for the rest of the Caribbean countries. In
particular, Spain provides almost 15% of total Cuban imports, but less than 2% in the other countries.
Finally, Cuba's trade with developing countries tends to be concentrated in countries other than Latin
American economies, which are half as important in Cuba as in the Caribbean countries, particularly
in exports, which concentrate in Egypt, Syria and other Middle East countries.
The preceding description suggests two main shortcomings of the present Cuban trade
patterns: on one hand, the US embargo requires Cuba to pay an extra cost for imported goods arising
from long-distance transportation, which would otherwise be drastically reduced by purchasing goods
of equal quality from the US. On the other hand, Cuba's exports are concentrated in a product (sugar)
also produced by other Caribbean countries and sold by bilateral agreements with the US, which
forces the Cuban authorities to search for distant markets to place exports. This acts as an implicit
"tax" on export revenues.
During the late 1980s and early 1990s, Cuban exports declined considerably both in volume
and value; the lack of access to credit obliged the government to reduce imports drastically. Total
9
trade declined from $13.5 billion in 1989 to $7.3 billion in 1991 and to around $4 billion in 1993 (see
Table 1). As East European countries sank into foreign trade crises, Cuba turned to China, Egypt,
Syria, Argentina and other developing countries as destination for its exports; LDCs became
important partners and increased their share in total trade from 8% in 1985 to around 20% in 1989
and 25% in 1991. Although most of the trade difficulties with ex-CMEA countries are a response to
the adverse conditions in the latter, part of the reduction in exports to the USSR and other CMEA
countries arise from the fact that since 1991, an increasing part of shipping costs were to be paid by
Cuba (Blasier, 1993), thus reducing export revenues.
III. THE GRAVITY MODEL
Gravity models have been utilized to analyze the pattern of trade between two countries with
particular success for more than 30 years. Two seminal papers by Tinbergen (1962) and Pöyhönen
(1963) provided initial specifications and estimates of the determinants of trade flows but, like most
of the literature, lacked an adequate theoretical background. The basic intuition, which gives its name
to this type of econometric models, is that trade between two countries resembles the gravitational
interaction between planets; the attraction force (equivalently, total trade) is determined by their
relative masses (i.e., economic size) and the distance which separate them (i.e., the transportation
cost). In addition to this basic framework, other variables are introduced to acknowledge the effects
of bilateral trade arrangements, colonial and cultural ties, dissimilar factor endowments, and political
factors. Despite weak theoretical foundations, gravity models remained popular as they have
outperformed more sophisticated models when forecasting the composition of trade flows. According
to Deardorff (1984) this success is due to its ability to explain some real phenomena the conventional
10
M ji ,X j
i ' N (TP i ,TP j ,TC ji , SF i,j) (1)
factor endowment theory cannot easily accommodate by itself, such as intra-industry trade and, in
particular, the lack of dramatic resource reallocations when trade liberalization processes have taken
place. Recently, however, Treffler (1993) provided evidence that trade flows can be consistent with
the endowment theory once factor-augmenting differentials in productivity among countries are
allowed in the specification.
The empirical success of gravity models motivated a search for a theoretical justification of
the originally ad-hoc specification. Linneman (1966) provides one of the earliest theoretical model
in which the gravity equation corresponds to a reduced-form equation derived from a four-equation
partial equilibrium model of export supply and import demand. This simple specification, in which
prices merely adjust to equate demand and supply, remains one of the most commonly used models
(e.g. Oguledo and MacPhee, 1994; Docclo, 1993 and Havrylyshyn and Pritchett, 1991). More
rigorous general equilibrium models are presented by Anderson (1979) and Bergstrand (1985) which,
however, use restrictive assumptions to derive the gravity equation; in particular, they require
identical preferences and production functions, perfect substitutability of goods in production and
consumption, perfect arbitrage, and constant transportation costs. Finally, Asilis and Rivera-Batiz
(1994) derive a gravity equation from a general equilibrium model which relaxes technological
assumptions and allows for externalities (pollution and congestion).
The standard gravity specification postulates that trade between two countries can be
modelled as in equation 1, where the subindex i represents the reporter country and the subindex j
corresponds to the partner country:
11
11 Linder (1961) advanced the notion that countries with similar per-capita income, produce and consume similargoods, thus trade with each other more than when their economies differ in size and structure.
M ji , X j
i ' $0 %$1 GDPi%$2
GDPi
Ni
%$3 Areai%$4 Islandi%$5 Landlocked
% $6 GDP j%$7GDP j
N j%$8 Area j%$9 Island j%
% $11 D ji %$12 Border j,k
i %$13 Linder j,ki %j
5
z'1*zLang
(2)
where Mij represents non-fuel imports of the reporter from partner "j" and Xi
j corresponds to non-fuel
exports of the reporter to partner "j". Trade potentials (TPi, TPj) are usually represented in terms of
the size of the economy (measured for example by the GDP), its degree of development (e.g., per-
capita income) and population or physical area. In addition to transportation costs (TCij), specific
factors (SFi,j) can have an important effect in determining trade volumes between two countries;
among them, membership in special trade areas (bilateral or multilateral arrangements), cultural
affinity, vicinity (countries sharing a common border), and particularities such as a reporter or a
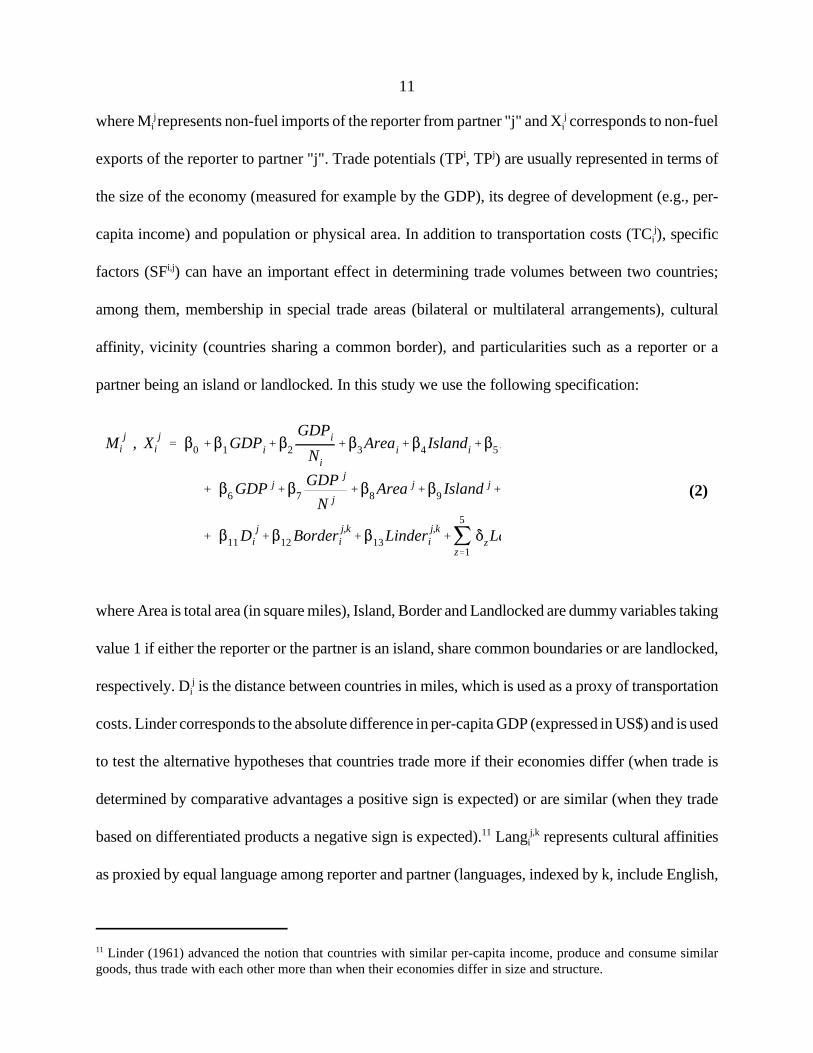
partner being an island or landlocked. In this study we use the following specification:
where Area is total area (in square miles), Island, Border and Landlocked are dummy variables taking
value 1 if either the reporter or the partner is an island, share common boundaries or are landlocked,
respectively. Dij is the distance between countries in miles, which is used as a proxy of transportation
costs. Linder corresponds to the absolute difference in per-capita GDP (expressed in US$) and is used
to test the alternative hypotheses that countries trade more if their economies differ (when trade is
determined by comparative advantages a positive sign is expected) or are similar (when they trade
based on differentiated products a negative sign is expected).11 Langij,k represents cultural affinities
as proxied by equal language among reporter and partner (languages, indexed by k, include English,
12
Spanish, French, Arabic and Portuguese). Finally, T.A.ij,k is a dummy for trade agreements, which is
indexed i,{j,k} to reflect that a country may belong to more than one trade arrangement.
Regarding the sign of the parameters, it is expected that trade will increase with GDP as well
as with cultural ties and trade arrangements. On the contrary, as distance increases trade should
decline, recognizing the adverse effect of transportation costs. Likewise, trade should decline with
the economic size (proxied by area) of trading countries (partner or reporter). Regarding the reporter
and partner's per capita GDP, Bergstrand (1989) suggests that signs are ambigous: exporter per
capita GDP should have a positive (negative) effect if the composition of trade flows is capita (labor)
intensive in production. Importer per-capita GDP should have a positive (negative) effect if the
composition of trade flows is on luxury (necessity) goods in consumption. We expect the former to
be negative, reflecting the relative abundance of labor in Cuba, when compared to most market
economies. This assumption, nevertheless, cannot be empirically determined since the measurement
of endowments as undertaken for market economies (Leamer, 1984), would yield particularly biased
results in this case, due to lack of data and price distortions which characterized the Cuban economy.
An interesting case is the interpretation of Island, for which a positive parameter is expected;
reflecting the empirical regularity that islands tend to trade more than other countries. The reason is
that islands tend to be very specialized in their inputs to production, and thus must rely on
comparative advantage to enhance wealth. Furthermore, there is strong empirical evidence that per
mile shipping by land is twice as expensive as shipping by ocean.
The estimation procedure is undertaken using a Tobit model, to control for left-censoring
problems which arise in this case because trade volumes are bounded from below by zero. OLS
techniques are inappropriate in this context because parameters are inconsistent if the dependent
variable is censored. Alternative procedures utilized by some researchers, such as eliminating zeros
13
Logyi ' &Jy%2)Zyi
%µ i with µ i-N(0 ,F2µ (3)
i'0)'Prob(ui <JY&2)ZVi
)' (1&Fi )
i >0) @ f (yi |yi >0)'Fi
f (yi&2)Zi ,F
2µ )
Fi
'1
2AF2µ
e&1/2F2
µ (yi% (4)
LogL ' jy'0
log(1&Fi ) % jy>0
log( 1
2AF2µ
) & jy>0
1
2F (5)
in the dependent variable (e.g., Brada and Méndez, 1985) or replacing them by arbitrary small values,
tend to bias the results. Another advantage of the Tobit specification is that the use of a maximum
likelihood technique yield parameters which are extremely reliable, even when the sample is rather
small (Sen and Matuszewski, 1991). In our case, large samples (between 1,300 and 6,500
observations) ensure the quality of the estimation. In addition, we use a logarithmic specification,
which also gives a direct measure of the elasticities; Sanso, Cuairan and Sanz (1993) present evidence
regarding the appropriate specification of gravity models by using Box-Cox time transformation and
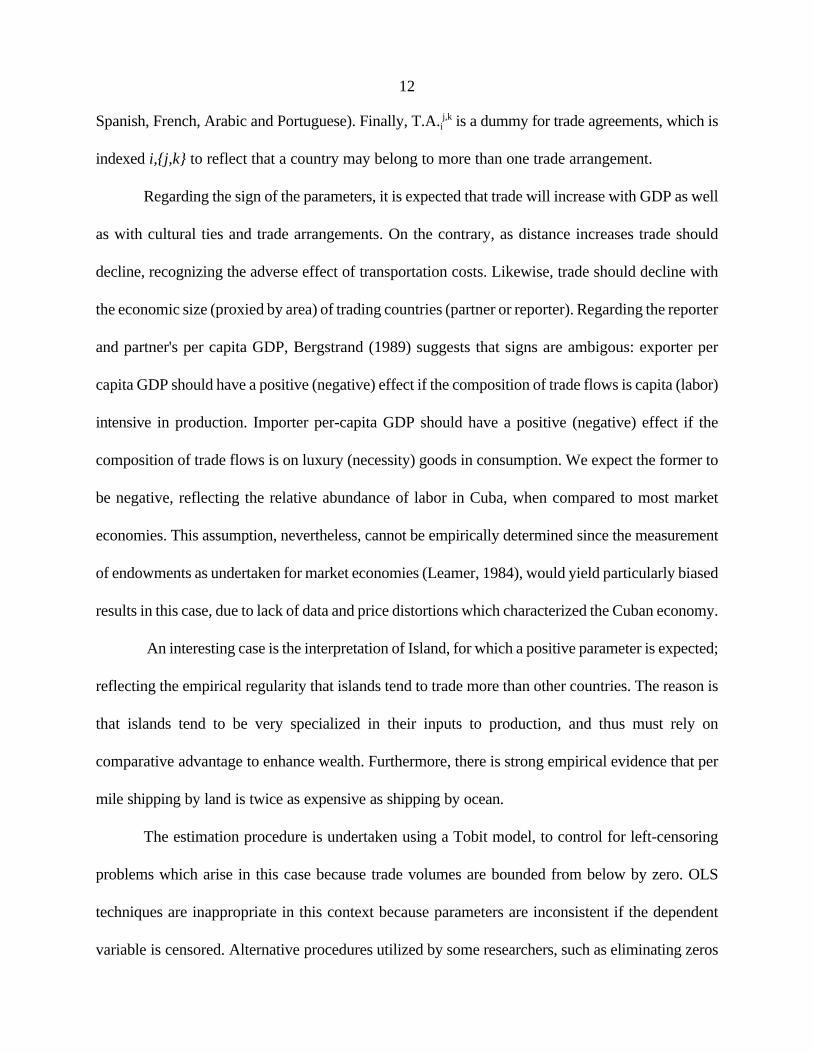
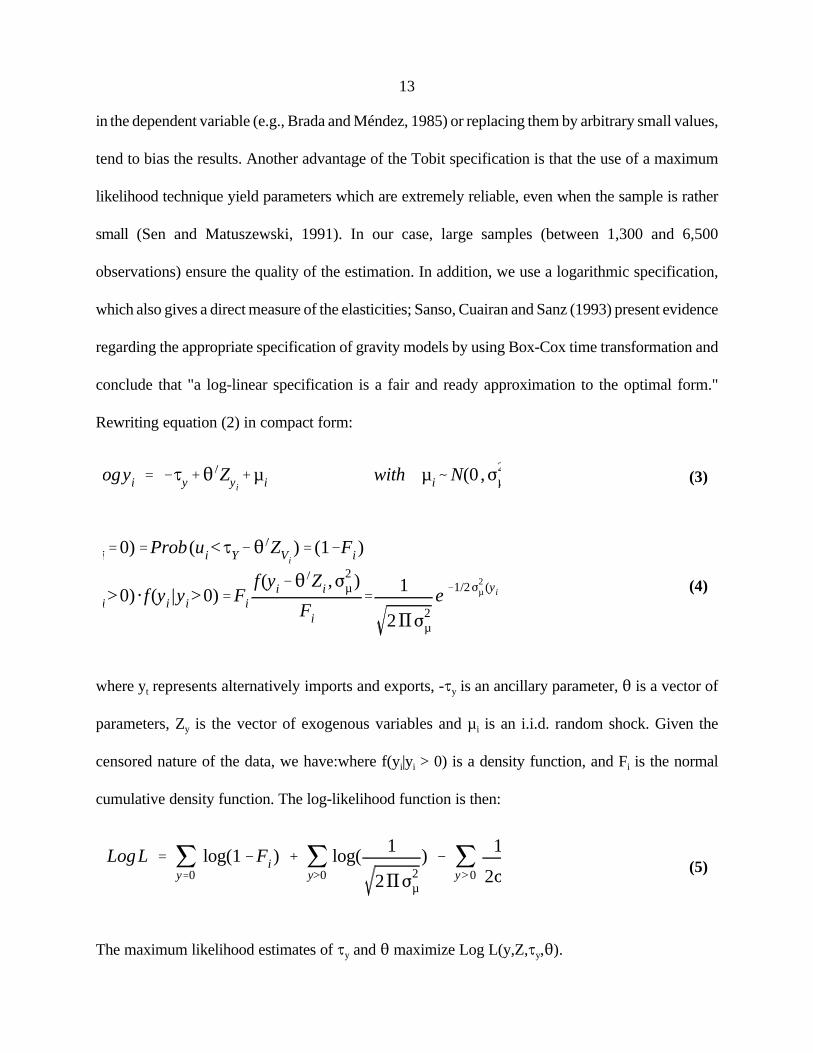
conclude that "a log-linear specification is a fair and ready approximation to the optimal form."
Rewriting equation (2) in compact form:
where yt represents alternatively imports and exports, -Jy is an ancillary parameter, 2 is a vector of
parameters, Zy is the vector of exogenous variables and µ i is an i.i.d. random shock. Given the
censored nature of the data, we have:where f(yi|yi > 0) is a density function, and Fi is the normal
cumulative density function. The log-likelihood function is then:
The maximum likelihood estimates of Jy and 2 maximize Log L(y,Z,Jy,2).
14
12 See the Appendix for a description of the sample and the selection criteria.
Despite all the advantages of the gravity equation, we acknowledge that in the absence of a
solid theoretical background the interpretation of the results may be less precise than one would like,
and that since the model is rather simple, it may neglect other potentially important factors (such as
the endowment of natural resources). At the data level, physical distance is not necessarily a good
proxy of transportation costs as noted by Geraci and Prewo (1977) and Balassa and Noland (1988),
although it is readily available; likewise, using the territorial area or population as proxies of economic
size can be misleading in some cases.
IV. EMPIRICAL RESULTS
The gravity model is estimated for exports and imports separately, instead of the total trade
turnover with every partner, as it is presumed that the effects of the fundamentals might differ in each
case. In addition, we performed the estimation for the average value of trade of 65 developing
countries in two different periods, 1980-85 and 1986-91, with a total of 100 partners for each country
(thus each regression uses 6,500 observations).12 The former captures the last period of "pure"
socialist trade, before the first attempts of reform were introduced in the USSR, Eastern Europe and
especially in Cuba. The latter period attempts to depict the situation after the collapse of the socialist
economic order, which affected not only Cuba directly but also the rest of the LDCs which have seen
increased competition in commodity markets. Also, by using the average trade for that period we
avoid transient phenomena biases (e.g., the business cycle) that might arise when using a single year
sample. Finally, in order to acknowledge the notion that Caribbean countries might enjoy specific
characteristics (e.g., location) that would force them to deviate from the average economy as
15
13 The appropriateness of the Tobit procedure can be illustrated by noting that the OLS estimates on the GDP anddistance parameters would have been overestimated by 25 to 30%, in both the general and the Caribbean models.
14Foroutan et al (1994) also found a negative sign, which might suggest that the variable is a poor proxy ofthe degree of industrialization.
predicted by the general model estimated, we re-estimate the gravity model for the group of 13
countries that comprise the bulk of total trade in the area (the sample comprises 1300 observations
in each period).
The results of the Tobit estimation are for the 1980-85 period are presented in Table 4. In
general, all parameters are significant at conventional levels of confidence and present the expected
sign. The parameters are also in the range of other studies which use similar methodologies (see
Frankel et al. ,1994; Foroutan et al., 1994)13. As expected, in both export and import regressions
transport costs and vicinity have a significant parameter, a result that is robust to country and period
selection. Similarly, the size of the economy measured by the GDP, for both the reporter and the
partner, has a positive effect on the volume of trade. Parameters which capture specific characteristics
of the countries (size, landlocked and island) confirm the regularities obtained in previous papers: the
negative parameter of the reporter's area, in both exports and imports regressions, suggests that the
larger the country, the less it trades. On the contrary, islands tend to trade more than the rest of the
countries, as well as landlocked economies. Regarding per-capita GDP, the results are surprising,
because a negative parameter implies that as countries industrialize, they tend to trade less14. Dummy
variables which reflect common language between the reporter and its partners are all significant and
positive; likewise, dummies for bilateral trade arrangements indicate these are important determinants
of trade. Note, however, that two of the most important Latin American integration pacts (Andean
and CACM) are not significant in either specification. This might reflect the fact that these pacts
never materialized nor had a strong effect on the economies; for example, the "football war" between
16
15 Thoumi (1989) suggests that in the Caribbean case, some borders should not be included as "some adjacent areasare uninhabited, unexploited and are obstacles rather than promoters of trade".
Honduras and El Salvador, the guerrilla movement in Central American countries and other political
problems undermined the CACM integration effort (Moncars and Medal, 1991).
The results for the Caribbean sample shows some interesting deviations from the general case.
The parameter of distance is statistically larger (in absolute terms) than that of the large sample, which
agrees with our presumption that location is an important determinant of trade composition for
Caribbean countries. On the other hand, vicinity has little effect in the small sample case, reflecting
the fact that intra-regional trade is small and also that few countries share borders in the Caribbean
Basin. The relative similarity in terms of size (area) among Caribbean countries, especially when
compared with countries like Brazil or the USA, explains the insignificant parameter found. 15
Another deviation from the general case is the positive and significant sign of the parameter
for the Linder Hypothesis, which implies that Caribbean Basin countries trade with their partners on
the basis of comparative advantages and a different composition of goods, rather than by the
Krugman hypothesis of differentiated goods trade. Finally, some dummy variables proved to be of
little significance (e.g., French language, Lomé convention), which is to be expected when we
consider the situation of the selected Caribbean Basin countries.
The estimation of the general model for the 1986-91 period does not produce significant
differences with that for the period 1980-85, in terms of the sign and size of the parameters as well
as statistical significance; the results are presented in Table 5. In the case of Caribbean Basin
countries, however, some differences arise mostly in the cases of dummy variables, but particularly
in the case of the degree of industrialization which is now non-significant. It is important to note the
stability of the results, particularly in the Caribbean countries case where the economic conditions
17
between the 1980-85 and 1986-91 periods changed dramatically. In the former period, most
Caribbean countries were experiencing a profound crisis as due to the Debt crisis and the structural
adjustment process. On the contrary, the 1986-1991 period has been one of recovery and
consolidation of the reforms. In spite of this very different macroeconomic framework, the estimation
of the model and its simulation for the case of Cuba does not change in a significant way, reflecting
the robustness of gravity models alluded by Deardorff (1984) and other authors.
V. SIMULATION RESULTS
The estimated models for both samples of countries were used to simulate the volume of trade
of Cuba with its potential partners in a free-trade situation. In order to forecast trade patterns,
however, an estimate of Cuba's GDP and population is required; while the latter can be easily
determined, GDP figures in US$ are difficult to obtain (see footnote 5). Nevertheless, the results
proved robust to different estimates. Table 6 presents the results of the predictions of import and
export volumes for each individual country, grouped into standard regional blocks; these predictions
are based on the parameters of the regressions for both the Caribbean Basin countries and the large
sample of countries presented in Table 4 and GDP figures reported in Table 1.
The most important result of the simulation, as expected, is the increase in the share of the
US in both Cuban exports and imports, in response to low transportation costs and the large
differential in size and level of industrialization with Cuba. This result, which is robust across country
samples and simulation periods, can be considered the most likely long-run trade pattern of Cuba after
the embargo is lifted and the economy is opened. The level, however, is to some extent surprising;
the simulated volumes of exports and imports for Cuba resemble more closely the trade pattern of
18
16 Linneman's (1966) reported distance from Cuba to Canada is 1600 miles, to Europe (Spain) is 4,400 miles and toJapan is 14,400 miles.
the Dominican Republic (see Appendix Table 1), than that of the rest of the Caribbean Basin
economies, especially in terms of exports. This is a result of the vicinity with the US, since by size and
per-capita income Cuba does not differ substantially from other Caribbean countries. Note also that
Cuba's predicted trade composition also resembles that of Mexico, which enjoys vicinity with the US.
The increase in the share of the U.S., which becomes a dominant partner in both exports and
imports, is counterbalanced by the decline in the shares of other developed countries, including most
European countries and, especially, Canada and Japan, which reduce their participation to around 1%
and 2% of total trade, respectively. These two countries are good examples of the role of
transportation costs in trade patterns; since by economic size and degree of industrialization they do
not differ markedly from the USA when compared to Cuba, much of the reduction in their share is
due to higher costs arising from the long distance which separates them from Cuba.16 It should be
noted, however, that this result is conditional on the assumption that goods are homogeneous (close
substitutes); under heterogenous goods it is possible that quality differentials might offset reductions
in transportation costs, in the case of countries which export goods that dominate world markets
(e.g., Japanese automobiles).
Although this is the most impressive result, the reordering of trade is also important in the
case of the developing countries. Cuban exports to Latin America should increase as a result of the
reshuffling of exports from other LDCs to the U.S.; on the contrary, Cuban imports from Latin
America, which by 1986-91 reached 25%, should decrease markedly to around 3.5%.
Finally, the reshuffling of Cuban trade poses some threats to the trade structure of other
Caribbean countries. In the event that Cuba were allowed to trade freely in international markets
19
(including the US), Caribbean countries that actually export sugar, tobacco and/or ferro-nickel
minerals would face increased competition from a country possessing similar comparative advantages
and which for the US market, has negligible transportation costs. On the other hand, the simulated
pattern of Cuban imports suggests that other Caribbean countries would not benefit from the opening
of the economy. In fact, Cuba would probably reduce its imports from Latin America and the
Caribbean.
When using any econometric model, one would like to determine the quality of the estimation
by comparing predictions with actual data; this unfortunately cannot be undertaken in the case of
Cuba. In order to give an idea of the accuracy of the gravity model we have simulated the trade
pattern of a country similar to Cuba in size, endowment and location, the Dominican Republic. Table
7 presents the correlation coefficients of actual trade by partner and the corresponding simulated
values; the good quality of the Tobit estimation of the gravity model and the reliability of the results
are apparent, in particular in the case of the Caribbean Basin sample. These satisfactory results allow
us to be confident that simulations for Cuba would not be systematically biased.
20
VI. CONCLUSIONS
This paper presents an econometric evaluation of Cuba's trade structure and its recent trend
towards integration with market economies. The collapse of the CMEA in the early 1990s greatly
affected the socialist barter-trade structure in which Cuba enjoyed an especially favorable treatment
in the form of subsidized exports and oil prices and secured export volumes. The severe downturn
of the Cuban economy, resulting from the acute shortage of foreign currency and the loss of Soviet
subsidies, has forced the government to open the economy to an unprecedented number of activities
traditionally banned, both in the form of joint ventures with foreign capital to develop tourism and
the acceptance of an increasingly important dollarized parallel economy. The traditional productive
sector, however, remained under firm state control.
We use a gravity model to explore the trade structure that would prevail were the
liberalization of the Cuban economy to continue. A comprehensive trade reform would relocate
Cuban imports and exports towards other developed and developing countries and away from East
European economies, to benefit from its comparative advantages and, in particular, from lower
transaction and transportation costs. Assuming that the American embargo is lifted, the model
predicts that a substantial part of imports and exports could be redirected to the US, in view of the
short distance between the two countries and the size of the American market. Furthermore, the
integration of Cuba into international markets will have an important indirect effect on other
Caribbean countries, which will suffer from increased export competition; benefits from the relocation
of Cuban import demand toward its Caribbean neighbors appear to be less important.
We found little evidence that Caribbean Basin economies share different determinants of trade
pattern when compared to a sample of 65 LDCs, although some differences arise to reflect their
21
particular location and endowment. Nevertheless, predictions from this model confirm the general
results and, not surprisingly, assign an even more crucial role to trade with the US. In addition, we
perform estimations of the model in two periods (1980-85 and 1986-1991) in order to control for
transient phenomena, finding little evidence of a distinct trade pattern.
Finally, we use the predictions of the model to analyze whether the evolution of Cuban trade
actually reflects an increasing integration with world markets along the lines suggested by the gravity
model. Comparing the 1980-85 period with the most recent data available (1990-91) we found that
Cuba has modified to some extent its trade structure away from former CMEA countries and in favor
of industrialized and developing countries, but unless the US embargo is lifted, it will continue to
show distorted trade structures and to suffer from excessive transportation and transaction costs.
A word of caution is in place when analyzing these results. As mentioned, the power of
gravity models lies in its ability to predict trade patterns which in general do not conform to
theoretical predictions. To some extent these deviations can be the consequence of extra-economic
elements which have an important effect on trade patterns; for example, the long-run economic ties
of Cuba and countries such as Canada, Spain or Japan may be hard to sever for political reasons, so
that the share of these countries in Cuban trade can remain at levels higher than predicted for a long
period. Likewise, the predicted increase in trade with the US, particularly exports, might not be fully
realized if Cuba cannot obtain access to the American sugar market, which is protected by import
quotas.
22
References
Anuario Estadístico de Cuba (1989). Comité Estatal de Estadística. Havana, Cuba.
Asilis, C. and L. Rivera-Batiz (1994): "Geography, Trade Patterns and Economic Policy", IMFWorking Paper, February.
The Economist Intelligence Unit (1994): Country Report, 1st quarter 1994.
The Economist Intelligence Unit (1993): Country Profile, 1993/1994.
Anderson (1979): "A Theoretical Foundation for the Gravity Model", American EconomicReview, vol. 69, No 1, pp. 106-116.
Bergstrand, J. (1985): "The Gravity Equation in International Trade: Some MicroeconomicFoundations and Empirical Evidence", The Review of Economic and Statistics, vol XX, pp474-481.
Bergstrand, J. (1989): "The Generalized Gravity Equation, Monopolistic Competition, and the FactorProportion Theory in International Trade", Review of Economics and Statistics, pp. 143-153.
Balassa, B. and M. Noland (1988): Japan in the World Economy, Institute for InternationalEconomics, Johns Hopkins University Press.
Blasier, C. (1993): "The End of the Soviet-Cuban Partnership", in Cuba, after the Cold War,Carmelo Mesa-Lago (ed). University of Pittsburgh Press, Pittsburgh.
Brada, J.C. and J.A. Méndez (1985): "Economic Integration among Developed, Developing andCentrally Planned Economies: A Comparative Analysis", Review of Economic and Statistics,vol. 67. pp. 549-556.
Bröcker, J. and H. Rohweder (1991): "Barriers to International Trade: Methods of Measurementand Empirical Results", Annals of Regional Science, vol. 4, pp. 289-304.
Deardorff, A. (1984): "Testing Trade Theories and Predicting Trade Flows", in Handbook ofInternational Economics, vol I, R. Jones and P. Kenen (eds.), North Holland, Amsterdam.
Docclo, S. (1993): "Analyse des flux de marchandises en Belgique", Cahiers Economiques deBruxelles, # 138, deuxieme trimestre 1993, pp. 217-247.
Eaton, J. and A. Tamura (1994): "Bilateralism and Regionalism in Japanese and US Trade andForeign Direct Investment", NBER Working Paper #4758, June.
Fitzpatrick, J. (1984): "The Geographical Pattern of Irish Foreign Trade: Test of a GravityModel", The Economic and Social Review, vol 16, No 1, pp. 19-30.
23
Foroutan, F; C. Montenegro and L. Pritchett (1994): "South Africa's Pattern of Bilateral Trade",mimeo, The World Bank.
Frankel, J; E. Stein and S. Wei (1994): "Trading Blocs: The Natural, the Unnatural and theSuper-Natural", Journal of Developing Economics, forthcoming.
Geraci, V. and W. Prewo (1977): "Bilateral Trade Flows and Transportation Costs", Review ofEconomics and Statistics, vol. 54, pp. 67-74
Havrylyshyn O. and Pritchett L. (1991): "European Trade Patterns After the Transition", PRDWorking Paper Series # 748, World Bank.
Leamer, E., (1984): Sources of International Comparatives Advantage: Theory and Evidence.Cambridge, Mass.: MIT Press.
Linder, S. (1961): An Essay on Trade and Transformation, John Wiley and Sons, New York.
Linneman, H. (1966): An Econometric Study of International Trade Flows. North Holland,Amsterdam.
Mesa-Lago, Carmelo (1993a): "Cuba and the Downfall of Soviet and East European Socialism",in Cuba, after the Cold War, Carmelo Mesa-Lago (ed). University of Pittsburgh Press,Pittsburgh.
Mesa-Lago, Carmelo (1993b): "Cuba's Economic Policies and Strategies Confronting the Crisis"in Cuba, after the Cold War, Carmelo Mesa-Lago (ed). University of Pittsburgh Press,Pittsburgh.
Mesa-Lago, Carmelo (1994): "Cuba: A Unique Case of Anti-Market Reform" in RethinkingCapitalism, A. Solimano, O. Sunkel and M. I. Blejer (eds.) University of Michigan Press,Ann Arbor.
Moncars, Raúl and Medal, L. José (1991): "Una Nota sobre Integración Económica y Estrategias deDesarrollo en Latinoamérica", Cuadernos de Economía # 84, pp. 347-354.
Oguledo, V. I. and Macphee C. R. (1994): "Gravity Models: a reformulation and an application todiscriminatory trade arrangements", Applied Economics, vol. 26, pp. 107-120.
Pöyhönen, P. (1963): "A Tentative Model for the Flows of Trade Between Countries", Weltwirtschaftliches Archiv, vol 90, No. 1.
Preeg, E (1993): Cuba and the New Caribbean Economic Order, Significant Issues Series VolXV, No 2. Center for Strategic and International Studies.
24
Sanso, M; R. Cuairan and F. Sanz (1993): ""Bilateral Trade Flows, the Gravity Equation andFunctional Form", The Review of Economic and Statistics, vol. XX, pp 266-275.
Sapir, A. (1981): "Trade Benefits under the EEC Generalized System of Preferences", EuropeanEconomic Review, vol 15, pp. 339-355.
Sen, A. Z. Matuszewski (1991): "Properties of Maximum Likelihood Estimates of Gravity ModelParameters" Journal of Regional Science, vol 31, No 4, pp. 460-486.
Slama, J. (1983): "Gravity Model and its Estimation for International Flows of EngineeringProducts, Chemicals and Patent Applications", Acta Oeconomica, vol. 30, pp. 241-253.
Thoumi, F. (1989): "Trade Flows and Economic Integration Among the LCDs of the CaribbeanBasin", Social and Economic Studies, vol. 38, No. 2.
Tinbergen, J. (1962): Shaping the World Economy: Suggestions for an International EconomicPolicy, The Twentieth Century Fund, New York.
Treffler, D. (1993): "International Factor Prices Differences: Leontief was Right!", Journal ofPolitical Economy, vol. 101, no. 6, pags. 961-987.
World Bank (1990): World Tables, 1989-90 Edition, Johns Hopkins University Press, Washington,D.C.
25
APPENDIXDATA SOURCES AND COVERAGE
Country Sample
The econometric section uses a sample of 101 market economies for which annual importsin 1980 were more than US$ 300 million; socialist economies were excluded; these 101 countriesconstitute the group of partners countries. Regarding the group of reporters, we excluded 35countries from the sample, for which it was deemed that trade determinants differ markedly from thatof the developing countries; among these countries are developed countries, most oil exporters aswell as economies which for special circumstances have distorted trade patterns (Israel) or for whichtrade reports are inaccurate (South Africa). The complete list of countries is:
Countries which are reporter and partners:
Angola, Argentina, Benin, Bangladesh, Bolivia, Brazil, Burundi, Chile, Cote d'Ivoire, Cameroon,Congo, Colombia, Costa Rica, Dominican Republic, Egypt, El Salvador, Ethiopia, Ghana, Guatemala,Honduras, Haiti, India, Indonesia, Jamaica, Jordan, Kenya, Korea, Lebanon, Liberia, Madagascar,Malaysia, Malawi, Mexico, Mauritania, Mauritius, Morocco, Mozambique, Myanmar, Nicaragua,Niger, Pakistan, Panama, Peru, Philippines, Papua New Guinea, Paraguay, Senegal, Somalia, SriLanka, Sudan, Syria, Taiwan, Tanzania, Togo, Thailand, Trinidad and Tobago, Tunisia, Turkey,Uganda, Uruguay, Venezuela, Yemen, Zaire, Zambia, Zimbabwe.
Countries which are only partners:
Algeria, Australia, Austria, Belgium-Luxembourg, Canada, Denmark, Ecuador, Finland, France,Gabon, Germany, Greece, Hong Kong, Iran, Iraq, Ireland, Israel, Italy, Japan, Kuwait, Libya,Netherlands, Nigeria, Norway, New Zealand, Oman, Portugal, Saudi Arabia, Singapore, SouthAfrica, Spain, Sweden, Switzerland, United Arab Emirates, United Kingdom, USA.
Definition of the Variables
Mij, Xi
j corresponds to the dollar value of non-fuel imports or exports between each reporter andpartner country. The data was obtained from the UNSO COMTRADE database.
GDP (in current US$) and population was obtained from the World Bank BESD data set.
DISTANCEij is the distance between the reporter and the partner, in miles. It does not correspond
to straight distances between capitals, but to the most probable trade center (point of entrance). Thedata were taken from Linemann (1966).
AREA corresponds to land area in thousands of square miles.
26
LANDLOCKEDi,j is a dummy variable which takes value 1 if the reporter or the partner is landlockedand zero otherwise.
BORDERij is a dummy variable which takes value 1 if the reporter and the partner share a border and
0 otherwise.
LINDERij is the absolute value of the difference in per-capita GDP between the reporter and the
partner.
LANGijk is a dummy variable which takes value 1 if the reporter and partner share the same language.
Dummy variables were included for English, Spanish, French, Arabic and Portuguese.
T.A.ij is a dummy variable equal to 1 if the reporter and the partner belong to a preferential trading
agreement (bilateral or multilateral). T.A. includes (depending on the country sample) dummies forASEAN, ANDEAN, LAFTA, CEAO, CACM and the Lomé convention.
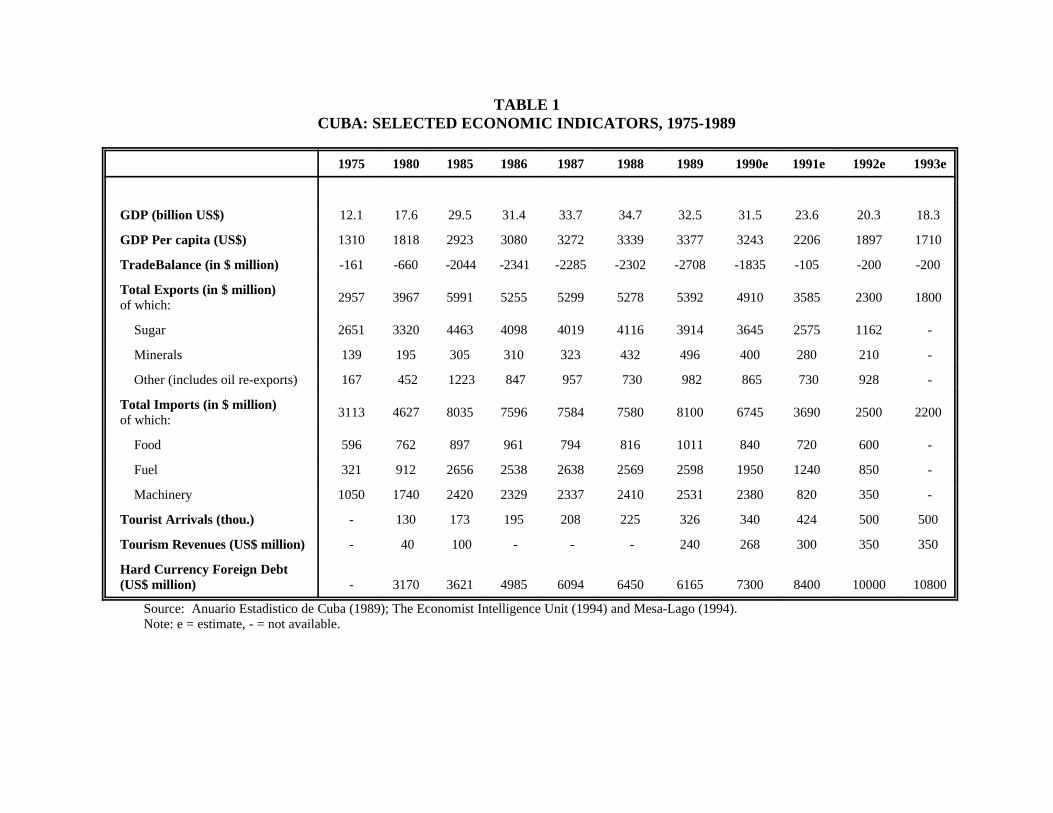
TABLE 1CUBA: SELECTED ECONOMIC INDICATORS, 1975-1989
1975 1980 1985 1986 1987 1988 1989 1990e 1991e 1992e 1993e
GDP (billion US$) 12.1 17.6 29.5 31.4 33.7 34.7 32.5 31.5 23.6 20.3 18.3
GDP Per capita (US$) 1310 1818 2923 3080 3272 3339 3377 3243 2206 1897 1710
Trade Balance (in $ million) -161 -660 -2044 -2341 -2285 -2302 -2708 -1835 -105 -200 -200
Total Exports (in $ million)of which:
2957 3967 5991 5255 5299 5278 5392 4910 3585 2300 1800
Sugar 2651 3320 4463 4098 4019 4116 3914 3645 2575 1162 -
Minerals 139 195 305 310 323 432 496 400 280 210 -
Other (includes oil re-exports) 167 452 1223 847 957 730 982 865 730 928 -
Total Imports (in $ million)of which:
3113 4627 8035 7596 7584 7580 8100 6745 3690 2500 2200
Food 596 762 897 961 794 816 1011 840 720 600 -
Fuel 321 912 2656 2538 2638 2569 2598 1950 1240 850 -
Machinery 1050 1740 2420 2329 2337 2410 2531 2380 820 350 -
Tourist Arrivals (thou.) - 130 173 195 208 225 326 340 424 500 500
Tourism Revenues (US$ million) - 40 100 - - - 240 268 300 350 350
Hard Currency Foreign Debt(US$ million) - 3170 3621 4985 6094 6450 6165 7300 8400 10000 10800
Source: Anuario Estadistico de Cuba (1989); The Economist Intelligence Unit (1994) and Mesa-Lago (1994).Note: e = estimate, - = not available.

TABLE 2CUBA: COMPOSITION OF TRADE BY REGIONAL BLOCKS
(percent)
1958 1965 1970 1975 1980 1985 1989
Total Exports 100.0 100.0 100.0 100.0 100.0 100.0 100.0
Socialist Economies 2.9 77.7 74.1 67.8 70.2 89.0 83.2
USSR 2.1 46.7 50.4 56.3 56.8 74.8 66.7
other CMEA countries 0.1 14.4 14.6 7.9 10.4 11.3 11.0
other socialist economies 0.7 15.6 9.1 3.7 3.1 2.9 5.5
Industrialized Economies 91.1 15.5 21.4 26.1 13.9 8.2 12.3
Developing Countries 6.0 6.8 4.6 6.1 15.8 2.8 4.5
Total Imports 100.0 100.0 100.0 100.0 100.0 100.0 100.0
Socialist Economies 0.3 76.1 69.9 51.6 78.1 84.3 81.7
USSR 0.2 49.5 52.7 40.2 62.8 67.4 70.8
other CMEA countries 0.1 11.5 10.5 8.0 7.3 13.4 8.1
other socialist economies 0.0 15.1 6.8 3.3 2.6 3.4 2.8
Industrialized Economies 86.7 19.2 28.2 41.7 19.5 11.3 10.1
Developing Economies 13.0 4.7 1.8 6.7 2.4 4.4 8.2
Source: Anuario Estadistico de Cuba (1989).
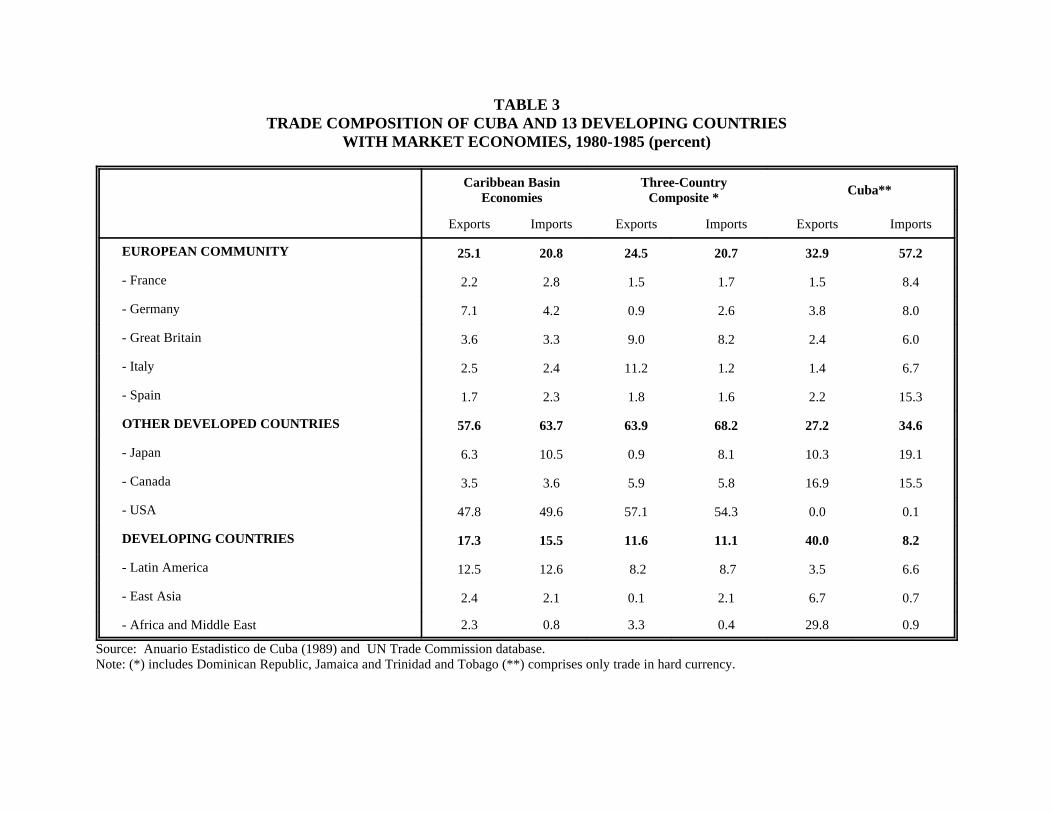
TABLE 3TRADE COMPOSITION OF CUBA AND 13 DEVELOPING COUNTRIES
WITH MARKET ECONOMIES, 1980-1985 (percent)
Caribbean BasinEconomies
Three-CountryComposite * Cuba**
Exports Imports Exports Imports Exports Imports
EUROPEAN COMMUNITY 25.1 20.8 24.5 20.7 32.9 57.2
- France 2.2 2.8 1.5 1.7 1.5 8.4
- Germany 7.1 4.2 0.9 2.6 3.8 8.0
- Great Britain 3.6 3.3 9.0 8.2 2.4 6.0
- Italy 2.5 2.4 11.2 1.2 1.4 6.7
- Spain 1.7 2.3 1.8 1.6 2.2 15.3
OTHER DEVELOPED COUNTRIES 57.6 63.7 63.9 68.2 27.2 34.6
- Japan 6.3 10.5 0.9 8.1 10.3 19.1
- Canada 3.5 3.6 5.9 5.8 16.9 15.5
- USA 47.8 49.6 57.1 54.3 0.0 0.1
DEVELOPING COUNTRIES 17.3 15.5 11.6 11.1 40.0 8.2
- Latin America 12.5 12.6 8.2 8.7 3.5 6.6
- East Asia 2.4 2.1 0.1 2.1 6.7 0.7
- Africa and Middle East 2.3 0.8 3.3 0.4 29.8 0.9
Source: Anuario Estadistico de Cuba (1989) and UN Trade Commission database.Note: (*) includes Dominican Republic, Jamaica and Trinidad and Tobago (**) comprises only trade in hard currency.
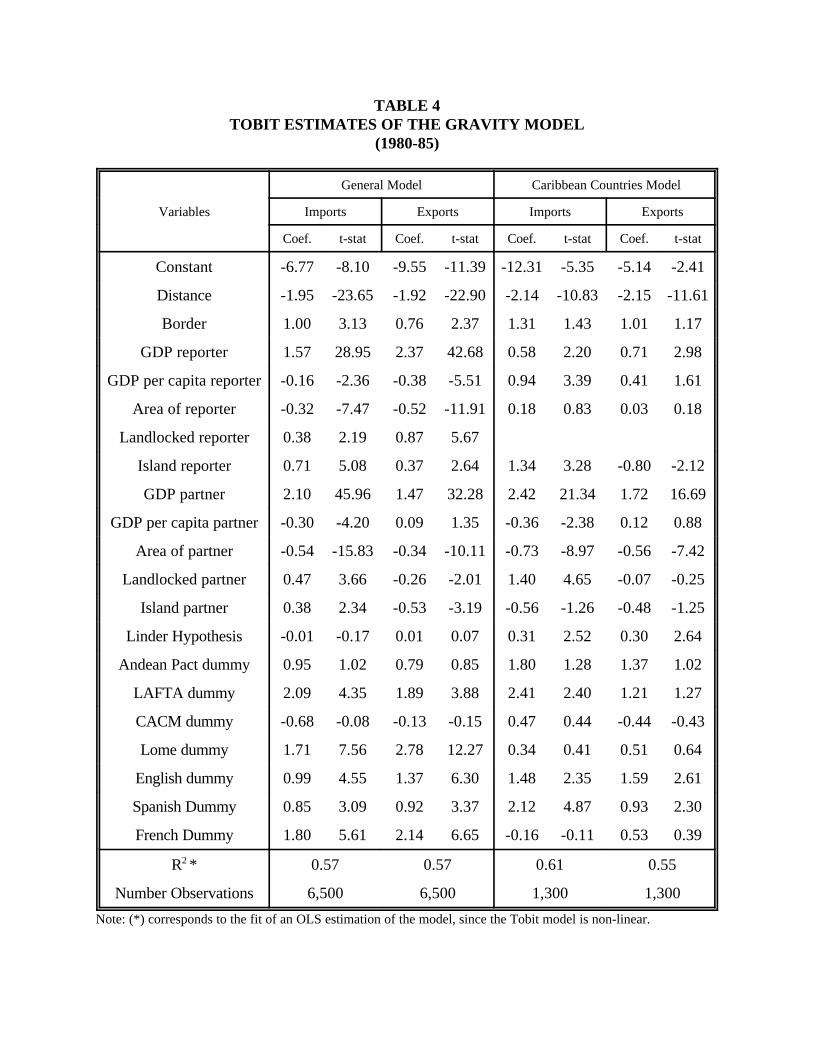
TABLE 4TOBIT ESTIMATES OF THE GRAVITY MODEL
(1980-85)
General Model Caribbean Countries Model
Variables Imports Exports Imports Exports
Coef. t-stat Coef. t-stat Coef. t-stat Coef. t-stat
Constant -6.77 -8.10 -9.55 -11.39 -12.31 -5.35 -5.14 -2.41
Distance -1.95 -23.65 -1.92 -22.90 -2.14 -10.83 -2.15 -11.61
Border 1.00 3.13 0.76 2.37 1.31 1.43 1.01 1.17
GDP reporter 1.57 28.95 2.37 42.68 0.58 2.20 0.71 2.98
GDP per capita reporter -0.16 -2.36 -0.38 -5.51 0.94 3.39 0.41 1.61
Area of reporter -0.32 -7.47 -0.52 -11.91 0.18 0.83 0.03 0.18
Landlocked reporter 0.38 2.19 0.87 5.67
Island reporter 0.71 5.08 0.37 2.64 1.34 3.28 -0.80 -2.12
GDP partner 2.10 45.96 1.47 32.28 2.42 21.34 1.72 16.69
GDP per capita partner -0.30 -4.20 0.09 1.35 -0.36 -2.38 0.12 0.88
Area of partner -0.54 -15.83 -0.34 -10.11 -0.73 -8.97 -0.56 -7.42
Landlocked partner 0.47 3.66 -0.26 -2.01 1.40 4.65 -0.07 -0.25
Island partner 0.38 2.34 -0.53 -3.19 -0.56 -1.26 -0.48 -1.25
Linder Hypothesis -0.01 -0.17 0.01 0.07 0.31 2.52 0.30 2.64
Andean Pact dummy 0.95 1.02 0.79 0.85 1.80 1.28 1.37 1.02
LAFTA dummy 2.09 4.35 1.89 3.88 2.41 2.40 1.21 1.27
CACM dummy -0.68 -0.08 -0.13 -0.15 0.47 0.44 -0.44 -0.43
Lome dummy 1.71 7.56 2.78 12.27 0.34 0.41 0.51 0.64
English dummy 0.99 4.55 1.37 6.30 1.48 2.35 1.59 2.61
Spanish Dummy 0.85 3.09 0.92 3.37 2.12 4.87 0.93 2.30
French Dummy 1.80 5.61 2.14 6.65 -0.16 -0.11 0.53 0.39
R2 * 0.57 0.57 0.61 0.55
Number Observations 6,500 6,500 1,300 1,300
Note: (*) corresponds to the fit of an OLS estimation of the model, since the Tobit model is non-linear.
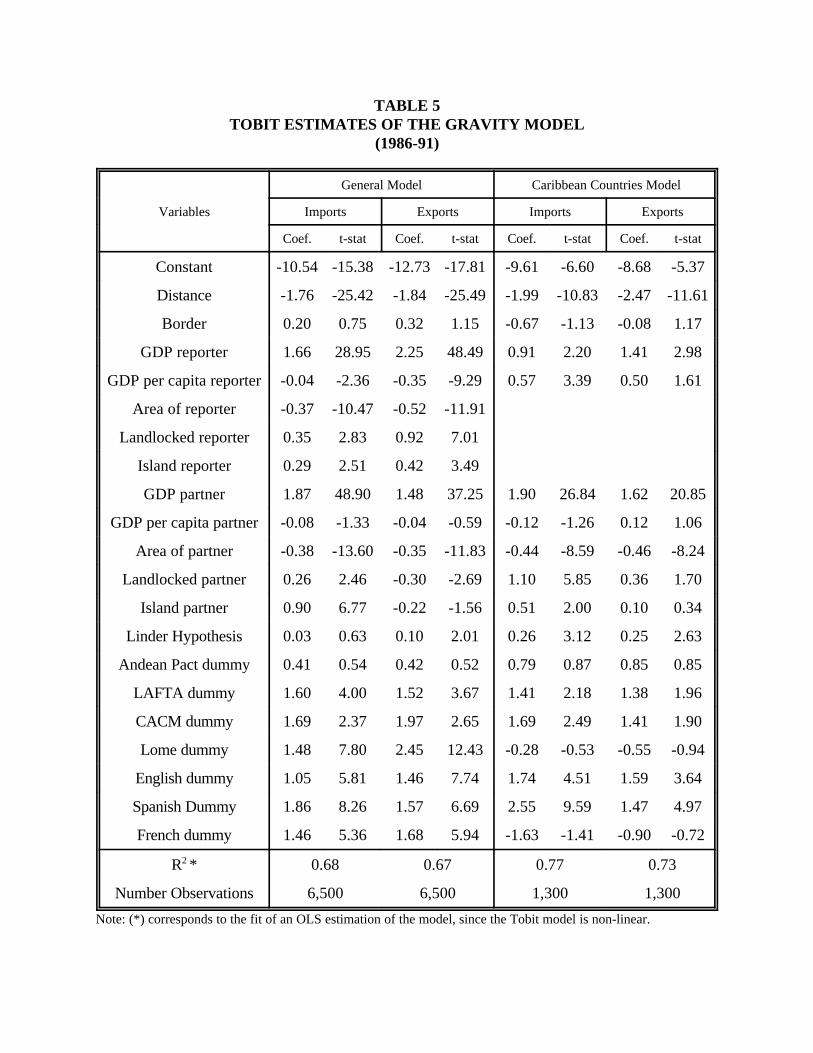
TABLE 5TOBIT ESTIMATES OF THE GRAVITY MODEL
(1986-91)
General Model Caribbean Countries Model
Variables Imports Exports Imports Exports
Coef. t-stat Coef. t-stat Coef. t-stat Coef. t-stat
Constant -10.54 -15.38 -12.73 -17.81 -9.61 -6.60 -8.68 -5.37
Distance -1.76 -25.42 -1.84 -25.49 -1.99 -10.83 -2.47 -11.61
Border 0.20 0.75 0.32 1.15 -0.67 -1.13 -0.08 1.17
GDP reporter 1.66 28.95 2.25 48.49 0.91 2.20 1.41 2.98
GDP per capita reporter -0.04 -2.36 -0.35 -9.29 0.57 3.39 0.50 1.61
Area of reporter -0.37 -10.47 -0.52 -11.91
Landlocked reporter 0.35 2.83 0.92 7.01
Island reporter 0.29 2.51 0.42 3.49
GDP partner 1.87 48.90 1.48 37.25 1.90 26.84 1.62 20.85
GDP per capita partner -0.08 -1.33 -0.04 -0.59 -0.12 -1.26 0.12 1.06
Area of partner -0.38 -13.60 -0.35 -11.83 -0.44 -8.59 -0.46 -8.24
Landlocked partner 0.26 2.46 -0.30 -2.69 1.10 5.85 0.36 1.70
Island partner 0.90 6.77 -0.22 -1.56 0.51 2.00 0.10 0.34
Linder Hypothesis 0.03 0.63 0.10 2.01 0.26 3.12 0.25 2.63
Andean Pact dummy 0.41 0.54 0.42 0.52 0.79 0.87 0.85 0.85
LAFTA dummy 1.60 4.00 1.52 3.67 1.41 2.18 1.38 1.96
CACM dummy 1.69 2.37 1.97 2.65 1.69 2.49 1.41 1.90
Lome dummy 1.48 7.80 2.45 12.43 -0.28 -0.53 -0.55 -0.94
English dummy 1.05 5.81 1.46 7.74 1.74 4.51 1.59 3.64
Spanish Dummy 1.86 8.26 1.57 6.69 2.55 9.59 1.47 4.97
French dummy 1.46 5.36 1.68 5.94 -1.63 -1.41 -0.90 -0.72
R2 * 0.68 0.67 0.77 0.73
Number Observations 6,500 6,500 1,300 1,300
Note: (*) corresponds to the fit of an OLS estimation of the model, since the Tobit model is non-linear.
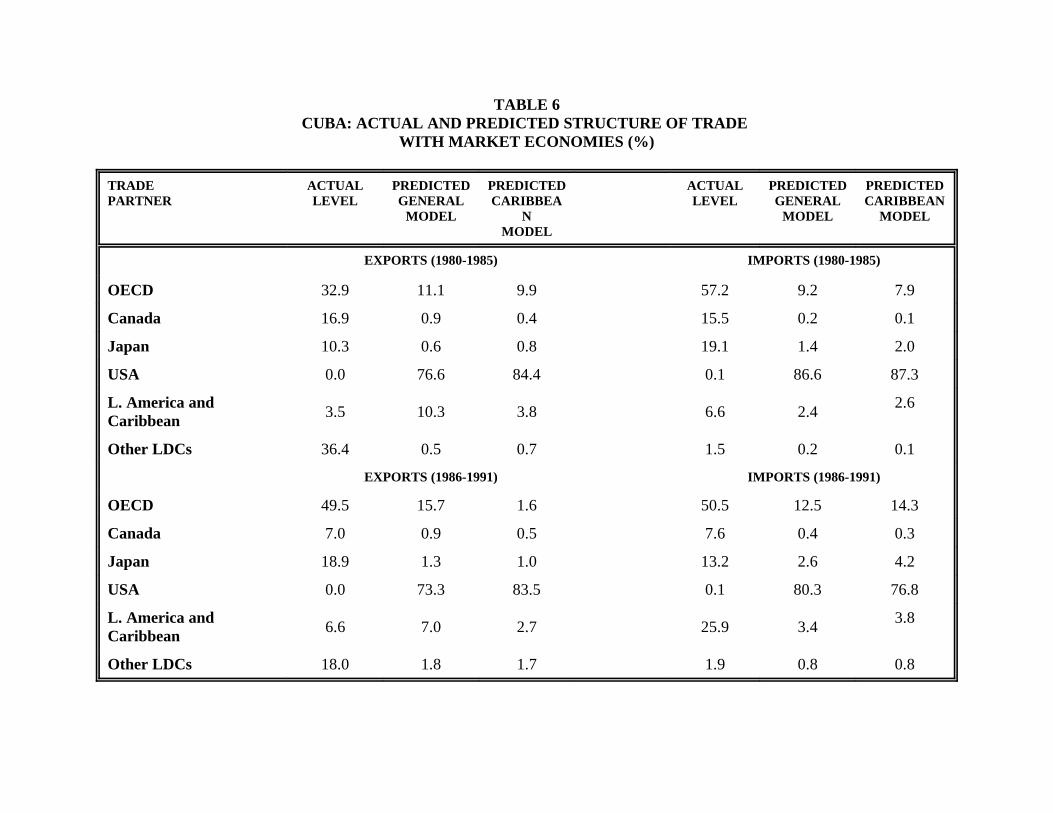
TABLE 6CUBA: ACTUAL AND PREDICTED STRUCTURE OF TRADE
WITH MARKET ECONOMIES (%)
TRADEPARTNER
ACTUALLEVEL
PREDICTEDGENERAL
MODEL
PREDICTEDCARIBBEA
NMODEL
ACTUALLEVEL
PREDICTEDGENERAL
MODEL
PREDICTEDCARIBBEAN
MODEL
EXPORTS (1980-1985) IMPORTS (1980-1985)
OECD 32.9 11.1 9.9 57.2 9.2 7.9
Canada 16.9 0.9 0.4 15.5 0.2 0.1
Japan 10.3 0.6 0.8 19.1 1.4 2.0
USA 0.0 76.6 84.4 0.1 86.6 87.3
L. America andCaribbean
3.5 10.3 3.8 6.6 2.42.6
Other LDCs 36.4 0.5 0.7 1.5 0.2 0.1
EXPORTS (1986-1991) IMPORTS (1986-1991)
OECD 49.5 15.7 1.6 50.5 12.5 14.3
Canada 7.0 0.9 0.5 7.6 0.4 0.3
Japan 18.9 1.3 1.0 13.2 2.6 4.2
USA 0.0 73.3 83.5 0.1 80.3 76.8
L. America andCaribbean
6.6 7.0 2.7 25.9 3.43.8
Other LDCs 18.0 1.8 1.7 1.9 0.8 0.8
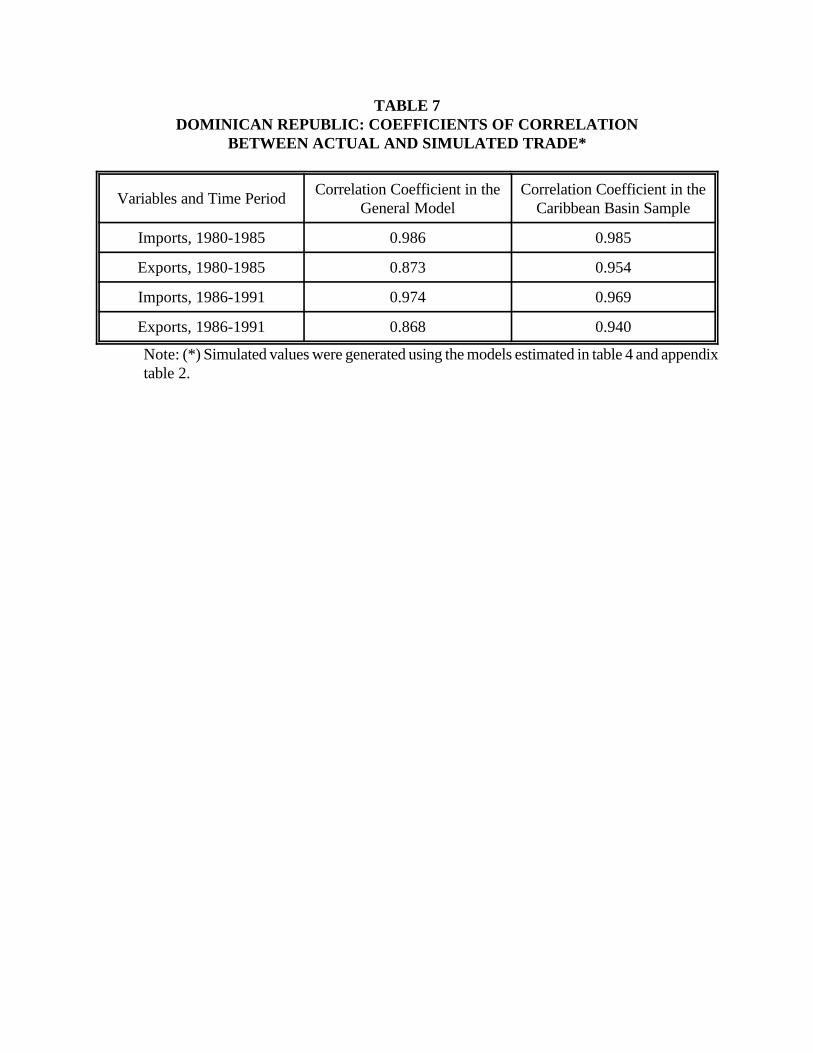
TABLE 7DOMINICAN REPUBLIC: COEFFICIENTS OF CORRELATION
BETWEEN ACTUAL AND SIMULATED TRADE*
Variables and Time PeriodCorrelation Coefficient in the
General ModelCorrelation Coefficient in the
Caribbean Basin Sample
Imports, 1980-1985 0.986 0.985
Exports, 1980-1985 0.873 0.954
Imports, 1986-1991 0.974 0.969
Exports, 1986-1991 0.868 0.940
Note: (*) Simulated values were generated using the models estimated in table 4 and appendixtable 2.
APPENDIX TABLE 1TRADE STRUCTURE OF CARIBBEAN BASIN COUNTRIES
Panel A: Exports Composition, 1980-1985 (%)
Cuba*VenezuelaTrinidadElPanamaNicaraguaMexicoJamaicaHaitiHondurasGuatemalaDominicanCostaColombiaTobbagoSalvadorRepublicRica
32.915.733.629.129.934.98.432.412.924.522.07.429.945.6European Community1.51.03.81.80.88.10.90.04.81.31.70.71.72.2- France3.81.11.320.87.010.62.50.72.48.16.20.710.620.9- Germany2.40.512.50.40.60.92.520.30.61.51.30.92.31.9- Great Brittain1.41.92.11.34.04.10.60.03.43.45.20.64.01.9- Italy2.21.31.61.90.84.91.01.30.22.80.42.40.73.1- Spain27.259.451.358.732.757.683.355.069.967.343.785.449.935.1Other Developed Countries10.324.40.35.46.320.64.31.00.46.55.61.40.74.9- Japan16.90.94.02.91.88.63.012.21.83.11.61.52.81.3- Canada0.034.047.050.424.628.576.041.967.857.736.482.546.328.9- USA40.024.915.112.237.47.58.212.517.28.234.37.220.319.3Developing Countries3.514.410.911.724.45.85.27.94.57.528.75.819.017.1- Latin America0.00.81.50.02.30.01.30.51.60.00.10.20.00.2 - Brazil1.40.25.80.00.00.00.00.00.00.01.20.00.00.4 - Mexico0.10.11.00.010.30.00.41.40.10.40.14.60.17.5 - Venezuela6.78.70.30.48.71.41.40.09.20.10.70.10.20.4- East Asia29.81.83.90.14.30.31.74.63.40.54.91.31.01.8- Africa
Panel B: Imports Composition, 1980-1985 (%)
Cuba*VenezuelaTrinidadElPanamaNicaraguaMexicoJamaicaHaitiHondurasGuatemalaDominicanCostaColombiaTobbagoSalvadorRepublicRica
57.225.526.116.118.732.418.421.113.319.421.314.817.526.3European Community8.43.72.21.71.56.62.71.23.93.02.51.62.13.8- France8.05.32.14.71.84.85.42.72.43.76.73.05.27.0- Germany6.02.612.81.50.91.81.910.11.32.31.91.61.62.7- Great Brittain6.74.91.51.43.63.82.40.71.72.51.61.42.82.6- Italy15.32.80.41.61.66.02.10.20.32.03.34.12.53.1- Spain34.660.362.660.761.341.077.170.682.166.455.371.462.856.3Other Developed Countries19.17.910.75.548.13.65.96.15.87.77.77.48.512.1- Japan15.54.76.62.00.64.12.37.64.22.81.93.12.34.2- Canada0.147.745.353.212.633.468.956.972.155.845.760.852.040.0- USA8.214.111.323.220.126.64.68.34.614.323.413.819.817.4Developing Countries6.611.77.321.85.024.73.36.12.612.422.012.618.016.0- Latin America0.04.61.80.50.83.31.81.20.82.01.01.91.64.1 - Brazil3.10.02.12.70.00.00.00.70.10.84.22.91.01.6 - Mexico0.20.10.50.11.00.20.10.50.00.00.36.10.32.2 - Venezuela0.71.53.41.010.21.10.61.91.81.41.10.91.50.6- East Asia0.90.90.60.54.80.70.60.30.20.40.30.20.20.8- Africa
Source: UN Trade Commission data tapes.Note: * considers only trade with market economies.
Recommended