NAMIBIA, July 2013
N a m i b i a R e d C r o s s S o c i e t y
Household Food Security Assessment
ii
This assessment was made possible through the technical and financial support of the British Red Cross.
Assessment teams
All regions:
Sophia Dunn – Food Security and Livelihood Consultant – Team Leader
Hilma Kambunda – Monitoring and Evaluation Office – Namibia Red Cross Society
Shali Naukushu – Regional Manager, Oshikoto Region – Namibia Red Cross Society
Kunene:
Robie Uapingeno, Sostenes Maundu, Johannes Shilihuleni, Pelè Mbinge Mausorahi, Tuaondja Mbinge, Uaereke Ndunge, Mbinge Kahijakune, Vejamuavi Kavetu
Oshikoto:
Kuumbwa Rakkel, Nakanduungile Onesmus, Israel Mw. Hangulu, Fillemon
Kavango:
Mende Adelhaids, Olavi Sirka, Rufinius Nyangula, Karupu Haingura, Tobias Philip Janipho
Report written by Sophia Dunn ([email protected]).
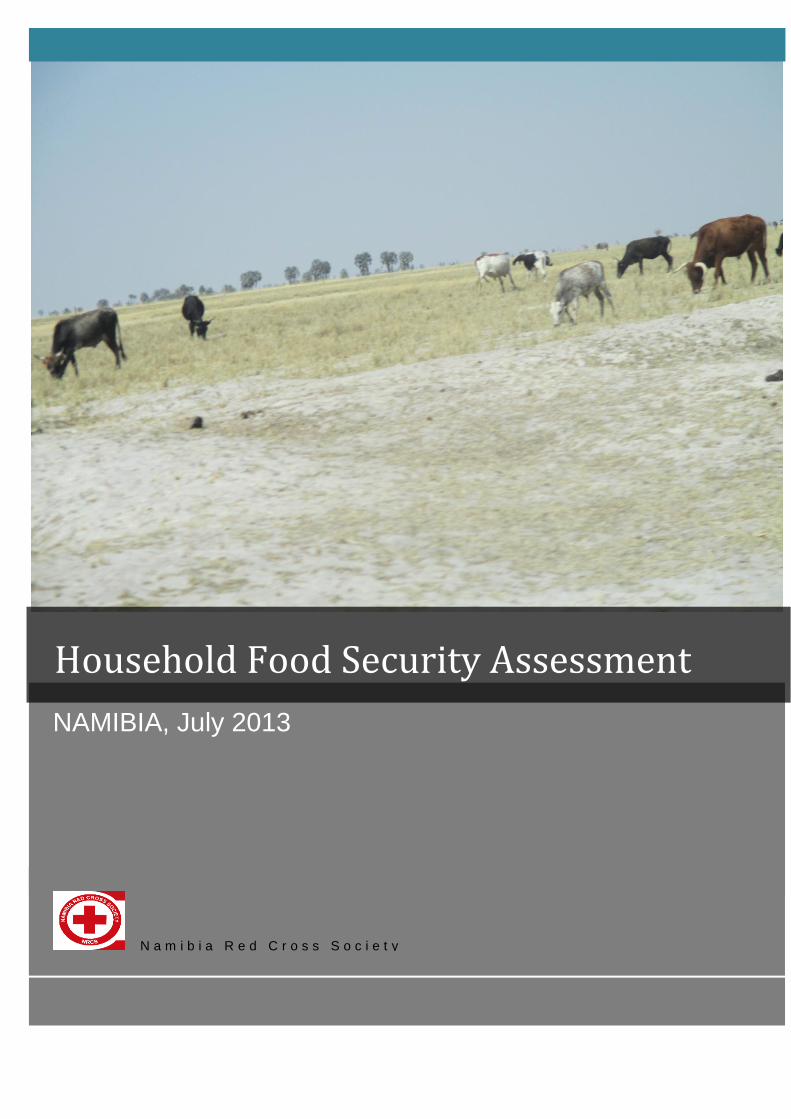
Cover photo: Cattle post – Olukonda, Oshikoto Region
Credit: Sophia Dunn
Acronyms
ADC Agricultural Development Centre
ART Anti-retroviral Therapy
BRCS British Red Cross Society
CMAM Community-based Management of Acute Malnutrition
ELCIN Evangelical Lutheran Church in Namibia
ELCRN Evangelical Lutheran Church in Republic of Namibia
GRN Government of the Republic of Namibia
HH Household
HIV Human Immunodeficiency Virus
LLH Livelihood
LWF Lutheran World Federation
NRCS Namibia Red Cross Society
OPM Office of the Prime Minister
UNFPA United Nations Population Fund
UNICEF United Nations Children’s Fund
UNOCHA United Nations Office for the Coordination of Humanitarian Affairs
US United States
WFP (United Nations) World Food Program
iv
Table of contents
Key Statistics ................................................................................................................................. 7
1. Executive summary ............................................................................................................. 12
2. Background of Namibia ...................................................................................................... 15
3. Introduction to the assessment ......................................................................................... 15
4. Assessment methodology .................................................................................................. 16
5. Assessment findings ........................................................................................................... 20
KUNENE REGION ..................................................................................................................... 20
Locations visited ..................................................................................................................... 21
Summary of characteristics of wealth groups ........................................................................ 21
Impact of the drought ............................................................................................................. 22
Seasonal calendar .................................................................................................................. 22
Sources of income & food ...................................................................................................... 23
Source of water ...................................................................................................................... 25
Impact of the drought ............................................................................................................. 26
Coping strategies ................................................................................................................... 26
Assistance received ............................................................................................................... 32
Market functioning and price .................................................................................................. 32
Summary of the main findings: ............................................................................................... 34
Recommended interventions.................................................................................................. 35
OSHIKOTO REGION ................................................................................................................. 37
Locations visited ..................................................................................................................... 38
Summary of characteristics of wealth groups ........................................................................ 38
Crop production ...................................................................................................................... 39
Crop storage ........................................................................................................................... 39
Livestock disease ................................................................................................................... 39
Livestock pasture ................................................................................................................... 39
Water availability .................................................................................................................... 39
Seasonal calendar .................................................................................................................. 39
Source of water ...................................................................................................................... 43
Impact of the drought ............................................................................................................. 43
Coping strategies ................................................................................................................... 43
Assistance received ............................................................................................................... 44
Market functioning and price .................................................................................................. 44
Summary of the main findings ................................................................................................ 45
Recommended interventions.................................................................................................. 45
KAVANGO REGION ................................................................................................................. 46
Locations visited ..................................................................................................................... 46
Summary of characteristics of wealth groups ........................................................................ 46
Crop production ...................................................................................................................... 48
Crop storage ........................................................................................................................... 48
Livestock disease ................................................................................................................... 48
Livestock pasture ................................................................................................................... 48
Water availability .................................................................................................................... 48
Seasonal calendar .................................................................................................................. 48
v
Source of water ...................................................................................................................... 51
Impact of the drought ............................................................................................................. 51
Coping strategies ................................................................................................................... 52
Market functioning and price .................................................................................................. 52
Recommended interventions.................................................................................................. 53
6. Humanitarian/development stakeholders ......................................................................... 55
Government assistance .......................................................................................................... 55
Assistance available to farmers (ongoing) ....................................................................... 55
New government assistance (drought responses)........................................................... 56
7. Summary and conclusions ................................................................................................. 56
8. Annexes ................................................................................................................................ 58
List of Tables
Table 1: Summary of drought impact in each assessed region .................................................... 13
Table 2: Summary of coping strategies by region ......................................................................... 13
Table 3: Summary of market price data and income gap by region .............................................. 13
Table 4: Food items priced ............................................................................................................ 18
Table 5: Non-food items priced ..................................................................................................... 19
Table 6: Caloric value of the food component of the minimum expenditure basket ..................... 19
Table 7: Cost of basket of food and non-food items in each visited location - Kunene ................ 33
Table 8: Cost of basket of food and non-food items in each visited location – Oshikoto .............. 44
Table 9: Cost of basket of food and non-food items in each visited location – Kavango .............. 53
vi
List of Figures Figure 1: Map of Namibia ................................................................................................................ 7
Figure 2: Emergency Food Security Assessment Area - 2013 ....................................................... 9
Figure 3: Drought affected regions, Namibia – July 2013 ............................................................. 10
Figure 4: Livelihood zones map, Namibia ..................................................................................... 11
Figure 5: The assessment process in each region........................................................................ 17
Figure 6: Seasonal calendar – Kunene Region ............................................................................. 23
Figure 7: Seasonal calendar – Oshikoto Region ........................................................................... 40
Figure 8: Seasonal calendar – Kavango Region ........................................................................... 48
List of Annexes
Annex 1: Assessment timeline ..................................................................................................... 58
Annex 2: Community focus group discussion guide ...................................................................... 60
Annex 3: Wealth group focus group guide .................................................................................... 65
Annex 4: Market price collection tool ............................................................................................. 70
Annex 5: Household interview ....................................................................................................... 72
Annex 6: Summary of characteristics of households in each assessed region ........................... 78
7
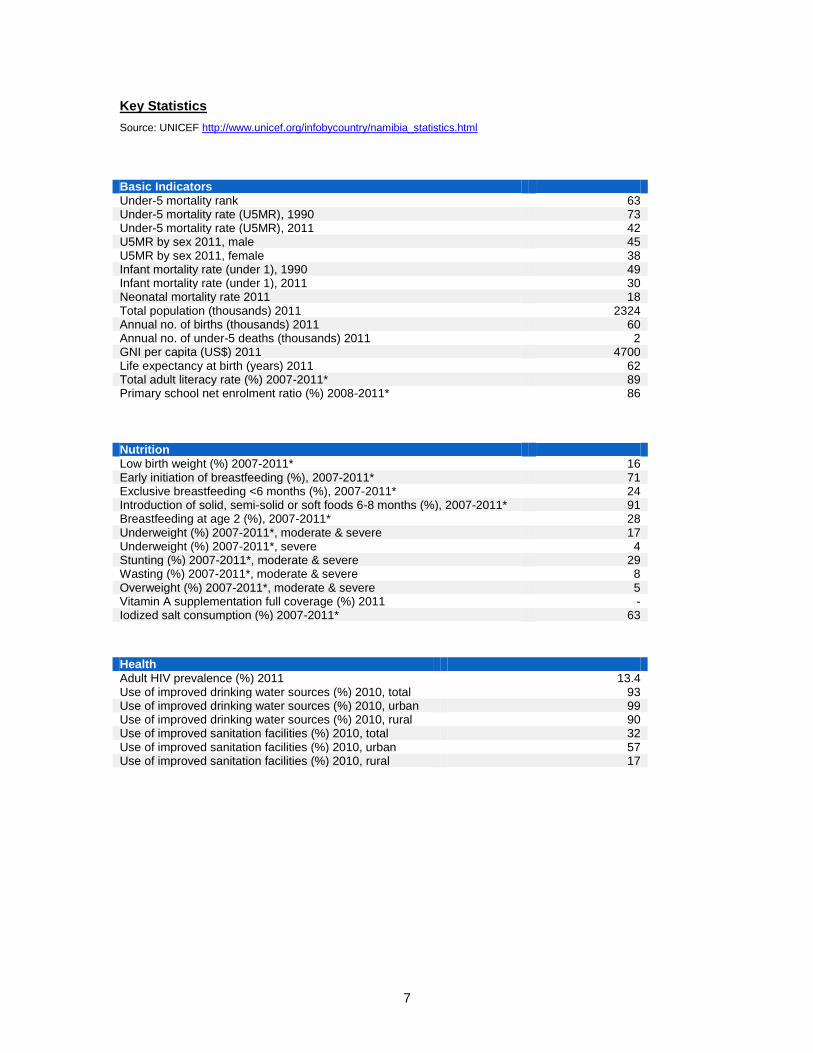
Key Statistics
Source: UNICEF http://www.unicef.org/infobycountry/namibia_statistics.html
Basic Indicators Under-5 mortality rank 63 Under-5 mortality rate (U5MR), 1990 73 Under-5 mortality rate (U5MR), 2011 42 U5MR by sex 2011, male 45 U5MR by sex 2011, female 38 Infant mortality rate (under 1), 1990 49 Infant mortality rate (under 1), 2011 30 Neonatal mortality rate 2011 18 Total population (thousands) 2011 2324 Annual no. of births (thousands) 2011 60 Annual no. of under-5 deaths (thousands) 2011 2 GNI per capita (US$) 2011 4700 Life expectancy at birth (years) 2011 62 Total adult literacy rate (%) 2007-2011* 89 Primary school net enrolment ratio (%) 2008-2011* 86
Nutrition Low birth weight (%) 2007-2011* 16 Early initiation of breastfeeding (%), 2007-2011* 71 Exclusive breastfeeding <6 months (%), 2007-2011* 24 Introduction of solid, semi-solid or soft foods 6-8 months (%), 2007-2011* 91 Breastfeeding at age 2 (%), 2007-2011* 28 Underweight (%) 2007-2011*, moderate & severe 17 Underweight (%) 2007-2011*, severe 4 Stunting (%) 2007-2011*, moderate & severe 29 Wasting (%) 2007-2011*, moderate & severe 8 Overweight (%) 2007-2011*, moderate & severe 5 Vitamin A supplementation full coverage (%) 2011 - Iodized salt consumption (%) 2007-2011* 63
Health Adult HIV prevalence (%) 2011 13.4 Use of improved drinking water sources (%) 2010, total 93 Use of improved drinking water sources (%) 2010, urban 99 Use of improved drinking water sources (%) 2010, rural 90 Use of improved sanitation facilities (%) 2010, total 32 Use of improved sanitation facilities (%) 2010, urban 57 Use of improved sanitation facilities (%) 2010, rural 17
8
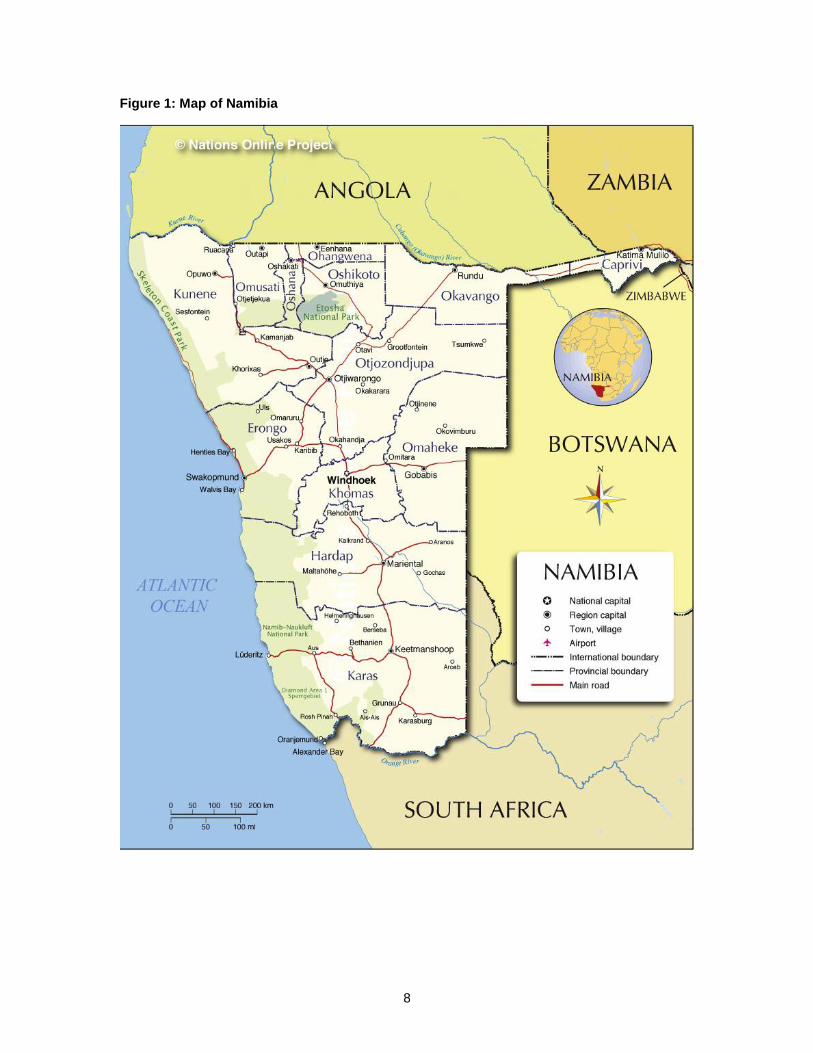
Figure 1: Map of Namibia
9
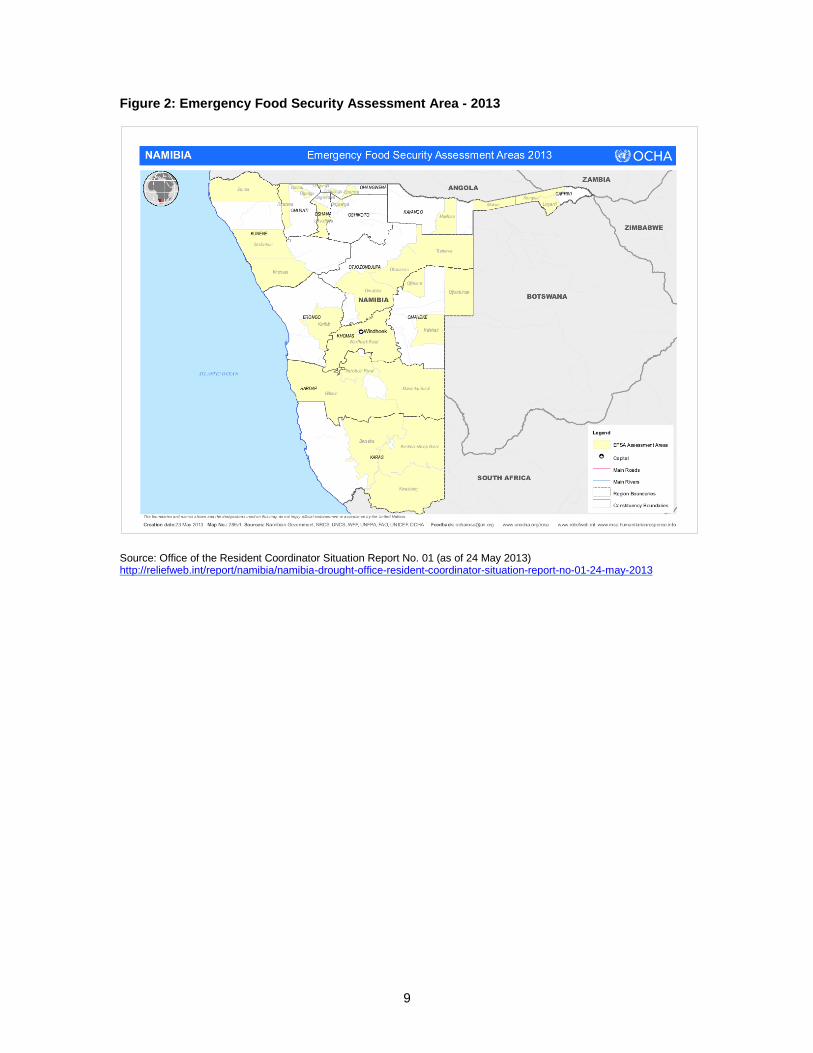
Figure 2: Emergency Food Security Assessment Area - 2013
Source: Office of the Resident Coordinator Situation Report No. 01 (as of 24 May 2013) http://reliefweb.int/report/namibia/namibia-drought-office-resident-coordinator-situation-report-no-01-24-may-2013
10
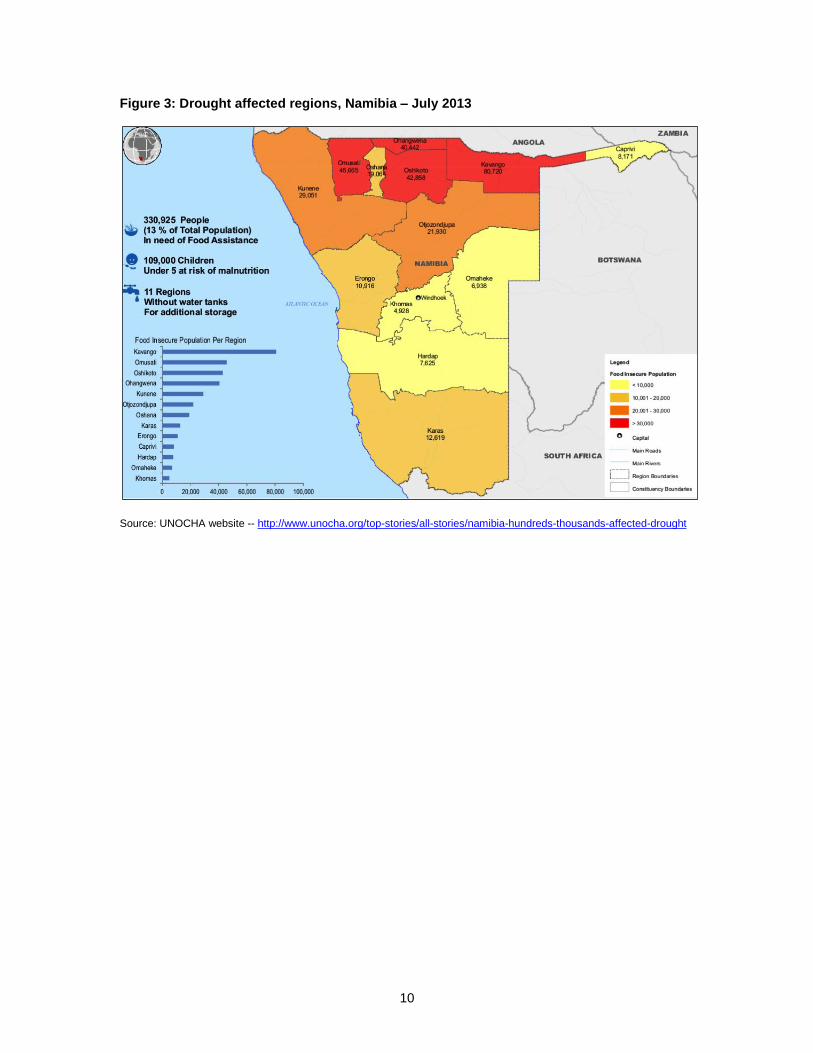
Figure 3: Drought affected regions, Namibia – July 2013
Source: UNOCHA website -- http://www.unocha.org/top-stories/all-stories/namibia-hundreds-thousands-affected-drought
11
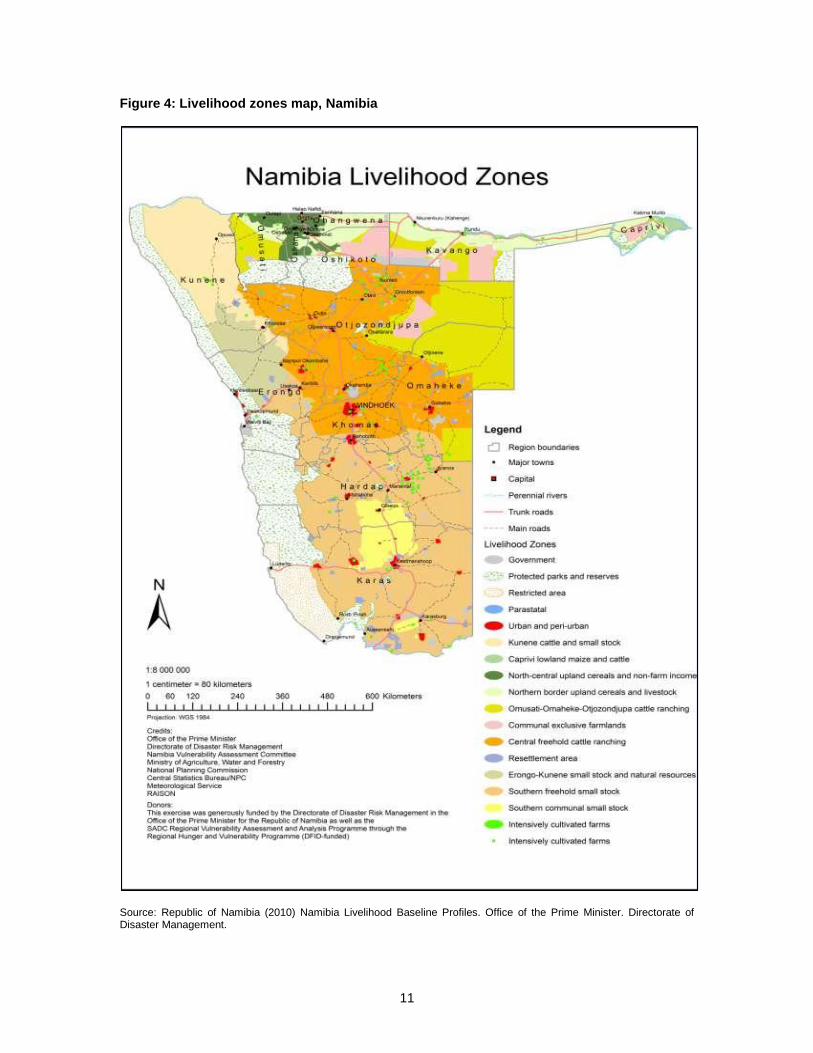
Figure 4: Livelihood zones map, Namibia
Source: Republic of Namibia (2010) Namibia Livelihood Baseline Profiles. Office of the Prime Minister. Directorate of Disaster Management.
6
Livelihoods Map of Namibia
12
1. Executive summary
Namibia is an arid country, regularly affected by erratic rainfall and dry spells. As are result, people have developed a number of coping mechanisms to improve their food and economic security during these periods. However, some population groups are chronically poor, and their coping strategies have been eroded to the point where people no longer have saleable assets and they are regularly relying on donations of food from family and friends. The 2013 drought has exacerbated this poverty by destroying peoples primary source of food, namely their own production.
The Government of the Republic of Namibia (GRN) declared a national drought emergency in May 2013. This was after significantly below average rainfall across most of the country resulted in decreased crop production. According to government forecasts, cereal production for 2013 is down an estimated 42 per cent compared to 2012. Pastures for grazing have also been severely affected in six regions where many households rely on livestock production.
Staff and volunteers of the Namibia Red Cross Society (NRCS) conducted this economic security assessment with the technical and financial support of British Red Cross. It was conducted between July 10
th and August 8
th, 2013. The assessment team visited three regions in Northern
Namibia that had previously been identified by the GRN and the NRCS as being among the most drought-affected: Kunene, Oshikoto and Kavango.
The assessment findings indicate significant differences between the populations in each of the three regions. There are differences in terms of the length of drought, the impact of drought on communities/households, the livelihood strategies of the populations, underlying levels of poverty and the coping strategies available to households. As a result of these differences, two regions have been identified as needing immediate assistance: Kunene and Kavango.
Households with low incomes in both these regions are increasingly reliant on government assistance in the form of pensions, grants and food assistance (maize). In the Zemba communities visited in Kunene Region and in many communities in Kavango Region, poor households reported receiving donations of food from family in friends even in 2012. In Kunene, this is being supplemented by government assistance whereas in Kavango, government assistance has not been received.
Kunene Region is facing its second year of declared drought, compared to the first year in the other two regions. As a result, the effect of the drought on livestock pasture and water availability is more severe than in the other regions, and crop production has been severely reduced. Households are also exhibiting more severe coping strategies. For these reasons, intervention in Kunene should be prioritized (especially in Epupa Constituency and surrounding areas). Kunene Region not only requires food assistance (in the form of cash) but would also benefit from water interventions, disaster risk reduction activities and ongoing nutrition surveillance.
In Kunene, the communities are relatively small in size and they are more discrete, which should make selection of communities and distribution of cash easier. It is recommended that within the targeted communities, universal distribution (i.e. provide to all households) be carried out, as the number of “better off” households is few.
Communities visited in Kavango Region are chronically poor, with limited opportunities for income generation. Although the drought has had less impact there, people are struggling to cope with the loss of their crop production. It is recommended that food assistance (In the form of cash) also be provided in Mukwe and the rural areas around Rundu.
In Kavango however, the communities are larger and therefore targeting will be necessary in order to ensure that households in need receive support and to avoid inclusion error.
13
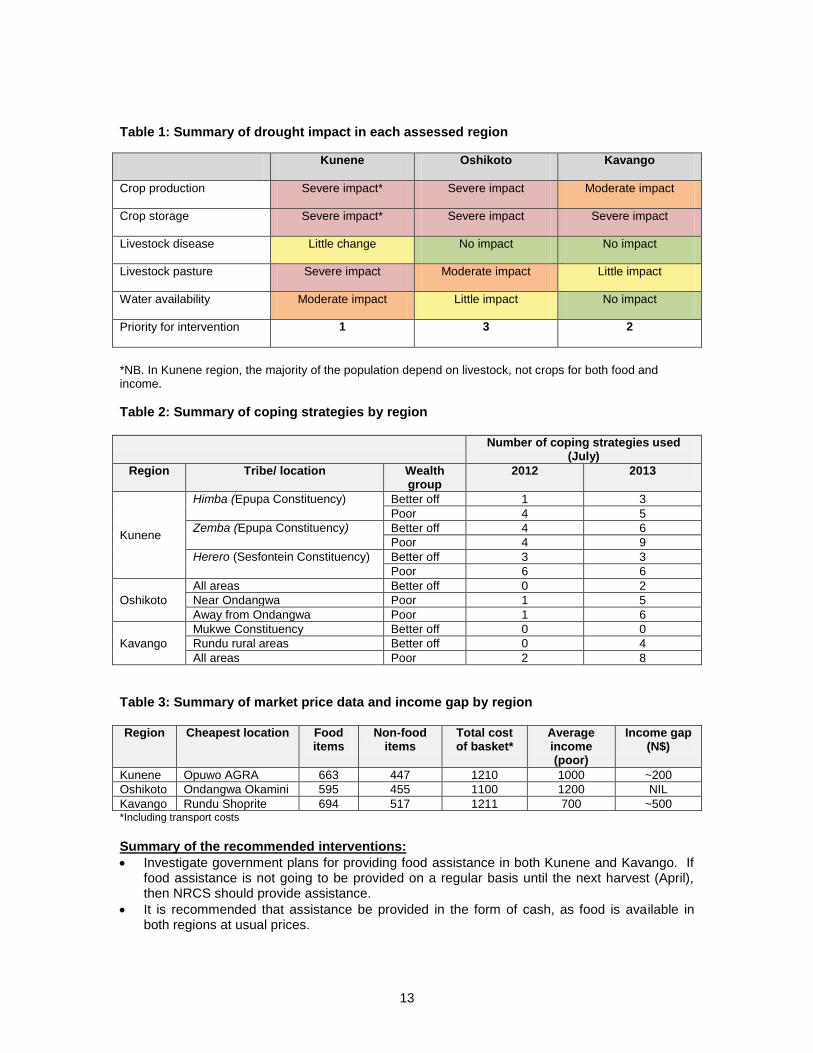
Table 1: Summary of drought impact in each assessed region
Kunene Oshikoto Kavango
Crop production Severe impact* Severe impact Moderate impact
Crop storage Severe impact* Severe impact Severe impact
Livestock disease Little change No impact No impact
Livestock pasture Severe impact Moderate impact Little impact
Water availability Moderate impact Little impact No impact
Priority for intervention 1 3 2
*NB. In Kunene region, the majority of the population depend on livestock, not crops for both food and income.
Table 2: Summary of coping strategies by region
Number of coping strategies used (July)
Region Tribe/ location Wealth group
2012 2013
Kunene
Himba (Epupa Constituency) Better off 1 3
Poor 4 5
Zemba (Epupa Constituency) Better off 4 6
Poor 4 9
Herero (Sesfontein Constituency) Better off 3 3
Poor 6 6
Oshikoto
All areas Better off 0 2
Near Ondangwa Poor 1 5
Away from Ondangwa Poor 1 6
Kavango
Mukwe Constituency Better off 0 0
Rundu rural areas Better off 0 4
All areas Poor 2 8
Table 3: Summary of market price data and income gap by region
Region Cheapest location Food items
Non-food items
Total cost of basket*
Average income (poor)
Income gap (N$)
Kunene Opuwo AGRA 663 447 1210 1000 ~200
Oshikoto Ondangwa Okamini 595 455 1100 1200 NIL
Kavango Rundu Shoprite 694 517 1211 700 ~500 *Including transport costs
Summary of the recommended interventions:
Investigate government plans for providing food assistance in both Kunene and Kavango. If food assistance is not going to be provided on a regular basis until the next harvest (April), then NRCS should provide assistance.
It is recommended that assistance be provided in the form of cash, as food is available in both regions at usual prices.
14
Cash should be provided to households in sufficient amounts to meet the gap between household income and the cost of a minimum basket of goods.
Cash distribution should be coordinated with Lutheran World Federation, who is also planning cash distribution programmes in both Kunene and Kavango Regions.
Further investigation is needed into an appropriate cash distribution mechanism in both regions.
Consider blanket targeting (i.e. all households) in Kunene communities with low livestock numbers who depend on crops for their food (e.g. predominantly Zemba communities).
Clearly identify (verifiable) targeting criteria in affected communities in Kavango – e.g. households with less than 5 small livestock, households without remittance, households affected by HIV, households with children less than 5 years of age.
Consider the provision of seed for next years planting season (November) or the provision of cash to purchase subsidized seeds (from the government) especially in Kunene where crops production was severely affected.
Consider the implementation of longer-term disaster risk reduction activities in Kunene – including provision of water at grazing points, and environmental management interventions.
Community-based management of acute malnutrition (CMAM) is an appropriate intervention in all visited regions to ensure that malnourished children are identified early and referred to appropriate treatment. Discussions into such a programme are already ongoing with UNICEF and it is recommended that CMAM be an ongoing part of NRCS work in all the assessed regions.
15
2. Background of Namibia
Namibia has a population of 2.1 million people and a stable multi-party parliamentary democracy. The country is one of least densely populated countries in the world, due in part to the presence of the Namib Desert. Agriculture, livestock, tourism and the mining industry are the backbone of the Namibian economy. Approximately half the population lives below the international poverty line, and the nation is severely affected by HIV/AIDS, with 13.4% of the adult population infected with HIV
1.
The cultivation of rain fed crops in Namibia is mainly confined to the northern communal areas. Pearl millet (mahangu) is the most widely grown cereal in the communal areas, and maize (some irrigated) in the commercial areas. Wheat is only grown in the commercial areas and under irrigation. Maize is widely preferred as the staple food in the communal areas, but millet and sorghum are more reliable crops except in the highest rainfall zones. Maize is therefore mainly imported from South Africa.
The Namibian government declared a national drought emergency in May 2013. This was after significantly below average rainfall across most of the country resulting in decreased crop production. According to government forecasts, cereal production for 2013 is down by an estimated 42 per cent compared to 2012. Pastures for grazing have also been severely affected in six regions where many households rely on livestock production.
Namibia has chronic issues of malnutrition2, which are likely to be exacerbated by this drought. A
national level Emergency Food Security Assessment (EFSA)3 conducted in April 2013 estimated
330,925 people as food insecure, and 447,577 as moderately food insecure. The area assessed during the EFSA can be seen in Figure 2.
With the next harvest due in March/April 2014 the government predicts the situation will get worse before it gets better.
3. Introduction to the assessment
The specific objectives of the deployment are to:
Assess the current food security situation of the drought-affected population in Kunene, Kavango, Ohangwena and Oshikoto and identify the possible need for immediate emergency assistance.
Understand the livelihoods and underlying vulnerabilities of different drought affected population groups and how they have been affected by the drought. Identify the most vulnerable population groups requiring emergency assistance.
Understand functioning of local markets for food supply, availability and prices and evaluate if direct food assistance by external actors is required due to food unavailability
Assess the extent and underlying causes of acute malnutrition and link it to integrated food security and WASH programming.
Identify suitable interventions to support the immediate food security situation and the recovery and resilience of livelihoods of the most vulnerable drought affected population
Support the Namibia Red Cross Society (NRCS) to incorporate the identified interventions into their emergency response operation and if possible into the longer term plans
Assess the present capacity of NRCS staff and volunteers in supporting the identified food security and livelihood options and possible need for partnering with other local actors and capacity building and training for NRCS staff and volunteers.
The outcomes of the assessment will be used to inform the wider humanitarian community, including the Government of Namibia on the micro level food insecurity situation, functioning of
1 UNICEF (2011) http://www.unicef.org/infobycountry/namibia_statistics.html
2 Refer to the key statistics listed in the start of this report.
3 Conducted by the Office of the Prime Minister, UN agencies (WFP, UNICEF and OCHA) and NRCS.
16
markets, needs of the most vulnerable people and a suggested appropriate response. The findings will also be incorporated into the Emergency Appeal operation and possibly in the longer-term objectives of the NRCS. Activities
Review existing secondary information documents available
Meet with key stakeholders in Windhoek and the regions to better understand the needs of the affected population and the responses to date
Review NRCS ongoing response to drought, including feeding programmes
Lead a small NRCS assessment team to collect primary information from the affected population using participatory techniques, including analyzing any primary data already collected by the NRCS.
Prepare an assessment report which includes clear recommendations for strengthening the emergency response and implementing early recovery and resilience programme
Present and discuss assessment results and recommendations to the National Society, branch staff and appropriate government officials in the regions and in Windhoek.
Outputs Prepare a report of findings of assessment that provides the following information:
Basic analysis/mapping of different livelihood zones in the programme area and how these have been impacted by the drought
Analysis of how the drought have impacted on livelihoods, the household economy and food security situation of different livelihood groups and how their situation is likely to develop over next 12 months
Basic analysis of how drought have impacted on availability of food from local production and in markets and the price of basic commodities
Basic mapping of key relevant key stakeholders and their activities to support food security and livelihoods in programme areas
Basic analysis of appropriateness, usage and impact of any food aid and cash provided to date as part of the emergency response by the Government or other actors
Assess capacity of local team to deliver any additional support
Provide recommendations for response that address: o How to effectively address acute/immediate needs for food of vulnerable households,
with clear recommendations on targeting and timing, aligning them to the ongoing programme of NRCS for drought response
o How to most effectively and appropriately help vulnerable households recover their livelihoods, with clear recommendations on targeting, timing, entry and exit criteria of such support
Facilitate NRC to draw up plans of action for the implementation of the above recommendations. Plans should include a budget, implementation GANTT chart and a log frame.
4. Assessment methodology
Staff and volunteers of the Namibia Red Cross Society conducted this assessment between July 10
th and August 8
th, 2013 with the technical and financial support of British Red Cross. The
assessment team visited three regions in Northern Namibia that had previously been identified by the Government of the Republic of Namibia (GRN) and the NRCS as being among the most drought-affected.
Originally, four regions were identified for the assessment: Kunene, Oshikoto, Ohangwena and Kavango. However, due to a fatal accident involving Red Cross staff in Ohangwena, the assessment of that region was cancelled. The other three regions were assessed as planned.
The assessment methodology was based on the Household Economic Approach. The Household Economy Approach is an analytical framework used to examine household operations and how
17
households across the wealth spectrum, source food and income, their expenditure patterns, social relationships, and how they cope with hazards
4.
For the purposes of this assessment, the reference year of 2012 was used. Assessment data compared the situation in July 2013 with the situation in July 2012. It should be noted however, that 2012 was not a “normal” year, as Kunene Region was already in drought, and Oshikoto had experienced flood. However, because of insufficient time to train enumerators and poor recall of households back to 2008 (the time of the GRN livelihood baselines), 2012 was used for comparison.
Different field teams were used in each region due to language differences. In each region the team collected both qualitative and quantitative information in all locations visited. In each visited community the following data collection methods were used:
Community meetings using a semi-structured interview guide.
Focus groups with different wealth groups (better off, middle and poor interviewed separately).
Market price data & interview with retailers
Observation
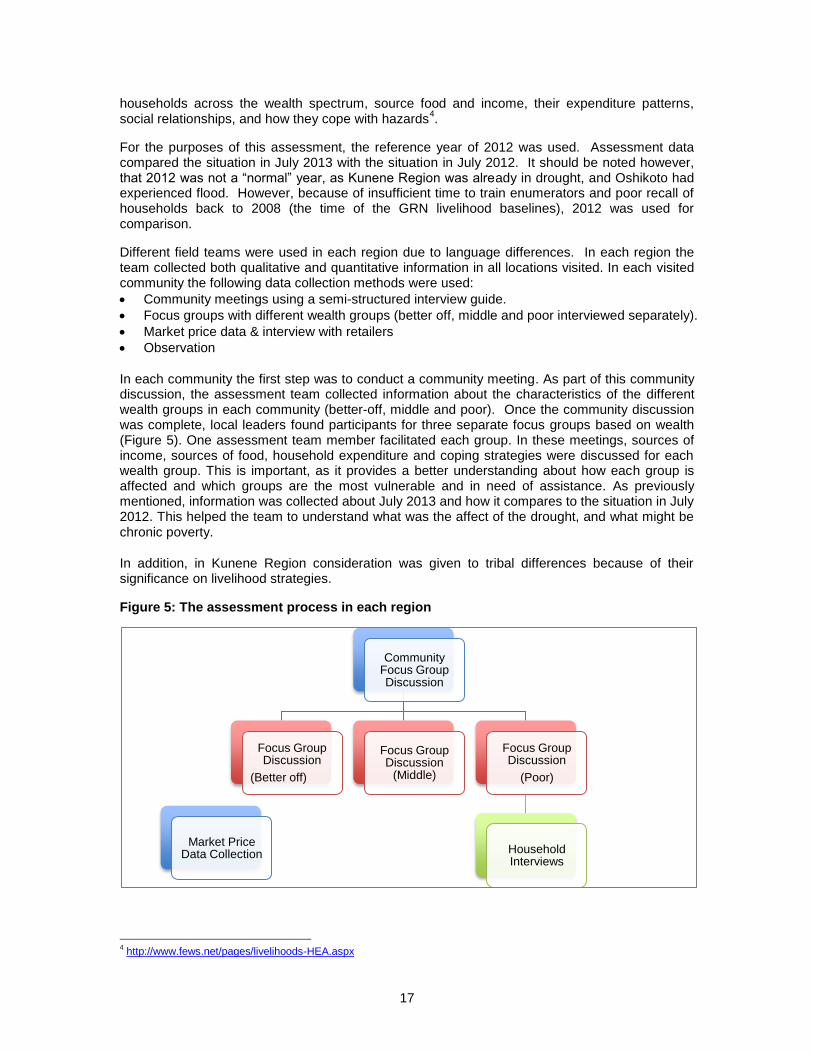
In each community the first step was to conduct a community meeting. As part of this community discussion, the assessment team collected information about the characteristics of the different wealth groups in each community (better-off, middle and poor). Once the community discussion was complete, local leaders found participants for three separate focus groups based on wealth (Figure 5). One assessment team member facilitated each group. In these meetings, sources of income, sources of food, household expenditure and coping strategies were discussed for each wealth group. This is important, as it provides a better understanding about how each group is affected and which groups are the most vulnerable and in need of assistance. As previously mentioned, information was collected about July 2013 and how it compares to the situation in July 2012. This helped the team to understand what was the affect of the drought, and what might be chronic poverty.
In addition, in Kunene Region consideration was given to tribal differences because of their significance on livelihood strategies.
Figure 5: The assessment process in each region
4 http://www.fews.net/pages/livelihoods-HEA.aspx
Community Focus Group Discussion
Focus Group Discussion
(Better off)
Focus Group Discussion
(Middle)
Focus Group Discussion
(Poor)
Household Interviews
Market Price Data Collection
18
Household interviews were originally planned in each location to help verify focus group information. However, due to the time taken to conduct the other interviews, and the travel time needed, the household interviews were only conducted with five households in Epupa Constituency.
The technique of proportional piling was used extensively during the assessment to help with quantification and triangulation of information between wealth groups and between interviews.
Market price data was also collected from each community visited (if shops were present and people reported buying food locally) and from the main town in each region (where most people reported shopping).
The full assessment timetable and the survey tools can be found in the annexes.
Market price collection
In each community visited, households were asked where they bought their food. The assessment team then visited those specific shops and checked the availability and price of a basket of items (food and non-food). Livestock prices were also collected in each region.
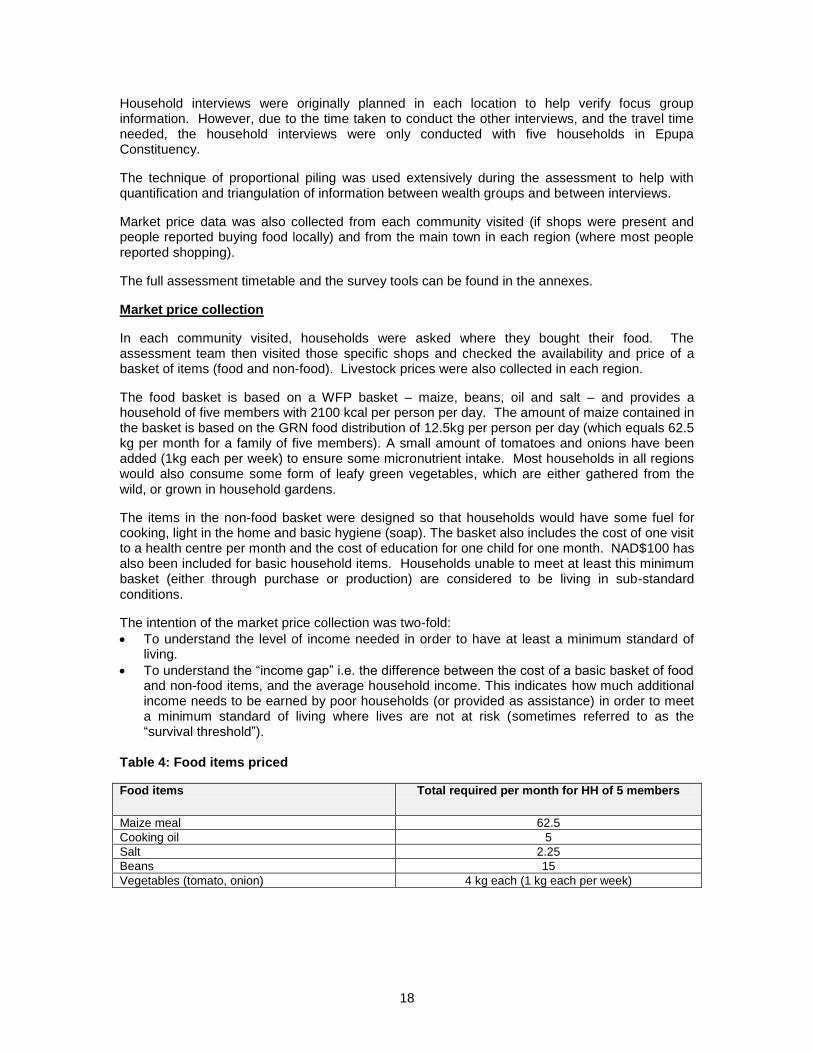
The food basket is based on a WFP basket – maize, beans, oil and salt – and provides a household of five members with 2100 kcal per person per day. The amount of maize contained in the basket is based on the GRN food distribution of 12.5kg per person per day (which equals 62.5 kg per month for a family of five members). A small amount of tomatoes and onions have been added (1kg each per week) to ensure some micronutrient intake. Most households in all regions would also consume some form of leafy green vegetables, which are either gathered from the wild, or grown in household gardens.
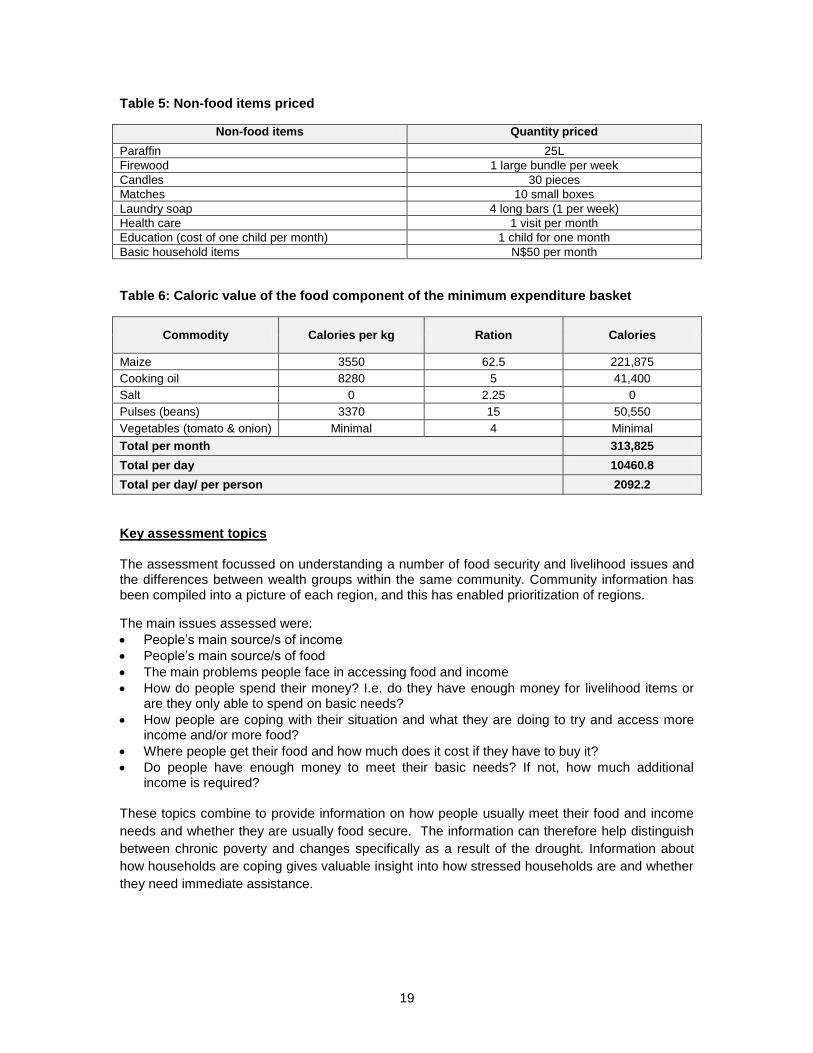
The items in the non-food basket were designed so that households would have some fuel for cooking, light in the home and basic hygiene (soap). The basket also includes the cost of one visit to a health centre per month and the cost of education for one child for one month. NAD$100 has also been included for basic household items. Households unable to meet at least this minimum basket (either through purchase or production) are considered to be living in sub-standard conditions.
The intention of the market price collection was two-fold:
To understand the level of income needed in order to have at least a minimum standard of living.
To understand the “income gap” i.e. the difference between the cost of a basic basket of food and non-food items, and the average household income. This indicates how much additional income needs to be earned by poor households (or provided as assistance) in order to meet a minimum standard of living where lives are not at risk (sometimes referred to as the “survival threshold”).
Table 4: Food items priced
Food items Total required per month for HH of 5 members
Maize meal 62.5
Cooking oil 5
Salt 2.25
Beans 15
Vegetables (tomato, onion) 4 kg each (1 kg each per week)
19
Table 5: Non-food items priced
Non-food items Quantity priced
Paraffin 25L
Firewood 1 large bundle per week
Candles 30 pieces
Matches 10 small boxes
Laundry soap 4 long bars (1 per week)
Health care 1 visit per month
Education (cost of one child per month) 1 child for one month
Basic household items N$50 per month
Table 6: Caloric value of the food component of the minimum expenditure basket
Commodity Calories per kg Ration Calories
Maize 3550 62.5 221,875
Cooking oil 8280 5 41,400
Salt 0 2.25 0
Pulses (beans) 3370 15 50,550
Vegetables (tomato & onion) Minimal 4 Minimal
Total per month 313,825
Total per day 10460.8
Total per day/ per person 2092.2
Key assessment topics
The assessment focussed on understanding a number of food security and livelihood issues and the differences between wealth groups within the same community. Community information has been compiled into a picture of each region, and this has enabled prioritization of regions.
The main issues assessed were:
People’s main source/s of income
People’s main source/s of food
The main problems people face in accessing food and income
How do people spend their money? I.e. do they have enough money for livelihood items or are they only able to spend on basic needs?
How people are coping with their situation and what they are doing to try and access more income and/or more food?
Where people get their food and how much does it cost if they have to buy it?
Do people have enough money to meet their basic needs? If not, how much additional income is required?
These topics combine to provide information on how people usually meet their food and income
needs and whether they are usually food secure. The information can therefore help distinguish
between chronic poverty and changes specifically as a result of the drought. Information about
how households are coping gives valuable insight into how stressed households are and whether
they need immediate assistance.
20
5. Assessment findings
KUNENE REGION
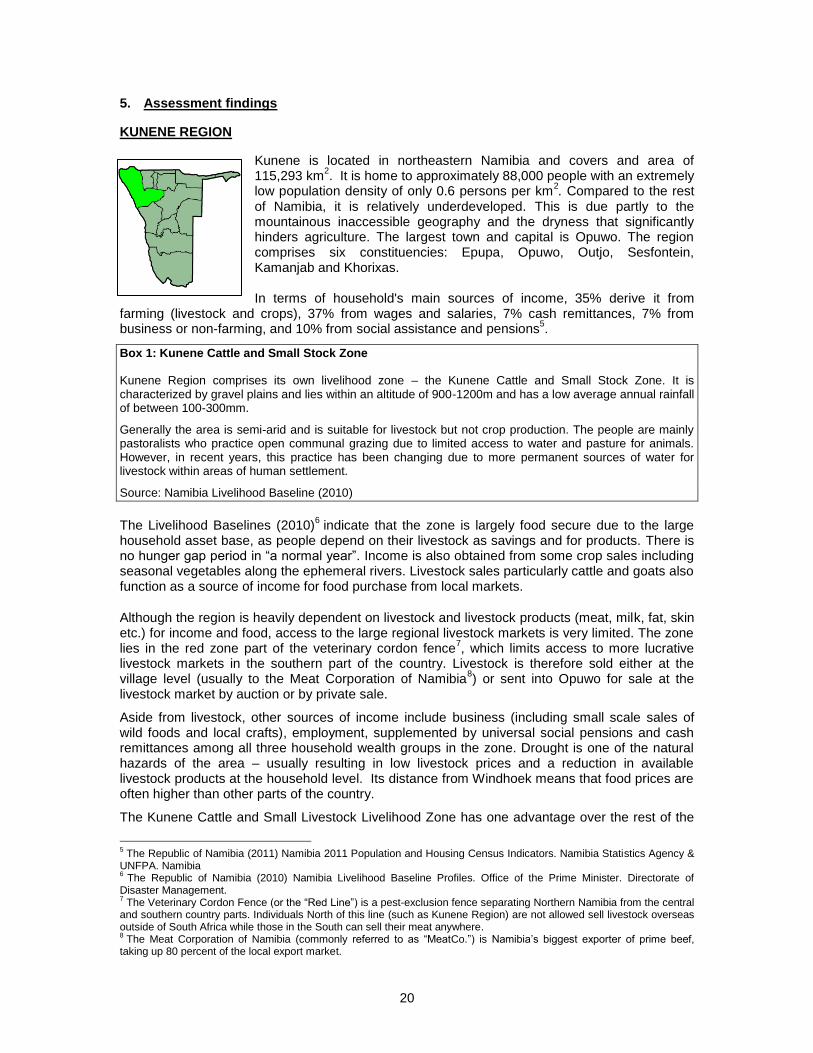
Kunene is located in northeastern Namibia and covers and area of 115,293 km
2. It is home to approximately 88,000 people with an extremely
low population density of only 0.6 persons per km2. Compared to the rest
of Namibia, it is relatively underdeveloped. This is due partly to the mountainous inaccessible geography and the dryness that significantly hinders agriculture. The largest town and capital is Opuwo. The region comprises six constituencies: Epupa, Opuwo, Outjo, Sesfontein, Kamanjab and Khorixas. In terms of household's main sources of income, 35% derive it from
farming (livestock and crops), 37% from wages and salaries, 7% cash remittances, 7% from business or non-farming, and 10% from social assistance and pensions
5.
Box 1: Kunene Cattle and Small Stock Zone
Kunene Region comprises its own livelihood zone – the Kunene Cattle and Small Stock Zone. It is characterized by gravel plains and lies within an altitude of 900-1200m and has a low average annual rainfall of between 100-300mm.
Generally the area is semi-arid and is suitable for livestock but not crop production. The people are mainly pastoralists who practice open communal grazing due to limited access to water and pasture for animals. However, in recent years, this practice has been changing due to more permanent sources of water for livestock within areas of human settlement.
Source: Namibia Livelihood Baseline (2010)
The Livelihood Baselines (2010)6 indicate that the zone is largely food secure due to the large
household asset base, as people depend on their livestock as savings and for products. There is no hunger gap period in “a normal year”. Income is also obtained from some crop sales including seasonal vegetables along the ephemeral rivers. Livestock sales particularly cattle and goats also function as a source of income for food purchase from local markets.
Although the region is heavily dependent on livestock and livestock products (meat, milk, fat, skin etc.) for income and food, access to the large regional livestock markets is very limited. The zone lies in the red zone part of the veterinary cordon fence
7, which limits access to more lucrative
livestock markets in the southern part of the country. Livestock is therefore sold either at the village level (usually to the Meat Corporation of Namibia
8) or sent into Opuwo for sale at the
livestock market by auction or by private sale.
Aside from livestock, other sources of income include business (including small scale sales of wild foods and local crafts), employment, supplemented by universal social pensions and cash remittances among all three household wealth groups in the zone. Drought is one of the natural hazards of the area – usually resulting in low livestock prices and a reduction in available livestock products at the household level. Its distance from Windhoek means that food prices are often higher than other parts of the country.
The Kunene Cattle and Small Livestock Livelihood Zone has one advantage over the rest of the
5 The Republic of Namibia (2011) Namibia 2011 Population and Housing Census Indicators. Namibia Statistics Agency &
UNFPA. Namibia 6 The Republic of Namibia (2010) Namibia Livelihood Baseline Profiles. Office of the Prime Minister. Directorate of
Disaster Management. 7 The Veterinary Cordon Fence (or the “Red Line”) is a pest-exclusion fence separating Northern Namibia from the central
and southern country parts. Individuals North of this line (such as Kunene Region) are not allowed sell livestock overseas outside of South Africa while those in the South can sell their meat anywhere. 8 The Meat Corporation of Namibia (commonly referred to as “MeatCo.”) is Namibia’s biggest exporter of prime beef,
taking up 80 percent of the local export market.
21
country – the presence of very good local breed of cattle. This means that local animals have high milk and meat in terms of quantity and this could fetch significant cash income when sold at relatively good prices
9.
Locations visited
The team visited six communities based on discussions with the NRCS Regional Manager about the areas that are most drought affected. Three constituencies were identified as “drought affected
10” with two constituencies prioritized for assessment: Epupa and Sesfontein.
Within the identified constituencies, two primarily Himba communities were selected (Otjitanda and Okoupawe in Epupa Constituency), two Zemba communities (Ombazo and Otutati, in Epupa Constituency and two Herero communities (Devet and Omuramba in Sesfontein Constituency) to ensure that tribal differences were considered since different tribes have considerably different livelihood strategies and cultures.
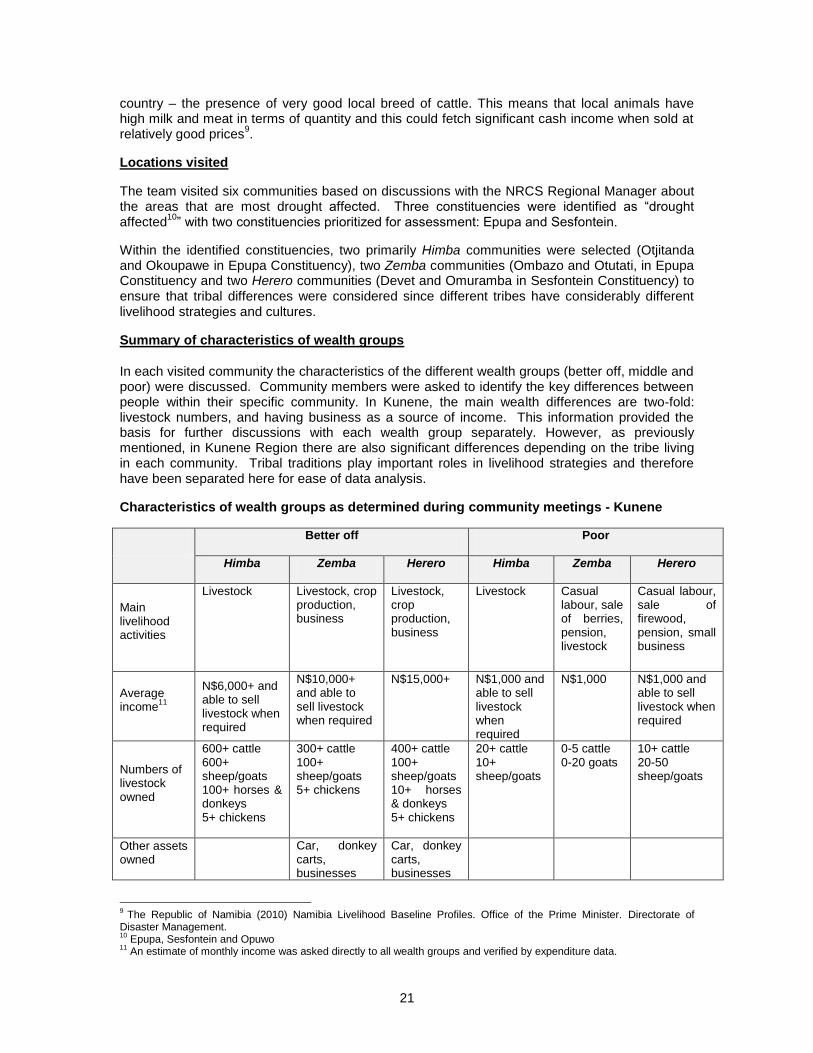
Summary of characteristics of wealth groups
In each visited community the characteristics of the different wealth groups (better off, middle and poor) were discussed. Community members were asked to identify the key differences between people within their specific community. In Kunene, the main wealth differences are two-fold: livestock numbers, and having business as a source of income. This information provided the basis for further discussions with each wealth group separately. However, as previously mentioned, in Kunene Region there are also significant differences depending on the tribe living in each community. Tribal traditions play important roles in livelihood strategies and therefore have been separated here for ease of data analysis.
Characteristics of wealth groups as determined during community meetings - Kunene
Better off Poor
Himba Zemba Herero Himba Zemba Herero
Main livelihood activities
Livestock Livestock, crop production, business
Livestock, crop production, business
Livestock Casual labour, sale of berries, pension, livestock
Casual labour, sale of firewood, pension, small business
Average income
11
N$6,000+ and able to sell livestock when required
N$10,000+ and able to sell livestock when required
N$15,000+ N$1,000 and able to sell livestock when required
N$1,000 N$1,000 and able to sell livestock when required
Numbers of livestock owned
600+ cattle 600+ sheep/goats 100+ horses & donkeys 5+ chickens
300+ cattle 100+ sheep/goats 5+ chickens
400+ cattle 100+ sheep/goats 10+ horses & donkeys 5+ chickens
20+ cattle 10+ sheep/goats
0-5 cattle 0-20 goats
10+ cattle 20-50 sheep/goats
Other assets owned
Car, donkey carts, businesses
Car, donkey carts, businesses
9 The Republic of Namibia (2010) Namibia Livelihood Baseline Profiles. Office of the Prime Minister. Directorate of
Disaster Management. 10
Epupa, Sesfontein and Opuwo 11
An estimate of monthly income was asked directly to all wealth groups and verified by expenditure data.
22
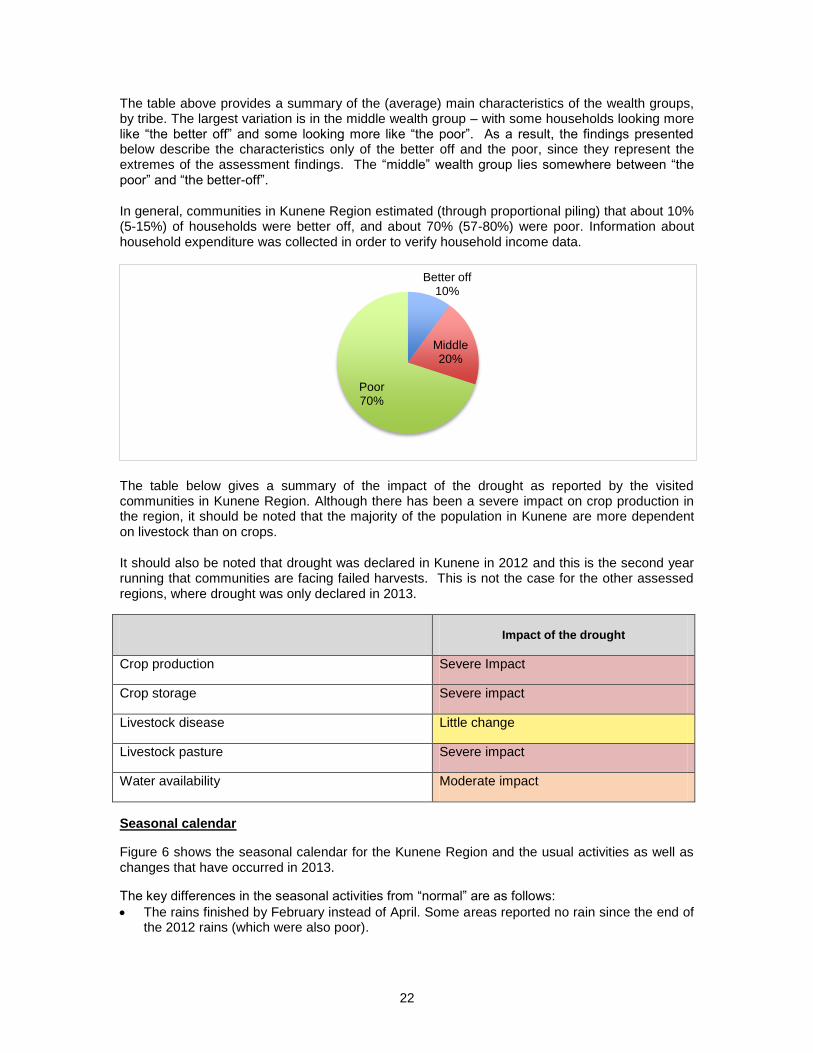
The table above provides a summary of the (average) main characteristics of the wealth groups, by tribe. The largest variation is in the middle wealth group – with some households looking more like “the better off” and some looking more like “the poor”. As a result, the findings presented below describe the characteristics only of the better off and the poor, since they represent the extremes of the assessment findings. The “middle” wealth group lies somewhere between “the poor” and “the better-off”.
In general, communities in Kunene Region estimated (through proportional piling) that about 10% (5-15%) of households were better off, and about 70% (57-80%) were poor. Information about household expenditure was collected in order to verify household income data.
The table below gives a summary of the impact of the drought as reported by the visited communities in Kunene Region. Although there has been a severe impact on crop production in the region, it should be noted that the majority of the population in Kunene are more dependent on livestock than on crops.
It should also be noted that drought was declared in Kunene in 2012 and this is the second year running that communities are facing failed harvests. This is not the case for the other assessed regions, where drought was only declared in 2013.
Impact of the drought
Crop production Severe Impact
Crop storage Severe impact
Livestock disease Little change
Livestock pasture Severe impact
Water availability Moderate impact
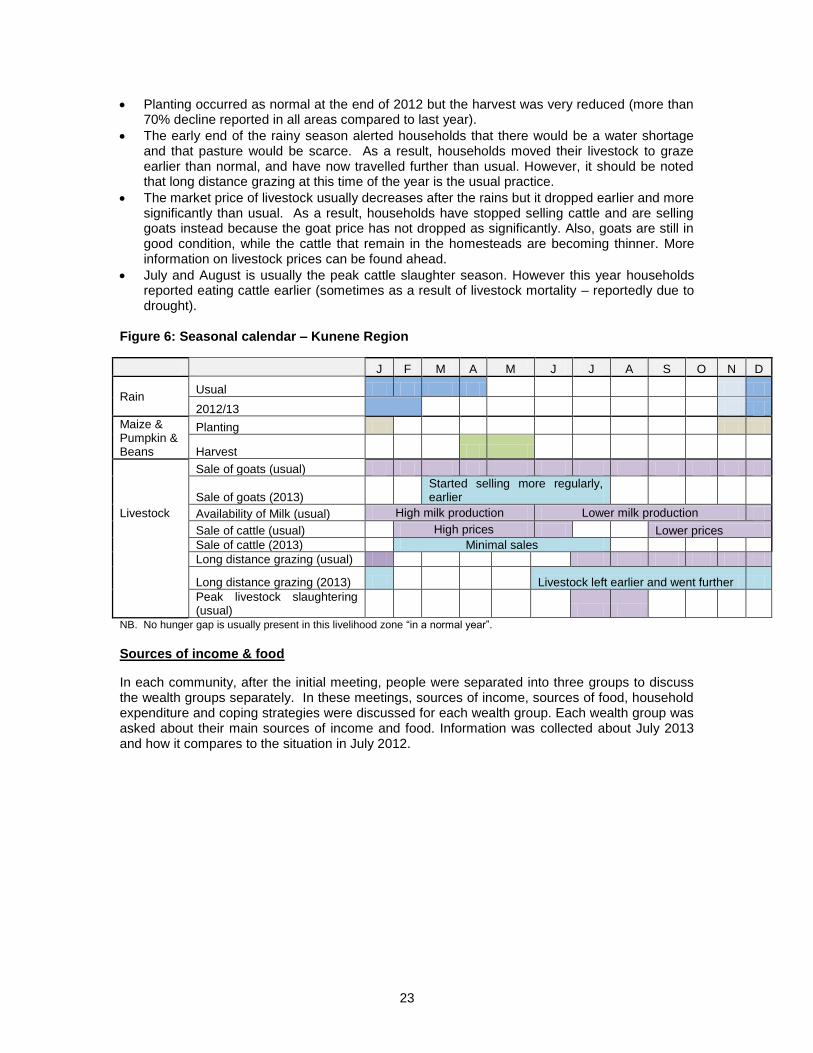
Seasonal calendar
Figure 6 shows the seasonal calendar for the Kunene Region and the usual activities as well as changes that have occurred in 2013.
The key differences in the seasonal activities from “normal” are as follows:
The rains finished by February instead of April. Some areas reported no rain since the end of the 2012 rains (which were also poor).
Better off 10%
Middle 20%
Poor 70%
23
Planting occurred as normal at the end of 2012 but the harvest was very reduced (more than 70% decline reported in all areas compared to last year).
The early end of the rainy season alerted households that there would be a water shortage and that pasture would be scarce. As a result, households moved their livestock to graze earlier than normal, and have now travelled further than usual. However, it should be noted that long distance grazing at this time of the year is the usual practice.
The market price of livestock usually decreases after the rains but it dropped earlier and more significantly than usual. As a result, households have stopped selling cattle and are selling goats instead because the goat price has not dropped as significantly. Also, goats are still in good condition, while the cattle that remain in the homesteads are becoming thinner. More information on livestock prices can be found ahead.
July and August is usually the peak cattle slaughter season. However this year households reported eating cattle earlier (sometimes as a result of livestock mortality – reportedly due to drought).
Figure 6: Seasonal calendar – Kunene Region
J F M A M J J A S O N D
Rain Usual
2012/13
Maize & Pumpkin & Beans
Planting
Harvest
Livestock
Sale of goats (usual)
Sale of goats (2013) Started selling more regularly, earlier
Availability of Milk (usual) High milk production Lower milk production
Sale of cattle (usual) High prices Lower prices
Sale of cattle (2013) Minimal sales
Long distance grazing (usual)
Long distance grazing (2013) Livestock left earlier and went further
Peak livestock slaughtering (usual)
NB. No hunger gap is usually present in this livelihood zone “in a normal year”.
Sources of income & food
In each community, after the initial meeting, people were separated into three groups to discuss the wealth groups separately. In these meetings, sources of income, sources of food, household expenditure and coping strategies were discussed for each wealth group. Each wealth group was asked about their main sources of income and food. Information was collected about July 2013 and how it compares to the situation in July 2012.
24
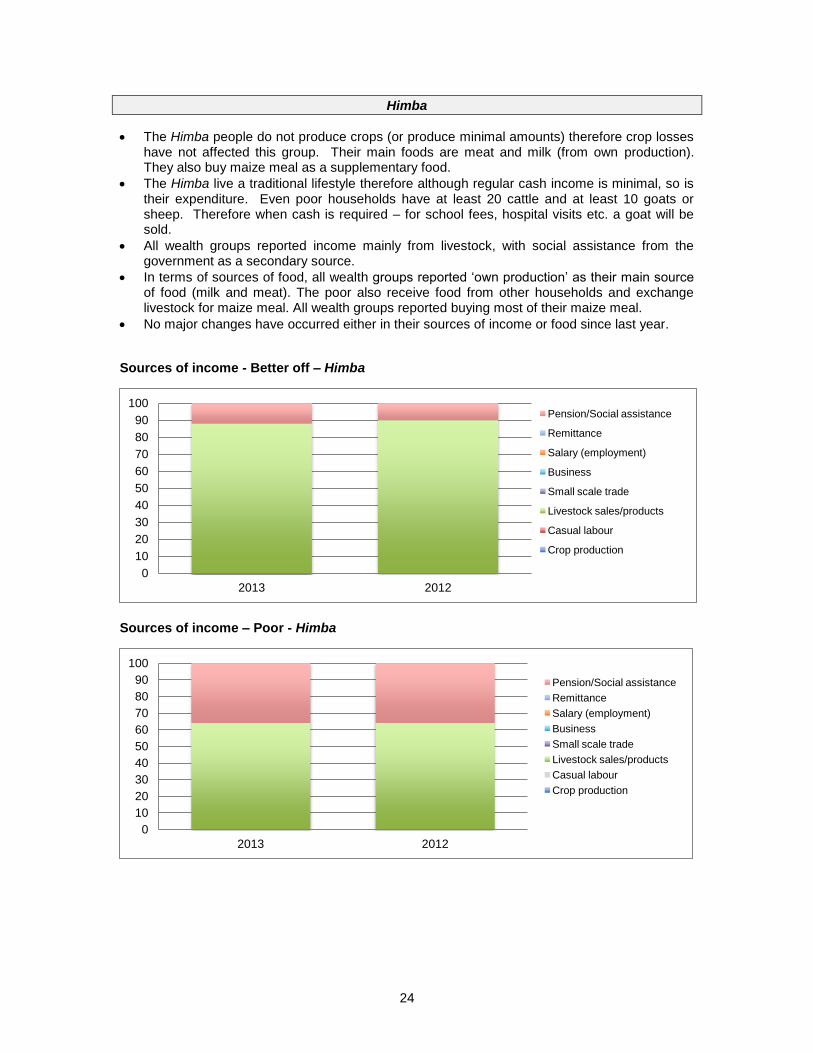
Himba
The Himba people do not produce crops (or produce minimal amounts) therefore crop losses have not affected this group. Their main foods are meat and milk (from own production). They also buy maize meal as a supplementary food.
The Himba live a traditional lifestyle therefore although regular cash income is minimal, so is their expenditure. Even poor households have at least 20 cattle and at least 10 goats or sheep. Therefore when cash is required – for school fees, hospital visits etc. a goat will be sold.
All wealth groups reported income mainly from livestock, with social assistance from the government as a secondary source.
In terms of sources of food, all wealth groups reported ‘own production’ as their main source of food (milk and meat). The poor also receive food from other households and exchange livestock for maize meal. All wealth groups reported buying most of their maize meal.
No major changes have occurred either in their sources of income or food since last year.
Sources of income - Better off – Himba
Sources of income – Poor - Himba
0
10
20
30
40
50
60
70
80
90
100
2013 2012
Pension/Social assistance
Remittance
Salary (employment)
Business
Small scale trade
Livestock sales/products
Casual labour
Crop production
0
10
20
30
40
50
60
70
80
90
100
2013 2012
Pension/Social assistance
Remittance
Salary (employment)
Business
Small scale trade
Livestock sales/products
Casual labour
Crop production
25
Source of food – Better off - Himba
Source of food - Poor - Himba
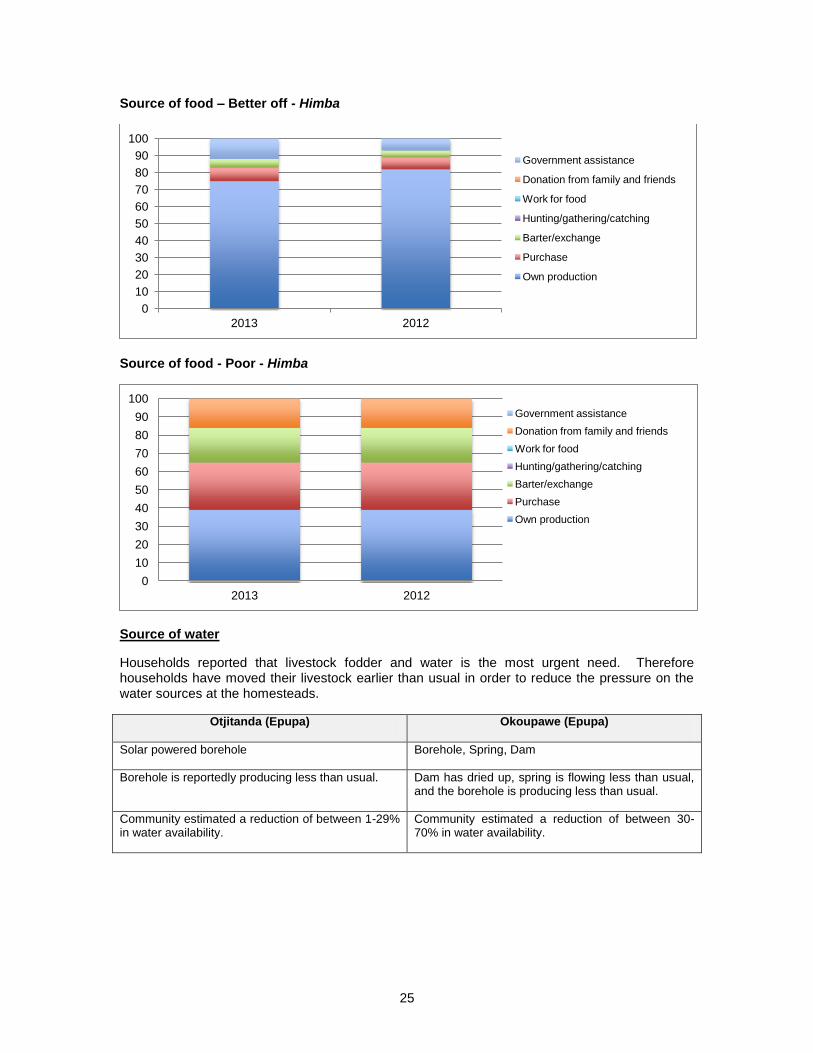
Source of water
Households reported that livestock fodder and water is the most urgent need. Therefore households have moved their livestock earlier than usual in order to reduce the pressure on the water sources at the homesteads.
Otjitanda (Epupa) Okoupawe (Epupa)
Solar powered borehole Borehole, Spring, Dam
Borehole is reportedly producing less than usual. Dam has dried up, spring is flowing less than usual, and the borehole is producing less than usual.
Community estimated a reduction of between 1-29% in water availability.
Community estimated a reduction of between 30-70% in water availability.
0
10
20
30
40
50
60
70
80
90
100
2013 2012
Government assistance
Donation from family and friends
Work for food
Hunting/gathering/catching
Barter/exchange
Purchase
Own production
0
10
20
30
40
50
60
70
80
90
100
2013 2012
Government assistance
Donation from family and friends
Work for food
Hunting/gathering/catching
Barter/exchange
Purchase
Own production
26
Impact of the drought
Livestock have been moved for their long distance grazing earlier than usual.
Livestock have been moved further than usual.
Moving the livestock early was also a coping strategy – in order to preserve the water in the homesteads for human consumption.
There has been a significant drop in cattle price even compared with the drop in July 2012. This drop means that the Himba are now generally not selling cows. They reported not selling at the village level to MeatCo because the price is too low. Instead of cattle, they are now mainly selling goats if they need money (such as for school fees or emergencies). There are a few cattle and many goats remaining in the homestead, which they will sell in Opuwo if required.
There is less availability of animal products for other uses in the home – from cows (including fat for body lotion, skins etc.)
Poor households have stopped drinking milk first thing in morning and are now eating two meals per day (usually eat twice and drink milk as main meal once).
Coping strategies
Both the Himba communities that were visited reported slight differences in their coping strategies compared to July 2012. However, of the three tribes, the Himba are currently implementing the lowest number of coping strategies and have not yet resorted to the more severe strategies such as sending household members to eat elsewhere, relying on casual labour for food.
Better off Poor
2013 2012 2013 2012
Have you had any days without eating? 0 0 0 0
Have you reduced the amount you eat each meal? Yes 0 Yes Yes
Have you reduce the number of times you eat each day? 0 0 Yes Yes
Have you borrowed food or relied on help from friends or relatives? 0 0 Yes Yes
Are you eating less expensive or less preferred foods? 0 0 0 0
Have you purchased/borrowed food on credit? 0 0 0 0
Are you eating unusual types or amounts of wild food / hunt/ fish? Yes 0 Yes 0
Are you sending household members to eat elsewhere? 0 0 0 0
Are you sending household members to beg? 0 0 0 0
Have you reduced adult consumption so children can eat? Yes Yes Yes Yes
Are you relying on casual labour for food? 0 0 0 0
Have members of your household moved to other areas because of the drought?
0 0 0 0
TOTAL 3 1 5 4
27
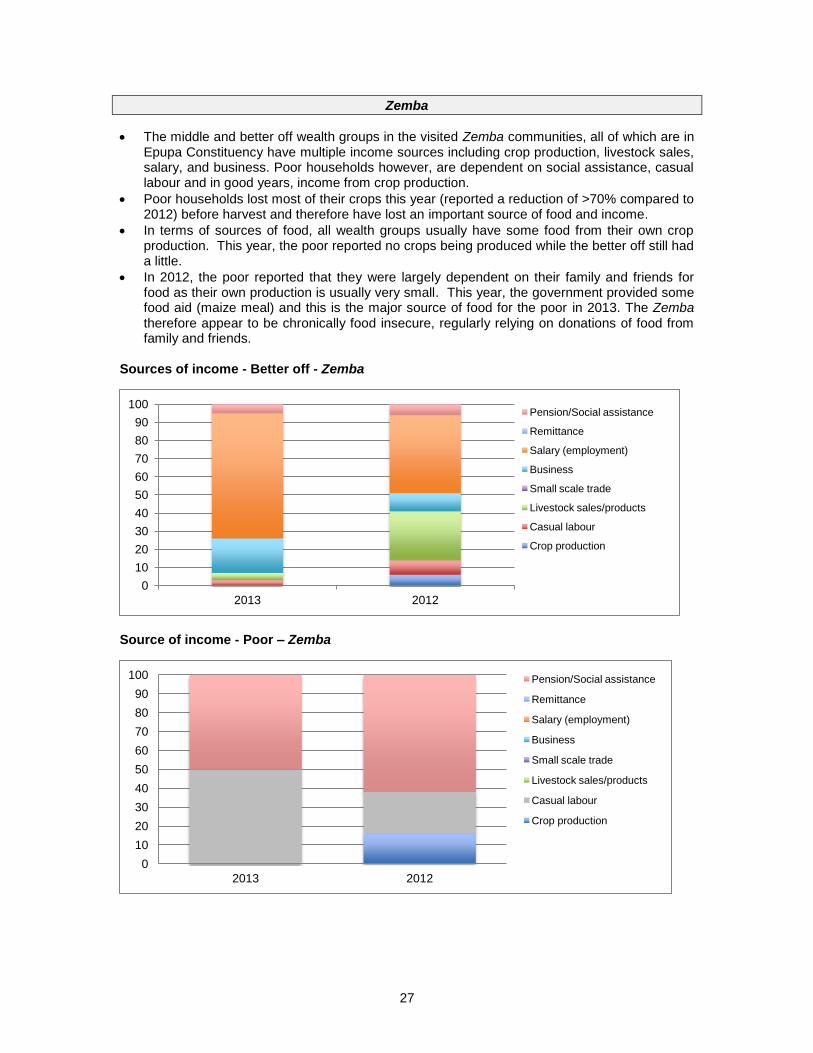
Zemba
The middle and better off wealth groups in the visited Zemba communities, all of which are in Epupa Constituency have multiple income sources including crop production, livestock sales, salary, and business. Poor households however, are dependent on social assistance, casual labour and in good years, income from crop production.
Poor households lost most of their crops this year (reported a reduction of >70% compared to 2012) before harvest and therefore have lost an important source of food and income.
In terms of sources of food, all wealth groups usually have some food from their own crop production. This year, the poor reported no crops being produced while the better off still had a little.
In 2012, the poor reported that they were largely dependent on their family and friends for food as their own production is usually very small. This year, the government provided some food aid (maize meal) and this is the major source of food for the poor in 2013. The Zemba therefore appear to be chronically food insecure, regularly relying on donations of food from family and friends.
Sources of income - Better off - Zemba
Source of income - Poor – Zemba
0
10
20
30
40
50
60
70
80
90
100
2013 2012
Pension/Social assistance
Remittance
Salary (employment)
Business
Small scale trade
Livestock sales/products
Casual labour
Crop production
0
10
20
30
40
50
60
70
80
90
100
2013 2012
Pension/Social assistance
Remittance
Salary (employment)
Business
Small scale trade
Livestock sales/products
Casual labour
Crop production
28
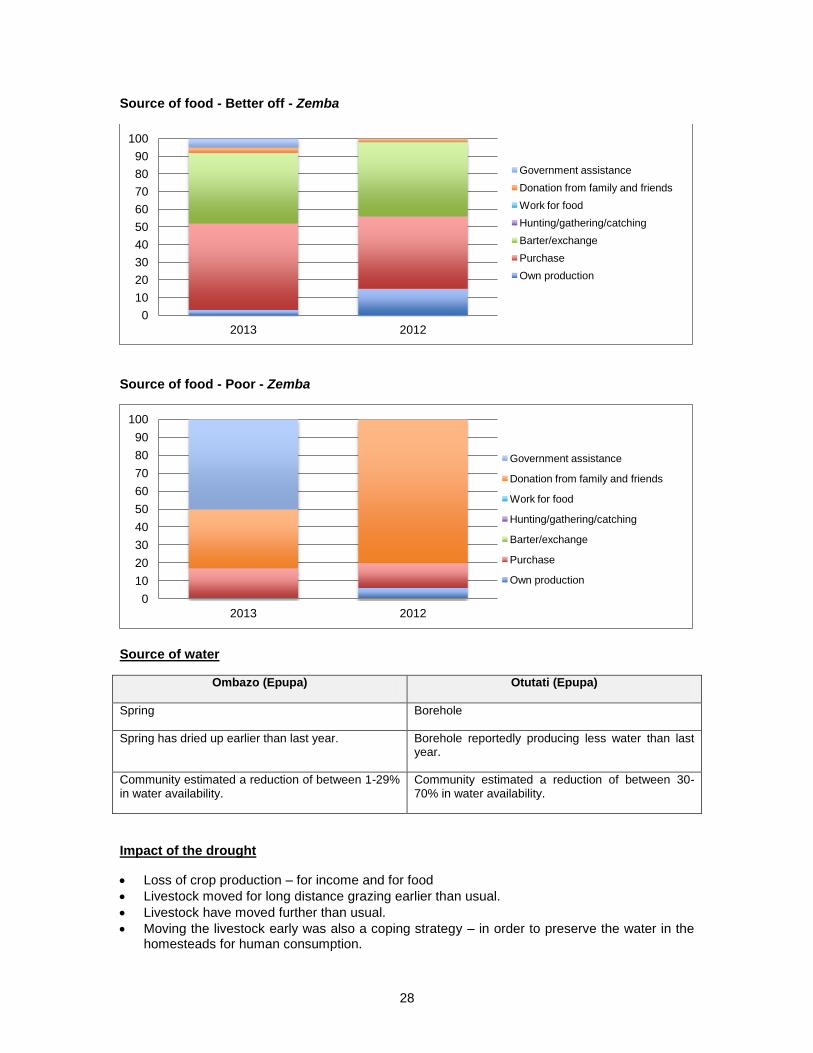
Source of food - Better off - Zemba
Source of food - Poor - Zemba
Source of water
Ombazo (Epupa) Otutati (Epupa)
Spring Borehole
Spring has dried up earlier than last year. Borehole reportedly producing less water than last year.
Community estimated a reduction of between 1-29% in water availability.
Community estimated a reduction of between 30-70% in water availability.
Impact of the drought
Loss of crop production – for income and for food
Livestock moved for long distance grazing earlier than usual.
Livestock have moved further than usual.
Moving the livestock early was also a coping strategy – in order to preserve the water in the homesteads for human consumption.
0
10
20
30
40
50
60
70
80
90
100
2013 2012
Government assistance
Donation from family and friends
Work for food
Hunting/gathering/catching
Barter/exchange
Purchase
Own production
0
10
20
30
40
50
60
70
80
90
100
2013 2012
Government assistance
Donation from family and friends
Work for food
Hunting/gathering/catching
Barter/exchange
Purchase
Own production
29
Significant drop in cattle price since 2012 means that they are generally not selling cows now.
Goats still present in homes for milk (but some households have only a few)
Better off have lost their income from crop production and now rely more heavily on their salaries
Poor are heavily dependent on casual labour for income (as well as government pensions/social assistance).
Poor households have reduced the number of meals and the amount consumed each meal. They also reported going the whole day without food at times during this month.
Poor households usually rely on casual labour for food at this time of the year. Poor households usually do casual labour for the better off in their community (such as house construction, cleaning, fetching water etc.) but this year, some households have also sent household members into Opuwo in search of more lucrative casual labour opportunities.
Coping strategies
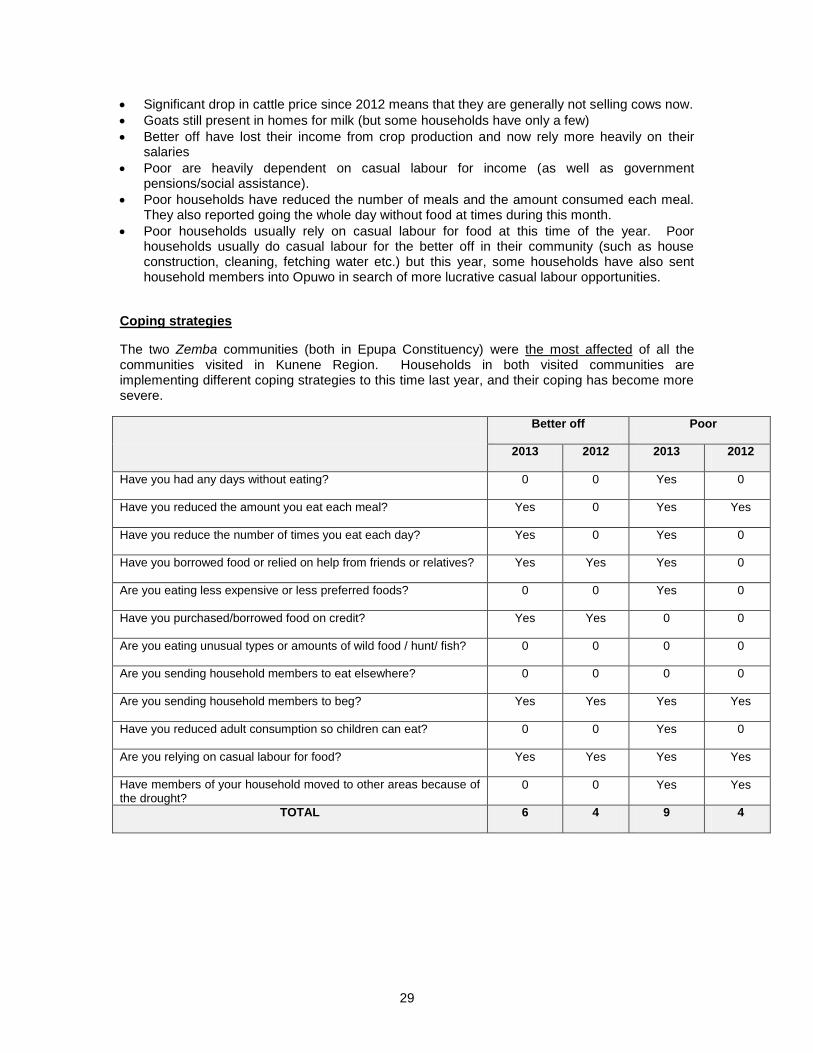
The two Zemba communities (both in Epupa Constituency) were the most affected of all the communities visited in Kunene Region. Households in both visited communities are implementing different coping strategies to this time last year, and their coping has become more severe.
Better off Poor
2013 2012 2013 2012
Have you had any days without eating? 0 0 Yes 0
Have you reduced the amount you eat each meal? Yes 0 Yes Yes
Have you reduce the number of times you eat each day? Yes 0 Yes 0
Have you borrowed food or relied on help from friends or relatives? Yes Yes Yes 0
Are you eating less expensive or less preferred foods? 0 0 Yes 0
Have you purchased/borrowed food on credit? Yes Yes 0 0
Are you eating unusual types or amounts of wild food / hunt/ fish? 0 0 0 0
Are you sending household members to eat elsewhere? 0 0 0 0
Are you sending household members to beg? Yes Yes Yes Yes
Have you reduced adult consumption so children can eat? 0 0 Yes 0
Are you relying on casual labour for food? Yes Yes Yes Yes
Have members of your household moved to other areas because of the drought?
0 0 Yes Yes
TOTAL 6 4 9 4
30
Herero
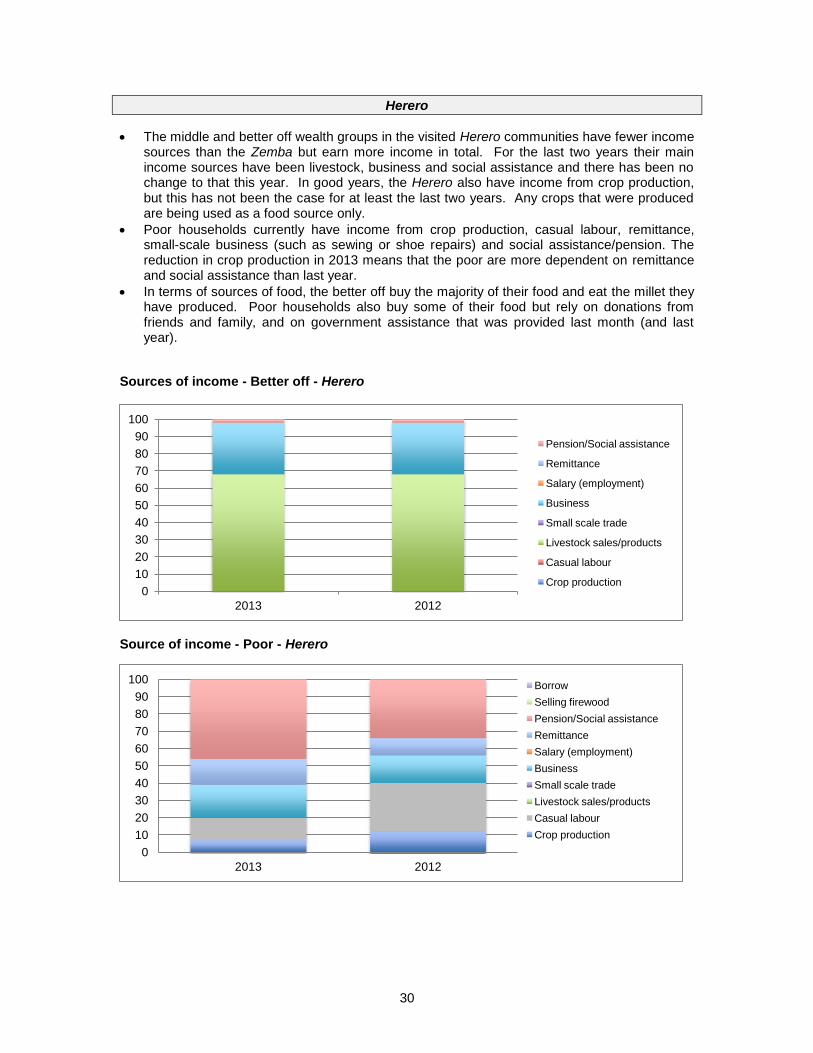
The middle and better off wealth groups in the visited Herero communities have fewer income sources than the Zemba but earn more income in total. For the last two years their main income sources have been livestock, business and social assistance and there has been no change to that this year. In good years, the Herero also have income from crop production, but this has not been the case for at least the last two years. Any crops that were produced are being used as a food source only.
Poor households currently have income from crop production, casual labour, remittance, small-scale business (such as sewing or shoe repairs) and social assistance/pension. The reduction in crop production in 2013 means that the poor are more dependent on remittance and social assistance than last year.
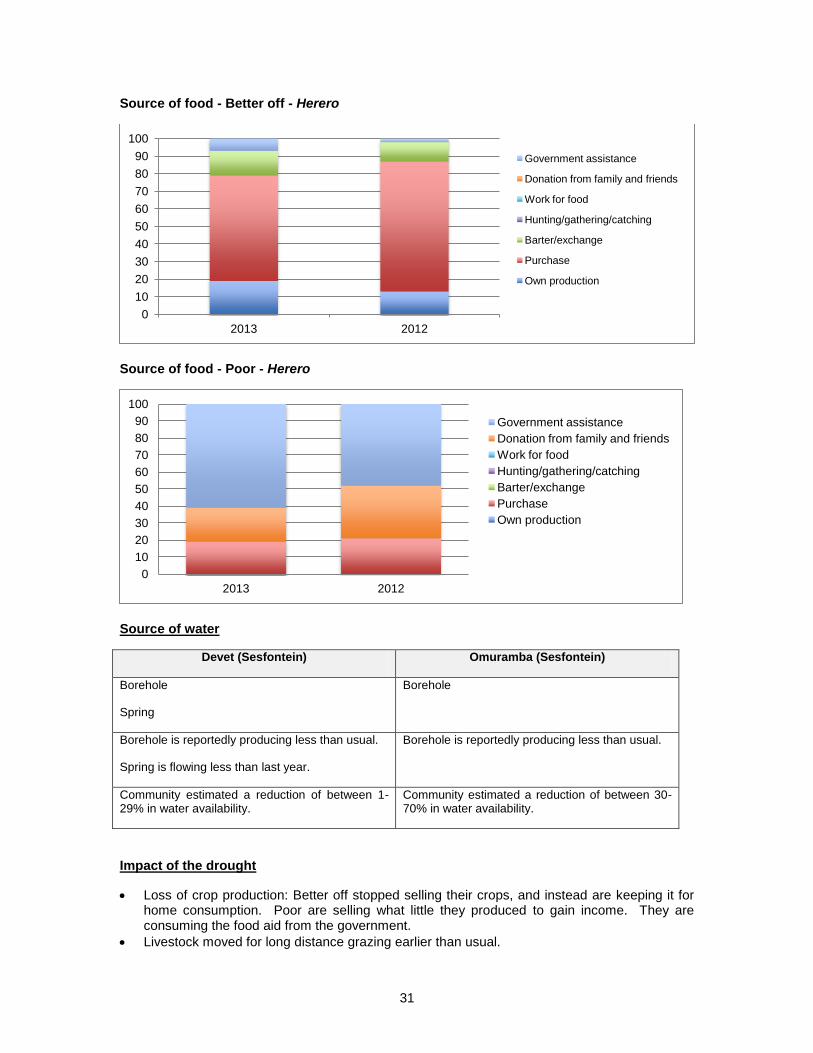
In terms of sources of food, the better off buy the majority of their food and eat the millet they have produced. Poor households also buy some of their food but rely on donations from friends and family, and on government assistance that was provided last month (and last year).
Sources of income - Better off - Herero
Source of income - Poor - Herero
0
10
20
30
40
50
60
70
80
90
100
2013 2012
Pension/Social assistance
Remittance
Salary (employment)
Business
Small scale trade
Livestock sales/products
Casual labour
Crop production
0
10
20
30
40
50
60
70
80
90
100
2013 2012
Borrow
Selling firewood
Pension/Social assistance
Remittance
Salary (employment)
Business
Small scale trade
Livestock sales/products
Casual labour
Crop production
31
Source of food - Better off - Herero
Source of food - Poor - Herero
Source of water
Devet (Sesfontein) Omuramba (Sesfontein)
Borehole
Spring
Borehole
Borehole is reportedly producing less than usual.
Spring is flowing less than last year.
Borehole is reportedly producing less than usual.
Community estimated a reduction of between 1-29% in water availability.
Community estimated a reduction of between 30-70% in water availability.
Impact of the drought
Loss of crop production: Better off stopped selling their crops, and instead are keeping it for home consumption. Poor are selling what little they produced to gain income. They are consuming the food aid from the government.
Livestock moved for long distance grazing earlier than usual.
0
10
20
30
40
50
60
70
80
90
100
2013 2012
Government assistance
Donation from family and friends
Work for food
Hunting/gathering/catching
Barter/exchange
Purchase
Own production
0
10
20
30
40
50
60
70
80
90
100
2013 2012
Government assistance
Donation from family and friends
Work for food
Hunting/gathering/catching
Barter/exchange
Purchase
Own production
32
Livestock have moved further than usual.
Goats still present in homes for milk (but some households have only a few)
Poor are heavily dependent on casual labour for income (as usual) and are working for the better off within their communities (like the Zemba). They also rely on remittance and government social assistance/pension.
Poor households have reduced the number of meals and the type of food they’re consuming (less expensive maize meal) and this was also the case at the same time of the year in 2012.
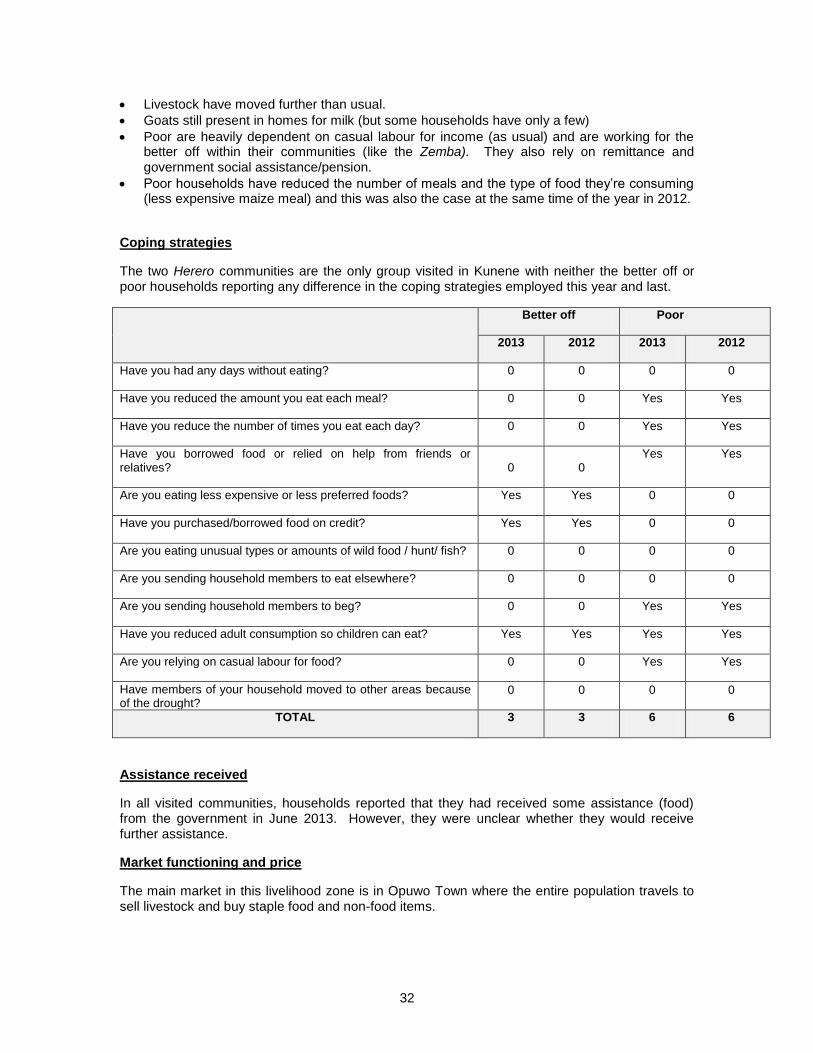
Coping strategies
The two Herero communities are the only group visited in Kunene with neither the better off or poor households reporting any difference in the coping strategies employed this year and last.
Better off Poor
2013 2012 2013 2012
Have you had any days without eating? 0 0 0 0
Have you reduced the amount you eat each meal? 0 0 Yes Yes
Have you reduce the number of times you eat each day? 0 0 Yes Yes
Have you borrowed food or relied on help from friends or relatives? 0 0
Yes Yes
Are you eating less expensive or less preferred foods? Yes Yes 0 0
Have you purchased/borrowed food on credit? Yes Yes 0 0
Are you eating unusual types or amounts of wild food / hunt/ fish? 0 0 0 0
Are you sending household members to eat elsewhere? 0 0 0 0
Are you sending household members to beg? 0 0 Yes Yes
Have you reduced adult consumption so children can eat? Yes Yes Yes Yes
Are you relying on casual labour for food? 0 0 Yes Yes
Have members of your household moved to other areas because of the drought?
0 0 0 0
TOTAL 3 3 6 6
Assistance received
In all visited communities, households reported that they had received some assistance (food) from the government in June 2013. However, they were unclear whether they would receive further assistance.
Market functioning and price
The main market in this livelihood zone is in Opuwo Town where the entire population travels to sell livestock and buy staple food and non-food items.
33
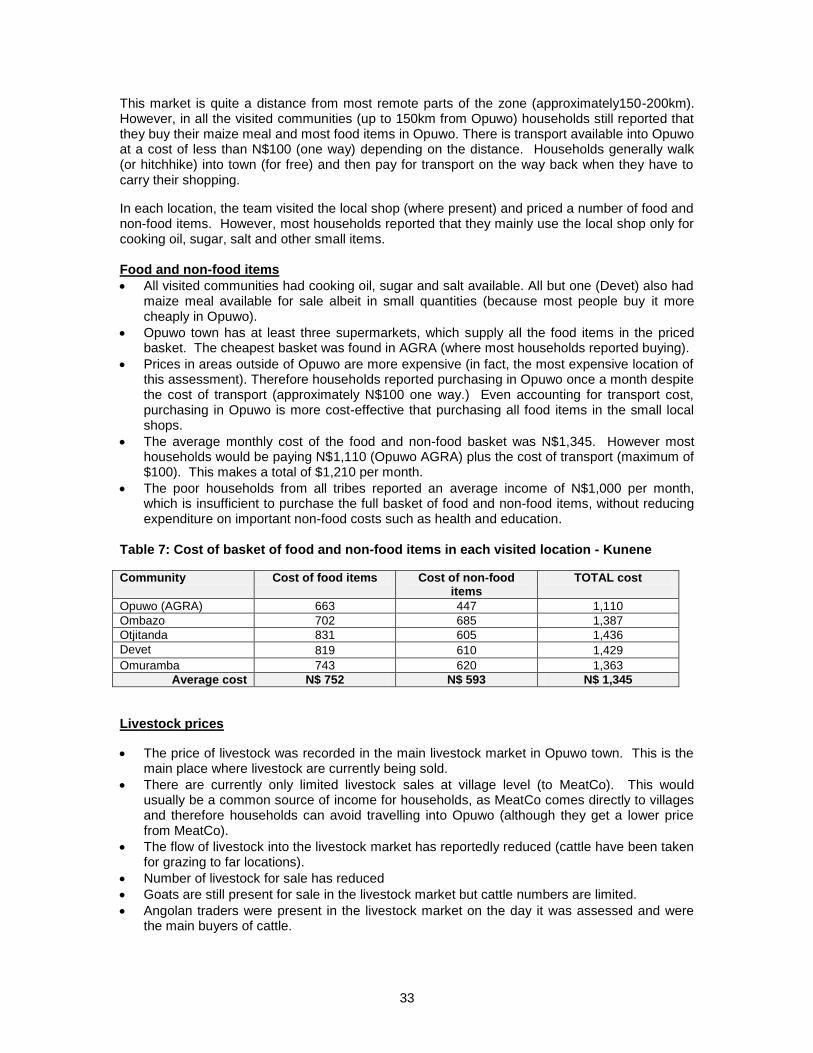
This market is quite a distance from most remote parts of the zone (approximately150-200km). However, in all the visited communities (up to 150km from Opuwo) households still reported that they buy their maize meal and most food items in Opuwo. There is transport available into Opuwo at a cost of less than N$100 (one way) depending on the distance. Households generally walk (or hitchhike) into town (for free) and then pay for transport on the way back when they have to carry their shopping.
In each location, the team visited the local shop (where present) and priced a number of food and non-food items. However, most households reported that they mainly use the local shop only for cooking oil, sugar, salt and other small items. Food and non-food items
All visited communities had cooking oil, sugar and salt available. All but one (Devet) also had maize meal available for sale albeit in small quantities (because most people buy it more cheaply in Opuwo).
Opuwo town has at least three supermarkets, which supply all the food items in the priced basket. The cheapest basket was found in AGRA (where most households reported buying).
Prices in areas outside of Opuwo are more expensive (in fact, the most expensive location of this assessment). Therefore households reported purchasing in Opuwo once a month despite the cost of transport (approximately N$100 one way.) Even accounting for transport cost, purchasing in Opuwo is more cost-effective that purchasing all food items in the small local shops.
The average monthly cost of the food and non-food basket was N$1,345. However most households would be paying N$1,110 (Opuwo AGRA) plus the cost of transport (maximum of $100). This makes a total of $1,210 per month.
The poor households from all tribes reported an average income of N$1,000 per month, which is insufficient to purchase the full basket of food and non-food items, without reducing expenditure on important non-food costs such as health and education.
Table 7: Cost of basket of food and non-food items in each visited location - Kunene
Community Cost of food items Cost of non-food items
TOTAL cost
Opuwo (AGRA) 663 447 1,110
Ombazo 702 685 1,387
Otjitanda 831 605 1,436
Devet 819 610 1,429
Omuramba 743 620 1,363
Average cost N$ 752 N$ 593 N$ 1,345
Livestock prices
The price of livestock was recorded in the main livestock market in Opuwo town. This is the main place where livestock are currently being sold.
There are currently only limited livestock sales at village level (to MeatCo). This would usually be a common source of income for households, as MeatCo comes directly to villages and therefore households can avoid travelling into Opuwo (although they get a lower price from MeatCo).
The flow of livestock into the livestock market has reportedly reduced (cattle have been taken for grazing to far locations).
Number of livestock for sale has reduced
Goats are still present for sale in the livestock market but cattle numbers are limited.
Angolan traders were present in the livestock market on the day it was assessed and were the main buyers of cattle.
34
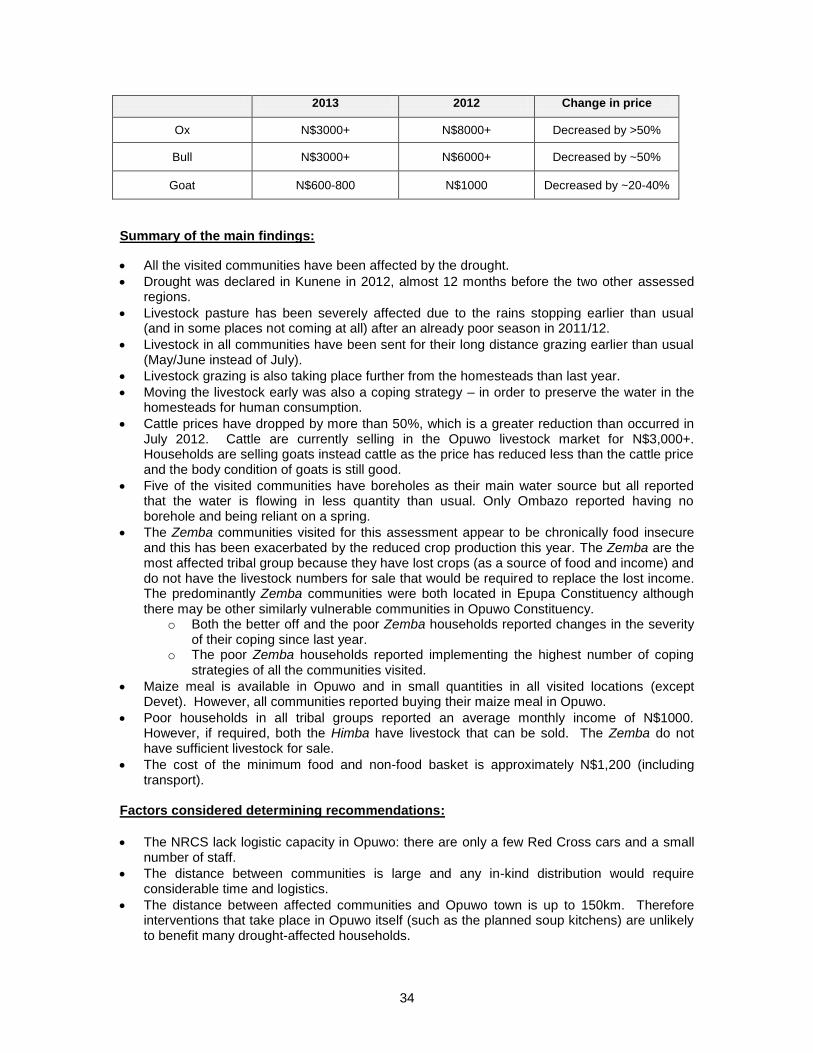
2013 2012 Change in price
Ox N$3000+ N$8000+ Decreased by >50%
Bull N$3000+ N$6000+ Decreased by ~50%
Goat N$600-800 N$1000 Decreased by ~20-40%
Summary of the main findings:
All the visited communities have been affected by the drought.
Drought was declared in Kunene in 2012, almost 12 months before the two other assessed regions.
Livestock pasture has been severely affected due to the rains stopping earlier than usual (and in some places not coming at all) after an already poor season in 2011/12.
Livestock in all communities have been sent for their long distance grazing earlier than usual (May/June instead of July).
Livestock grazing is also taking place further from the homesteads than last year.
Moving the livestock early was also a coping strategy – in order to preserve the water in the homesteads for human consumption.
Cattle prices have dropped by more than 50%, which is a greater reduction than occurred in July 2012. Cattle are currently selling in the Opuwo livestock market for N$3,000+. Households are selling goats instead cattle as the price has reduced less than the cattle price and the body condition of goats is still good.
Five of the visited communities have boreholes as their main water source but all reported that the water is flowing in less quantity than usual. Only Ombazo reported having no borehole and being reliant on a spring.
The Zemba communities visited for this assessment appear to be chronically food insecure and this has been exacerbated by the reduced crop production this year. The Zemba are the most affected tribal group because they have lost crops (as a source of food and income) and do not have the livestock numbers for sale that would be required to replace the lost income. The predominantly Zemba communities were both located in Epupa Constituency although there may be other similarly vulnerable communities in Opuwo Constituency.
o Both the better off and the poor Zemba households reported changes in the severity of their coping since last year.
o The poor Zemba households reported implementing the highest number of coping strategies of all the communities visited.
Maize meal is available in Opuwo and in small quantities in all visited locations (except Devet). However, all communities reported buying their maize meal in Opuwo.
Poor households in all tribal groups reported an average monthly income of N$1000. However, if required, both the Himba have livestock that can be sold. The Zemba do not have sufficient livestock for sale.
The cost of the minimum food and non-food basket is approximately N$1,200 (including transport).
Factors considered determining recommendations:
The NRCS lack logistic capacity in Opuwo: there are only a few Red Cross cars and a small number of staff.
The distance between communities is large and any in-kind distribution would require considerable time and logistics.
The distance between affected communities and Opuwo town is up to 150km. Therefore interventions that take place in Opuwo itself (such as the planned soup kitchens) are unlikely to benefit many drought-affected households.
35
Households usually purchase food in Opuwo and there is transport available to bring food items back at a cost of less than N$100 per household.
Providing cash would enable households the dignity to purchase their own items in Opuwo without obviously being a targeted beneficiary.
Most households already receive cash-based support from the government (social assistance/pension) and get their money either in Opuwo in the bank, or from mobile money transporters who deliver the pension money direct to the villages. Households and communities generally, are therefore already familiar with cash-based support.
Recommended interventions
It is recommended that the Red Cross intervene in affected communities in Kunene Region as first priority over the other two assessed regions. Of particular concern are communities with low livestock numbers, who depend on crops for the main source of food. These households have few (if any) saleable assets to make up the difference between their income (~$1,000 per month) and the cost of the minimum basket (~$1,210 per month). Their income gap is therefore ~N$200 per month 1. Liaise with the Office of the Prime Minister to determine if, when and for how long food aid is
going to be provided to households in the assessed constituencies, and particularly in Epupa Constituency where the visited Zemba communities are. If the government is planning food aid distribution on a regular basis from August to March, then any additional support from NRCS will not be required.
2. If food aid is going to be delivered, NRCS could assist with the physical distribution (i.e. provide human resources) rather than get involved with the procurement and distribution of goods. It would also be useful to discuss with the government about their plans to provide additional food items such as oil and sugar (high calorie foods) or protein foods (such as beans) to supplement the government maize. If NRCS has such items donated communities in Kunene should be among the locations prioritized for distribution, preferably though the government pipeline.
3. If food aid is not going to be provided on a regular basis, starting immediately, it is recommended that affected communities be provided with cash. This is because food is available in Opuwo Town and under normal circumstances households commonly purchase the majority of the food in Opuwo Town. This would be an efficient use of resources, as the majority of funding would directly benefit affected households. Providing cash would also be a more practical option than any activity that requires logistics and would be the most helpful intervention to households since food items are available in Opuwo but currently people don’t have enough income to buy what is needed. Households prefer maize as their staple food
12
and maize is an imported commodity. The supply and price of maize is therefore unlikely to be effected by the drought.
4. Communities with low livestock numbers and dependent on their crops for food should be targeted regardless of tribe of households. These are likely to be predominantly Zemba but NRCS will need to investigate further. It is not recommended to target on the basis of tribe but rather, to target all households within vulnerable communities. The predominantly Zemba communities were both located in Epupa Constituency although there may be other similarly vulnerable communities in Opuwo Constituency and in other areas.
5. The communities visited were relatively small (10-55 households) and within them, the number of “better-off” households in the predominantly Zemba communities is small. In
12
Households generally grow millet (mahangu) because it is more drought tolerant than maize. Millet is also more expensive to buy than maize therefore it is a good source of income.
36
addition, the “better off” are also implementing severe coping strategies. Therefore NRCS should consider providing cash to all households in the most affected communities to avoid the complex and time consuming process of targeting. Also, given that the better-off households are currently assisting the poorer households, any monies provided to the better off will probably be used to assist poorer community members anyway.
6. Cash should be provided on a monthly basis (until the next harvest in April). It is recommended that households be provided with at least N$200-300 per month. This average income gap between the cost of the basket and average (poor) household income is N$200 but the cost of a 50kg bag of maize in Opuwo is N$300.
7. Further investigate the planned interventions by Lutheran World Federation (LWF). If they are planning cash distributions in Kunene, it is strongly recommended that LWF and NRCS coordinate their efforts, both to avoid duplication and to harmonise the assistance (amount) to be provided.
8. The number of households to be targeted needs further investigation. The visited communities are small and the Regional Manager needs to determine how many communities should be targeted.
9. The method of cash distribution also needs further investigation. Most households do not have bank accounts, and receive their pensions and social grants by hand, delivered by agents contracted by the government. Depending on the number of households to be targeted it may also be worth investigating the possibility of providing cash by “topping-up” the government social assistance/pensions for households. There would already be a list of beneficiaries and a pipeline and delivery mechanisms in place, which would make regular delivery relatively easy (although it would likely take time to set up). Given the small number of households in each community, the recommendation for blanket targeting and the relative security of Namibia, hand-to-hand distribution of cash should also be investigated as a possible distribution method.
10. It is NOT recommended to assist with livestock interventions such as fodder or veterinary services at this point since the majority of the livestock has been moved for their long distance grazing and are therefore not easily accessible for intervention. However, providing additional water points in livestock grazing locations would be an appropriate intervention as a disaster risk reduction response for future.
11. Consider providing seeds for next year’s production or provide additional cash so that households can purchase the subsidized seed provided by the government. The GRN has provision of agricultural inputs for drought-affected crop regions is in their drought plan but this may not include Kunene Region. If seed is provided, it needs to be distributed before planting time in November.
12. The implementation of Community-based Management of Acute Malnutrition (CMAM) would be a useful programme to help ensure that cases of acute malnutrition are identified and treated early. This has already been discussed with UNICEF and it is recommended that CMAM be an ongoing programme in Kunene Region.
37
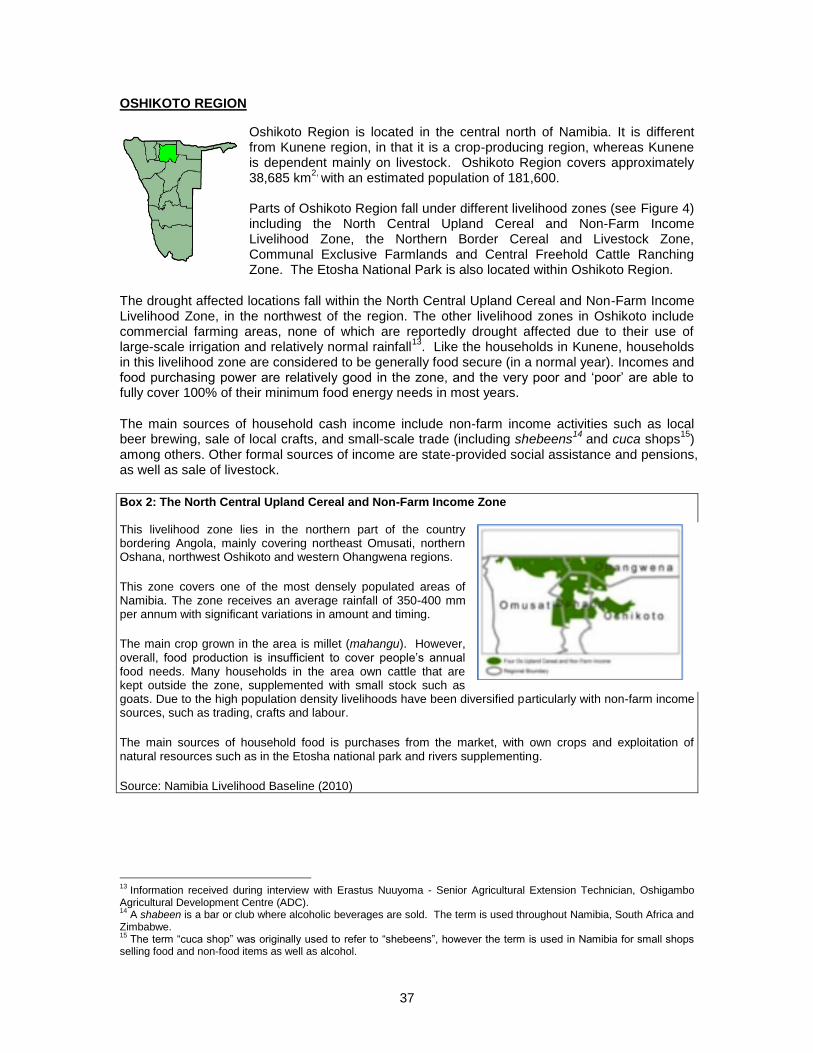
OSHIKOTO REGION
Oshikoto Region is located in the central north of Namibia. It is different from Kunene region, in that it is a crop-producing region, whereas Kunene is dependent mainly on livestock. Oshikoto Region covers approximately 38,685 km
2, with an estimated population of 181,600.
Parts of Oshikoto Region fall under different livelihood zones (see Figure 4) including the North Central Upland Cereal and Non-Farm Income Livelihood Zone, the Northern Border Cereal and Livestock Zone, Communal Exclusive Farmlands and Central Freehold Cattle Ranching Zone. The Etosha National Park is also located within Oshikoto Region.
The drought affected locations fall within the North Central Upland Cereal and Non-Farm Income Livelihood Zone, in the northwest of the region. The other livelihood zones in Oshikoto include commercial farming areas, none of which are reportedly drought affected due to their use of large-scale irrigation and relatively normal rainfall
13. Like the households in Kunene, households
in this livelihood zone are considered to be generally food secure (in a normal year). Incomes and food purchasing power are relatively good in the zone, and the very poor and ‘poor’ are able to fully cover 100% of their minimum food energy needs in most years.
The main sources of household cash income include non-farm income activities such as local beer brewing, sale of local crafts, and small-scale trade (including shebeens
14 and cuca shops
15)
among others. Other formal sources of income are state-provided social assistance and pensions, as well as sale of livestock.
Box 2: The North Central Upland Cereal and Non-Farm Income Zone
This livelihood zone lies in the northern part of the country bordering Angola, mainly covering northeast Omusati, northern Oshana, northwest Oshikoto and western Ohangwena regions.
This zone covers one of the most densely populated areas of Namibia. The zone receives an average rainfall of 350-400 mm per annum with significant variations in amount and timing.
The main crop grown in the area is millet (mahangu). However, overall, food production is insufficient to cover people’s annual food needs. Many households in the area own cattle that are kept outside the zone, supplemented with small stock such as goats. Due to the high population density livelihoods have been diversified particularly with non-farm income sources, such as trading, crafts and labour.
The main sources of household food is purchases from the market, with own crops and exploitation of natural resources such as in the Etosha national park and rivers supplementing.
Source: Namibia Livelihood Baseline (2010)
13
Information received during interview with Erastus Nuuyoma - Senior Agricultural Extension Technician, Oshigambo Agricultural Development Centre (ADC). 14
A shabeen is a bar or club where alcoholic beverages are sold. The term is used throughout Namibia, South Africa and Zimbabwe. 15
The term “cuca shop” was originally used to refer to “shebeens”, however the term is used in Namibia for small shops selling food and non-food items as well as alcohol.
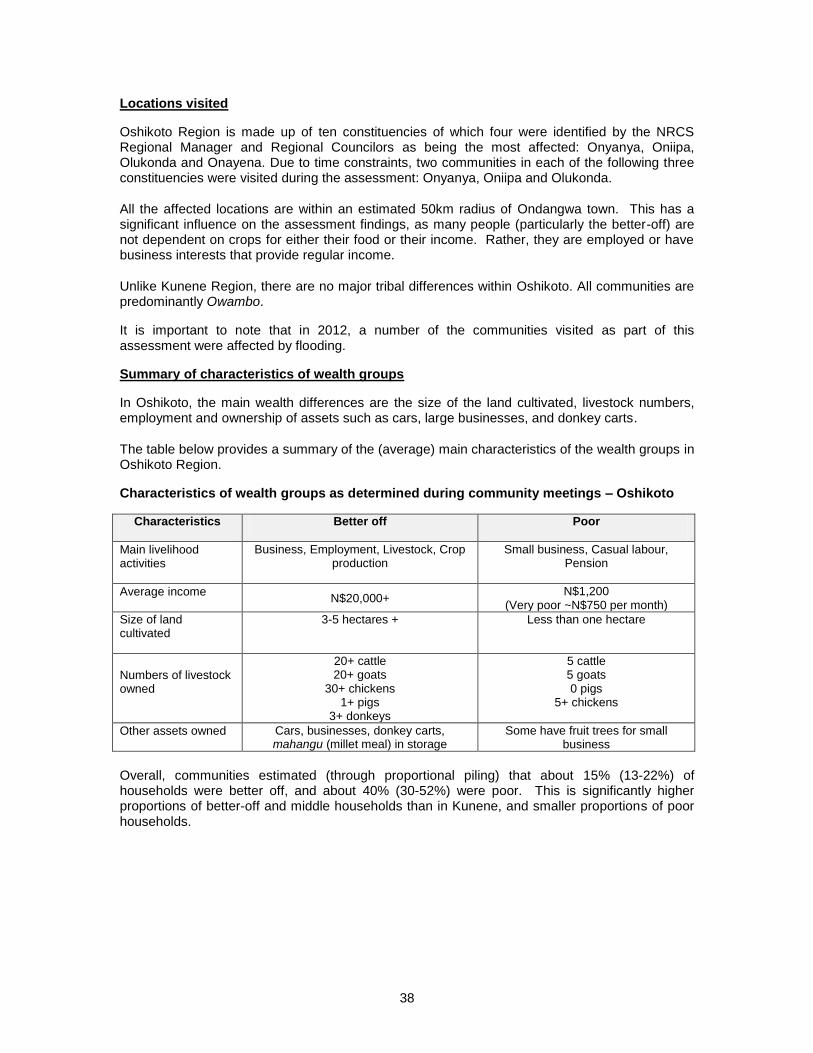
38
Locations visited
Oshikoto Region is made up of ten constituencies of which four were identified by the NRCS Regional Manager and Regional Councilors as being the most affected: Onyanya, Oniipa, Olukonda and Onayena. Due to time constraints, two communities in each of the following three constituencies were visited during the assessment: Onyanya, Oniipa and Olukonda.
All the affected locations are within an estimated 50km radius of Ondangwa town. This has a significant influence on the assessment findings, as many people (particularly the better-off) are not dependent on crops for either their food or their income. Rather, they are employed or have business interests that provide regular income.
Unlike Kunene Region, there are no major tribal differences within Oshikoto. All communities are predominantly Owambo.
It is important to note that in 2012, a number of the communities visited as part of this assessment were affected by flooding.
Summary of characteristics of wealth groups
In Oshikoto, the main wealth differences are the size of the land cultivated, livestock numbers, employment and ownership of assets such as cars, large businesses, and donkey carts.
The table below provides a summary of the (average) main characteristics of the wealth groups in Oshikoto Region.
Characteristics of wealth groups as determined during community meetings – Oshikoto
Characteristics Better off Poor
Main livelihood activities
Business, Employment, Livestock, Crop production
Small business, Casual labour, Pension
Average income N$20,000+
N$1,200 (Very poor ~N$750 per month)
Size of land cultivated
3-5 hectares + Less than one hectare
Numbers of livestock owned
20+ cattle 20+ goats
30+ chickens 1+ pigs
3+ donkeys
5 cattle 5 goats 0 pigs
5+ chickens
Other assets owned Cars, businesses, donkey carts, mahangu (millet meal) in storage
Some have fruit trees for small business
Overall, communities estimated (through proportional piling) that about 15% (13-22%) of households were better off, and about 40% (30-52%) were poor. This is significantly higher proportions of better-off and middle households than in Kunene, and smaller proportions of poor households.
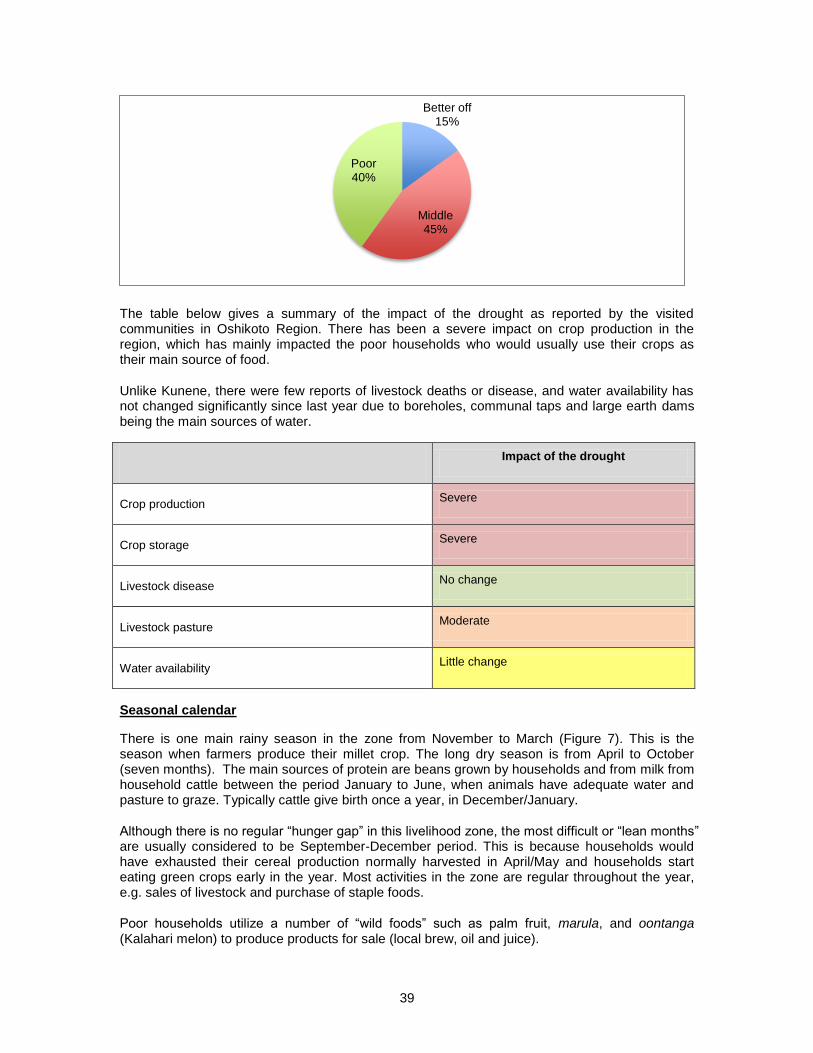
39
The table below gives a summary of the impact of the drought as reported by the visited communities in Oshikoto Region. There has been a severe impact on crop production in the region, which has mainly impacted the poor households who would usually use their crops as their main source of food.
Unlike Kunene, there were few reports of livestock deaths or disease, and water availability has not changed significantly since last year due to boreholes, communal taps and large earth dams being the main sources of water.
Impact of the drought
Crop production Severe
Crop storage Severe
Livestock disease No change
Livestock pasture Moderate
Water availability Little change
Seasonal calendar
There is one main rainy season in the zone from November to March (Figure 7). This is the season when farmers produce their millet crop. The long dry season is from April to October (seven months). The main sources of protein are beans grown by households and from milk from household cattle between the period January to June, when animals have adequate water and pasture to graze. Typically cattle give birth once a year, in December/January.
Although there is no regular “hunger gap” in this livelihood zone, the most difficult or “lean months” are usually considered to be September-December period. This is because households would have exhausted their cereal production normally harvested in April/May and households start eating green crops early in the year. Most activities in the zone are regular throughout the year, e.g. sales of livestock and purchase of staple foods.
Poor households utilize a number of “wild foods” such as palm fruit, marula, and oontanga (Kalahari melon) to produce products for sale (local brew, oil and juice).
Better off 15%
Middle 45%
Poor 40%
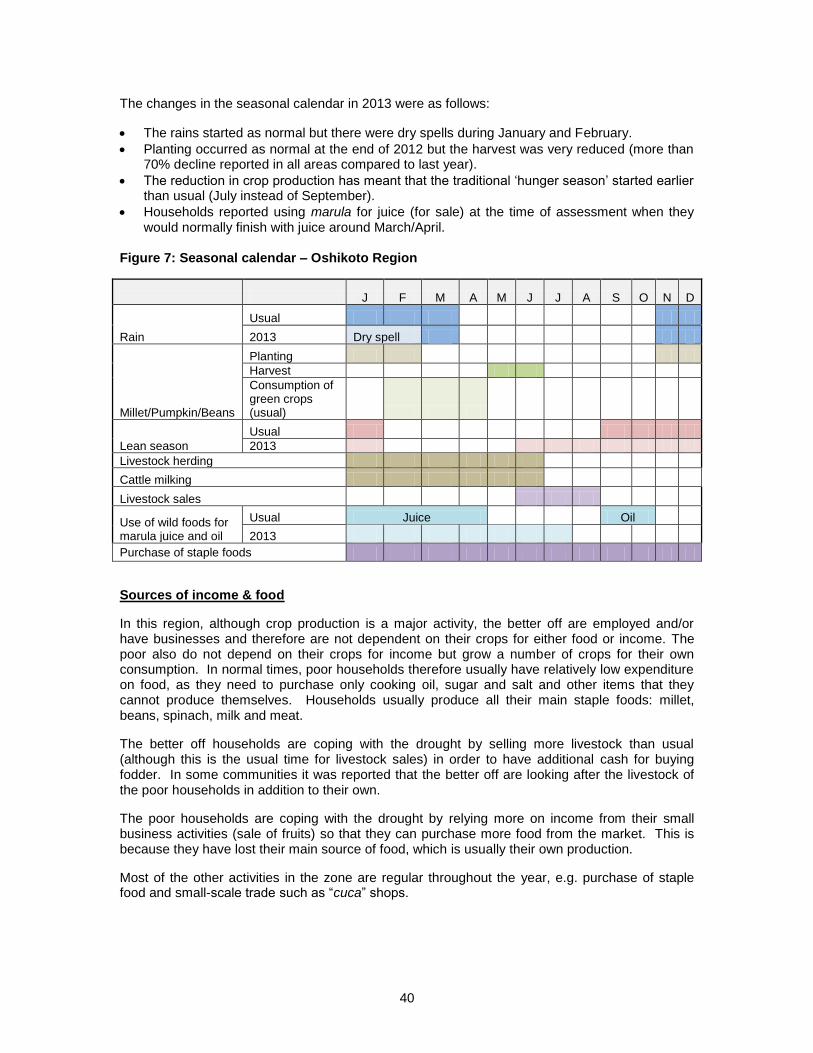
40
The changes in the seasonal calendar in 2013 were as follows:
The rains started as normal but there were dry spells during January and February.
Planting occurred as normal at the end of 2012 but the harvest was very reduced (more than 70% decline reported in all areas compared to last year).
The reduction in crop production has meant that the traditional ‘hunger season’ started earlier than usual (July instead of September).
Households reported using marula for juice (for sale) at the time of assessment when they would normally finish with juice around March/April.
Figure 7: Seasonal calendar – Oshikoto Region
J F M A M J J A S O N D
Rain
Usual
2013 Dry spell
Millet/Pumpkin/Beans
Planting
Harvest
Consumption of green crops (usual)
Lean season
Usual
2013
Livestock herding
Cattle milking
Livestock sales
Use of wild foods for marula juice and oil
Usual Juice Oil
2013
Purchase of staple foods
Sources of income & food
In this region, although crop production is a major activity, the better off are employed and/or have businesses and therefore are not dependent on their crops for either food or income. The poor also do not depend on their crops for income but grow a number of crops for their own consumption. In normal times, poor households therefore usually have relatively low expenditure on food, as they need to purchase only cooking oil, sugar and salt and other items that they cannot produce themselves. Households usually produce all their main staple foods: millet, beans, spinach, milk and meat.
The better off households are coping with the drought by selling more livestock than usual (although this is the usual time for livestock sales) in order to have additional cash for buying fodder. In some communities it was reported that the better off are looking after the livestock of the poor households in addition to their own.
The poor households are coping with the drought by relying more on income from their small business activities (sale of fruits) so that they can purchase more food from the market. This is because they have lost their main source of food, which is usually their own production.
Most of the other activities in the zone are regular throughout the year, e.g. purchase of staple food and small-scale trade such as “cuca” shops.
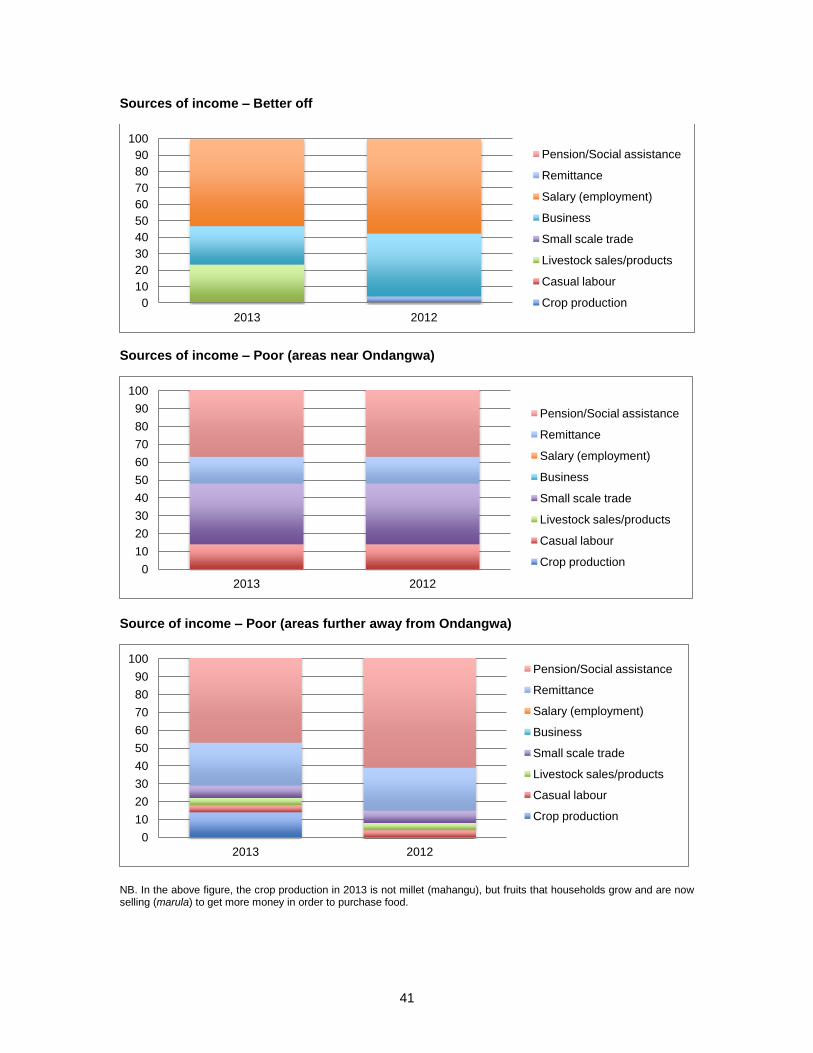
41
Sources of income – Better off
Sources of income – Poor (areas near Ondangwa)
Source of income – Poor (areas further away from Ondangwa)
NB. In the above figure, the crop production in 2013 is not millet (mahangu), but fruits that households grow and are now selling (marula) to get more money in order to purchase food.
0
10
20
30
40
50
60
70
80
90
100
2013 2012
Pension/Social assistance
Remittance
Salary (employment)
Business
Small scale trade
Livestock sales/products
Casual labour
Crop production
0
10
20
30
40
50
60
70
80
90
100
2013 2012
Pension/Social assistance
Remittance
Salary (employment)
Business
Small scale trade
Livestock sales/products
Casual labour
Crop production
0
10
20
30
40
50
60
70
80
90
100
2013 2012
Pension/Social assistance
Remittance
Salary (employment)
Business
Small scale trade
Livestock sales/products
Casual labour
Crop production
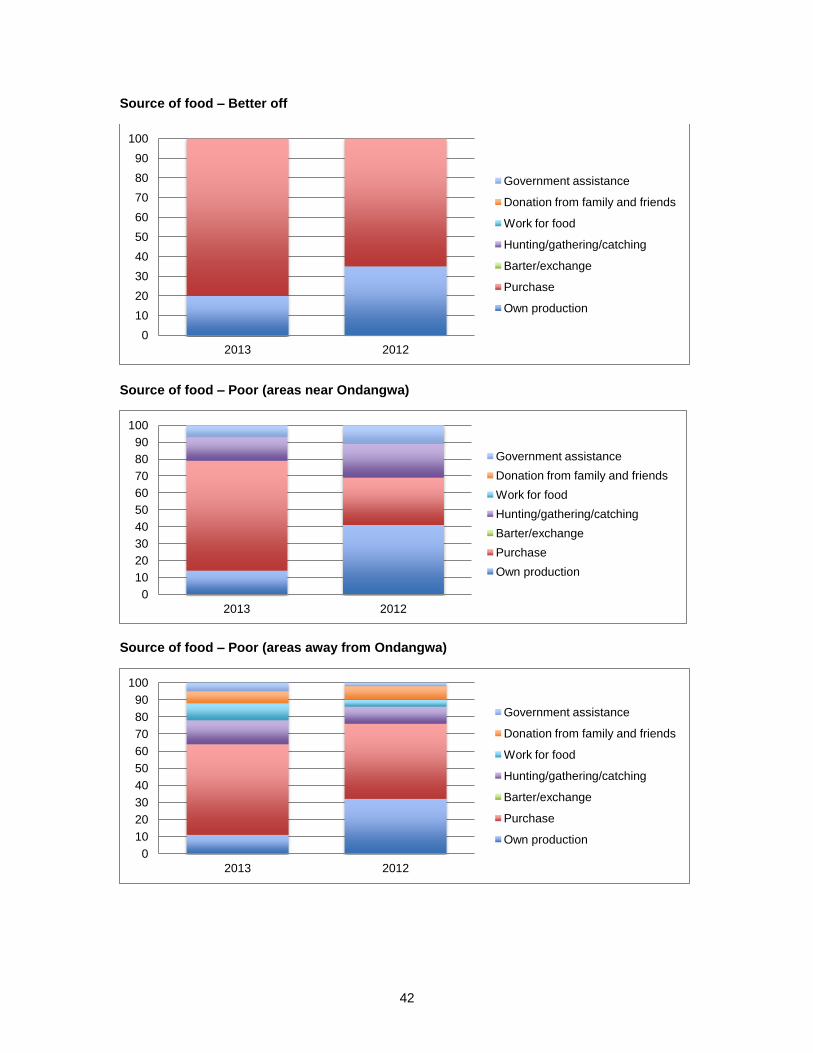
42
Source of food – Better off
Source of food – Poor (areas near Ondangwa)
Source of food – Poor (areas away from Ondangwa)
0
10
20
30
40
50
60
70
80
90
100
2013 2012
Government assistance
Donation from family and friends
Work for food
Hunting/gathering/catching
Barter/exchange
Purchase
Own production
0
10
20
30
40
50
60
70
80
90
100
2013 2012
Government assistance
Donation from family and friends
Work for food
Hunting/gathering/catching
Barter/exchange
Purchase
Own production
0
10
20
30
40
50
60
70
80
90
100
2013 2012
Government assistance
Donation from family and friends
Work for food
Hunting/gathering/catching
Barter/exchange
Purchase
Own production
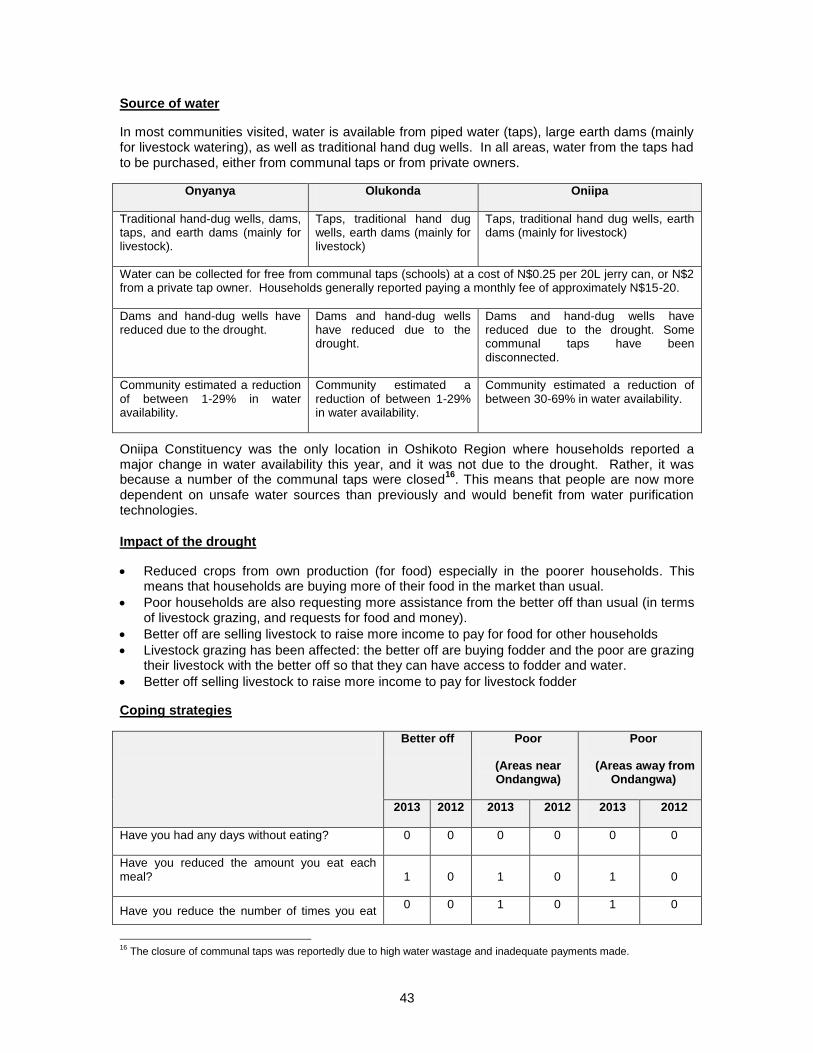
43
Source of water
In most communities visited, water is available from piped water (taps), large earth dams (mainly for livestock watering), as well as traditional hand dug wells. In all areas, water from the taps had to be purchased, either from communal taps or from private owners.
Onyanya Olukonda Oniipa
Traditional hand-dug wells, dams, taps, and earth dams (mainly for livestock).
Taps, traditional hand dug wells, earth dams (mainly for livestock)
Taps, traditional hand dug wells, earth dams (mainly for livestock)
Water can be collected for free from communal taps (schools) at a cost of N$0.25 per 20L jerry can, or N$2 from a private tap owner. Households generally reported paying a monthly fee of approximately N$15-20.
Dams and hand-dug wells have reduced due to the drought.
Dams and hand-dug wells have reduced due to the drought.
Dams and hand-dug wells have reduced due to the drought. Some communal taps have been disconnected.
Community estimated a reduction of between 1-29% in water availability.
Community estimated a reduction of between 1-29% in water availability.
Community estimated a reduction of between 30-69% in water availability.
Oniipa Constituency was the only location in Oshikoto Region where households reported a major change in water availability this year, and it was not due to the drought. Rather, it was because a number of the communal taps were closed
16. This means that people are now more
dependent on unsafe water sources than previously and would benefit from water purification technologies.
Impact of the drought
Reduced crops from own production (for food) especially in the poorer households. This means that households are buying more of their food in the market than usual.
Poor households are also requesting more assistance from the better off than usual (in terms of livestock grazing, and requests for food and money).
Better off are selling livestock to raise more income to pay for food for other households
Livestock grazing has been affected: the better off are buying fodder and the poor are grazing their livestock with the better off so that they can have access to fodder and water.
Better off selling livestock to raise more income to pay for livestock fodder
Coping strategies
Better off Poor
(Areas near Ondangwa)
Poor
(Areas away from Ondangwa)
2013 2012 2013 2012 2013 2012
Have you had any days without eating? 0 0 0 0 0 0
Have you reduced the amount you eat each meal? 1 0 1 0 1 0
Have you reduce the number of times you eat 0 0 1 0 1 0
16
The closure of communal taps was reportedly due to high water wastage and inadequate payments made.
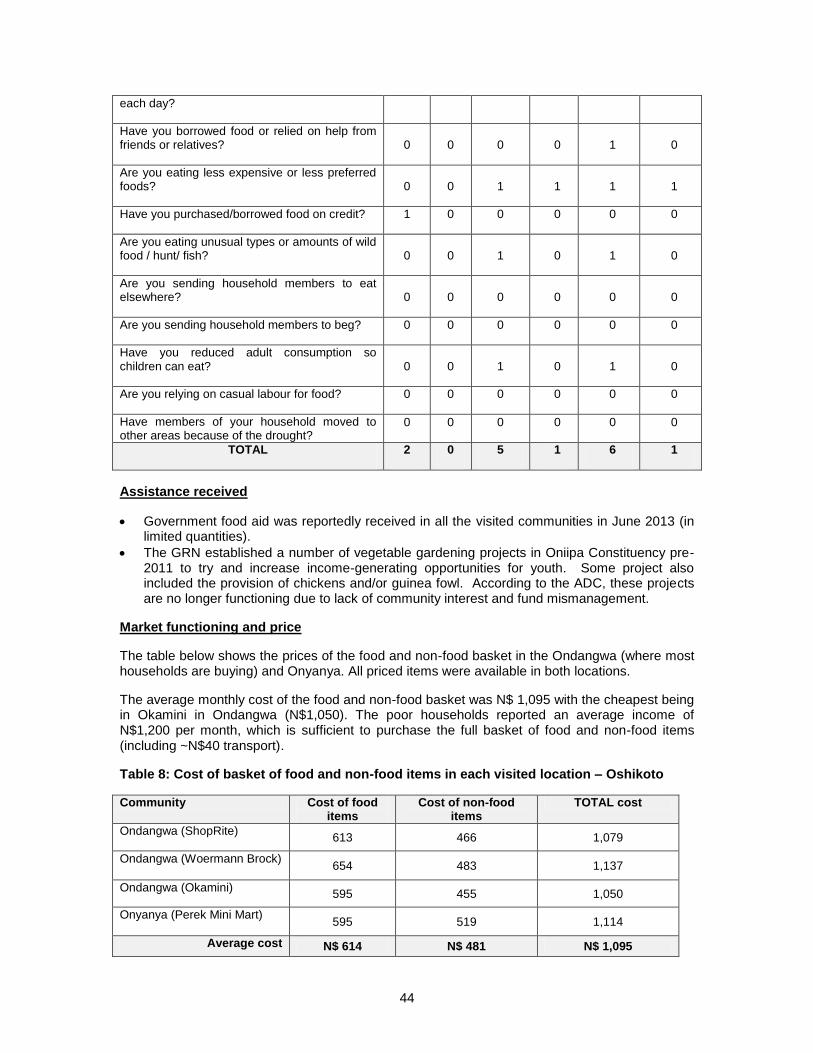
44
each day?
Have you borrowed food or relied on help from friends or relatives? 0 0 0 0 1 0
Are you eating less expensive or less preferred foods? 0 0 1 1 1 1
Have you purchased/borrowed food on credit? 1 0 0 0 0 0
Are you eating unusual types or amounts of wild food / hunt/ fish? 0 0 1 0 1 0
Are you sending household members to eat elsewhere? 0 0 0 0 0 0
Are you sending household members to beg? 0 0 0 0 0 0
Have you reduced adult consumption so children can eat? 0 0 1 0 1 0
Are you relying on casual labour for food? 0 0 0 0 0 0
Have members of your household moved to other areas because of the drought?
0 0 0 0 0 0
TOTAL 2 0 5 1 6 1
Assistance received
Government food aid was reportedly received in all the visited communities in June 2013 (in limited quantities).
The GRN established a number of vegetable gardening projects in Oniipa Constituency pre-2011 to try and increase income-generating opportunities for youth. Some project also included the provision of chickens and/or guinea fowl. According to the ADC, these projects are no longer functioning due to lack of community interest and fund mismanagement.
Market functioning and price
The table below shows the prices of the food and non-food basket in the Ondangwa (where most households are buying) and Onyanya. All priced items were available in both locations.
The average monthly cost of the food and non-food basket was N$ 1,095 with the cheapest being in Okamini in Ondangwa (N$1,050). The poor households reported an average income of N$1,200 per month, which is sufficient to purchase the full basket of food and non-food items (including ~N$40 transport).
Table 8: Cost of basket of food and non-food items in each visited location – Oshikoto
Community Cost of food items
Cost of non-food items
TOTAL cost
Ondangwa (ShopRite) 613 466 1,079
Ondangwa (Woermann Brock) 654 483 1,137
Ondangwa (Okamini) 595 455 1,050
Onyanya (Perek Mini Mart) 595 519 1,114
Average cost N$ 614 N$ 481 N$ 1,095
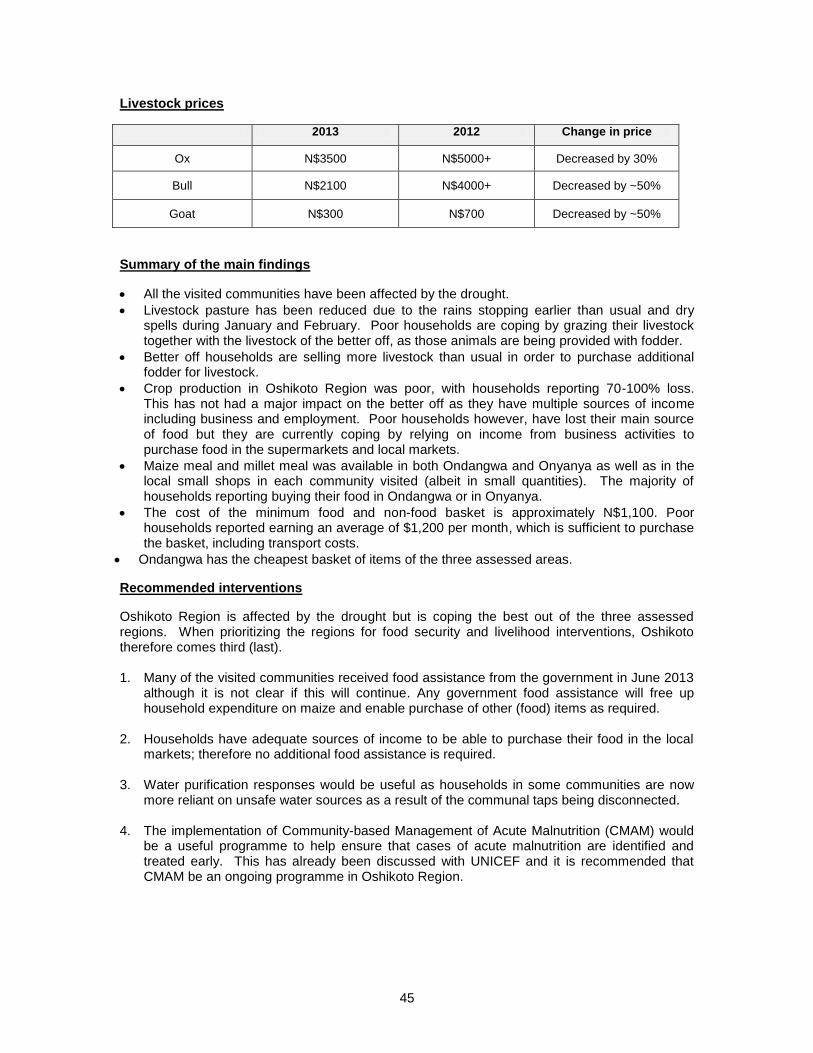
45
Livestock prices
2013 2012 Change in price
Ox N$3500 N$5000+ Decreased by 30%
Bull N$2100 N$4000+ Decreased by ~50%
Goat N$300 N$700 Decreased by ~50%
Summary of the main findings
All the visited communities have been affected by the drought.
Livestock pasture has been reduced due to the rains stopping earlier than usual and dry spells during January and February. Poor households are coping by grazing their livestock together with the livestock of the better off, as those animals are being provided with fodder.
Better off households are selling more livestock than usual in order to purchase additional fodder for livestock.
Crop production in Oshikoto Region was poor, with households reporting 70-100% loss. This has not had a major impact on the better off as they have multiple sources of income including business and employment. Poor households however, have lost their main source of food but they are currently coping by relying on income from business activities to purchase food in the supermarkets and local markets.
Maize meal and millet meal was available in both Ondangwa and Onyanya as well as in the local small shops in each community visited (albeit in small quantities). The majority of households reporting buying their food in Ondangwa or in Onyanya.
The cost of the minimum food and non-food basket is approximately N$1,100. Poor households reported earning an average of $1,200 per month, which is sufficient to purchase the basket, including transport costs.
Ondangwa has the cheapest basket of items of the three assessed areas.
Recommended interventions
Oshikoto Region is affected by the drought but is coping the best out of the three assessed regions. When prioritizing the regions for food security and livelihood interventions, Oshikoto therefore comes third (last). 1. Many of the visited communities received food assistance from the government in June 2013
although it is not clear if this will continue. Any government food assistance will free up household expenditure on maize and enable purchase of other (food) items as required.
2. Households have adequate sources of income to be able to purchase their food in the local markets; therefore no additional food assistance is required.
3. Water purification responses would be useful as households in some communities are now more reliant on unsafe water sources as a result of the communal taps being disconnected.
4. The implementation of Community-based Management of Acute Malnutrition (CMAM) would be a useful programme to help ensure that cases of acute malnutrition are identified and treated early. This has already been discussed with UNICEF and it is recommended that CMAM be an ongoing programme in Oshikoto Region.
46
KAVANGO REGION
Kavango Region is located in north eastern Namibia. The majority of the population lives in the north of the region along the Kavango River. The central and southern parts of the region have little infrastructure and support a sparse population. Kavango Region covers approximately 43,418 km²
,
with an estimated population of 222,500.
The northern part of Kavango region falls under the Northern Border Upland Cereal and Livestock Zone. All the visited communities fall into this livelihood zone.
Box 3: Northern Border Upland Cereal and Livestock Zone
The Northern Border Upland Cereal and Livestock Zone is mainly located in the North central part of Namibia, stretching towards the east in Kavango and Caprivi regions of the country.
It receives an average of 550-600mm of rainfall between December and March. The soils are mainly a mixture of sandy loam and sandy soils making it suitable for the cropping of small grains such as millet (mahangu) and sorghum. Other crops produced in the area include beans, groundnuts, sweet potatoes, pumpkins and melons.
Access to livestock markets for the sale of livestock is limited due to the veterinary cordon fence, which separates the North from Central and Southern Namibia.
The population in this zone mainly relies on off-farm income for their basic sources of food and cash income. Other sources of income include employment, business and social pensions as well as some cash remittances. This has a number of implications for the people’s livelihood. The main sources of household food in addition to own crops are labour exchange for food, purchases from the local markets and collection of wild fruits such as “marula” in the community forests.
The dependence on poorly paid and seasonally available unskilled labour is the main cause of the current poverty trap among the poorest households.
Source: Namibia Livelihood Baseline (2010)
Locations visited
Kavango Region is made up of nine constituencies of which two locations were identified as being most affected: Mukwe Constituency (260km west of Rundu) and the rural areas immediately around Rundu Town (Rundu Rural East Constituency, and Rundu Rural West Constituency). Two communities were visited in each of these constituencies.
The two main tribes in the visited communities are Kwangali and Mbukushu but there were no major differences in livelihood strategies identified between tribes.
Summary of characteristics of wealth groups
In Kavango Region, there were considerable differences in the situation of “the better off” in the communities visited within the drought-affected communities. In the Rundu Rural Constituencies “the better off” compared similarly to “the poor” in Mukwe Constituency. This is an indication of chronic poverty in parts of the rural areas immediately around Rundu Town.
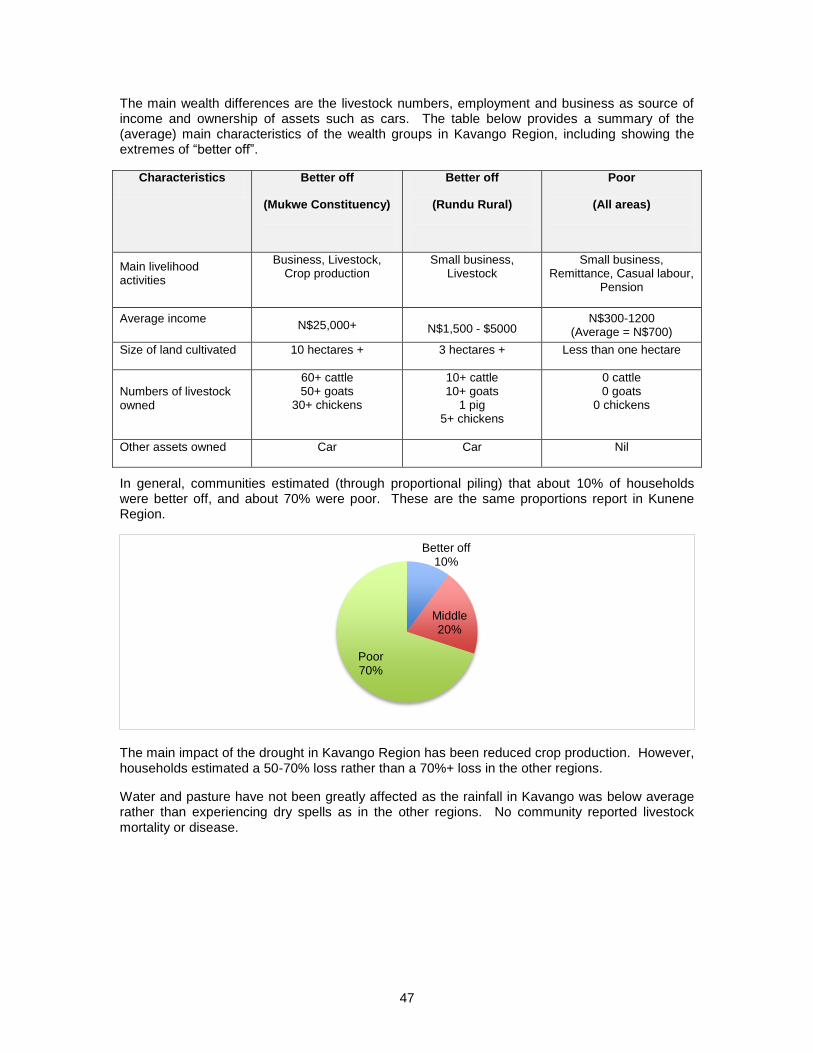
47
The main wealth differences are the livestock numbers, employment and business as source of income and ownership of assets such as cars. The table below provides a summary of the (average) main characteristics of the wealth groups in Kavango Region, including showing the extremes of “better off”.
Characteristics Better off
(Mukwe Constituency)
Better off
(Rundu Rural)
Poor
(All areas)
Main livelihood activities
Business, Livestock, Crop production
Small business, Livestock
Small business, Remittance, Casual labour,
Pension
Average income N$25,000+
N$1,500 - $5000
N$300-1200 (Average = N$700)
Size of land cultivated 10 hectares + 3 hectares + Less than one hectare
Numbers of livestock owned
60+ cattle 50+ goats
30+ chickens
10+ cattle 10+ goats
1 pig 5+ chickens
0 cattle 0 goats
0 chickens
Other assets owned Car Car Nil
In general, communities estimated (through proportional piling) that about 10% of households were better off, and about 70% were poor. These are the same proportions report in Kunene Region.
The main impact of the drought in Kavango Region has been reduced crop production. However, households estimated a 50-70% loss rather than a 70%+ loss in the other regions.
Water and pasture have not been greatly affected as the rainfall in Kavango was below average rather than experiencing dry spells as in the other regions. No community reported livestock mortality or disease.
Better off 10%
Middle 20%
Poor 70%
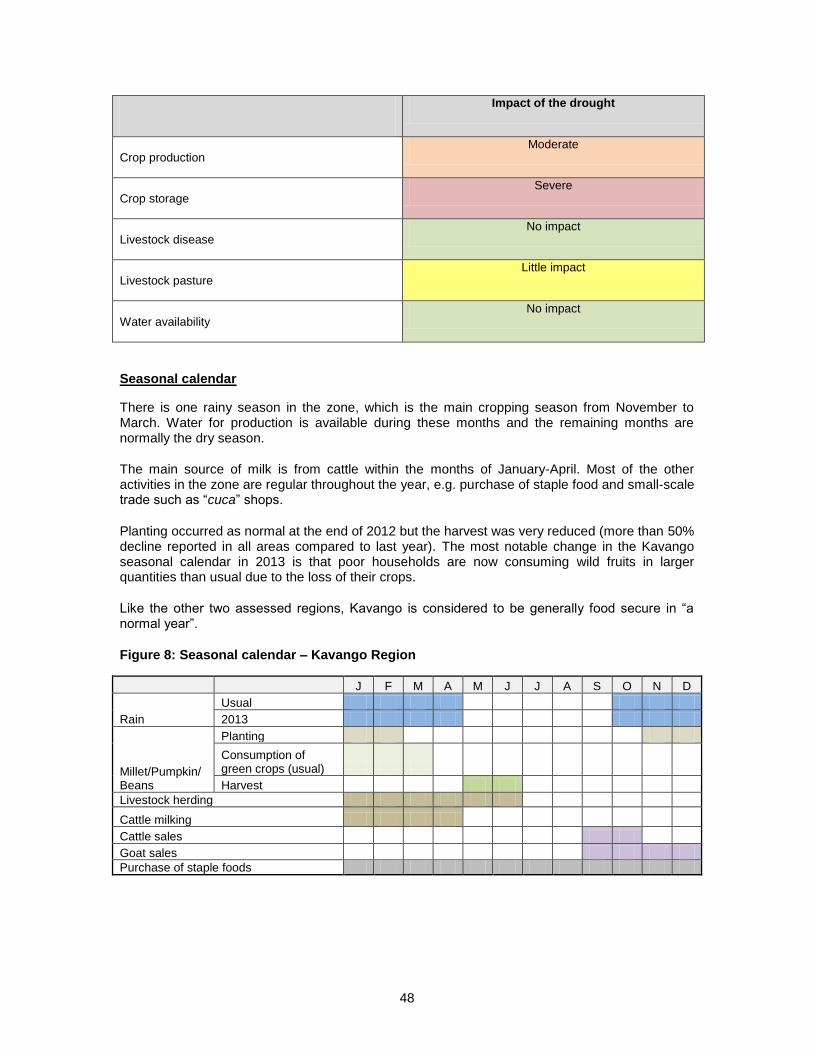
48
Impact of the drought
Crop production Moderate
Crop storage Severe
Livestock disease No impact
Livestock pasture Little impact
Water availability No impact
Seasonal calendar
There is one rainy season in the zone, which is the main cropping season from November to March. Water for production is available during these months and the remaining months are normally the dry season.
The main source of milk is from cattle within the months of January-April. Most of the other activities in the zone are regular throughout the year, e.g. purchase of staple food and small-scale trade such as “cuca” shops.
Planting occurred as normal at the end of 2012 but the harvest was very reduced (more than 50% decline reported in all areas compared to last year). The most notable change in the Kavango seasonal calendar in 2013 is that poor households are now consuming wild fruits in larger quantities than usual due to the loss of their crops.
Like the other two assessed regions, Kavango is considered to be generally food secure in “a normal year”.
Figure 8: Seasonal calendar – Kavango Region
J F M A M J J A S O N D
Rain
Usual
2013
Millet/Pumpkin/Beans
Planting
Consumption of green crops (usual)
Harvest
Livestock herding
Cattle milking
Cattle sales
Goat sales
Purchase of staple foods
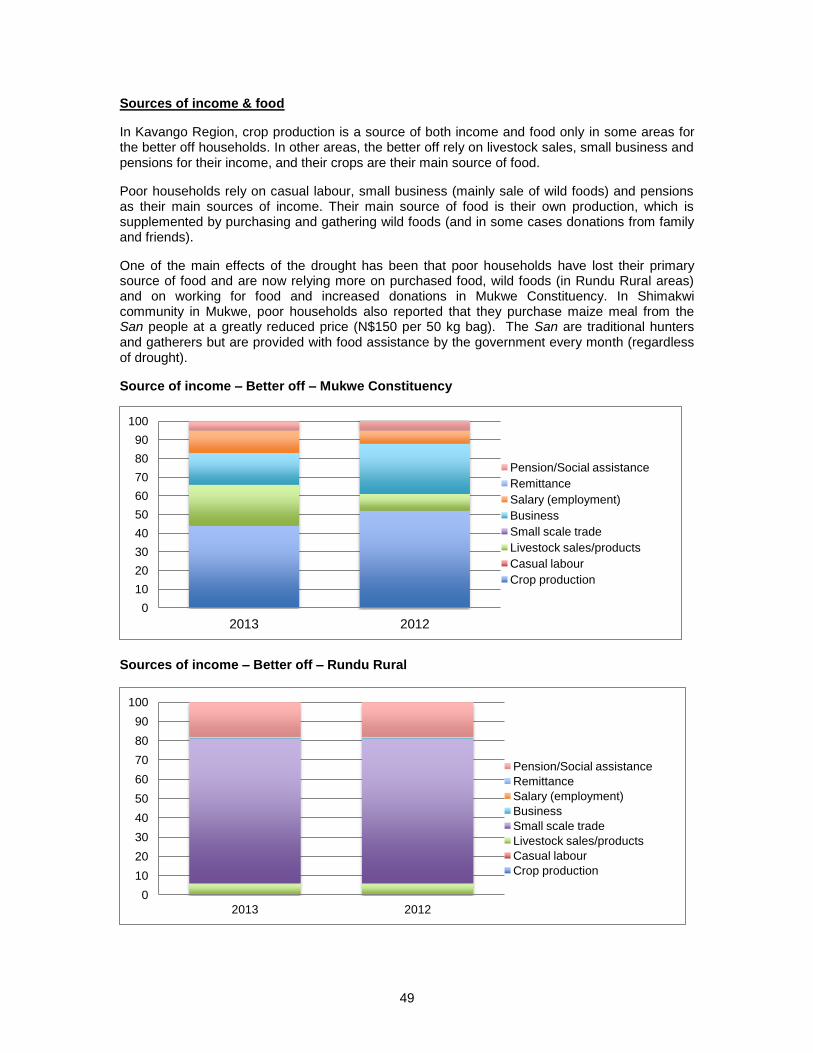
49
Sources of income & food
In Kavango Region, crop production is a source of both income and food only in some areas for the better off households. In other areas, the better off rely on livestock sales, small business and pensions for their income, and their crops are their main source of food.
Poor households rely on casual labour, small business (mainly sale of wild foods) and pensions as their main sources of income. Their main source of food is their own production, which is supplemented by purchasing and gathering wild foods (and in some cases donations from family and friends).
One of the main effects of the drought has been that poor households have lost their primary source of food and are now relying more on purchased food, wild foods (in Rundu Rural areas) and on working for food and increased donations in Mukwe Constituency. In Shimakwi community in Mukwe, poor households also reported that they purchase maize meal from the San people at a greatly reduced price (N$150 per 50 kg bag). The San are traditional hunters and gatherers but are provided with food assistance by the government every month (regardless of drought).
Source of income – Better off – Mukwe Constituency
Sources of income – Better off – Rundu Rural
0
10
20
30
40
50
60
70
80
90
100
2013 2012
Pension/Social assistance
Remittance
Salary (employment)
Business
Small scale trade
Livestock sales/products
Casual labour
Crop production
0
10
20
30
40
50
60
70
80
90
100
2013 2012
Pension/Social assistance
Remittance
Salary (employment)
Business
Small scale trade
Livestock sales/products
Casual labour
Crop production
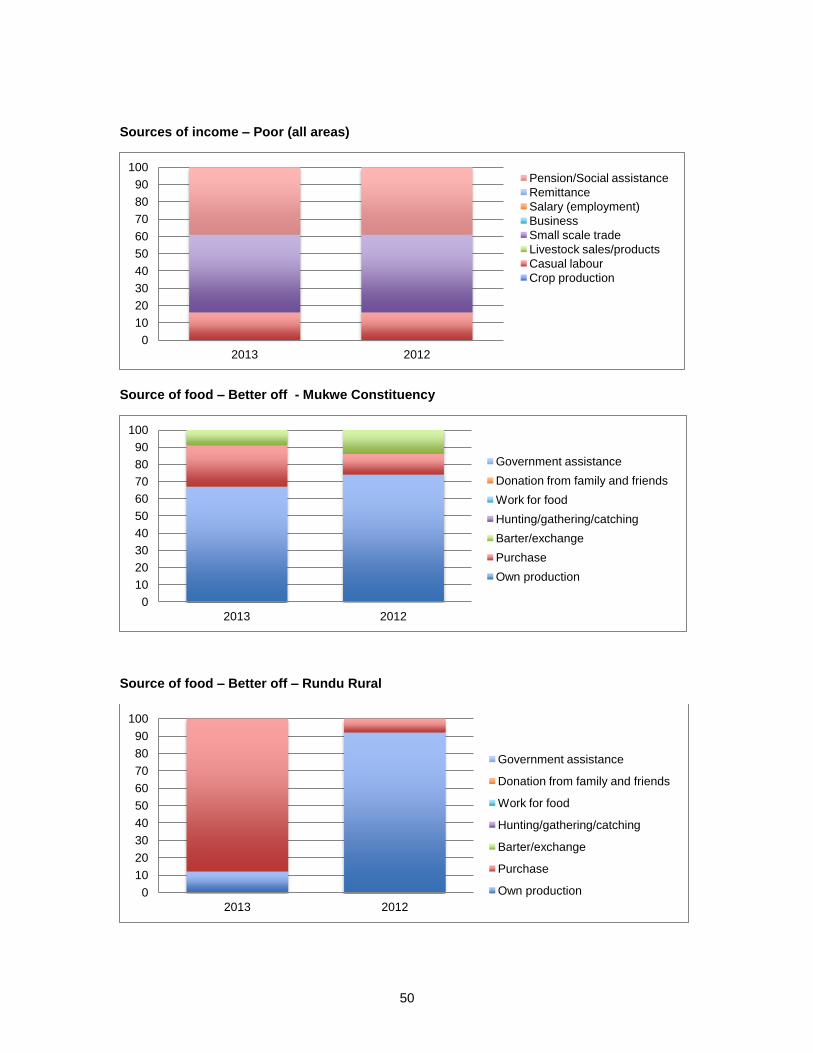
50
Sources of income – Poor (all areas)
Source of food – Better off - Mukwe Constituency
Source of food – Better off – Rundu Rural
0
10
20
30
40
50
60
70
80
90
100
2013 2012
Pension/Social assistance
Remittance
Salary (employment)
Business
Small scale trade
Livestock sales/products
Casual labour
Crop production
0
10
20
30
40
50
60
70
80
90
100
2013 2012
Government assistance
Donation from family and friends
Work for food
Hunting/gathering/catching
Barter/exchange
Purchase
Own production
0
10
20
30
40
50
60
70
80
90
100
2013 2012
Government assistance
Donation from family and friends
Work for food
Hunting/gathering/catching
Barter/exchange
Purchase
Own production
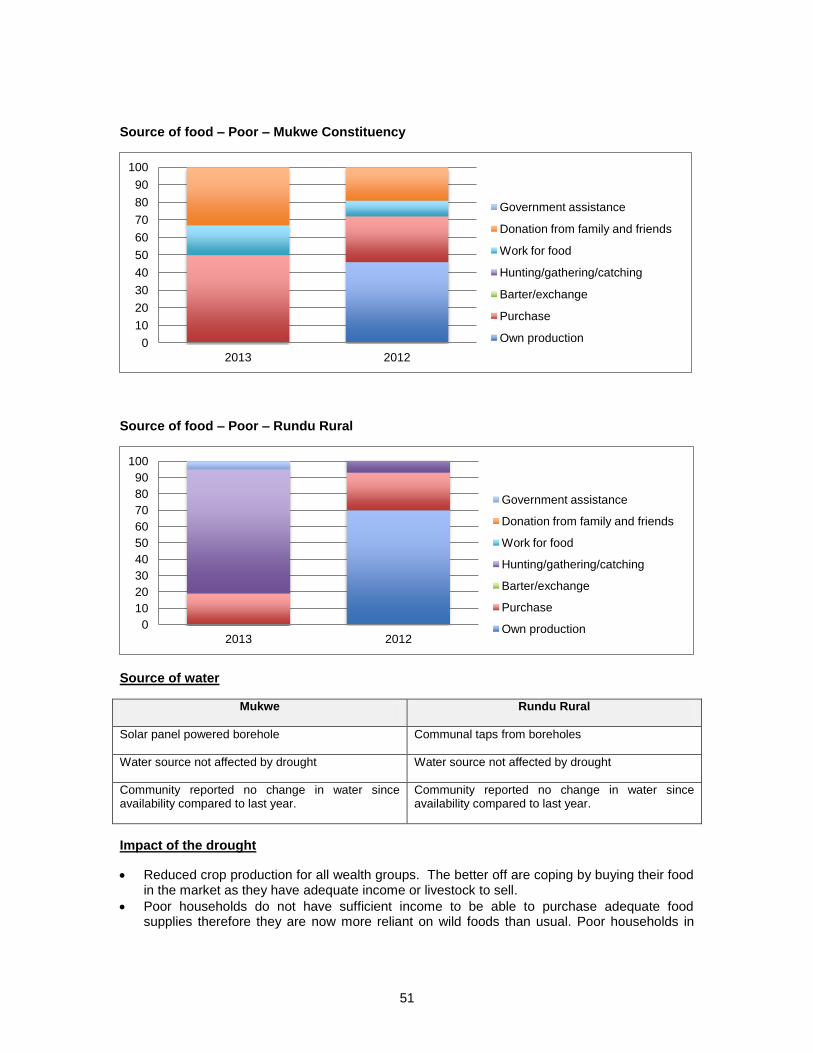
51
Source of food – Poor – Mukwe Constituency
Source of food – Poor – Rundu Rural
Source of water
Mukwe Rundu Rural
Solar panel powered borehole Communal taps from boreholes
Water source not affected by drought Water source not affected by drought
Community reported no change in water since availability compared to last year.
Community reported no change in water since availability compared to last year.
Impact of the drought
Reduced crop production for all wealth groups. The better off are coping by buying their food in the market as they have adequate income or livestock to sell.
Poor households do not have sufficient income to be able to purchase adequate food supplies therefore they are now more reliant on wild foods than usual. Poor households in
0
10
20
30
40
50
60
70
80
90
100
2013 2012
Government assistance
Donation from family and friends
Work for food
Hunting/gathering/catching
Barter/exchange
Purchase
Own production
0
10
20
30
40
50
60
70
80
90
100
2013 2012
Government assistance
Donation from family and friends
Work for food
Hunting/gathering/catching
Barter/exchange
Purchase
Own production
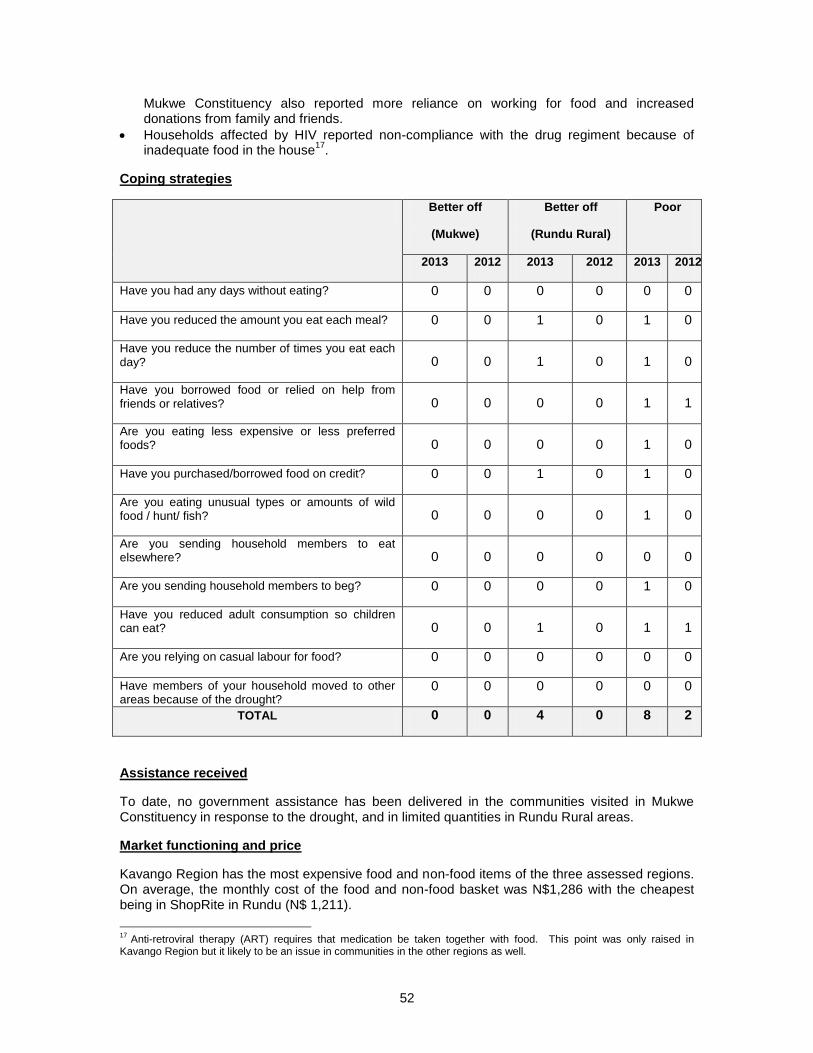
52
Mukwe Constituency also reported more reliance on working for food and increased donations from family and friends.
Households affected by HIV reported non-compliance with the drug regiment because of inadequate food in the house
17.
Coping strategies
Better off
(Mukwe)
Better off
(Rundu Rural)
Poor
2013 2012 2013 2012 2013 2012
Have you had any days without eating? 0 0 0 0 0 0
Have you reduced the amount you eat each meal? 0 0 1 0 1 0
Have you reduce the number of times you eat each day? 0 0 1 0 1 0
Have you borrowed food or relied on help from friends or relatives? 0 0 0 0 1 1
Are you eating less expensive or less preferred foods? 0 0 0 0 1 0
Have you purchased/borrowed food on credit? 0 0 1 0 1 0
Are you eating unusual types or amounts of wild food / hunt/ fish? 0 0 0 0 1 0
Are you sending household members to eat elsewhere? 0 0 0 0 0 0
Are you sending household members to beg? 0 0 0 0 1 0
Have you reduced adult consumption so children can eat? 0 0 1 0 1 1
Are you relying on casual labour for food? 0 0 0 0 0 0
Have members of your household moved to other areas because of the drought?
0 0 0 0 0 0
TOTAL 0 0 4 0 8 2
Assistance received
To date, no government assistance has been delivered in the communities visited in Mukwe Constituency in response to the drought, and in limited quantities in Rundu Rural areas.
Market functioning and price
Kavango Region has the most expensive food and non-food items of the three assessed regions. On average, the monthly cost of the food and non-food basket was N$1,286 with the cheapest being in ShopRite in Rundu (N$ 1,211).
17
Anti-retroviral therapy (ART) requires that medication be taken together with food. This point was only raised in Kavango Region but it likely to be an issue in communities in the other regions as well.
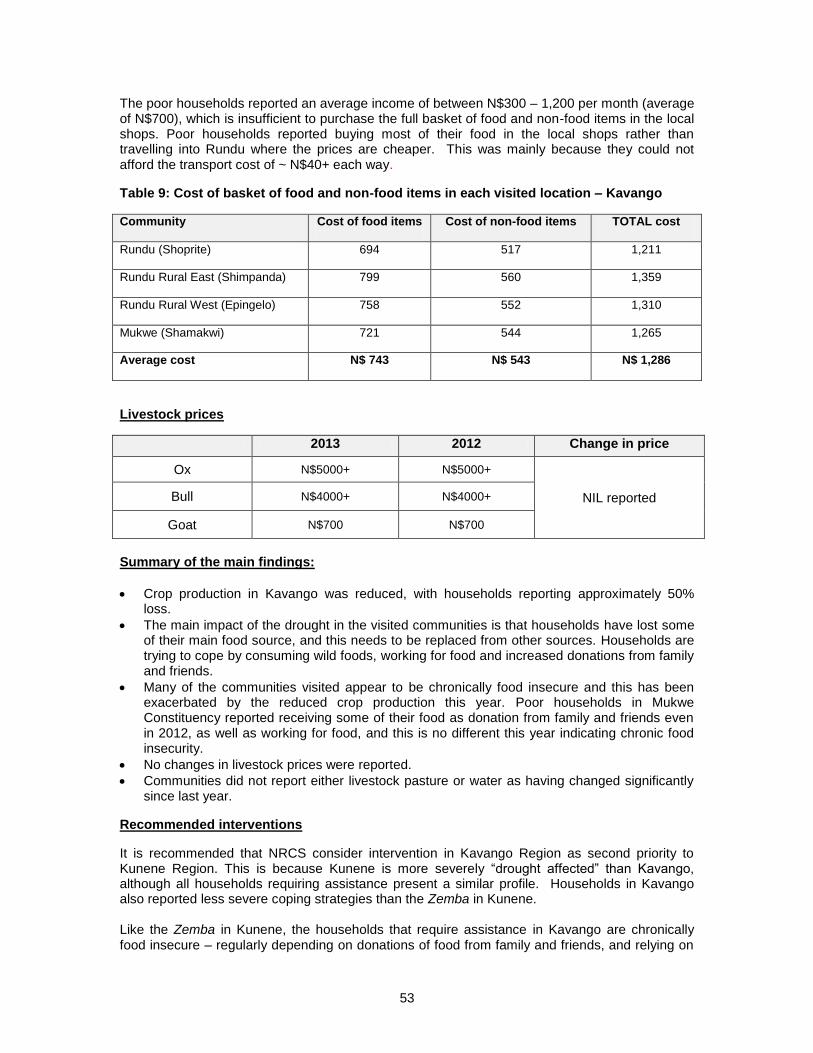
53
The poor households reported an average income of between N$300 – 1,200 per month (average of N$700), which is insufficient to purchase the full basket of food and non-food items in the local shops. Poor households reported buying most of their food in the local shops rather than travelling into Rundu where the prices are cheaper. This was mainly because they could not afford the transport cost of ~ N$40+ each way.
Table 9: Cost of basket of food and non-food items in each visited location – Kavango
Community Cost of food items Cost of non-food items TOTAL cost
Rundu (Shoprite) 694 517 1,211
Rundu Rural East (Shimpanda) 799 560 1,359
Rundu Rural West (Epingelo) 758 552 1,310
Mukwe (Shamakwi) 721 544 1,265
Average cost N$ 743 N$ 543 N$ 1,286
Livestock prices
2013 2012 Change in price
Ox N$5000+ N$5000+
NIL reported Bull N$4000+ N$4000+
Goat N$700 N$700
Summary of the main findings:
Crop production in Kavango was reduced, with households reporting approximately 50% loss.
The main impact of the drought in the visited communities is that households have lost some of their main food source, and this needs to be replaced from other sources. Households are trying to cope by consuming wild foods, working for food and increased donations from family and friends.
Many of the communities visited appear to be chronically food insecure and this has been exacerbated by the reduced crop production this year. Poor households in Mukwe Constituency reported receiving some of their food as donation from family and friends even in 2012, as well as working for food, and this is no different this year indicating chronic food insecurity.
No changes in livestock prices were reported.
Communities did not report either livestock pasture or water as having changed significantly since last year.
Recommended interventions
It is recommended that NRCS consider intervention in Kavango Region as second priority to Kunene Region. This is because Kunene is more severely “drought affected” than Kavango, although all households requiring assistance present a similar profile. Households in Kavango also reported less severe coping strategies than the Zemba in Kunene. Like the Zemba in Kunene, the households that require assistance in Kavango are chronically food insecure – regularly depending on donations of food from family and friends, and relying on
54
intermittent (or seasonal) casual labour opportunities for income. Households have few (if any) saleable assets to make up the difference between their income (~$700 per month) and the cost of the minimum basket (~$1,200 per month). Their income gap is therefore ~N$500 per month. 1. Liaise with the Office of the Prime Minister to determine if there are plans to provide food aid
in Mukwe or the Rundu Rural Constituencies. If the government is planning food aid distribution on a regular basis from August to March, then additional support from NRCS will not be required. Food aid provided by the government would be beneficial to poor households in all the communities visited. However, most communities have not received assistance from the government to date therefore it is possible that the government has no plans for provision in Kavango.
2. If food aid is going to be delivered, NRCS could assist with the physical distribution (i.e.
provide human resources) rather than get involved with the procurement and distribution of goods. It would also be useful to discuss with the government about their plans to provide additional food items such as oil and sugar (high calorie foods) or protein foods (such as beans) to supplement the government maize. If NRCS has such items donated communities in Kavango should be among the locations prioritized for distribution, preferably though the government pipeline.
3. If food aid is not going to be provided on a regular basis, it is recommended that affected
communities be provided with cash. This is because food is available in the affected communities and in Rundu, and under normal circumstances households commonly purchase food.
4. Cash should be provided on a monthly basis (until the next harvest in April). It is
recommended that households be provided with at least N$300 per month (which is the approximate cost of a 50kg bag of maize in Rundu and in the local shops). However, to meet the full basket of food and non-food items, households will need ~N$500 per month.
5. Further investigate the planned interventions by Lutheran World Federation (LWF). If they
are planning cash distributions in Kavango Region, it is strongly recommended that LWF and NRCS coordinate their efforts, both to avoid duplication and to harmonise the assistance (amount) to be provided. NRCS should also consider harmonizing the amount provided in Kunene and Kavango.
6. The number of households to be targeted needs further investigation. The visited
communities are larger than in Kunene and the Regional Manager needs to determine how many communities should be targeted. It should also be noted that the “better off” in some communities are poorer than “the poor” in Oshikoto. This will make targeting more difficult.
a. Suggested targeting criteria include: households with less than 5 small livestock, households without remittance, households affected by HIV, households with children less than 5 years of age.
7. As in Kunene, the method of cash distribution needs further investigation. It is likely that
households in Kavango have access to bank accounts for receiving their pensions. 8. As in Kunene, distribution of seed for next year’s production could be considered (or provided
as cash). Seeds or cash for this purpose would need to be distributed in time for planting in November.
9. As with the other two assessed regions, the implementation of Community-based
Management of Acute Malnutrition (CMAM) would be a useful programme to help ensure that cases of acute malnutrition are identified and treated early. This has already been discussed with UNICEF and it is recommended that CMAM be an ongoing programme in Kavango Region.
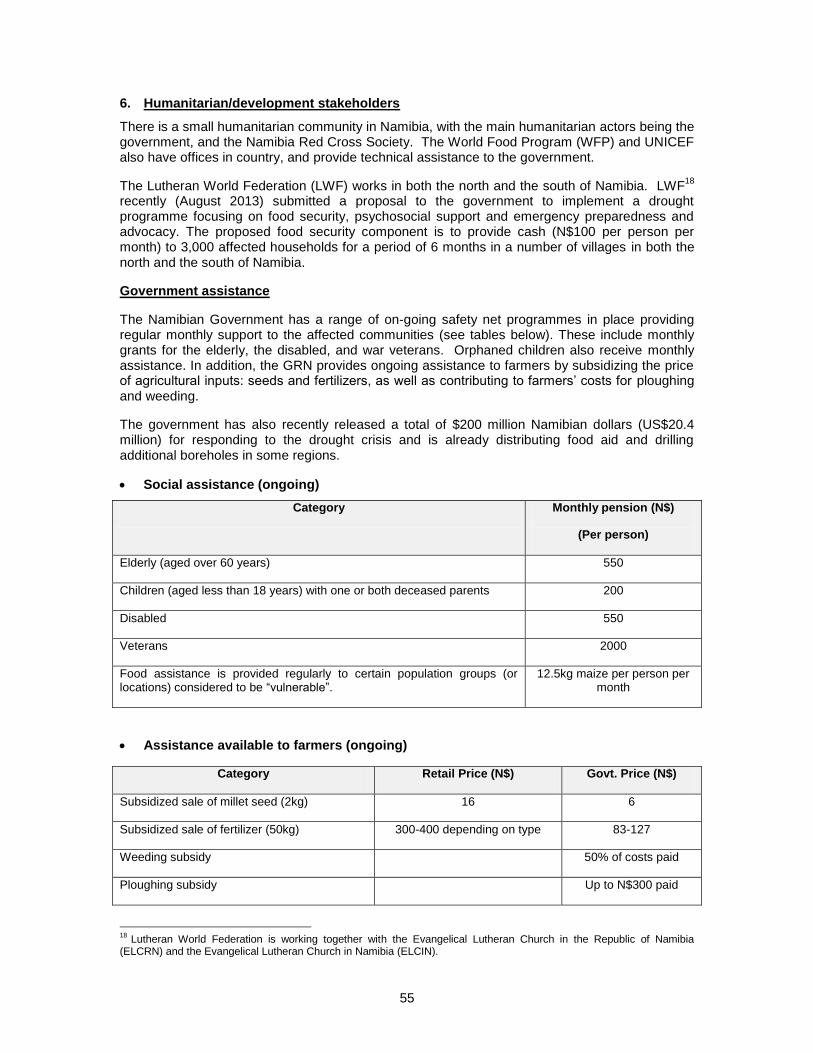
55
6. Humanitarian/development stakeholders
There is a small humanitarian community in Namibia, with the main humanitarian actors being the government, and the Namibia Red Cross Society. The World Food Program (WFP) and UNICEF also have offices in country, and provide technical assistance to the government.
The Lutheran World Federation (LWF) works in both the north and the south of Namibia. LWF18
recently (August 2013) submitted a proposal to the government to implement a drought programme focusing on food security, psychosocial support and emergency preparedness and advocacy. The proposed food security component is to provide cash (N$100 per person per month) to 3,000 affected households for a period of 6 months in a number of villages in both the north and the south of Namibia.
Government assistance
The Namibian Government has a range of on-going safety net programmes in place providing regular monthly support to the affected communities (see tables below). These include monthly grants for the elderly, the disabled, and war veterans. Orphaned children also receive monthly assistance. In addition, the GRN provides ongoing assistance to farmers by subsidizing the price of agricultural inputs: seeds and fertilizers, as well as contributing to farmers’ costs for ploughing and weeding.
The government has also recently released a total of $200 million Namibian dollars (US$20.4 million) for responding to the drought crisis and is already distributing food aid and drilling additional boreholes in some regions.
Social assistance (ongoing)
Category Monthly pension (N$)
(Per person)
Elderly (aged over 60 years) 550
Children (aged less than 18 years) with one or both deceased parents 200
Disabled 550
Veterans 2000
Food assistance is provided regularly to certain population groups (or locations) considered to be “vulnerable”.
12.5kg maize per person per month
Assistance available to farmers (ongoing)
Category Retail Price (N$) Govt. Price (N$)
Subsidized sale of millet seed (2kg) 16 6
Subsidized sale of fertilizer (50kg) 300-400 depending on type 83-127
Weeding subsidy 50% of costs paid
Ploughing subsidy Up to N$300 paid
18
Lutheran World Federation is working together with the Evangelical Lutheran Church in the Republic of Namibia (ELCRN) and the Evangelical Lutheran Church in Namibia (ELCIN).
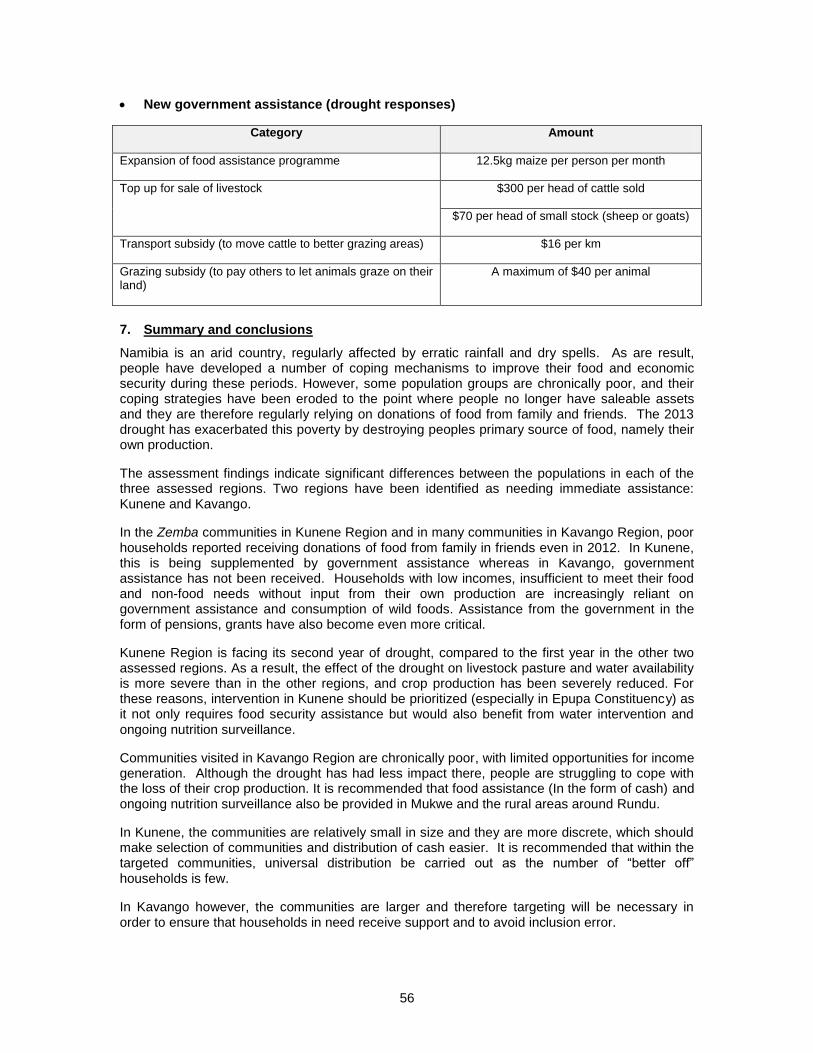
56
New government assistance (drought responses)
Category Amount
Expansion of food assistance programme 12.5kg maize per person per month
Top up for sale of livestock $300 per head of cattle sold
$70 per head of small stock (sheep or goats)
Transport subsidy (to move cattle to better grazing areas) $16 per km
Grazing subsidy (to pay others to let animals graze on their land)
A maximum of $40 per animal
7. Summary and conclusions
Namibia is an arid country, regularly affected by erratic rainfall and dry spells. As are result, people have developed a number of coping mechanisms to improve their food and economic security during these periods. However, some population groups are chronically poor, and their coping strategies have been eroded to the point where people no longer have saleable assets and they are therefore regularly relying on donations of food from family and friends. The 2013 drought has exacerbated this poverty by destroying peoples primary source of food, namely their own production.
The assessment findings indicate significant differences between the populations in each of the three assessed regions. Two regions have been identified as needing immediate assistance: Kunene and Kavango.
In the Zemba communities in Kunene Region and in many communities in Kavango Region, poor households reported receiving donations of food from family in friends even in 2012. In Kunene, this is being supplemented by government assistance whereas in Kavango, government assistance has not been received. Households with low incomes, insufficient to meet their food and non-food needs without input from their own production are increasingly reliant on government assistance and consumption of wild foods. Assistance from the government in the form of pensions, grants have also become even more critical.
Kunene Region is facing its second year of drought, compared to the first year in the other two assessed regions. As a result, the effect of the drought on livestock pasture and water availability is more severe than in the other regions, and crop production has been severely reduced. For these reasons, intervention in Kunene should be prioritized (especially in Epupa Constituency) as it not only requires food security assistance but would also benefit from water intervention and ongoing nutrition surveillance.
Communities visited in Kavango Region are chronically poor, with limited opportunities for income generation. Although the drought has had less impact there, people are struggling to cope with the loss of their crop production. It is recommended that food assistance (In the form of cash) and ongoing nutrition surveillance also be provided in Mukwe and the rural areas around Rundu.
In Kunene, the communities are relatively small in size and they are more discrete, which should make selection of communities and distribution of cash easier. It is recommended that within the targeted communities, universal distribution be carried out as the number of “better off” households is few.
In Kavango however, the communities are larger and therefore targeting will be necessary in order to ensure that households in need receive support and to avoid inclusion error.
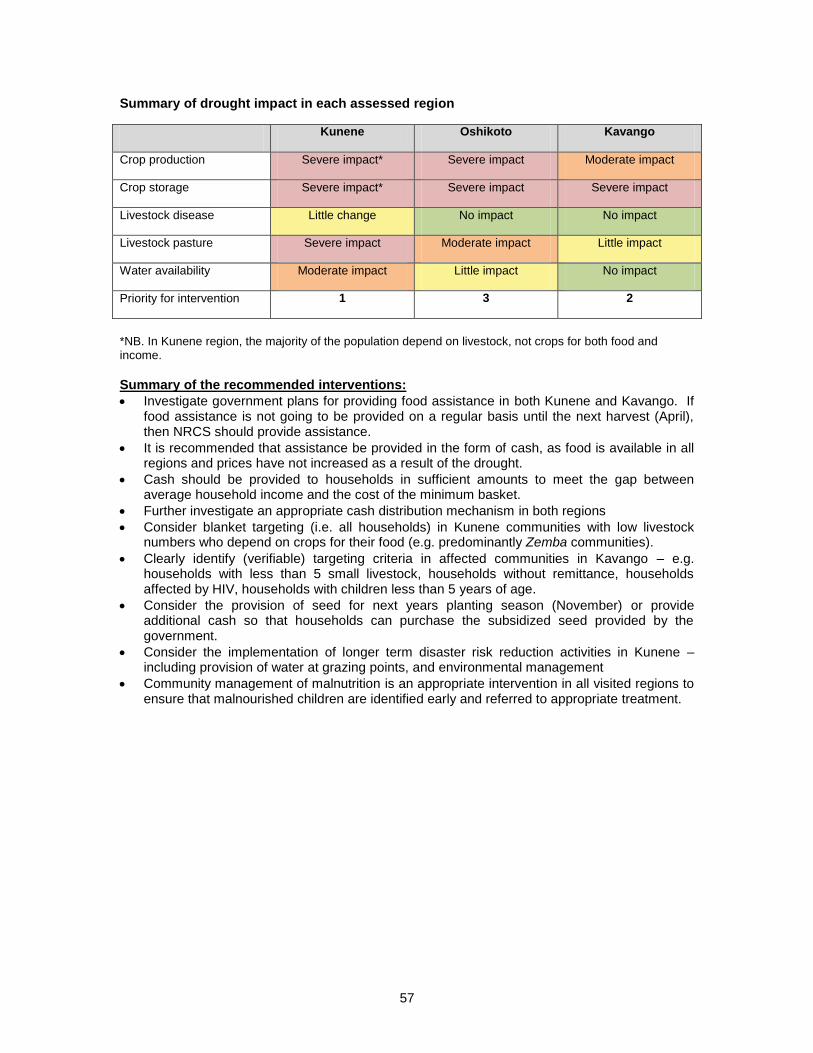
57
Summary of drought impact in each assessed region
Kunene Oshikoto Kavango
Crop production Severe impact* Severe impact Moderate impact
Crop storage Severe impact* Severe impact Severe impact
Livestock disease Little change No impact No impact
Livestock pasture Severe impact Moderate impact Little impact
Water availability Moderate impact Little impact No impact
Priority for intervention 1 3 2
*NB. In Kunene region, the majority of the population depend on livestock, not crops for both food and income.
Summary of the recommended interventions:
Investigate government plans for providing food assistance in both Kunene and Kavango. If food assistance is not going to be provided on a regular basis until the next harvest (April), then NRCS should provide assistance.
It is recommended that assistance be provided in the form of cash, as food is available in all regions and prices have not increased as a result of the drought.
Cash should be provided to households in sufficient amounts to meet the gap between average household income and the cost of the minimum basket.
Further investigate an appropriate cash distribution mechanism in both regions
Consider blanket targeting (i.e. all households) in Kunene communities with low livestock numbers who depend on crops for their food (e.g. predominantly Zemba communities).
Clearly identify (verifiable) targeting criteria in affected communities in Kavango – e.g. households with less than 5 small livestock, households without remittance, households affected by HIV, households with children less than 5 years of age.
Consider the provision of seed for next years planting season (November) or provide additional cash so that households can purchase the subsidized seed provided by the government.
Consider the implementation of longer term disaster risk reduction activities in Kunene – including provision of water at grazing points, and environmental management
Community management of malnutrition is an appropriate intervention in all visited regions to ensure that malnourished children are identified early and referred to appropriate treatment.
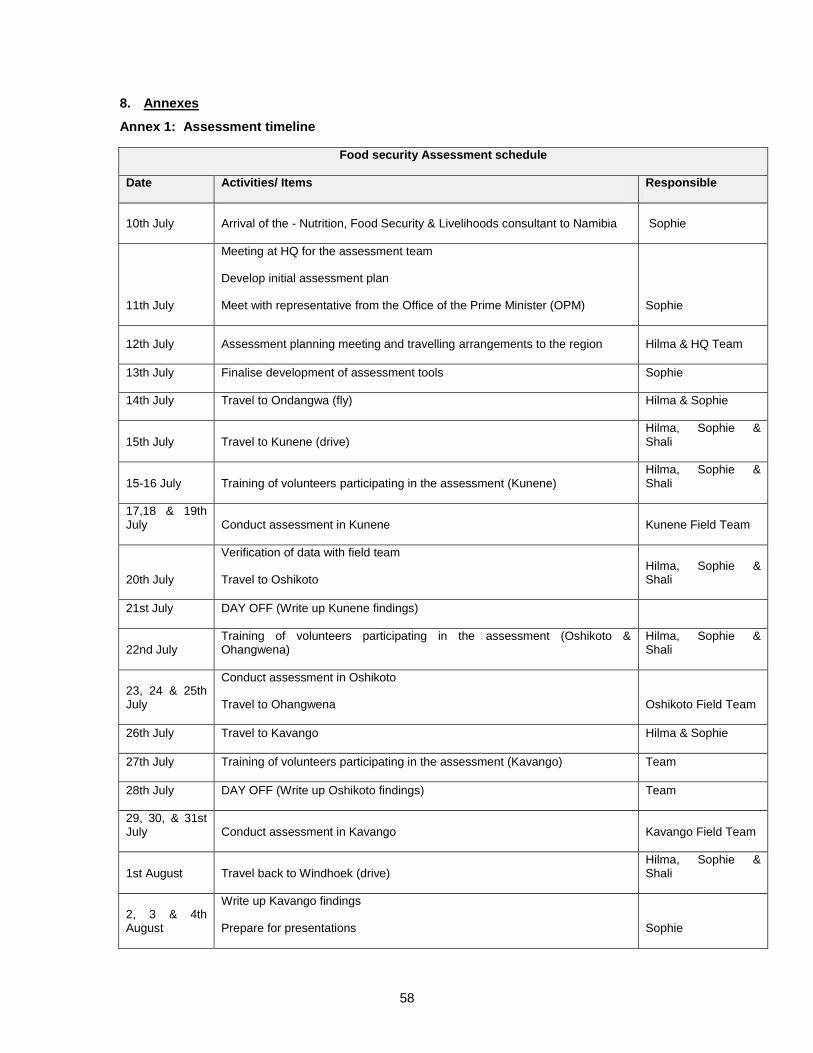
58
8. Annexes
Annex 1: Assessment timeline
Food security Assessment schedule
Date Activities/ Items Responsible
10th July Arrival of the - Nutrition, Food Security & Livelihoods consultant to Namibia Sophie
11th July
Meeting at HQ for the assessment team
Develop initial assessment plan
Meet with representative from the Office of the Prime Minister (OPM) Sophie
12th July Assessment planning meeting and travelling arrangements to the region Hilma & HQ Team
13th July Finalise development of assessment tools Sophie
14th July Travel to Ondangwa (fly) Hilma & Sophie
15th July Travel to Kunene (drive) Hilma, Sophie & Shali
15-16 July Training of volunteers participating in the assessment (Kunene) Hilma, Sophie & Shali
17,18 & 19th July Conduct assessment in Kunene Kunene Field Team
20th July
Verification of data with field team
Travel to Oshikoto Hilma, Sophie & Shali
21st July DAY OFF (Write up Kunene findings)
22nd July Training of volunteers participating in the assessment (Oshikoto & Ohangwena)
Hilma, Sophie & Shali
23, 24 & 25th July
Conduct assessment in Oshikoto
Travel to Ohangwena Oshikoto Field Team
26th July Travel to Kavango Hilma & Sophie
27th July Training of volunteers participating in the assessment (Kavango) Team
28th July DAY OFF (Write up Oshikoto findings) Team
29, 30, & 31st July Conduct assessment in Kavango Kavango Field Team
1st August Travel back to Windhoek (drive) Hilma, Sophie & Shali
2, 3 & 4th August
Write up Kavango findings
Prepare for presentations Sophie
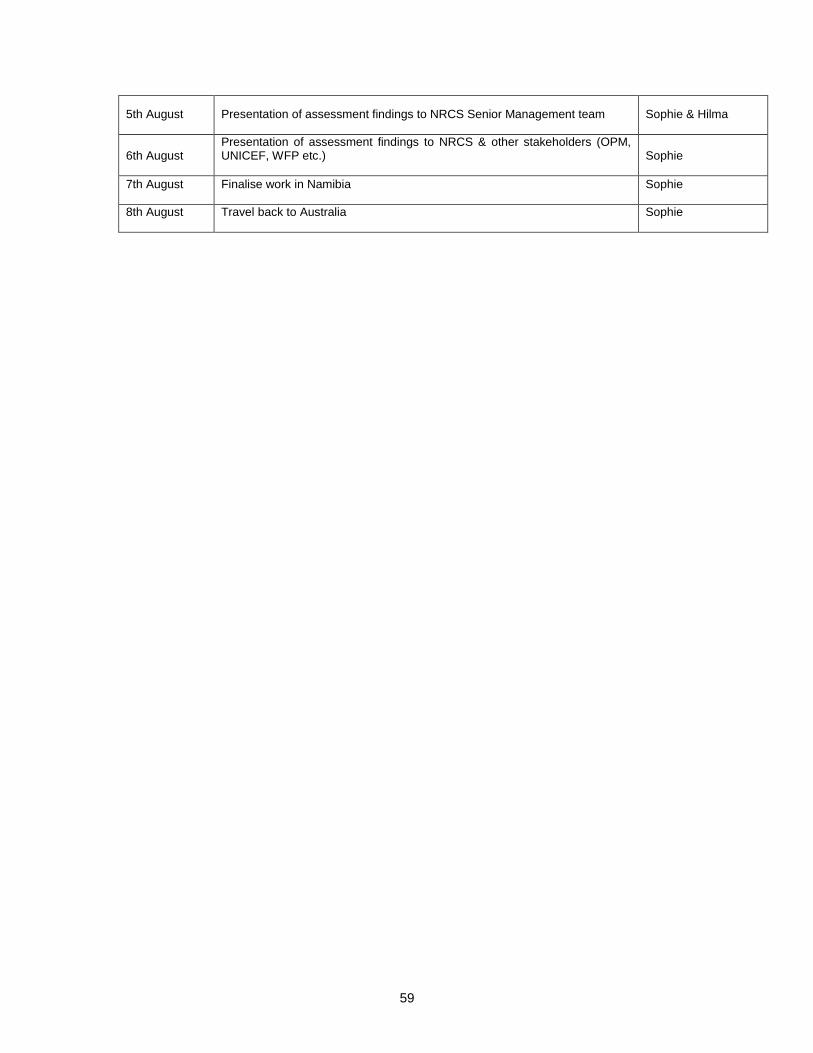
59
5th August Presentation of assessment findings to NRCS Senior Management team Sophie & Hilma
6th August Presentation of assessment findings to NRCS & other stakeholders (OPM, UNICEF, WFP etc.) Sophie
7th August Finalise work in Namibia Sophie
8th August Travel back to Australia Sophie
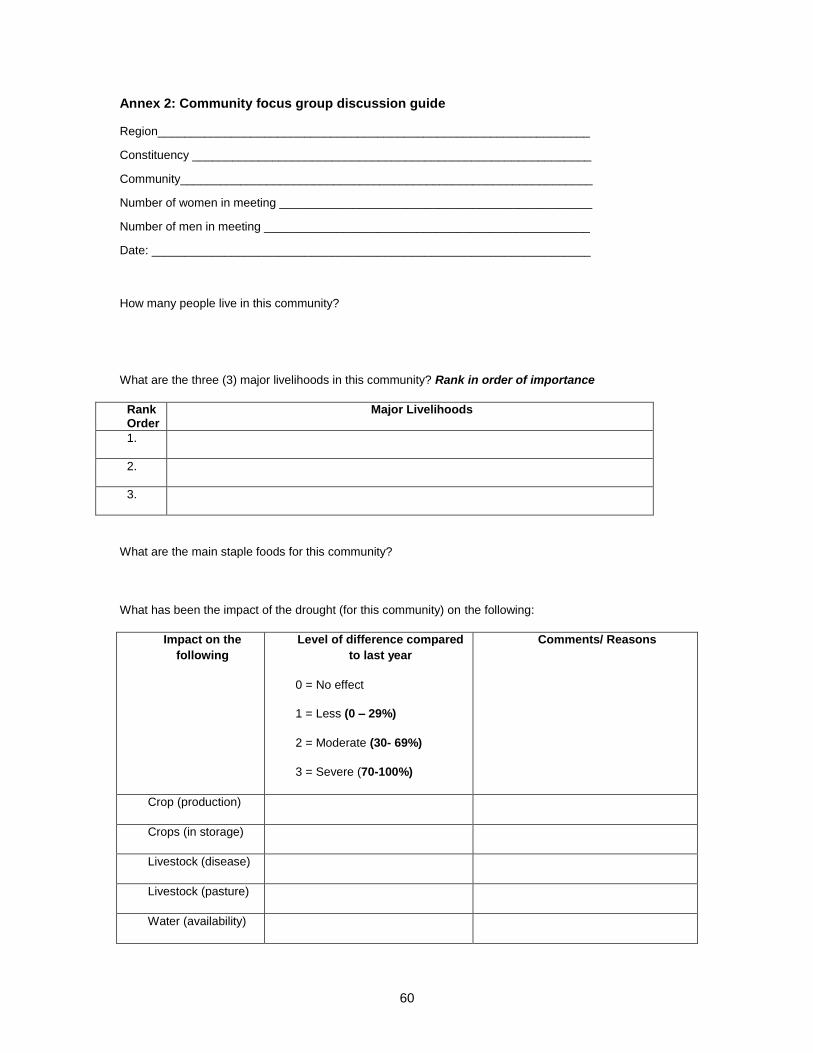
60
Annex 2: Community focus group discussion guide
Region_________________________________________________________________
Constituency ____________________________________________________________
Community______________________________________________________________
Number of women in meeting _______________________________________________
Number of men in meeting _________________________________________________
Date: __________________________________________________________________
How many people live in this community?
What are the three (3) major livelihoods in this community? Rank in order of importance
Rank Order
Major Livelihoods
1.
2.
3.
What are the main staple foods for this community?
What has been the impact of the drought (for this community) on the following:
Impact on the
following
Level of difference compared
to last year
0 = No effect
1 = Less (0 – 29%)
2 = Moderate (30- 69%)
3 = Severe (70-100%)
Comments/ Reasons
Crop (production)
Crops (in storage)
Livestock (disease)
Livestock (pasture)
Water (availability)
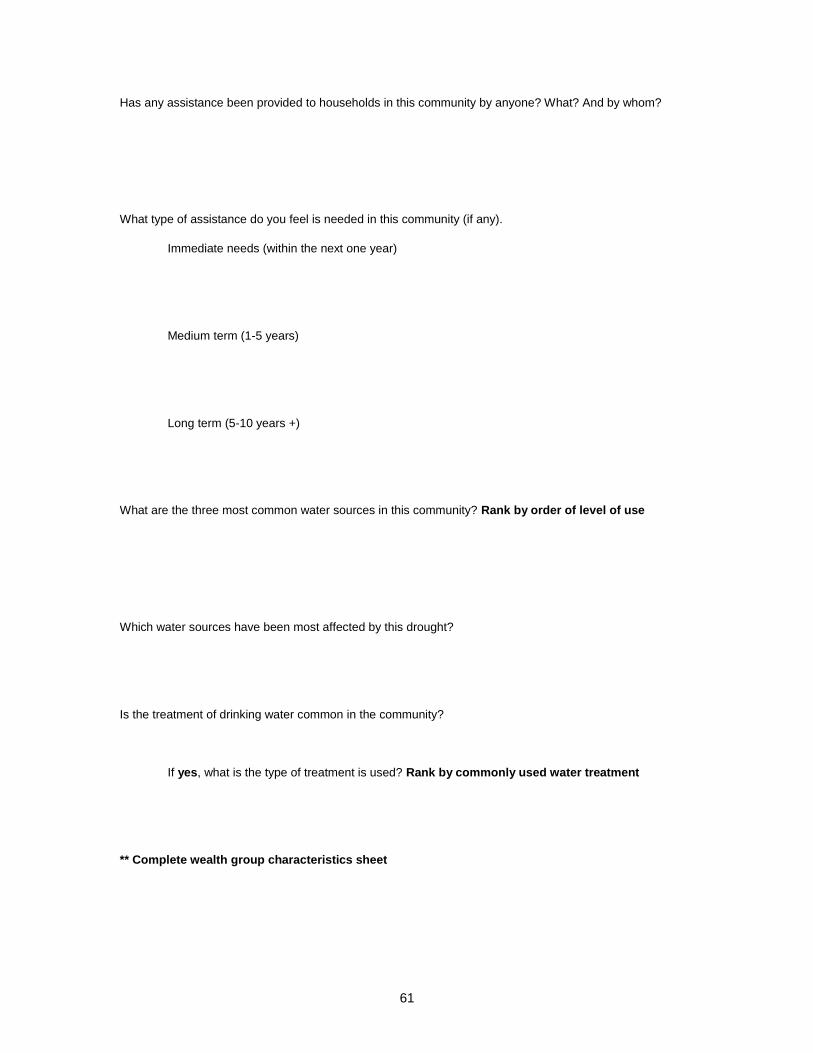
61
Has any assistance been provided to households in this community by anyone? What? And by whom?
What type of assistance do you feel is needed in this community (if any).
Immediate needs (within the next one year)
Medium term (1-5 years)
Long term (5-10 years +)
What are the three most common water sources in this community? Rank by order of level of use
Which water sources have been most affected by this drought?
Is the treatment of drinking water common in the community?
If yes, what is the type of treatment is used? Rank by commonly used water treatment
** Complete wealth group characteristics sheet
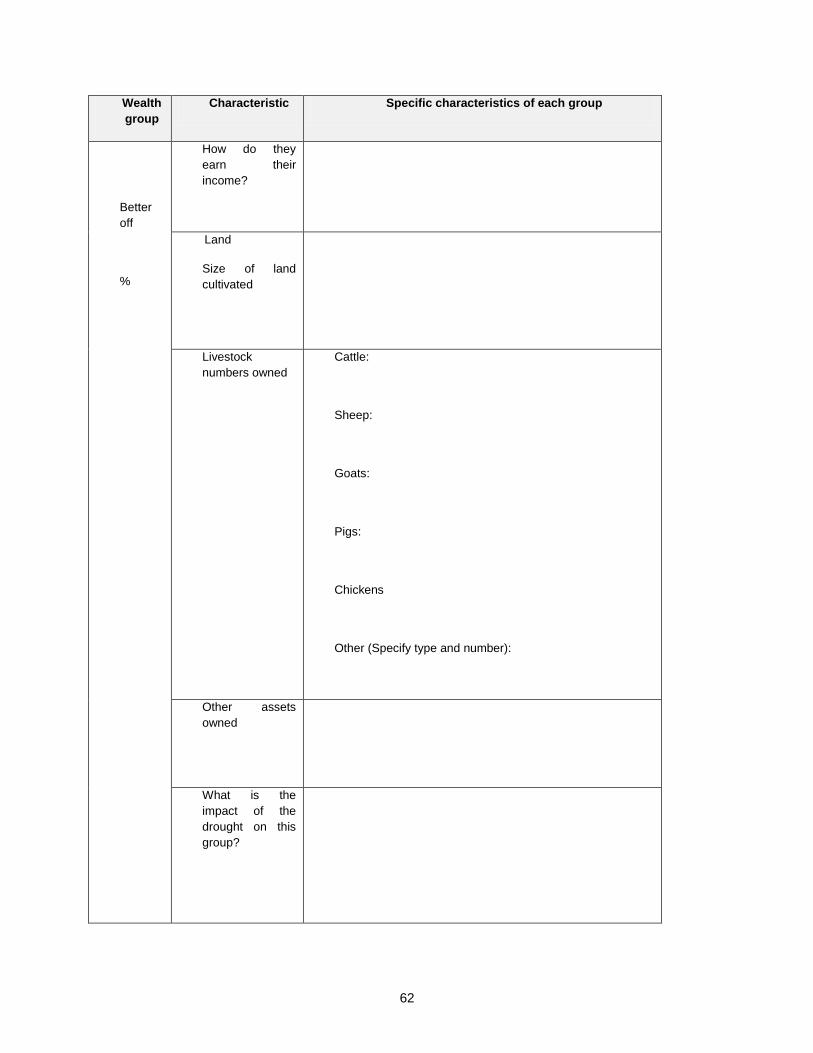
62
Wealth
group
Characteristic Specific characteristics of each group
Better
off
%
How do they
earn their
income?
Land
Size of land
cultivated
Livestock
numbers owned
Cattle:
Sheep:
Goats:
Pigs:
Chickens
Other (Specify type and number):
Other assets
owned
What is the
impact of the
drought on this
group?
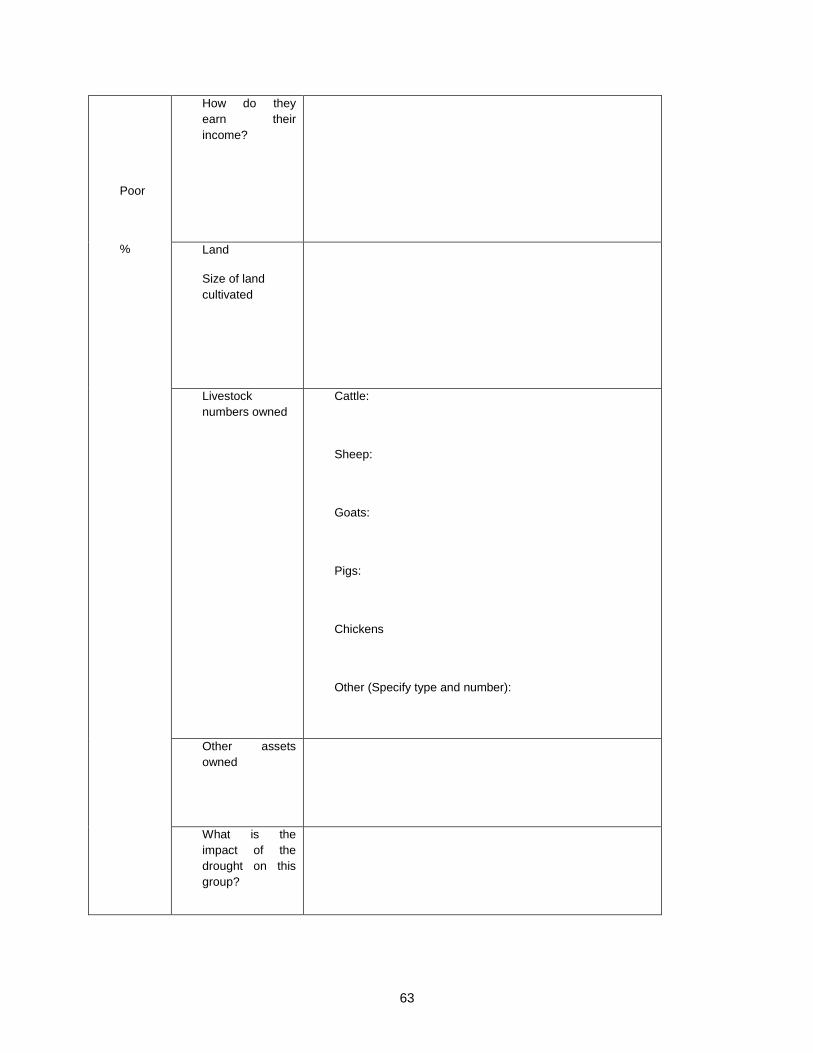
63
Poor
%
How do they
earn their
income?
Land
Size of land
cultivated
Livestock
numbers owned
Cattle:
Sheep:
Goats:
Pigs:
Chickens
Other (Specify type and number):
Other assets
owned
What is the
impact of the
drought on this
group?
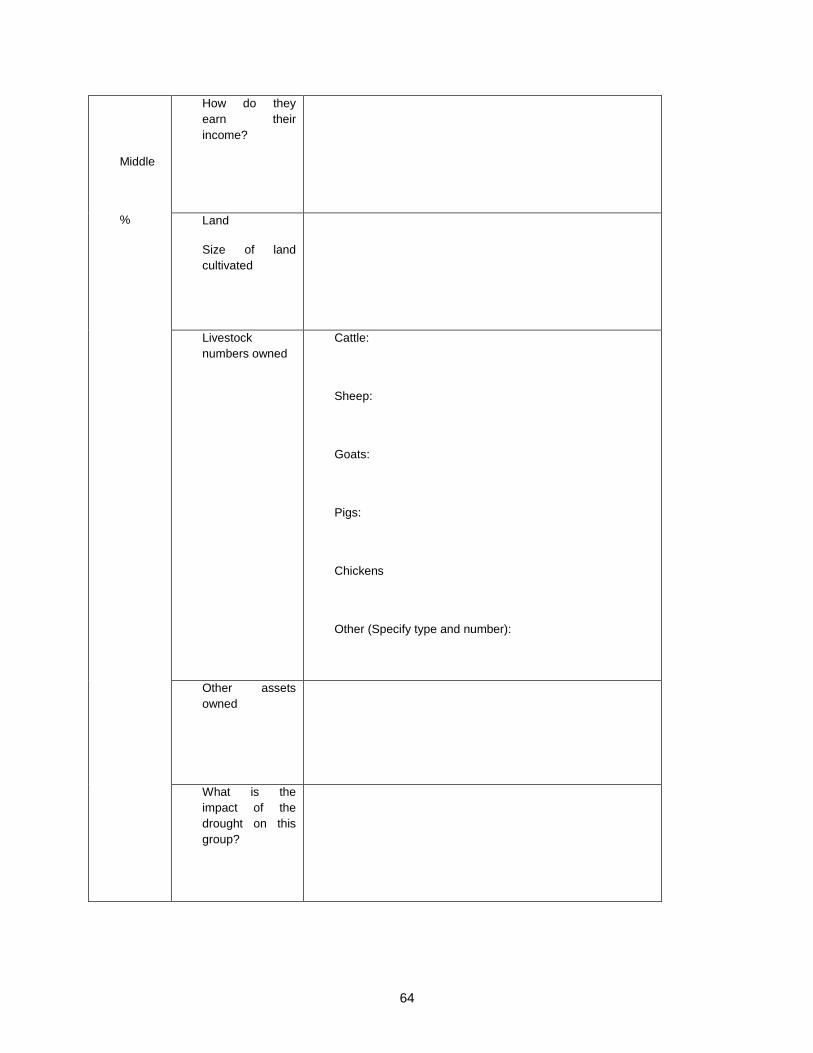
64
Middle
%
How do they
earn their
income?
Land
Size of land
cultivated
Livestock
numbers owned
Cattle:
Sheep:
Goats:
Pigs:
Chickens
Other (Specify type and number):
Other assets
owned
What is the
impact of the
drought on this
group?
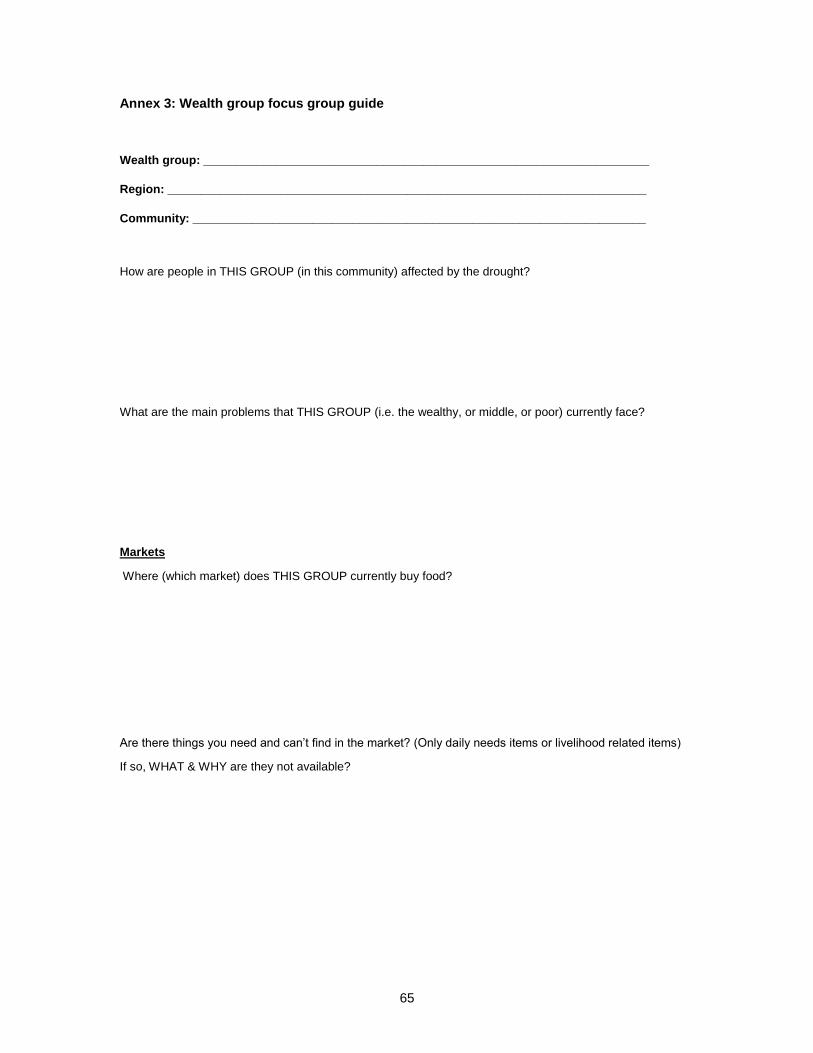
65
Annex 3: Wealth group focus group guide
Wealth group: ___________________________________________________________________
Region: ________________________________________________________________________
Community: ____________________________________________________________________
How are people in THIS GROUP (in this community) affected by the drought?
What are the main problems that THIS GROUP (i.e. the wealthy, or middle, or poor) currently face?
Markets
Where (which market) does THIS GROUP currently buy food?
Are there things you need and can’t find in the market? (Only daily needs items or livelihood related items)
If so, WHAT & WHY are they not available?
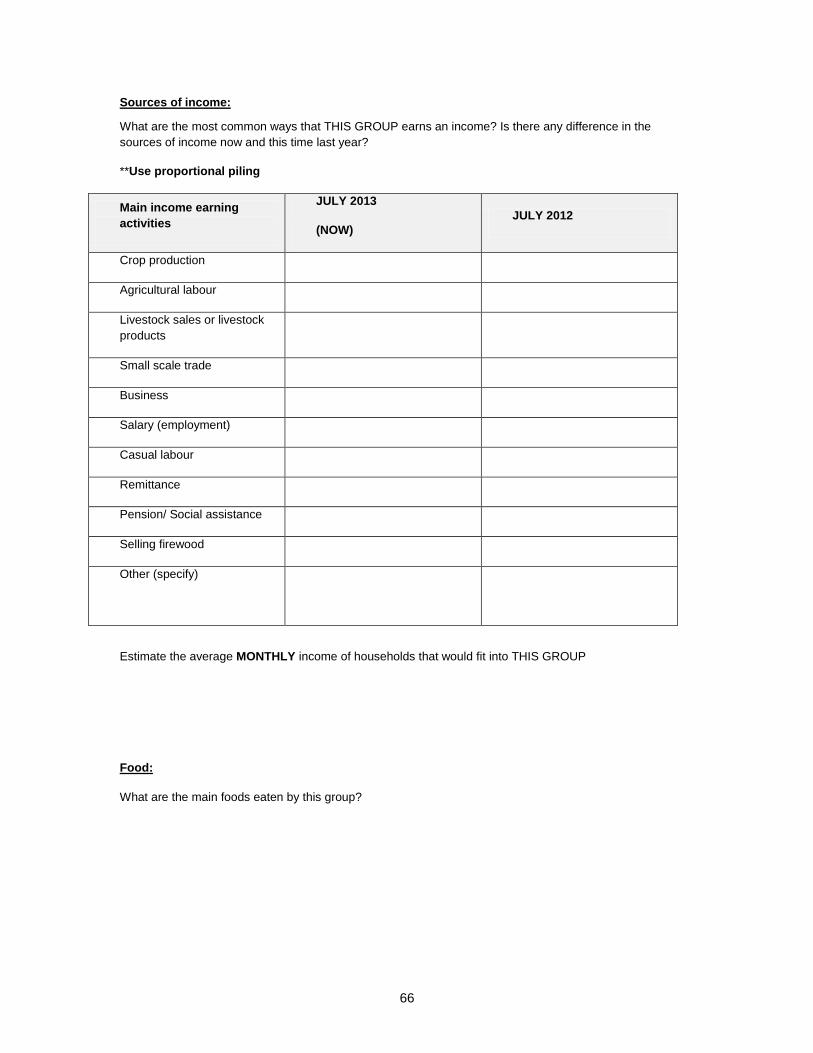
66
Sources of income:
What are the most common ways that THIS GROUP earns an income? Is there any difference in the
sources of income now and this time last year?
**Use proportional piling
Main income earning
activities
JULY 2013
(NOW)
JULY 2012
Crop production
Agricultural labour
Livestock sales or livestock
products
Small scale trade
Business
Salary (employment)
Casual labour
Remittance
Pension/ Social assistance
Selling firewood
Other (specify)
Estimate the average MONTHLY income of households that would fit into THIS GROUP
Food:
What are the main foods eaten by this group?
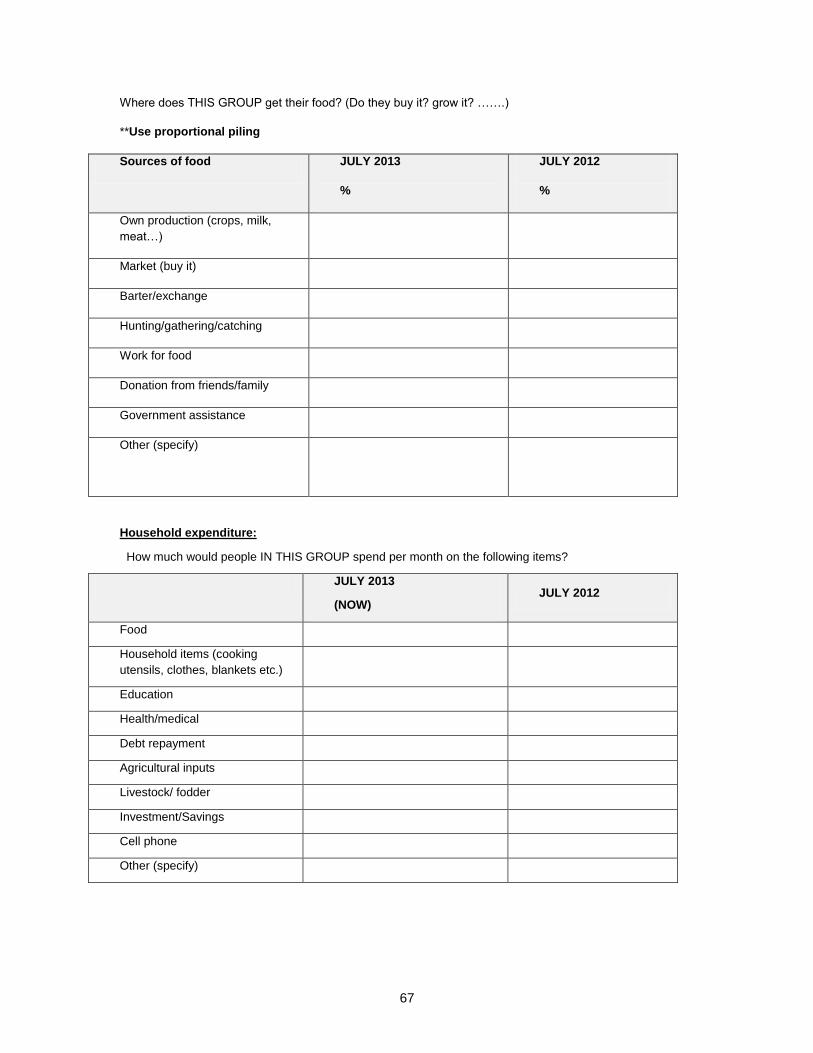
67
Where does THIS GROUP get their food? (Do they buy it? grow it? …….)
**Use proportional piling
Sources of food JULY 2013
%
JULY 2012
%
Own production (crops, milk,
meat…)
Market (buy it)
Barter/exchange
Hunting/gathering/catching
Work for food
Donation from friends/family
Government assistance
Other (specify)
Household expenditure:
How much would people IN THIS GROUP spend per month on the following items?
JULY 2013
(NOW) JULY 2012
Food
Household items (cooking
utensils, clothes, blankets etc.)
Education
Health/medical
Debt repayment
Agricultural inputs
Livestock/ fodder
Investment/Savings
Cell phone
Other (specify)
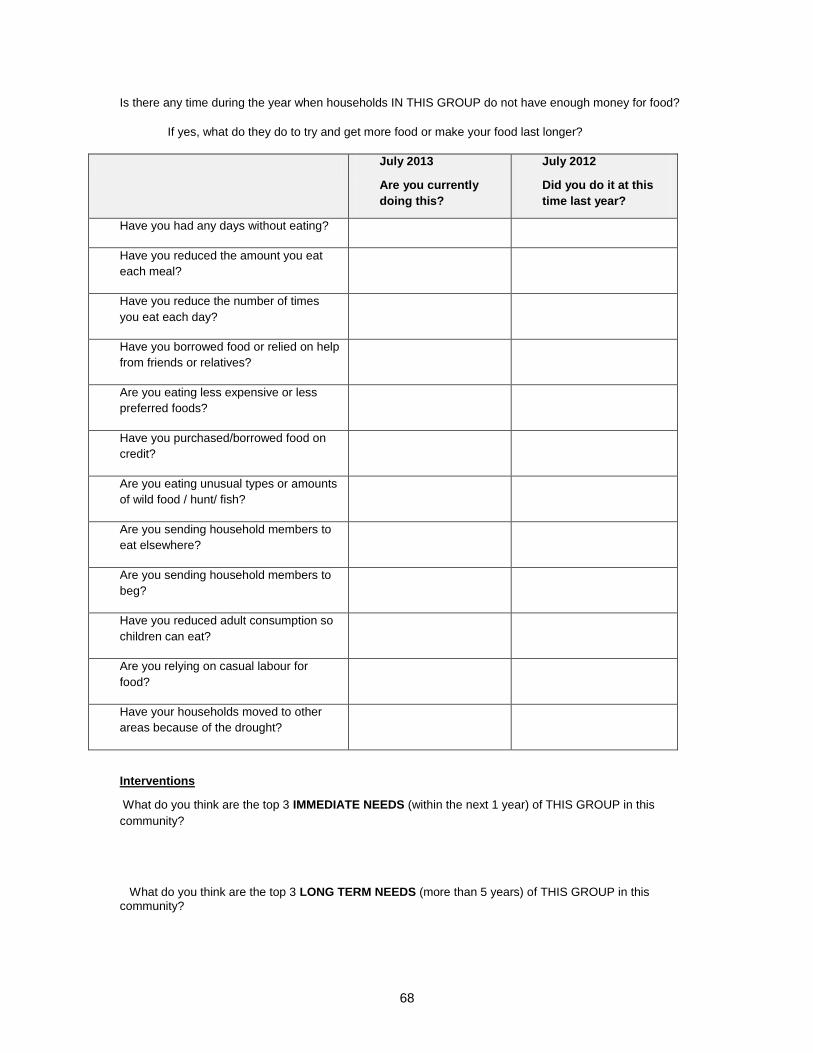
68
Is there any time during the year when households IN THIS GROUP do not have enough money for food?
If yes, what do they do to try and get more food or make your food last longer?
July 2013
Are you currently
doing this?
July 2012
Did you do it at this
time last year?
Have you had any days without eating?
Have you reduced the amount you eat
each meal?
Have you reduce the number of times
you eat each day?
Have you borrowed food or relied on help
from friends or relatives?
Are you eating less expensive or less
preferred foods?
Have you purchased/borrowed food on
credit?
Are you eating unusual types or amounts
of wild food / hunt/ fish?
Are you sending household members to
eat elsewhere?
Are you sending household members to
beg?
Have you reduced adult consumption so
children can eat?
Are you relying on casual labour for
food?
Have your households moved to other
areas because of the drought?
Interventions
What do you think are the top 3 IMMEDIATE NEEDS (within the next 1 year) of THIS GROUP in this
community?
What do you think are the top 3 LONG TERM NEEDS (more than 5 years) of THIS GROUP in this
community?
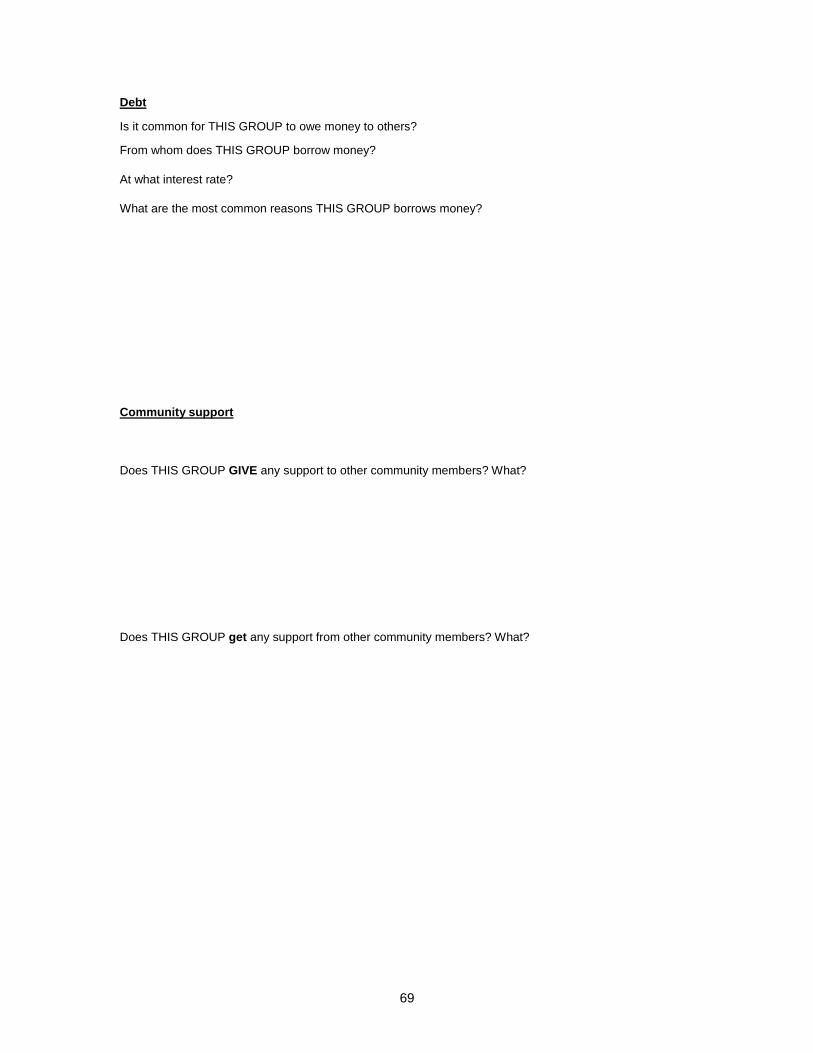
69
Debt
Is it common for THIS GROUP to owe money to others?
From whom does THIS GROUP borrow money?
At what interest rate?
What are the most common reasons THIS GROUP borrows money?
Community support
Does THIS GROUP GIVE any support to other community members? What?
Does THIS GROUP get any support from other community members? What?
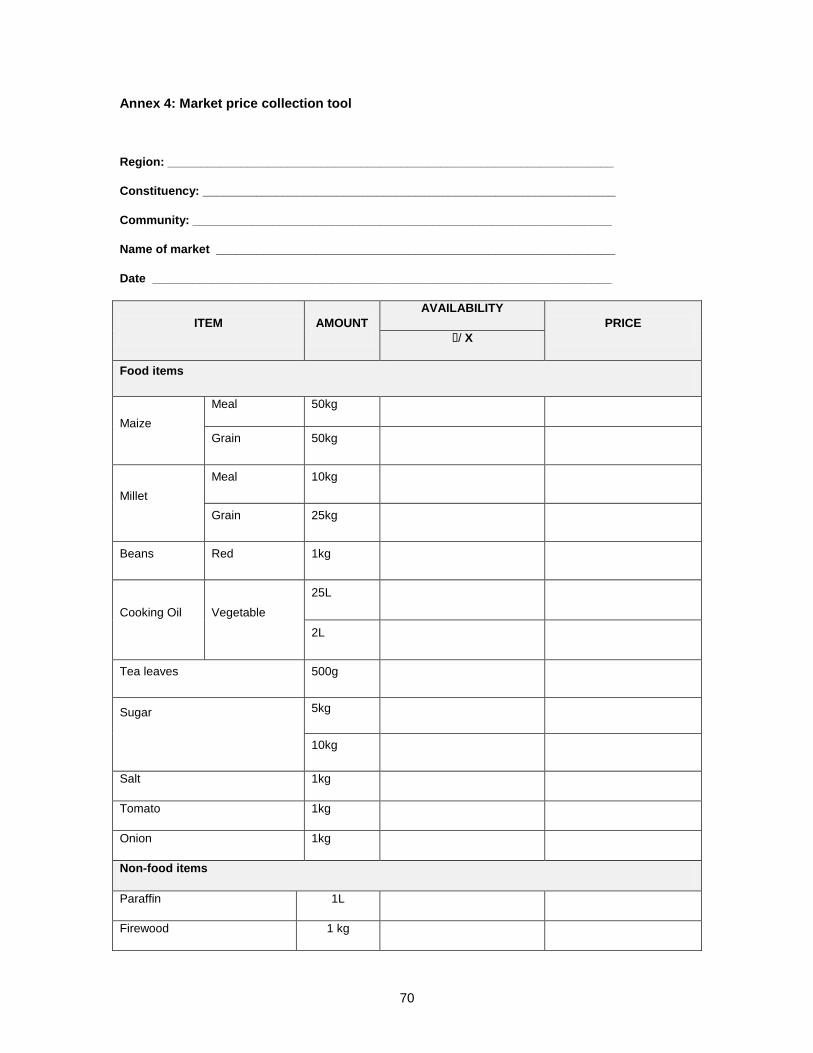
70
Annex 4: Market price collection tool
Region: ___________________________________________________________________
Constituency: ______________________________________________________________
Community: _______________________________________________________________
Name of market ____________________________________________________________
Date _____________________________________________________________________
ITEM AMOUNT
AVAILABILITY
PRICE
�/ X
Food items
Maize
Meal 50kg
Grain 50kg
Millet
Meal 10kg
Grain 25kg
Beans Red 1kg
Cooking Oil Vegetable
25L
2L
Tea leaves 500g
Sugar
5kg
10kg
Salt 1kg
Tomato 1kg
Onion 1kg
Non-food items
Paraffin 1L
Firewood 1 kg
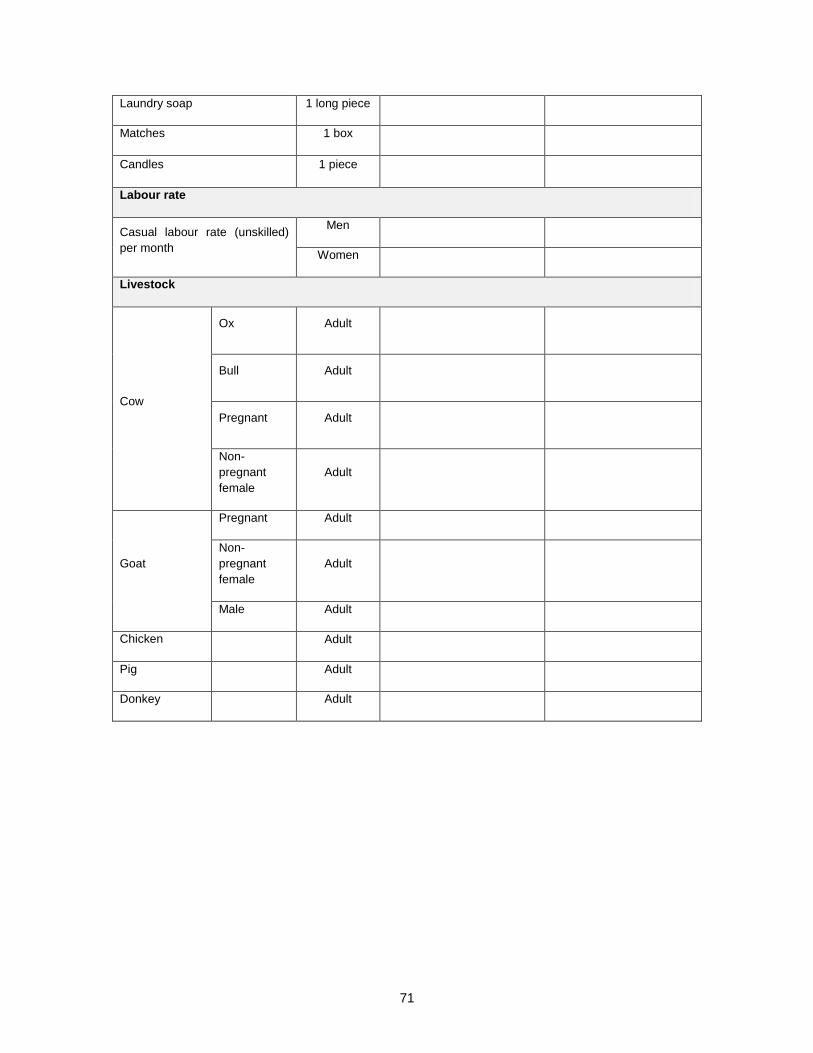
71
Laundry soap 1 long piece
Matches 1 box
Candles 1 piece
Labour rate
Casual labour rate (unskilled)
per month
Men
Women
Livestock
Cow
Ox Adult
Bull Adult
Pregnant Adult
Non-
pregnant
female
Adult
Goat
Pregnant Adult
Non-
pregnant
female
Adult
Male Adult
Chicken Adult
Pig Adult
Donkey Adult
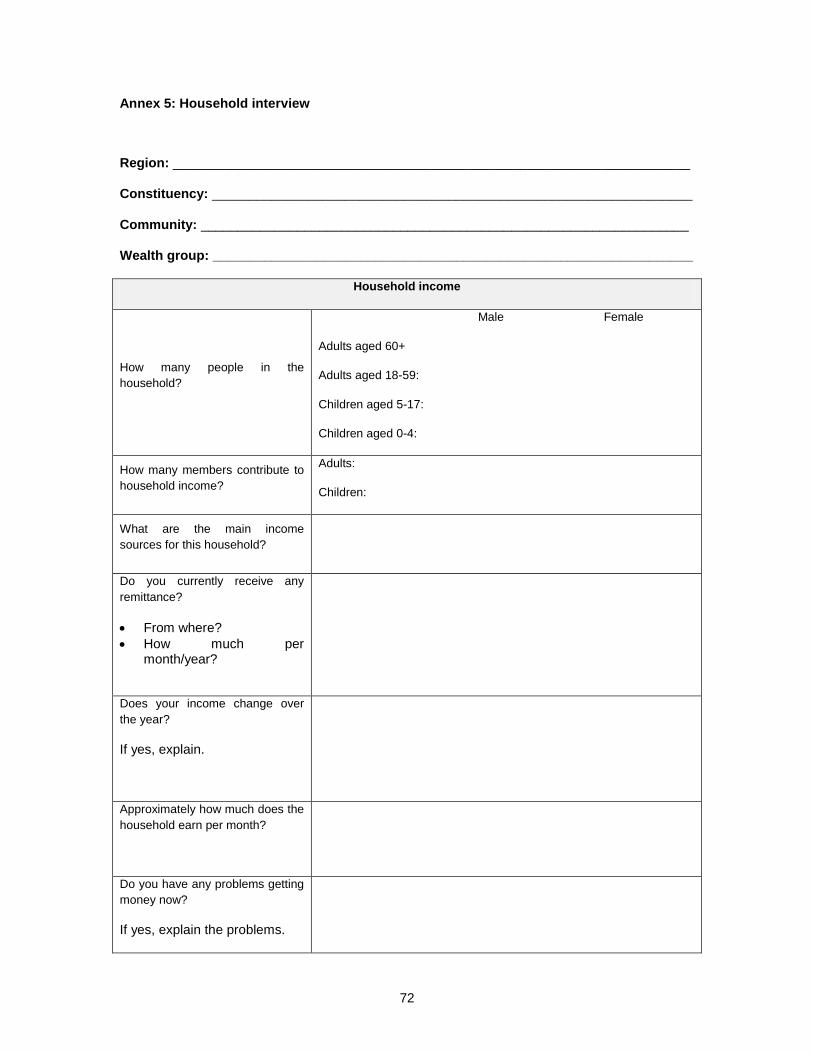
72
Annex 5: Household interview
Region: ______________________________________________________________________
Constituency: _________________________________________________________________
Community: __________________________________________________________________
Wealth group: _________________________________________________________________
Household income
How many people in the
household?
Male Female
Adults aged 60+
Adults aged 18-59:
Children aged 5-17:
Children aged 0-4:
How many members contribute to
household income?
Adults:
Children:
What are the main income
sources for this household?
Do you currently receive any
remittance?
From where?
How much per month/year?
Does your income change over
the year?
If yes, explain.
Approximately how much does the
household earn per month?
Do you have any problems getting
money now?
If yes, explain the problems.
73
Have your sources of income
changed as a result of the
drought?
Describe the changes
Food & nutrition
How many times do you usually
eat in a day?
How many times per day are you
eating now?
How many days per month does
this household eat eggs, chicken,
fish or meat?
Meat
Chicken
Eggs
Fish
Do you have any problems getting
food at the moment?
If yes, please explain.
Access to basic services
How far is it to the nearest health
centre, market, school?
Any problems getting there?
How much does it cost to get
there?
Health centre:
Primary school:
Market:
What is your main source of
water? (NOW)
How far is that source of water
from your home?
74
Livelihood assets
What was the size of the land
cultivated by this household for last
harvest?
How much did you harvest this year?
How does this amount compare to last
year?
How many livestock does the
household own?
Cattle:
Sheep:
Goats:
Pigs:
Chicken:
Other (Specify type and number):
How many livestock have you sold this
year?
Is there any change from last year?
Explain
Cattle
Goats
Have you sold anything else because
of this drought?
Assistance/ Support
What type of support (if any) did you
receive from your family, friends and
neighbours since the start of this year?
What type of support (if any) did you
receive from the government since the
start of this year?
What type of support (if any) did you
receive from the your community or
any one else since the start of this
year?
75
Household expenditure
Approximately how much is spent
each month for each of these?
Food:
Household items (cooking utensils, clothes, blankets etc.)
Education:
Health/medical:
Debt repayment
Livestock feed
Livestock health:
Agricultural inputs (seeds, fertilizer…)
Investment/savings:
Water:
Other major costs (specify):
If your household doesn’t have
enough money for everything you
need, which things do you
prioritize? (Top 3 priorities)
If your household doesn’t have
enough money for everything you
need – what will you do to try and
get more money?
Financial Services
Does anyone in this household
currently have a bank account?
How do you usually receive
remittance or pension?
76
Is this household currently doing any of the following?
JULY 2013
Are you currently doing this?
JULY 2012
Did you do it at this time last
year?
Have you had any days without
eating? [Whole family not eating]
Have you reduced the amount you eat
each meal?
Have you reduce the number of times
you eat each day?
Have you borrowed food or relied on
help from friends or relatives?
Are you eating less expensive or less
preferred foods?
Have you purchased/borrowed food on
credit?
Are you eating unusual types or
amounts of wild food / hunt/ fish?
Are you sending household members
to eat elsewhere?
Are you sending household members
to beg?
Have you reduced adult consumption
so children can eat?
Are you relying on casual labour for
food?
Have your households moved to other
areas because of the drought?
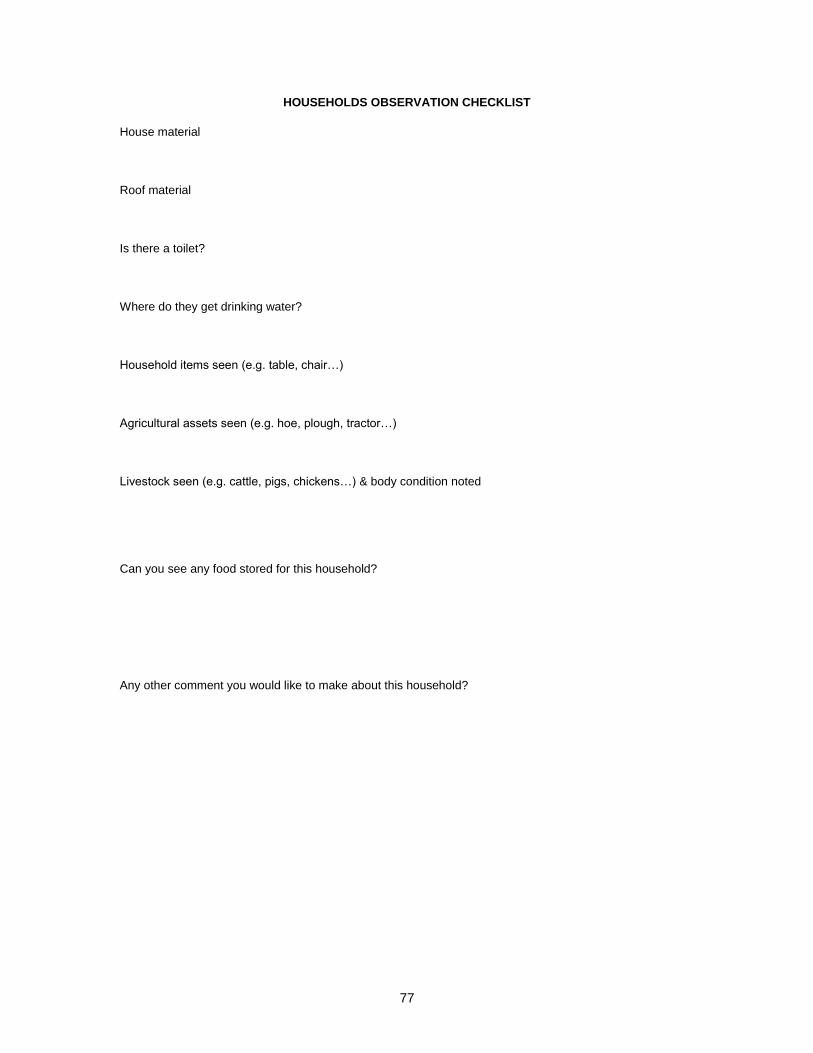
77
HOUSEHOLDS OBSERVATION CHECKLIST
House material
Roof material
Is there a toilet?
Where do they get drinking water?
Household items seen (e.g. table, chair…)
Agricultural assets seen (e.g. hoe, plough, tractor…)
Livestock seen (e.g. cattle, pigs, chickens…) & body condition noted
Can you see any food stored for this household?
Any other comment you would like to make about this household?
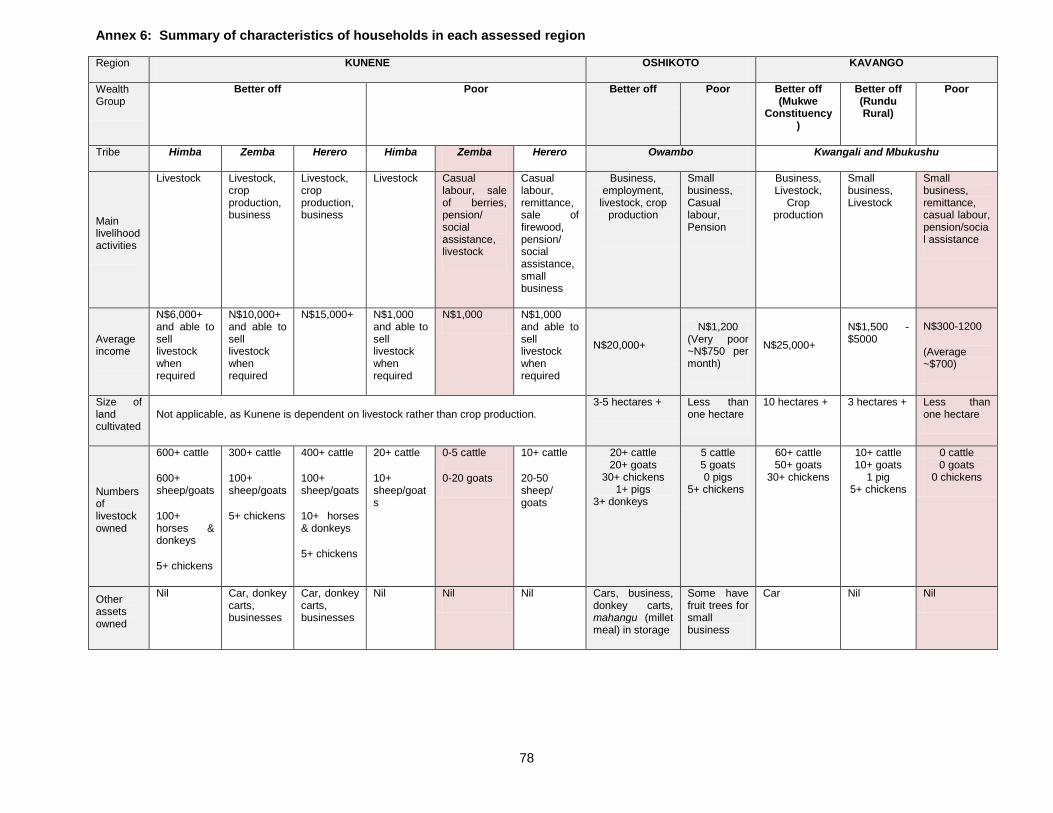
78
Annex 6: Summary of characteristics of households in each assessed region
Region KUNENE OSHIKOTO KAVANGO
Wealth Group
Better off Poor Better off Poor Better off (Mukwe
Constituency)
Better off (Rundu Rural)
Poor
Tribe Himba Zemba Herero Himba Zemba Herero Owambo Kwangali and Mbukushu
Main livelihood activities
Livestock Livestock, crop production, business
Livestock, crop production, business
Livestock Casual labour, sale of berries, pension/ social assistance, livestock
Casual labour, remittance, sale of firewood, pension/ social assistance, small business
Business, employment,
livestock, crop production
Small business, Casual labour, Pension
Business, Livestock,
Crop production
Small business, Livestock
Small business, remittance, casual labour, pension/social assistance
Average income
N$6,000+ and able to sell livestock when required
N$10,000+ and able to sell livestock when required
N$15,000+ N$1,000 and able to sell livestock when required
N$1,000 N$1,000 and able to sell livestock when required
N$20,000+
N$1,200 (Very poor ~N$750 per month)
N$25,000+
N$1,500 - $5000
N$300-1200
(Average ~$700)
Size of land cultivated
Not applicable, as Kunene is dependent on livestock rather than crop production. 3-5 hectares + Less than
one hectare 10 hectares + 3 hectares + Less than
one hectare
Numbers of livestock owned
600+ cattle
600+ sheep/goats
100+ horses & donkeys
5+ chickens
300+ cattle
100+ sheep/goats
5+ chickens
400+ cattle
100+ sheep/goats
10+ horses & donkeys
5+ chickens
20+ cattle
10+ sheep/goats
0-5 cattle
0-20 goats
10+ cattle
20-50 sheep/ goats
20+ cattle 20+ goats
30+ chickens 1+ pigs
3+ donkeys
5 cattle 5 goats 0 pigs
5+ chickens
60+ cattle 50+ goats
30+ chickens
10+ cattle 10+ goats
1 pig 5+ chickens
0 cattle 0 goats
0 chickens
Other assets owned
Nil Car, donkey carts, businesses
Car, donkey carts, businesses
Nil Nil Nil Cars, business, donkey carts, mahangu (millet meal) in storage
Some have fruit trees for small business
Car Nil Nil
Recommended


