Flow focusing pneumatic nebulizer in comparison with several
micronebulizers in inductively coupled plasma atomic emission
spectrometryw
Beatriz Almagro,aAlfonso M. Ganan-Calvo,
bMontserrat Hidalgo
aand
Antonio Canals*a
Received 4th January 2006, Accepted 19th June 2006
First published as an Advance Article on the web 5th July 2006
DOI: 10.1039/b518282d
A new pneumatic concentric nebulizer (flow focusing pneumatic nebulizer, FFPN) is characterized
and compared with five commercially available pneumatic micronebulizers (high efficiency
nebulizer (HEN), PFA-micronebulizer (PFA), MicroMist (MM), Ari Mist (AM) and Mira Mist
(MiM)) operated in conjunction with the same cyclonic spray chamber. Primary and tertiary
aerosols, transport magnitudes (solvent and analyte transport rates) and analytical figures of
merit obtained using inductively coupled plasma atomic emission spectroscopy are measured.
Under all the conditions studied, all the primary aerosols produced by FFPN are contained in
droplets smaller than 15 mm. Primary and tertiary aerosols produced by FFPN show very similar
characteristics. This is the result of the small filtering action of the cyclonic spray chamber used
when the FFPN is used. Under all the conditions studied, the FFPN produces a finer and
narrower primary aerosol than the commercial pneumatic micronebulizers. At a solution uptake
rate of 0.2 mL min�1 and a nebulizing gas flow rate of 0.7 L min�1 the median diameter (D50)
values of the primary aerosols are 21.71 mm, 31.75 mm, 16.84 mm, 13.13 mm, 4.92 mm and 3.25 mmwith the PFA, MM, AM, MiM, HEN and FFPN, respectively. The tertiary aerosols do not show
a substantial difference, the D50 values, under the same operating conditions stated above, being
3.90 mm, 3.91 mm, 4.38 mm, 4.07 mm, 2.95 mm and 3.59 mm for the PFA, MM, AM, MiM, HEN
and FFPN, respectively. For example, under the above experimental conditions, nearly 30%,
20%, 44%, 51%, 100% and 100% of primary aerosol volume is contained in droplets having
sizes smaller than the cut-off diameter of the spray chamber used (20 mm) for the PFA, MM,
AM, MiM, HEN and FFPN, respectively. However, the tertiary aerosol volume contained on
droplets smaller than 9 mm ranges between 85%–99%. This is a clear consequence of the strong
filtering action of the spray chamber when used with the PFA, MM, AM and MiM nebulizers.
Solvent and analyte transport rate values obtained with the FFPN are the highest, the analyte
transport rate values being 6.4 mg min�1, 7.0 mg min�1, 5.1 mg min�1, 5.9 mg min�1, 10.1 mg min�1
and 15.8 mg min�1 for the PFA, MM, AM, MiM, HEN and FFPN, respectively. In general,
working under the same liquid and gas flow rates, sensitivities, precision and limits of detection
obtained with the FFPN are similar to those obtained with HEN and better than for PFA, MM,
AM and MiM nebulizers.
Introduction
Inductively coupled plasma atomic emission spectrometry
(ICP-AES) and inductively coupled plasma mass spectrometry
(ICP-MS) are widely used in various fields because of their
high sensitivity and capability for simultaneous determination
of most elements in the periodic table.1,2 Samples are usually
presented in liquid state, therefore nebulization of solutions is
still the most common means of sample introduction in
inductively coupled plasma-based analytical techniques. In
these techniques an aerosol is generated by means of a
nebulizer and it is transported to the atomizer through the
spray chamber. Therefore, the ICP-AES and ICP-MS conven-
tional liquid sample introduction systems consist of a nebuli-
zer, mainly of the pneumatic type, a spray chamber and an
injector tube. The concentric, pneumatic, all-glass nebulizers
are the most commonly used nebulizers due to their simplicity,
stability and reliability. Cross flow nebulizers are also widely
used but concentric nebulizers are more frequently used for
ICP-based analytical techniques than devices of cross flow
design because higher sensitivity is obtained and adjustment of
gas and liquid capillaries is not necessary.2 However, conven-
tional pneumatic concentric nebulizers suffer from a number
aDepartamento de Quımica Analıtica, Nutricion y Bromatologıa,Universidad de Alicante, Apdo. 99, E-03080 Alicante, Spain.E-mail: [email protected]
b Escuela Superior de Ingenieros, Universidad de Sevilla, Camino delos Descubrimientos s/n, E-41092 Sevilla, Spain
w Electronic supplementary information (ESI) available: sprays fromnebulizers. See DOI: 10.1039/b518282d
770 | J. Anal. At. Spectrom., 2006, 21, 770–777 This journal is �c The Royal Society of Chemistry 2006
PAPER www.rsc.org/jaas | Journal of Analytical Atomic Spectrometry
of drawbacks such as high sample consumption, low transport
efficiency and clogging with high salt content samples. In order
to eliminate, or at least to reduce, these important problems, a
significant amount of research has been done during the past
several years. As a result of it, new nebulizers based on more
efficient interaction between the liquid and gas streams or new
mechanisms of nebulization have been suggested. Among
them are the hydraulic high pressure pneumatic nebulizer,3–6
single-bore high-pressure pneumatic nebulizer,7–11 Burgener
nebulizer,12–14 direct injection nebulizer,15–20 oscillating capil-
lary nebulizer,21,22 and ultrasonic nebulizer.23–27 The majority
of these systems show some important advantages over the
conventional pneumatic concentric nebulizers: higher solution
transport efficiencies and sensitivities, better precision, lower
limits of detection, matrix interferences and memory effects
are reduced and higher salt content solutions can be
handled.4,10,15,22,23 Although these nebulizers show some in-
teresting features, they still suffer from some drawbacks. For
instance, for pneumatic type nebulizers the nebulizing gas
must be supplied at a higher pressure than usual so connecting
lines and sample pumping systems should be able to withstand
this pressure. These requirements increase the cost of the
nebulizer and make it less safe and more difficult to use.
Hydraulic and ultrasonic nebulizers have an additional re-
quirement. Because of the solvent overload of the plasma, a
desolvation system is recommended when a hydraulic high
pressure pneumatic nebulizer is used for aerosol generation and
is indispensable when an ultrasonic nebulizer is used.3,25–27
A direct injection nebulizer needs a relatively complex setup
and requires a high-pressure pump for sample delivery. In
addition, the high transport efficiency could produce plasma
cooling and/or carbon deposition which deteriorates sensitiv-
ity and/or precision. Moreover, pneumatic and ultrasonic
nebulizers consume a relatively large amount of sample solu-
tion (1–3 mL min�1) which limits their usefulness for very
small sample volumes.
In recent times, increasing interest has been shown in
introducing the sample solutions at flow rates on the microlitre
per minute level by using various highly efficient nebulizers
(i.e., micronebulizers). Among the non-pneumatic micronebu-
lizers are the microultrasonic nebulizer28 and the sonic-
spray nebulizer.29–31 Among the pneumatic micronebulizers
are the high efficiency cross flow micronebulizer,32 the micro-
concentric nebulizer,33–37 the high efficiency nebulizer
(HEN),38–42 the PFA micronebulizer (PFA),43,44 the Micro-
Mist nebulizer (MM),44–48 the Burgener micronebulizer49 and
the direct injection high efficiency nebulizer.50–55 Some of these
are concentric pneumatic micronebulizers and the main dif-
ference between them and the conventional concentric pneu-
matic nebulizers is a substantial reduction in their gas and/or
liquid exit cross-sectional areas and liquid capillary wall
thickness.56,57 In general terms, the analytical performance
of low liquid flow rate nebulizers is superior to that of a
conventional high liquid flow rate nebulizer and some micro-
nebulizers are highly efficient nebulizers (i.e., high efficiency
nebulizer, microconcentric nebulizer). However, some com-
mercial micronebulizers still suffer from some drawbacks.
These are: (i) expensive, more so than the conventional
nebulizers; (ii) more difficult to handle and need special
connections; (iii) breakable; and (iv) very prone to blockage
by solutions of high salt concentration.
Consequently, a research effort must be still made in order
to design new nebulization systems capable of keeping the
advantages of micronebulizers but removing, or at least redu-
cing, their limitations. In this way, flow focusing pneumatic
nebulization has been recently introduced as a new aerosol
generation technology for liquid sample introduction in atom-
ic spectrometry.58,59 An overview of the hydrodynamic prin-
ciples of this new nebulization technique is given by Ganan-
Calvo.60 The hydrodynamic principles and main analytical
figures of merit of this nebulization technique for sample
introduction in plasma-based analytical techniques have been
previously compared with conventional high liquid flow con-
centric pneumatic nebulizers,58,59 but they have never been
compared with other commercial micronebulizers.
The main aim of the present study was to investigate the
efficiency of the Flow Focusing Pneumatic Nebulizer (FFPN)
as micronebulizer. To this end, some fundamental studies
about the nebulizacion process were carried out by means of
drop size distributions measurements. Performance of the
FFPN was evaluated by measuring the analyte and solvent
transport efficiencies and analytical figures of merit. Finally,
the results obtained with the FFPN were compared with a
representative group of micronebulizers that nowadays are
commercially available.
Experimental
Nebulizer description
The hydrodynamic principles and main features of the new
nebulizer have been previously introduced.58,60 However,
some modifications in the design of the previous prototype
have been made in order to improve its analytical performance
and chemical and mechanical robustness. After some chemical
resistance tests, the main body and nozzle have been made of
Teflons with 25% graphite. The aerosol exit orifice is placed
on a platinum sheet (L = 125 mm) located inside the Teflons
body. The body parts have been reduced to a single one, pro-
viding enhanced mechanical robustness. The inner geometrical
configuration of the nebulizer is maintained approximately
equal to the previous one.58 The main modifications are as
follows. The liquid feeding capillary tube is made of platinum
(150 mm id, 400 mm od), and the exit orifice diameter is 180 mm.
The most important modification is a reduction in the distance
from the liquid capillary tube to the exit orifice (distanceH). In
this new FFPN prototype, H has been made approximately
equal to 70 mm. This reduction in H as compared with that
previously used58 has provided better results in terms of a
smaller droplet size for a given set of working parameters.
Sample introduction system
In order to compare the behaviour of the nebulizers evaluated,
the same cyclonic spray chamber (P/N 808-8882, Glass Ex-
pansion, West Melbourne, Victoria, Australia) (D47.5 mL
inner volume) was used in all cases.
The pneumatic concentric micronebulizers used for compar-
ison were: MicroMist nebulizer (MM) (Glass Expansion); high
This journal is �c The Royal Society of Chemistry 2006 J. Anal. At. Spectrom., 2006, 21, 770–777 | 771
efficiency nebulizer (HEN) (Meinhard Glass Products, Gold-
en, Colorado, USA) and MicroFlow PFA (PFA) (Elemental
Scientific ESI, Omaha, Nebraska, USA). Two Burgener nebu-
lizers were also used for comparison: Ari Mist nebulizer (AM)
and PEEK Mira Mist nebulizer (MiM) (Burgener Research
International, Mississauga, Ontario, Canada).49 From the
manufacturer specifications, these two nebulizers could not
been considered as typical micronebulizers, especially the
MiM, since they cover a broad range of liquid flows. However,
the liquid flows evaluated with the micronebulizers are in-
cluded in the range of liquid flows allowed for these nebulizers.
Hence, they were evaluated under liquid flow rates smaller than
1 mL min�1. In addition, it has been suggested49 that these
nebulizers are sensitive to orientation, especially for cyclonic
chambers, since it determines the aerosol interaction with the
spray chamber. Hence, the orientation of the gas outlet with
respect to the sample outlet was optimized by systematically
rotating the nebulizer to identify the orientation which pro-
vides maximum sensitivity for eight lines: Cd I 228.802 nm, Cr
II 267.716 nm, Cu I 327.393 nm, Fe II 238.204 nm, Mg I
285.213 nm, Mn II 257.610 nm, Ni II 221.648 nm and Pb II
220.353 nm. No significant differences were observed between
positions and, hence, both stream outlets were vertically
aligned with the gas outlet in the lower position.
Aqueous solutions were introduced through all nebulizers
via a syringe pump (Precidor syringe pump, INFORS AG,
Bottmingen, Switzerland) in order to assure: (i) stability of
liquid flow rate (i.e., no pulsation on liquid flow); and (ii)
enough pressure on the liquid channel to eliminate a liquid
back flow. Sterile syringes (BD Plastipaks, Becton Dickinson
S.A., San Agustın de Guadalix, Madrid, Spain) of 5 mL
capacity were used with all nebulizers evaluated. The spray
chamber waste was removed with the peristaltic pump of the
atomic spectrometer. The nebulizing gas flow was controlled
with a pressure regulator (ref. 0.821.302.025, Bosch GmbH,
Stuttgart, Germany) and a manometer (Digitron Model
2003P, Sifam Instruments Limited, Torquay, England). Argon
was always used as the nebulizing carrier gas.
Drop size measurement instrumentation
Drop size distributions of primary and tertiary aerosols (i.e.,
pDSD and tDSD, respectively) were measured by means of a
laser diffraction system (Model HELOS, Sympatec GmbH,
System-Partikel-Technik, Clausthal-Zellerfeld, Germany).58
The volume median diameter (D50) was used for characterizing
the mean size of both aerosols. It has been experimentally
proved that Mie theory is better for the range of droplets
studied, and therefore this evaluation mode was the one
chosen throughout this work. Primary aerosols were sampled
1.5 mm from the nebulizer tip along the centre line of the
aerosol and tertiary aerosols were measured 1.5 mm from the
end of the spray chamber at the centre line of the chamber exit.
Data shown (i.e., drop size distributions and volume median
diameters) are the mean of three replicates.
Solvent and analyte transport rate measurements
Solvent and analyte transport rate measurements were per-
formed by means of direct methods.61 The solvent transport
rate (Stot) was measured by adsorption of the tertiary aerosol
in a U-tube filled with silica gel during a 10 min period. By
weighing the tube before and after the aerosol exposure, the
Stot values were easily derived. The analyte transport rate
(Wtot) was obtained by collecting the tertiary aerosol on a
glass-fibre filter (Type A/E, 47 mm diameter, 0.3 mm pore size;
Gelman Sciences, Ann Arbor, MI, USA) placed above the
spray chamber. A 500 mg L�1 Mn solution was nebulized. The
Mn retained after a period of 10 min was extracted by washing
the filters with 1.0% (m/m) hot nitric acid. The total solution
volume was adjusted to 100 mL in a volumetric flask. Finally,
the Mn concentration in each solution was determined by
flame atomic absorption spectrometry. The values given are
the mean of three replicates.
ICP-AES instrumentation
Signals were measured using an inductively coupled plasma
atomic emission spectrometer (Model Optima 4300 DV,
PerkinElmer, Norwalk, CT, USA). Technical details of this
spectrometer have been previously described.58 The instru-
mental conditions used are listed in Table 1.
Figures of merit were evaluated using an aqueous solution
containing 0.5 M HNO3 and 1 mg L�1 of each of the elements
studied. Several atomic and ionic lines covering a wide range
of energy sum values, Esum (i.e., sum of ionization, Eion, and
excitation, Eexc, energies) were evaluated. Table 2 shows the
elements and lines evaluated.
Reagents
For ICP-AES measurements, a 1.0 mg L�1 multi-element
standard solution was prepared by diluting a 1000 mg L�1
Table 1 Operating conditions used on the ICP-AES measurements
Outer gas flow rate/L min�1 15Intermediate gas flow rate/L min�1 0.2Nebulizer-carrier gas flow/L min�1 VariableRF power/W 1300Nominal frequency/MHz 40Liquid flow rate/mL min�1 VariableSpray chamber Cyclonic-type (47.5 mL)Integration time/s 0.1Read time/s 1Viewing mode Radial
Table 2 Energy values for the selected lines
Line type Element Wavelength/nm Eion/eV Eexc/eV Esuma/eV
Soft lines Na I 589.583 (5.14) 2.10 2.10Cu I 327.393 (7.73) 3.82 3.82Li I 610.362 (5.39) 3.88 3.88Mg I 285.213 (7.65) 4.35 4.35
Hard lines Cd I 228.802 (8.99) 5.42 5.42Sr II 421.546 5.69 2.94 8.63Ba II 233.527 5.21 6.01 11.22Mg II 280.266 7.65 4.42 12.06Mn II 257.610 7.44 4.81 12.25Cr II 267.716 6.77 6.16 12.93Fe II 238.204 7.87 5.20 13.07Ni II 221.647 7.64 6.63 14.27Pb II 220.353 7.42 7.37 14.79
a Esum = ionization energy (Eion) þ excitation energy (Eexc).
772 | J. Anal. At. Spectrom., 2006, 21, 770–777 This journal is �c The Royal Society of Chemistry 2006
stock solution (ICP Multi Element Standard Solution IV
CertiPURs, Merck, Darmstadt, Germany) with 0.5 M
HNO3 prepared from 65% high purity acid (Merck) in
distilled de-ionized water. All solutions were previously filtered
with Acrodiscs syringe filters of 0.45 mm Supors Membrane
(PALL Corporation, Ann Arbor, MI, USA). Distilled de-
ionized water (18.3 MO cm) was used throughout this work.
Results and discussion
Drop size distributions
Primary aerosols. The quality of the primary aerosols
produced by the flow focusing pneumatic nebulizer (FFPN)
at different liquid and gas flow rates were quantitatively
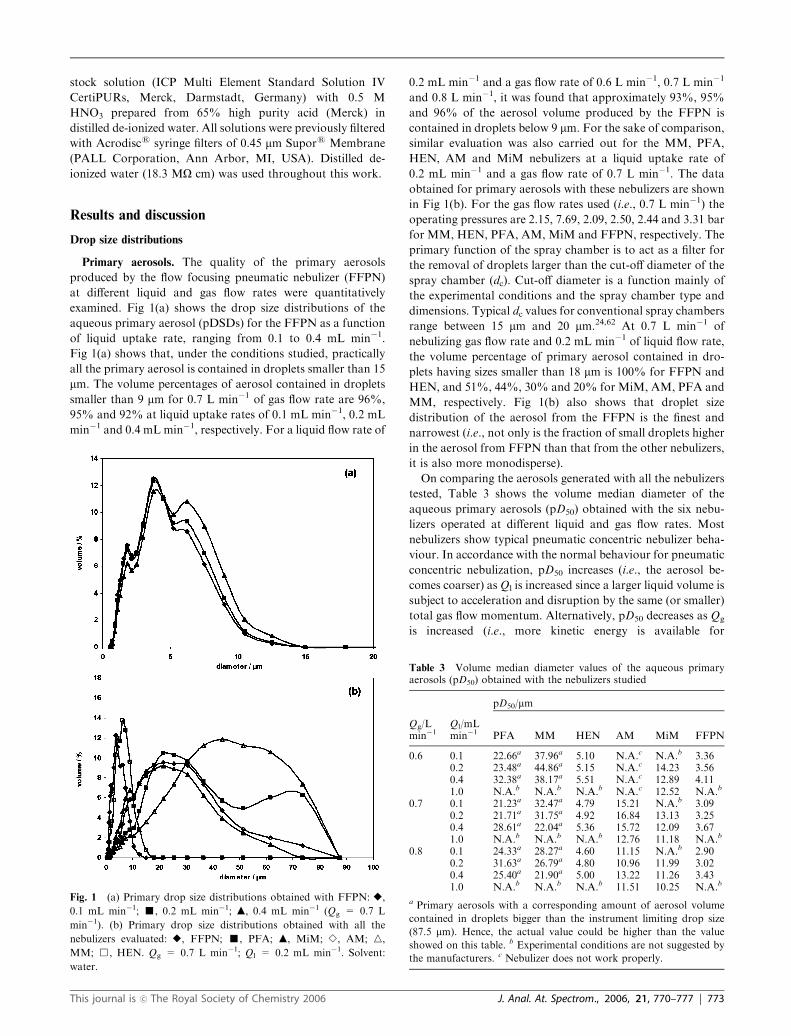
examined. Fig 1(a) shows the drop size distributions of the
aqueous primary aerosol (pDSDs) for the FFPN as a function
of liquid uptake rate, ranging from 0.1 to 0.4 mL min�1.
Fig 1(a) shows that, under the conditions studied, practically
all the primary aerosol is contained in droplets smaller than 15
mm. The volume percentages of aerosol contained in droplets
smaller than 9 mm for 0.7 L min�1 of gas flow rate are 96%,
95% and 92% at liquid uptake rates of 0.1 mL min�1, 0.2 mL
min�1 and 0.4 mL min�1, respectively. For a liquid flow rate of
0.2 mL min�1 and a gas flow rate of 0.6 L min�1, 0.7 L min�1
and 0.8 L min�1, it was found that approximately 93%, 95%
and 96% of the aerosol volume produced by the FFPN is
contained in droplets below 9 mm. For the sake of comparison,
similar evaluation was also carried out for the MM, PFA,
HEN, AM and MiM nebulizers at a liquid uptake rate of
0.2 mL min�1 and a gas flow rate of 0.7 L min�1. The data
obtained for primary aerosols with these nebulizers are shown
in Fig 1(b). For the gas flow rates used (i.e., 0.7 L min�1) the
operating pressures are 2.15, 7.69, 2.09, 2.50, 2.44 and 3.31 bar
for MM, HEN, PFA, AM, MiM and FFPN, respectively. The
primary function of the spray chamber is to act as a filter for
the removal of droplets larger than the cut-off diameter of the
spray chamber (dc). Cut-off diameter is a function mainly of
the experimental conditions and the spray chamber type and
dimensions. Typical dc values for conventional spray chambers
range between 15 mm and 20 mm.24,62 At 0.7 L min�1 of
nebulizing gas flow rate and 0.2 mL min�1 of liquid flow rate,
the volume percentage of primary aerosol contained in dro-
plets having sizes smaller than 18 mm is 100% for FFPN and
HEN, and 51%, 44%, 30% and 20% for MiM, AM, PFA and
MM, respectively. Fig 1(b) also shows that droplet size
distribution of the aerosol from the FFPN is the finest and
narrowest (i.e., not only is the fraction of small droplets higher
in the aerosol from FFPN than that from the other nebulizers,
it is also more monodisperse).
On comparing the aerosols generated with all the nebulizers
tested, Table 3 shows the volume median diameter of the
aqueous primary aerosols (pD50) obtained with the six nebu-
lizers operated at different liquid and gas flow rates. Most
nebulizers show typical pneumatic concentric nebulizer beha-
viour. In accordance with the normal behaviour for pneumatic
concentric nebulization, pD50 increases (i.e., the aerosol be-
comes coarser) as Ql is increased since a larger liquid volume is
subject to acceleration and disruption by the same (or smaller)
total gas flow momentum. Alternatively, pD50 decreases as Qg
is increased (i.e., more kinetic energy is available for
Fig. 1 (a) Primary drop size distributions obtained with FFPN:E,
0.1 mL min�1; ’, 0.2 mL min�1; m, 0.4 mL min�1 (Qg = 0.7 L
min�1). (b) Primary drop size distributions obtained with all the
nebulizers evaluated: E, FFPN; ’, PFA; m, MiM; B, AM; n,
MM; &, HEN. Qg = 0.7 L min�1; Ql = 0.2 mL min�1. Solvent:
water.
Table 3 Volume median diameter values of the aqueous primaryaerosols (pD50) obtained with the nebulizers studied
pD50/mm
Qg/Lmin�1
Ql/mLmin�1 PFA MM HEN AM MiM FFPN
0.6 0.1 22.66a 37.96a 5.10 N.A.c N.A.b 3.360.2 23.48a 44.86a 5.15 N.A.c 14.23 3.560.4 32.38a 38.17a 5.51 N.A.c 12.89 4.111.0 N.A.b N.A.b N.A.b N.A.c 12.52 N.A.b
0.7 0.1 21.23a 32.47a 4.79 15.21 N.A.b 3.090.2 21.71a 31.75a 4.92 16.84 13.13 3.250.4 28.61a 22.04a 5.36 15.72 12.09 3.671.0 N.A.b N.A.b N.A.b 12.76 11.18 N.A.b
0.8 0.1 24.33a 28.27a 4.60 11.15 N.A.b 2.900.2 31.63a 26.79a 4.80 10.96 11.99 3.020.4 25.40a 21.90a 5.00 13.22 11.26 3.431.0 N.A.b N.A.b N.A.b 11.51 10.25 N.A.b
a Primary aerosols with a corresponding amount of aerosol volume
contained in droplets bigger than the instrument limiting drop size
(87.5 mm). Hence, the actual value could be higher than the value
showed on this table. b Experimental conditions are not suggested by
the manufacturers. c Nebulizer does not work properly.
This journal is �c The Royal Society of Chemistry 2006 J. Anal. At. Spectrom., 2006, 21, 770–777 | 773

nebulization of the same liquid volume). It should be borne in
mind that the drop size distributions of aerosols generated
with MM are towards the upper limit of the instrument used.
However, although this could invalidate the absolute value for
this nebulizer, its order of magnitude is correctly obtained. In
addition, with the AM and MiM nebulizers, the higher the Ql,
the lower the pD50 values. This behaviour could be explained
based on the different nebulizer design49 and, hence, the
different nebulization mechanism (i.e., prefilming) of AM
and MiM nebulizers.7 The aerosols generated by FFPN pre-
sent the same trend as conventional pneumatic concentric
nebulizers and, besides, they are the finest ones. For a given
set of conditions of 0.2 mL min�1 of liquid uptake rate and
0.7 L min�1 of gas flow rate, the pD50 of primary aerosols are
21.71 mm, 31.75 mm, 4.92 mm, 16.84 mm, 13.13 mm and 3.25 mmfor PFA, MM, HEN, AM, MiM and FFPN, respectively.
HEN is defined as a highly efficient nebulizer; even so, the
primary aerosols generated by the FFPN are always finer than
the HEN primary aerosols. The pD50 values for liquid uptake
rate range from 0.1 to 0.4 mL min�1 and with a gas flow rate
of 0.7 L min�1 are 4.79 mm, 4.92 mm, 5.36 mm for HEN and
3.09 mm, 3.25 mm, 3.67 mm for FFPN. MM and PFA nebu-
lizers show the highest median diameter values. For all the
conditions tested, the pD50 values for PFA and MM range
from 21.23 mm to 32.38 mm and from 21.90 mm to 44.86 mm,
respectively. The AM and MiM nebulizers show pD50 values
located in the middle of the total pD50 range obtained, from
10.25 mm to 16.84 mm.
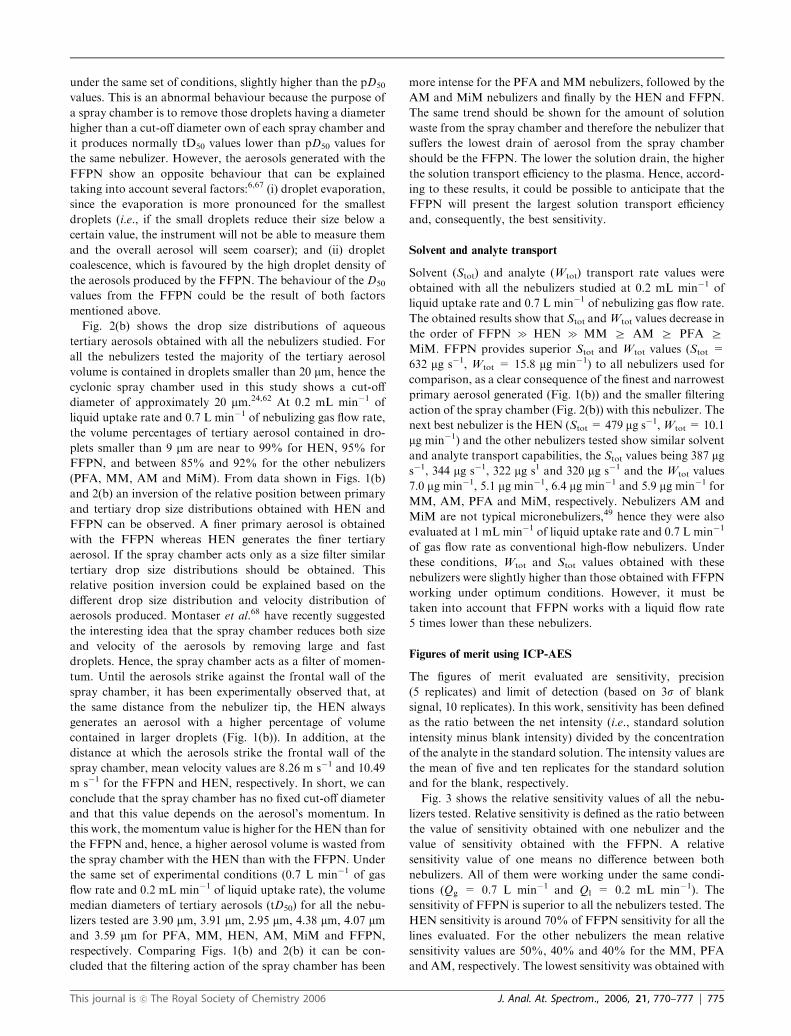
Tertiary aerosols. The characteristics of the tertiary aerosols
produced by the FFPN using the cyclonic spray chamber are
shown in Fig. 2(a). This figure shows the drop size distribu-
tions of the aqueous tertiary aerosols (tDSD) for the FFPN
evaluated as a function of liquid uptake rate, ranging from 0.1
to 0.4 mL min�1. Large droplets (>8 mm) decrease sensitivity
and contribute negatively to noise, since vaporization and
ionization in the vicinity of large droplets are likely to be
suppressed, and emission or ionization of analyte can fluctuate
near desolvating and vaporizing droplets.63–66 The volume
percentage of tertiary aerosol contained in droplets smaller
than 9 mm ranges between 92% and 97% for all the conditions
tested for the FFPN. With the FFPN, both the shape of the
drop size distribution and the magnitude of the volume
median diameter are similar between primary and tertiary
aerosols. The small change in aerosol characteristics produced
when the aerosol passes through the spray chamber could be
due to the fact that the primary aerosol volume is mainly
contained on droplets smaller than the cut-off diameter of the
spray chamber used (i.e., commonly smaller than 20 mm).24,62
This phenomenon is very striking since a high percentage of
primary aerosol could be transported through the spray
chamber and will supply positive signal. Both beneficial effects
will increase sensitivity. Table 4 shows the volume median
diameter of the aqueous tertiary aerosols for all the nebulizers
tested. The values of volume median diameter of the tertiary
aerosols for the FFPN at 0.7 L min�1 gas flow rate are 3.44
mm, 3.59 mm and 3.91 mm at a liquid uptake rate of 0.1 mL
min�1, 0.2 mL min�1 and 0.4 mL min�1, respectively; and
under the same set of conditions the pD50 values are 3.09 mm,
3.25 mm and 3.67 mm. For a liquid flow rate of 0.2 mL min�1
and gas flow rates of 0.6 L min�1, 0.7 L min�1 and 0.8 L
min�1, the tD50 values for the FFPN are 3.81 mm, 3.59 mm and
3.37 mm, and the pD50 values are 3.56 mm, 3.25 mm and 3.02
mm, respectively. The tD50 values obtained for the FFPN are,
Fig. 2 (a) Tertiary drop size distributions obtained with FFPN:E,
0.1 mL min�1; ’, 0.2 mL min�1; m, 0.4 mL min�1 (Qg = 0.7 L
min�1). (b) Tertiary drop size distributions obtained with all the
nebulizers evaluated: E, FFPN; ’, PFA; m, MiM; B, AM; n,
MM; &, HEN. Qg = 0.7 L min�1; Ql = 0.2 mL min�1. Solvent:
water.
Table 4 Volume median diameter values of the aqueous tertiaryaerosols (tD50) obtained with the nebulizers studied
tD50/mm
Qg/Lmin�1
Ql/mLmin�1 PFA MM HEN AM MiM FFPN
0.6 0.1 4.22 4.26 3.15 N.A. N.A. 3.360.2 4.26 4.47 3.28 N.A. 4.49 3.810.4 4.60 4.83 3.44 N.A. 4.82 4.231.0 N.A. N.A. N.A. N.A. 5.37 N.A.
0.7 0.1 3.97 3.77 2.92 4.46 N.A. 3.440.2 3.90 3.91 2.95 4.38 4.07 3.590.4 4.15 4.12 3.15 4.21 4.26 3.911.0 N.A. N.A. N.A. 4.63 4.83 N.A.
0.8 0.1 3.42 3.32 2.74 3.65 N.A. 3.220.2 3.55 3.50 2.78 3.57 3.72 3.370.4 3.81 3.63 2.90 3.70 3.90 3.631.0 N.A. N.A. N.A. 4.22 4.37 N.A.
774 | J. Anal. At. Spectrom., 2006, 21, 770–777 This journal is �c The Royal Society of Chemistry 2006
under the same set of conditions, slightly higher than the pD50
values. This is an abnormal behaviour because the purpose of
a spray chamber is to remove those droplets having a diameter
higher than a cut-off diameter own of each spray chamber and
it produces normally tD50 values lower than pD50 values for
the same nebulizer. However, the aerosols generated with the
FFPN show an opposite behaviour that can be explained
taking into account several factors:6,67 (i) droplet evaporation,
since the evaporation is more pronounced for the smallest
droplets (i.e., if the small droplets reduce their size below a
certain value, the instrument will not be able to measure them
and the overall aerosol will seem coarser); and (ii) droplet
coalescence, which is favoured by the high droplet density of
the aerosols produced by the FFPN. The behaviour of the D50
values from the FFPN could be the result of both factors
mentioned above.
Fig. 2(b) shows the drop size distributions of aqueous
tertiary aerosols obtained with all the nebulizers studied. For
all the nebulizers tested the majority of the tertiary aerosol
volume is contained in droplets smaller than 20 mm, hence the
cyclonic spray chamber used in this study shows a cut-off
diameter of approximately 20 mm.24,62 At 0.2 mL min�1 of
liquid uptake rate and 0.7 L min�1 of nebulizing gas flow rate,
the volume percentages of tertiary aerosol contained in dro-
plets smaller than 9 mm are near to 99% for HEN, 95% for
FFPN, and between 85% and 92% for the other nebulizers
(PFA, MM, AM and MiM). From data shown in Figs. 1(b)
and 2(b) an inversion of the relative position between primary
and tertiary drop size distributions obtained with HEN and
FFPN can be observed. A finer primary aerosol is obtained
with the FFPN whereas HEN generates the finer tertiary
aerosol. If the spray chamber acts only as a size filter similar
tertiary drop size distributions should be obtained. This
relative position inversion could be explained based on the
different drop size distribution and velocity distribution of
aerosols produced. Montaser et al.68 have recently suggested
the interesting idea that the spray chamber reduces both size
and velocity of the aerosols by removing large and fast
droplets. Hence, the spray chamber acts as a filter of momen-
tum. Until the aerosols strike against the frontal wall of the
spray chamber, it has been experimentally observed that, at
the same distance from the nebulizer tip, the HEN always
generates an aerosol with a higher percentage of volume
contained in larger droplets (Fig. 1(b)). In addition, at the
distance at which the aerosols strike the frontal wall of the
spray chamber, mean velocity values are 8.26 m s�1 and 10.49
m s�1 for the FFPN and HEN, respectively. In short, we can
conclude that the spray chamber has no fixed cut-off diameter
and that this value depends on the aerosol’s momentum. In
this work, the momentum value is higher for the HEN than for
the FFPN and, hence, a higher aerosol volume is wasted from
the spray chamber with the HEN than with the FFPN. Under
the same set of experimental conditions (0.7 L min�1 of gas
flow rate and 0.2 mL min�1 of liquid uptake rate), the volume
median diameters of tertiary aerosols (tD50) for all the nebu-
lizers tested are 3.90 mm, 3.91 mm, 2.95 mm, 4.38 mm, 4.07 mmand 3.59 mm for PFA, MM, HEN, AM, MiM and FFPN,
respectively. Comparing Figs. 1(b) and 2(b) it can be con-
cluded that the filtering action of the spray chamber has been
more intense for the PFA and MM nebulizers, followed by the
AM and MiM nebulizers and finally by the HEN and FFPN.
The same trend should be shown for the amount of solution
waste from the spray chamber and therefore the nebulizer that
suffers the lowest drain of aerosol from the spray chamber
should be the FFPN. The lower the solution drain, the higher
the solution transport efficiency to the plasma. Hence, accord-
ing to these results, it could be possible to anticipate that the
FFPN will present the largest solution transport efficiency
and, consequently, the best sensitivity.
Solvent and analyte transport
Solvent (Stot) and analyte (Wtot) transport rate values were
obtained with all the nebulizers studied at 0.2 mL min�1 of
liquid uptake rate and 0.7 L min�1 of nebulizing gas flow rate.
The obtained results show that Stot andWtot values decrease in
the order of FFPN c HEN c MM Z AM Z PFA Z
MiM. FFPN provides superior Stot and Wtot values (Stot =
632 mg s�1, Wtot = 15.8 mg min�1) to all nebulizers used for
comparison, as a clear consequence of the finest and narrowest
primary aerosol generated (Fig. 1(b)) and the smaller filtering
action of the spray chamber (Fig. 2(b)) with this nebulizer. The
next best nebulizer is the HEN (Stot = 479 mg s�1,Wtot = 10.1
mg min�1) and the other nebulizers tested show similar solvent
and analyte transport capabilities, the Stot values being 387 mgs�1, 344 mg s�1, 322 mg s1 and 320 mg s�1 and the Wtot values
7.0 mg min�1, 5.1 mg min�1, 6.4 mg min�1 and 5.9 mg min�1 for
MM, AM, PFA and MiM, respectively. Nebulizers AM and
MiM are not typical micronebulizers,49 hence they were also
evaluated at 1 mL min�1 of liquid uptake rate and 0.7 L min�1
of gas flow rate as conventional high-flow nebulizers. Under
these conditions, Wtot and Stot values obtained with these
nebulizers were slightly higher than those obtained with FFPN
working under optimum conditions. However, it must be
taken into account that FFPN works with a liquid flow rate
5 times lower than these nebulizers.
Figures of merit using ICP-AES
The figures of merit evaluated are sensitivity, precision
(5 replicates) and limit of detection (based on 3s of blank
signal, 10 replicates). In this work, sensitivity has been defined
as the ratio between the net intensity (i.e., standard solution
intensity minus blank intensity) divided by the concentration
of the analyte in the standard solution. The intensity values are
the mean of five and ten replicates for the standard solution
and for the blank, respectively.
Fig. 3 shows the relative sensitivity values of all the nebu-
lizers tested. Relative sensitivity is defined as the ratio between
the value of sensitivity obtained with one nebulizer and the
value of sensitivity obtained with the FFPN. A relative
sensitivity value of one means no difference between both
nebulizers. All of them were working under the same condi-
tions (Qg = 0.7 L min�1 and Ql = 0.2 mL min�1). The
sensitivity of FFPN is superior to all the nebulizers tested. The
HEN sensitivity is around 70% of FFPN sensitivity for all the
lines evaluated. For the other nebulizers the mean relative
sensitivity values are 50%, 40% and 40% for the MM, PFA
and AM, respectively. The lowest sensitivity was obtained with
This journal is �c The Royal Society of Chemistry 2006 J. Anal. At. Spectrom., 2006, 21, 770–777 | 775
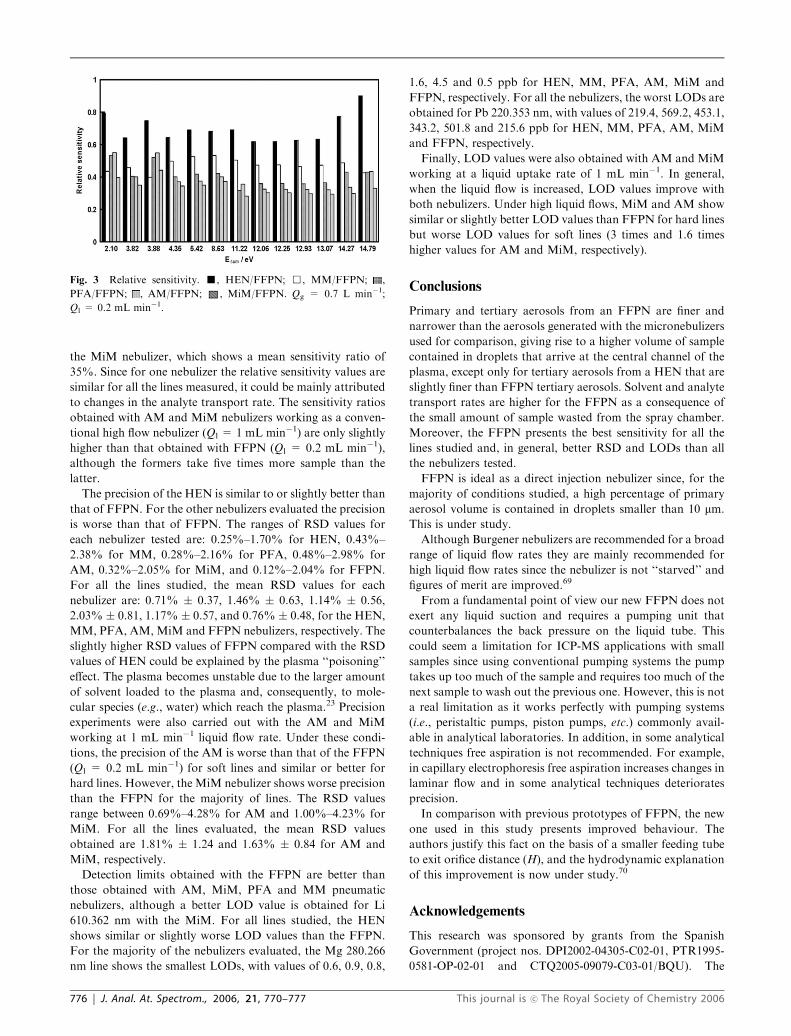
the MiM nebulizer, which shows a mean sensitivity ratio of
35%. Since for one nebulizer the relative sensitivity values are
similar for all the lines measured, it could be mainly attributed
to changes in the analyte transport rate. The sensitivity ratios
obtained with AM and MiM nebulizers working as a conven-
tional high flow nebulizer (Ql = 1 mL min�1) are only slightly
higher than that obtained with FFPN (Ql = 0.2 mL min�1),
although the formers take five times more sample than the
latter.
The precision of the HEN is similar to or slightly better than
that of FFPN. For the other nebulizers evaluated the precision
is worse than that of FFPN. The ranges of RSD values for
each nebulizer tested are: 0.25%–1.70% for HEN, 0.43%–
2.38% for MM, 0.28%–2.16% for PFA, 0.48%–2.98% for
AM, 0.32%–2.05% for MiM, and 0.12%–2.04% for FFPN.
For all the lines studied, the mean RSD values for each
nebulizer are: 0.71% � 0.37, 1.46% � 0.63, 1.14% � 0.56,
2.03% � 0.81, 1.17% � 0.57, and 0.76% � 0.48, for the HEN,
MM, PFA, AM,MiM and FFPN nebulizers, respectively. The
slightly higher RSD values of FFPN compared with the RSD
values of HEN could be explained by the plasma ‘‘poisoning’’
effect. The plasma becomes unstable due to the larger amount
of solvent loaded to the plasma and, consequently, to mole-
cular species (e.g., water) which reach the plasma.23 Precision
experiments were also carried out with the AM and MiM
working at 1 mL min�1 liquid flow rate. Under these condi-
tions, the precision of the AM is worse than that of the FFPN
(Ql = 0.2 mL min�1) for soft lines and similar or better for
hard lines. However, the MiM nebulizer shows worse precision
than the FFPN for the majority of lines. The RSD values
range between 0.69%–4.28% for AM and 1.00%–4.23% for
MiM. For all the lines evaluated, the mean RSD values
obtained are 1.81% � 1.24 and 1.63% � 0.84 for AM and
MiM, respectively.
Detection limits obtained with the FFPN are better than
those obtained with AM, MiM, PFA and MM pneumatic
nebulizers, although a better LOD value is obtained for Li
610.362 nm with the MiM. For all lines studied, the HEN
shows similar or slightly worse LOD values than the FFPN.
For the majority of the nebulizers evaluated, the Mg 280.266
nm line shows the smallest LODs, with values of 0.6, 0.9, 0.8,
1.6, 4.5 and 0.5 ppb for HEN, MM, PFA, AM, MiM and
FFPN, respectively. For all the nebulizers, the worst LODs are
obtained for Pb 220.353 nm, with values of 219.4, 569.2, 453.1,
343.2, 501.8 and 215.6 ppb for HEN, MM, PFA, AM, MiM
and FFPN, respectively.
Finally, LOD values were also obtained with AM and MiM
working at a liquid uptake rate of 1 mL min�1. In general,
when the liquid flow is increased, LOD values improve with
both nebulizers. Under high liquid flows, MiM and AM show
similar or slightly better LOD values than FFPN for hard lines
but worse LOD values for soft lines (3 times and 1.6 times
higher values for AM and MiM, respectively).
Conclusions
Primary and tertiary aerosols from an FFPN are finer and
narrower than the aerosols generated with the micronebulizers
used for comparison, giving rise to a higher volume of sample
contained in droplets that arrive at the central channel of the
plasma, except only for tertiary aerosols from a HEN that are
slightly finer than FFPN tertiary aerosols. Solvent and analyte
transport rates are higher for the FFPN as a consequence of
the small amount of sample wasted from the spray chamber.
Moreover, the FFPN presents the best sensitivity for all the
lines studied and, in general, better RSD and LODs than all
the nebulizers tested.
FFPN is ideal as a direct injection nebulizer since, for the
majority of conditions studied, a high percentage of primary
aerosol volume is contained in droplets smaller than 10 mm.
This is under study.
Although Burgener nebulizers are recommended for a broad
range of liquid flow rates they are mainly recommended for
high liquid flow rates since the nebulizer is not ‘‘starved’’ and
figures of merit are improved.69
From a fundamental point of view our new FFPN does not
exert any liquid suction and requires a pumping unit that
counterbalances the back pressure on the liquid tube. This
could seem a limitation for ICP-MS applications with small
samples since using conventional pumping systems the pump
takes up too much of the sample and requires too much of the
next sample to wash out the previous one. However, this is not
a real limitation as it works perfectly with pumping systems
(i.e., peristaltic pumps, piston pumps, etc.) commonly avail-
able in analytical laboratories. In addition, in some analytical
techniques free aspiration is not recommended. For example,
in capillary electrophoresis free aspiration increases changes in
laminar flow and in some analytical techniques deteriorates
precision.
In comparison with previous prototypes of FFPN, the new
one used in this study presents improved behaviour. The
authors justify this fact on the basis of a smaller feeding tube
to exit orifice distance (H), and the hydrodynamic explanation
of this improvement is now under study.70
Acknowledgements
This research was sponsored by grants from the Spanish
Government (project nos. DPI2002-04305-C02-01, PTR1995-
0581-OP-02-01 and CTQ2005-09079-C03-01/BQU). The
Fig. 3 Relative sensitivity. ’, HEN/FFPN; &, MM/FFPN; ,
PFA/FFPN; , AM/FFPN; N, MiM/FFPN. Qg = 0.7 L min�1;
Ql = 0.2 mL min�1.
776 | J. Anal. At. Spectrom., 2006, 21, 770–777 This journal is �c The Royal Society of Chemistry 2006
authors specially thank Flow Focusing (USA), Ingeniatrics
S.L. (Spain), Glass Expansion (Australia) and Burgener Re-
search International (Canada) for the loan of the FFPN,
MicroMist nebulizer and cyclonic spray chamber and Ari Mist
and Mira Mist nebulizers, respectively. The authors are also
grateful to Dr John Burgener for his constructive discussions,
Mr. Nikolay Kovachev for the velocity distribution measure-
ments, and Thermo Corporation for its technical assistance
and financial support. Also, B.A. wants to thank the fellow-
ship providers associated with these projects.
References
1 (a) P. W. J. M. Boumans, ‘‘Inductively Coupled Plasma EmissionSpectroscopy. Part I: Methodology, Instrumentation, and Perfor-mance’’, John Wiley & Sons, New York, 1987, ISBN 0-471-09686-5; (b) P. W. J. M. Boumans, ‘‘Inductively Coupled Plasma EmissionSpectroscopy. Part II: Applications and Fundamentals’’, John Wiley& Sons, New York, 1987, ISBN 0-471-85378-X.
2 A. Montaser, ‘‘Inductively Coupled Plasma Mass Spectrometry’’,Wiley-VCH, New York, 1998, ISBN 0-471-18620-1.
3 H. Berndt, Fresenius’ Z. Anal. Chem., 1988, 331, 321–323.4 S. K. Luo and H. Berndt, Spectrochim. Acta, Part B, 1994, 49,485–492.
5 H. Berndt and J. Yanez, J. Anal. At. Spectrom., 1996, 11, 703–712.6 J. L. Todolı, J. Mora, J. M. Cano and A. Canals, Quım. Anal.,1997, 16, 177–189.
7 J. L. Todolı, A. Canals and V. Hernandis, Spectrochim. Acta, PartB, 1993, 48, 373–386.
8 V. Hernandis, J. L. Todolı, A. Canals and J. V. Sala, Spectrochim.Acta, Part B, 1995, 50, 985–996.
9 J. L. Todolı, A. Canals and V. Hernandis, J. Anal. At. Spectrom.,1996, 11, 949–956.
10 J. Mora, J. L. Todolı, A. Canals and V. Hernandis, J. Anal. At.Spectrom., 1997, 12, 445–451.
11 J. Mora, J. L. Todolı, F. J. Sempere, A. Canals and V. Hernandis,Analyst, 2000, 125, 2344–2349.
12 Y.-L. Feng, J. W. Lam and R. E. Sturgeon, Analyst, 2001, 126,1833–1837.
13 Y.-L. Feng, R. E. Sturgeon and J. W. Lam, Anal. Chem., 2003, 75,635–640.
14 Y.-L. Feng, R. E. Sturgeon and J. W. Lam, J. Anal. At. Spectrom.,2003, 18, 1435–1442.
15 D. R. Wiederin, F. G. Smith and R. S. Houk, Anal. Chem., 1991,63, 219–225.
16 S. C. K. Shum and R. S. Houk, Anal. Chem., 1993, 65, 2972–2976.17 M. J. Powell, D. W. Boomer and D. R. Wiederin, Anal. Chem.,
1995, 67, 2474–2478.18 G. Zoorob, M. Tomlinson, J. Wang and J. Caruso, J. Anal. At.
Spectrom., 1995, 10, 853–858.19 R. Garcıa-Sanchez, J. Bettmer and L. Ebdon,Microchem. J., 2004,
76, 161–171.20 A. C. S. Bellato, M. F. Gine and A. A. Menegario, Microchem. J.,
2004, 77, 119–122.21 L. Wang and R. F. Browner, Oscillating Capillary Nebulizer, US
Patent No. 5725153, issued March 10, 1998.22 T. T. Hoang, S. W. May and R. F. Browner, J. Anal. At.
Spectrom., 2002, 17, 1575–1581.23 K. W. Olson, W. J. Haas and V. A. Fassel, Anal. Chem., 1977, 49,
632–637.24 M. A. Tarr, G. Zhu and R. F. Browner, Appl. Spectrosc., 1991, 45,
1424–1432.25 R. I. Botto and J. J. Zhu, J. Anal. At. Spectrom., 1994, 9, 905–912.26 P. Masson, A. Vives, D. Orignac and T. Prunet, J. Anal. At.
Spectrom., 2000, 15, 543–547.27 B. Budic, J. Anal. At. Spectrom., 2001, 16, 129–134.28 M. A. Tarr, G. Zhu and R. F. Browner, Anal. Chem., 1993, 65,
1689–1695.29 M. Huang, H. Kojima, A. Hirabayashi and H. Koizumi, Anal.
Sci., 1999, 15, 265–268.
30 M. Huang, T. Shirasaki, A. Hirabayashi and H. Koizumi, Anal.Chem., 1999, 71, 427–432.
31 M. Huang, H. Kojima, T. Shirasaki, A. Hirabayashi and H.Koizumi, Anal. Chim. Acta, 2000, 413, 217–222.
32 J. Li, T. Umemura, T. Odake and K. Tsunoda, Anal. Chem., 2001,73, 1416–1424.
33 F. Vanhaecke, M. van Holderbeke, L. Moens and R. Dams, J.Anal. At. Spectrom., 1996, 11, 543–548.
34 M. De Wit and R. Blust, J. Anal. At. Spectrom., 1998, 13, 515–520.35 J. L. Todolı and J. M. Mermet, J. Anal. At. Spectrom., 1998, 13,
727–734.36 Y. Sung and H. B. Lim, Microchem. J., 2000, 64, 51–57.37 A. P. Packer, M. F. Gine, B. F. dos Reis and A. A. Menegario,
Anal. Chim. Acta, 2001, 438, 267–272.38 S. H. Nam, J. S. Lim and A. Montaser, J. Anal. At. Spectrom.,
1994, 9, 1357–1362.39 J. W. Olesik, J. A. Kinzer and B. Harkleroad, Anal. Chem., 1994,
66, 2022–2030.40 H. Liu and A. Montaser, Anal. Chem., 1994, 66, 3233–3242.41 S. A. Pergantis, E. M. Heithmar and T. A. Hinners, Anal. Chem.,
1995, 67, 4530–4535.42 H. Liu, A. Montaser, S. P. Dolan and R. S. Schwartz, J. Anal. At.
Spectrom., 1996, 11, 307–311.43 J. L. Todolı, S. E. Maestre and J. M. Mermet, J. Anal. At.
Spectrom., 2004, 19, 728–737.44 S. E. Maestre, J. L. Todolı and J. M. Mermet, Anal. Bioanal.
Chem., 2004, 379, 888–899.45 R. S. Olofsson, I. Rodushkin and M. D. Axelsson, J. Anal. At.
Spectrom., 2000, 15, 727–729.46 J. A. Day, J. A. Caruso, J. S. Becker and H. J. Dietze, J. Anal. At.
Spectrom., 2000, 15, 1343–1348.47 B. Kuczewski, C. M. Marquardt, A. Seibert, H. Geckeis, J. V.
Kratz and N. Trautmann, Anal. Chem., 2003, 75, 6769–6774.48 J. Zheng and H. Hintelmann, J. Anal. At. Spectrom., 2004, 19,
191–195.49 http://burgenerresearch.com/NebSpecs.html.50 A. Montaser, J. A. McLean and J. M. Kacsir, A Novel Direct
Injection High Efficiency Nebulizer for Atomic Spectroscopy, 1997,U.S. Patent No. 6,166,379, December 26, 2000.
51 J. L. Todolı and J. M. Mermet, J. Anal. At. Spectrom., 2001, 16,514–520.
52 K. Kahen, A. Strubinger, J. R. Chirinos and A. Montaser, Spectro-chim. Acta, Part B, 2003, 58, 397–413.
53 B. Langlois, J. L. Dautheribes and J. M. Mermet, J. Anal. At.Spectrom., 2003, 18, 76–79.
54 S. A. E. O’Brien, J. R. Chirinos, K. Jorabchi, K. Kahen, M. E.Cree and A. Montaser, J. Anal. At. Spectrom., 2003, 18, 910–916.
55 C. S. Westphal, K. Kahen, W. F. Rutkowski, B. W. Acon and A.Montaser, Spectrochim. Acta, Part B, 2004, 59, 353–368.
56 A. Canals, V. Hernandis and R. F. Browner, J. Anal. At. Spec-trom., 1990, 5, 61–66.
57 D. E. Nixon, Spectrochim. Acta, Part B, 1993, 48, 447–459.58 B. Almagro, A. M. Ganan-Calvo and A. Canals, J. Anal. At.
Spectrom., 2004, 19, 1340–1346.59 S. Groom, G. Schaldach, M. Ulmer, P. Walzel and H. Berndt,
J. Anal. At. Spectrom., 2005, 20, 169–175.60 A. M. Ganan-Calvo, Phys. Rev. Lett., 1998, 80, 285–288.61 D. D. Smith and R. F. Browner, Anal. Chem., 1982, 54, 533–537.62 J. L. Todolı, V. Hernandis, A. Canals and J. M. Mermet, J. Anal.
At. Spectrom., 1999, 14, 1289–1295.63 S. E. Hobbs and J. W. Olesik, Anal. Chem., 1992, 64, 274–283.64 J. W. Olesik and L. C. Bates, Spectrochim. Acta, Part B, 1995, 50,
285–303.65 M. P. Dziewatkoski, L. B. Daniels and J. W. Olesik, Anal. Chem.,
1996, 68, 1101–1109.66 R. S. Houk, R. K. Winge and X. Chen, J. Anal. At. Spectrom.,
1997, 12, 1139–1148.67 A. Canals, V. Hernandis and R. F. Browner, Spectrochim. Acta,
Part B, 1990, 45, 591–601.68 K. Kahen, K. Jarobchi, C. Gray and A. Montaser, Anal. Chem.,
2004, 76, 7194–7201.69 E. G. Yanes and N. J. Miller-Ihli, Spectrochim. Acta, Part B, 2004,
59, 883–890.70 A. M. Ganan-Calvo, Appl. Phys. Lett., 2005, 86, 214101.
This journal is �c The Royal Society of Chemistry 2006 J. Anal. At. Spectrom., 2006, 21, 770–777 | 777
Recommended