
Pergamon Ann. occup. Hyg.. Vol. 39, No. 5, pp. 559-571, 1995
Elsevier Science Ltd Copyright T‘, 1995 British Occupational Hygiene Society
Printed in Great Britain. All rights reserved ooo34878/95 s9.50+0.00
0003-4878(95)00028-3
EXPOSURE TO ACID ANHYDRIDES IN THREE RESIN AND ONE CUSHIONED FLOORING MANUFACTURING PLANTS
M. J. A. van Tongeren,* R. D. Barker,? K. Gardiner,* J. M. Harris,? K. M. Venables,? A. J. Newman Taylor? and J. M. Harrington*
*Institute of Occupational Health, University of Birmingham, Edgbaston, Birmingham B15 2TT, U.K.; and tDepartment of Occupational and Environmental Medicine. National Heart and Lung Institute.
Emanuel Kaye Building, Manresa Road, London SW3 6LR, U.K.
(Received 6 December 1994)
Abstract-Acid anhydrides are reactive organic chemicals of low molecular weight which cause occupational asthma. No previous research on the relationship between exposure to these chemicals and respiratory sensitization and development of occupational asthma has been reported. A retrospective cohort study was carried out in four factories (three alkyd resin factories and one cushioned flooring factory) to investigate the nature of exposure-response relationships for sensitization to phthalic anhydride (PA), trimellitic anhydride (TMA) and maleic anhydride (MA). This paper describes the results of full-shift and task-specific exposure measurements. Exposure to PA was low in relation to the Occupational Exposure Standard (OES). The highest full-shift PA exposures occurred among resin operators in the resin factory that used solid PA as compared to other resin factories where liquid PA was used. Arithmetic mean exposure levels to TMA and MA in the resin factories were well below their respective OESs. Short-term high exposures occurred during loading ofacid anhydrides into the reactors and sampling and testing of the resin. Relatively high full- shift exposure to TMA occurred in the cushioned flooring factory, although no high peak exposures were detected.
INTRODUCTION
Acid anhydrides are reactive organic chemicals of low molecular weight that have been used in industry for over 50 years. The chemical structures of phthalic anhydride (PA), trimellitic anhydride (TMA) and maleic anhydride (MA) are shown in Fig. 1. The major applications of these chemicals are in the manufacture of alkyd and epoxy resins and phthalate ester plasticizers (Turner, 1988; Saunders, 1988). Other applications include the production of dyes, pesticides and pharmaceutical products (PA); the manufacture of wire enamels, surface coatings and wall and floor coverings (TMA); and the production of unsaturated polyester resins, oil additives, malic acid and paper sizing resins (MA) (Ridgway et al., 1994).
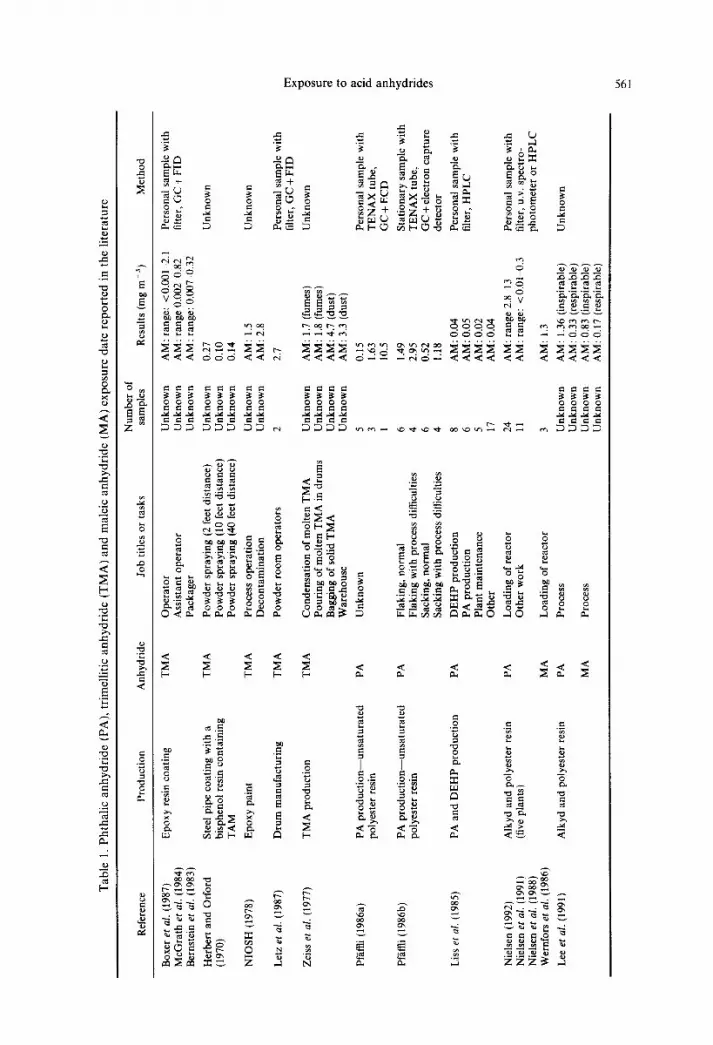
The health effects of acid anhydrides include irritation of the mucous membrane and hypersensitivity, in particular asthma (Venables, 1989). In addition, TMA has been reported to cause pulmonary haemorrhage and haemolytic anaemia (Herbert and Orford, 1970; Ahmad et al., 1979). Numerous publications have reported cases of occupational asthma due to phthalic anhydrides (Kern, 1939; Maccia et al., 1976; Fawcett et al., 1977; Wernfors et al., 1986), trimellitic anhydride (Fawcett et al., 1977; Zeiss et al., 1977; Sale et al., 1981; Durham et al., 1987) and maleic anhydride (Durham et ul., 1987; Lee et al., 1991). Unfortunately, only a limited number ofpublications have reported levels of exposure to acid anhydrides. Table 1 provides a brief summary of the exposure data for TMA, PA and MA reported in the literature. During the manufacture of TMA average exposures were about 3-5 mg me3 during bagging and
559

560 M. J. A. van Tongeren et ul.
Trimellitic Anhydride Phthalic Anhydride
H 0 ‘c-c;
II 0 c-d
H’ %O
Maleic Anhydride
Fig. 1. Chemical structures of trimellitic anhydride, phthalic anhydride and maleic anhydride.
storage, while concentrations during the use of TMA were generally lower. During the production of PA and its use in the production of alkyd and polyester resins average PA concentrations ranged from 0.03 to 13 mg rne3. The highest concentrations occurred during the loading of reactors with solid PA. Only a limited number of results of MA measurements are available in the literature; average concentrations during the production of alkyd and polyester resins ranged from 0.2 mg me3 for respirable MA to 0.8 and 1.3 mg mm3 for total inhalable MA.
Most exposure data in the literature (Table 1) are difficult to interpret because of paucity of relevant information, e.g. number of samples and the sampling and analytical techniques used, whether the results are time-weighted average (TWA) exposure over a full working shift or the average exposure during the time a specific task was carried out, and whether personal or static samples were taken.
None of the studies mentioned above have allowed an investigation of exposure- response relationships between exposure to acid anhydrides and respiratory sensitiza- tion or the development of occupational asthma as the exposure data in these studies were used as approximate indicators of exposure levels rather than describing representative estimates of average exposure.
In an attempt to address these limitations a retrospective cohort study was carried out between 1991 and 1994 in the U.K. to investigate the relationship between exposure to acid anhydrides and respiratory health effects. The study design and results will be reported in detail elsewhere (Barker, 1995). Briefly, four factories that use acid anhydrides were included in the study with the participation of 401 workers or ex- workers. This paper describes the results of full-shift and task-specific exposure measurements to PA, TMA and MA in the four factories and discusses their implications.
DESCRIPTION OF PRODUCTION PROCESSES
Three of the participating factories produce resins (mainly alkyd resins but also polyester resins and acrylic resins) for use in the production of paints (factories 1,3 and
Tabl
e 1.
Pht
halic
an
hydr
ide
(PA)
, tri
mel
litic
an
hydr
ide
(TM
A)
and
mal
eic
anhy
drid
e (M
A)
expo
sure
da
te r
epor
ted
in t
he l
itera
ture
Ref
eren
ce
Prod
uctio
n An
hydr
ide
Job
title
s or
tas
ks
Num
ber
of
Sa”lp
leS
Res
ults
(m
g m
- ‘)
M
etho
d
Boxe
r et
al.
(198
7)
McG
rath
et
al.
(198
4)
Bern
stei
n et
al.
(198
3)
Her
bert
and
Orfo
rd
(197
0)
Epox
y re
sin
coat
ing
TMA
NIO
SH
(197
8)
Stee
l pi
pe c
oatin
g w
ith
a bi
sphe
nol
resi
n co
ntai
ning
TA
M
Epox
y pa
int
TMA
TMA
Letz
et
al.
(198
7)
Dru
m
man
ufac
turin
g TM
A
Zeis
s et
al.
(197
7)
TMA
prod
uctio
n TM
A
Pfiif
fli
(198
6a)
Pfiff
li (1
986b
)
Liss
et
ul.
(198
5)
Nie
lsen
(1
992)
N
iels
en
et a
l. (1
991)
N
iels
en
et a
l. (1
988)
W
ernf
ors
et a
l. (1
986)
Lee
et a
l. (1
991)
PA
prod
uctio
n-un
satu
rate
d po
lyes
ter
resi
n
PA
prod
uctio
n-un
satu
rate
d po
lyes
ter
resi
n
PA
and
DEH
P pr
oduc
tion
Alky
d an
d po
lyes
ter
resi
n (fi
ve p
lant
s)
Alky
d an
d po
lyes
ter
resi
n
PA
PA
PA
PA
MA
PA
MA
Ope
rato
r U
nkno
wn
AM:
rang
e:
<O.O
Ol~
-2.1
As
sist
ant
oper
ator
U
nkno
wn
AM:
rang
e 0.
002&
0.82
Pa
ckag
er
Unk
now
n AM
: ra
nge:
0.
007-
0.32
Pow
der
spra
ying
(2
fee
t di
stan
ce)
Unk
now
n 0.
27
Pow
der
spra
ying
(1
0 fe
et d
ista
nce)
U
nkno
wn
0.10
Po
wde
r sp
rayi
ng
(40
feet
dis
tanc
e)
Unk
now
n 0.
14
Proc
ess
oper
atio
n U
nkno
wn
AM:
1.5
Dec
onta
min
atio
n U
nkno
wn
AM:
2.8
Pow
der
room
op
erat
ors
2 2.
7
Con
dens
atio
n of
mol
ten
TMA
Pour
ing
of m
olte
n TM
A in
dru
ms
Bagg
ing
of s
olid
TM
A W
areh
ouse
Unk
now
n
AM:
1.7
(fum
es)
AM:
1.8
(fum
es)
AM:
4.7
(dus
t) AM
: 3.
3 (d
ust)
0.15
1.
63
10.5
Flak
ing,
no
rmal
Fl
akin
g w
ith
proc
ess
diffi
culti
es
Sack
ing,
no
rmal
Sa
ckin
g w
ith
proc
ess
diffi
culti
es
DEH
P pr
oduc
tion
PA
prod
uctio
n Pl
ant
mai
nten
ance
O
ther
Load
ing
of r
eact
or
Oth
er
wor
k
Unk
now
n U
nkno
wn
Unk
now
n U
nkno
wn
5 3 1 6 4 6 4 8 6 5 17
24
11
1.49
2.
95
0.52
1.
18
AM:
0.04
AM
: 0.
05
AM:
0.02
AM
: 0.
04
AM:
rang
e 2.
8-13
AM
: ra
nge:
<0
.01&
0).3
Load
ing
of r
eact
or
Proc
ess
Proc
ess
3 AM
: 1.
3
Unk
now
n AM
: 1.
36 (
insp
irabl
e)
Unk
now
n AM
: 0.
33 (
resp
irabl
e)
Unk
now
n AM
: 0.
83 (
insp
irabl
e)
Unk
now
n AM
: 0.
17 (
resp
irabl
e)
Pers
onal
sa
mpl
e w
ith
tilte
r, G
C +
FID
Unk
now
n
Unk
now
n
Pers
onal
sa
mpl
e w
ith
filte
r, G
C +
FID
52
U
nkno
wn
a 2 5 ij
Pers
onal
sa
mpl
e w
ith
is.
TENA
X tu
be,
e
GC
+EC
D
E
Stat
iona
ry
sam
ple
with
%
TE
NAX
tube
, 3.
G
C +
ele
ctro
n ca
ptur
e 8
dete
ctor
Pers
onal
sa
mpl
e w
ith
filte
r, H
PLC
Pers
onal
sa
mpl
e w
ith
filte
r, U
.V. s
pect
ro-
phot
omet
er
or H
PLC
Unk
now
n

562 M. J. A. von Tongeren et al
4). The other (factory 2) produces cushioned floor covering. Factory 2 only uses TMA, factories 1 and 3 use all three acid anhydrides (PA, TMA and MA), while factory 4 is currently only using PA.
Resin manufacturing Three of the factories participating in the study produce resins used in the
manufacture of paints. The main products are alkyd resins, polyester resins and acrylic resins. All acid anhydrides are used for the production of the alkyd resins; only maleic anhydride is used in the production of polyester resins. No acid anhydrides are used for the production of acrylic resins. The resins are manufactured in large reactors (Fig. 2) with the three factories having a total of 1,4 and 6 reactors in operation, respectively. The manufacture of resins involves the use of a natural oil or a fatty acid, a polyol such as pentaerythritol and a dicarboxylic acid or acid anhydride. In two factories (1 and 4), liquid PA is added automatically and manual loading of PA is only needed occasionally in the case of breakdown of the liquid phthalic anhydride (LPA) storage and supply system. In the other resin manufacturing factory solid PA is added manually from 25 kg bags or mechanically from big bags (500-1000 kg). TMA and MA are always used in the solid form, TMA as a fine powder and MA as briquettes. During the production of the resins, samples are taken at regular intervals to test the acid value and the viscosity of the resin. After a period ranging from 8 to 20 h, the resin is
Resin Manufacturing
Reactor vessel
Fig. 2. A schematic diagram of a resin manufacturing factory.

Exposure to acid anhydrides 563
Mixing
Finish Finish through through ovens ovens - -
Fig. 3. A schematic diagram of the printing section of the cushioned flooring factory. Fig. 3. A schematic diagram of the printing section of the cushioned flooring factory.
downloaded into a thinning vessel where more solvents are added and finally pressed through filters. The resins are either stored in drums or in large tanks.
Cushioned flooring The remaining factory produces linoleum and synthetic cushioned flooring (Fig. 3).
TMA is used as an inhibitor of the blowing agent to produce a textured finish of the cushioned floor covering. TMA is mixed with a PVC co-polymer and solvent to produce a TMA masterbatch. This TMA masterbatch is mixed with the inks and acts as an inhibitor of the expansion of the foam layer in the flooring. The inks are loaded into six separate trays from which the inks are printed on the flooring by rotagravures. Normally, one of these trays is filled with the TMA-containing ink, the remainder being filled with inks that complete the design of the flooring. The flooring is fed through the printing machine (de-reel) and wound onto a second roll (reel-up). After a batch of flooring is printed the ink trays and the cylinders are cleaned and a new print pattern is installed. The printed flooring is coated with a clear PVC plastisol and pressed through an oven whose heat causes the expansion of the foam layer.
METHODS AND MATERIALS
Exposure measurements of airborne acid anhydrides were taken over whole shifts and during specific tasks expected to cause elevated levels of exposure. All measurements were taken during planned factory visits, each of which lasted between 2 and 3 weeks. Factory 2 was visited twice due to a breakdown of the printing process during the first visit. Personal full-shift measurements were taken randomly with respect to day and worker. A representative number of workers were sampled from each job title, but because of limited resources no repeated samples from the same worker were taken. An exception was made for the resin operators and quality control laboratory workers in factory 4 where because of the small number of workers repeated measurements were taken. The number of samples was determined by sampling one

564 M. J. A. von Tongeren et al
out of 10 of all work shifts for each job title during the factory visits. This rule was not applied strictly, for example fewer samples were taken for personnel (e.g. supervisors) thought to have only minor exposure. A total of 130 full-shift samples were collected.
Task specific sampling was carried out to determine the level of peak exposures within a work shift. Activities thought to be associated with a high level of exposure were identified and sampled where possible during the factory visits. In total, 73 task- specific samples were taken in the four factories. Due to the infrequency and unpredictability of certain tasks, types of maintenance work and spillages, not all tasks which might cause high levels of exposure were sampled.
The sampling and analysis were carried out according to Methods for the Determination of Hazardous Substances (MDHS) No. 62 (HSE, 1988). Air was drawn through a glass fibre filter (GF/A) in a UKAEA seven-hole sampling head behind which a Tenax tube was connected in series. The sampling train was calibrated to a flow-rate of 0.5 min- ’ by means of a soap bubble meter. After sampling, the filters were stored in metal Petri dishes and the end of the Tenax tubes sealed with plastic caps. The filters were desorbed in 2 ml of the mobile phase (84: 1: 15 water-phosphoric acid-acetonitrile solution) for 60 min. The Tenax tubes were desorbed by dropwise addition of 4 ml of acetone. The eluate was collected and 200 ~1 of mobile phase was added. The solution was allowed to stand for 60 min and then evaporated to dryness. The residues were redissolved in 0.5 ml mobile phase. Analysis was carried out by injecting 20 ~1 of the desorption solution into a high performance liquid chromatograph (HPLC) (C18,25 x 4.6 mm, S50DS2) connected to an ultra-violet (u.v.) detector (230 nm). A Schimadzu-CR6A integrator was used to calculate the peak areas. In the case of analysis for MA, a 0.1% v/v phosphoric acid-water solution was used as the mobile phase. The limit of detection of the analysis of TMA, PA and MA was 0.10 pg.
RESULTS
The results for PA were found to be log-normally distributed. The distributions for TMA and MA could not be tested due to the large number of samples that were below the analytical limit of detection. However, if only factory 2 is considered, the results for TMA were also log-normally distributed. As the arithmetic mean (AM) is regarded as the summary measure most relevant to health outcome (Armstrong, 1992) AM results for PA, TMA and MA (in pg me3) are shown by factory in Fig. 4.
The highest arithmetic mean PA exposure occurred in factory 3, which uses only solid PA, whereas factories 1 and 4 mainly use liquid PA. Factory 2 does not use PA, although some background exposure was detected, probably due to interference by other chemicals in the analysis or due to transformations from TMA into PA. All results are well below the 8-h TWA Occupational Exposure Standard (8-h TWA OES) of 6000 pg rns3 (HSE, 1994).
The highest arithmetic mean TMA exposures of 19.3 pg mu3 were found in factory 2 which is about half the 8-h TWA OES of 40 pg rnm3. Exposure to MA was measured only in the two factories that used it (factories 1 and 3) and was undetectable in half of all full-shift measurements. As can be seen from Table 2, the arithmetic mean MA exposure was very low and always well below the 8-h TWA OES of 1000 ,ug rnd3 (HSE, 1994).

Exposure to acid anhydrides 565
60
60
P-2 40 + s 30
20
10
0
n PA exposure
0 TMA exposure
MA exposure
Factory 1 Factory 2 Factory 3 Factory 4
Fig. 4. Arithmetic mean exposure to PA, TMA and MA by factory.
Table 2. PA exposure (pg m-3) by factory and job category (except factory 2)
AM GM N kg m-7 @Lg me31 GSD % < LoD
Factory 1 Resin operator 9 25.1 7.6 4.1 0 Filter operator 9 1.5 1.2 1.3 22 Warehouseman 1 1.0 0 Maintenance 6 2.6 2.5 1.3 0 Laboratory worker R&D resin 2 0.5 0.5 1.1 100 Supervisor 2 0.5 0.5 1.2 100
Factory 3 Resin operator 12 137.7 9.4 1.7 0 Filter operator 3 19.4 9.1 4.4 0 Warehouseman 4 4.7 3.2 2.7 0 Maintenance 3 3.4 2.8 2.2 0 Laboratory worker R&D resin 3 15.1 6.4 8.7 33 Laboratory worker QC resin 4 2.5 1.6 2.9 50
Factory 4 ~.~ Resin operator 13 20.1 11.9 2.9 0 Pilot plant operator resin 3 10.4 5.3 4.1 0 Laboratory worker QC resin 10 1.8 1.2 2.4 40
N = number of samples. AM =arithmetic mean. GM = geometric mean. GSD=geometric standard deviation. % < LoD = percentage of samples below the limit of detection.
Table 2 shows the results of PA exposures by factory (except for factory 2) and by job category. Resin operators, who are responsible for cooking the resin experienced the highest exposure. This involves charging of solid PA (factory 3) and sampling and testing of the reactor mixtures (factories 1, 3 and 4). In factory 3, exposure was also

566 M. J. A. von Tongeren et al.
relatively high for filter operators (filter finished resin and load it into drums, tanks, etc.) and for the research and development laboratory workers. The pilot plant operators in factory 4 also had slightly elevated PA exposure. Unfortunately, no measurements were available for the pilot plant workers in the other factories.
The geometric standard deviations (GSD) were very high for the job categories with the higher geometric mean exposures (Table 2). PA was often not used during a work-shift, due to the relatively long production cycles (up to 20 h) and the fact that PA was not used in the manufacture of all resins. Contact with PA either as a raw material, during sampling and testing of resins or from contaminated equipment occurred in only 14 out of the 34 personal samples of the resin operators, which may be responsible for the high variation in exposure. Other than in factory 4 no repeated measurements on the same worker were taken. Analysis of the repeated measurements for the resin operators in factory 4 showed that 95% of the total variance was explained by the within worker component.
Table 3 shows the results of TMA exposure by job category in factory 2. The printers, ink mixers and colour matchers, and de-reel and reel-up operators have the highest TMA exposures. Lower exposures occurred in job categories which were not employed in the ink mixing or printing area of the factory (pilot plant operators and floor processing operators). The highest full-shift exposures for the printers and the de- reel and reel-up operators occurred while manually chipping ink off the floor during breakdown of the printing machine. Arithmetic mean exposure during these days was 74.1 pg mm3 for printers (N=6) and 60.0 pg m- 3 for de-reel and reel-up operators (N= 3). During normal working days the exposure in these categories was similar to those of the pilot plant and floor processing operators.
Results for short-term exposures during specific tasks are shown in Tables 4,5 and 6 for PA, TMA and MA, respectively. The highest PA exposures occurred during charging of solid PA in the reactor vessels (AM: 363.9 pg m-“) and sampling and testing of the reactor mixture (AM: 300.3 pg me3). Exposure also occurred whenever the enclosed system was opened and solid PA had to be removed (AM: 179.6 pg m-3) and during filtering and drumming of the resin (AM: 103.9 pg mm3). For each task the average time-weighted average (TWA) exposure over 8 h was calculated. In addition, a lo-min TWA was calculated assuming that the exposure happened during only 10 min of the measurement. The highest 8-h TWA occurred during charging of PA into the reactor vessel (8-h TWA: 38.0 pg mm3), whereas the lo-min TWA for this task was
Table 3. TMA exposure (pg mm3) in factory 2 by job category
AM GM N (be m-7 (i4iz m-‘) GSD % < LoD
Printer 16 31.2 8.3 5.3 6 Ink mixer, colour matcher 8 15.4 11.2 2.5 0 Pilot plant operator flooring 8 3.6 1.6 3.8 50 De-reel, reel-up operator 10 21.8 9.4 3.1 0 Floor processing operator 4 5.2 2.5 3.7 0
N=number of samples. AM = arithmetic mean. GM = geometric mean. GSD=geometric standard deviation. % -C LoD=percentage of samples below the limit of detection.

Exposure to acid anhydrides
Table 4. Task-specific exposure to PA (pg m-3)
561
N AM Range T TWA-8 TWA-10
(a m-7 hcg me31 (min) (a m-7 (w me31
Handling bags 2 33.0 21.9944.0 87.0 5.0 241.3 Charging 8 363.9 53.8-1862.6 58.6 38.0 1825.2 Sampling/testing 18 300.3 8.8-1276.6 78.3 28.8 1382.5 Resin finishing 2 103.9 10.6197.1 37.0 7.4 356.3 Laboratory work 2 17.5 5.5-29.5 91.0 2.2 107.7 Opening system I 179.6 6.G389.3 15.3 2.9 159.2 Delivery LPA 6 25.0 6.5-51.4 38.8 1.8 90.4
N = number of samples. AM = arithmetic mean exposure. T= average sampling time. TWA-8 =8-h time weighted average exposure assuming no exposure occurred during the rest of the 8 h. TWA-lo= IO-min time weighted average assuming that exposure only lasted 10 min. LPA = liquid PA.
Table 5. Task-specific exposure to TMA (pg mm3)
AM Range T TWA-8 TWA-10 N (a m-7 Cm m-7 (min) C&z m-7 (m mm-‘)
Handling bags Charging Sampling/testing Finishing resin Opening system Clean workplace Mixing batch Mixing inks Loading inks Printing Cleaning equipment
1 99.7 4 6340.3 2 4.1 2 5.5 1 19.6 1 60.2 2 34.0 3 19.9 2 25.0 2 12.3 2 14.3
6.0 1.3 59.8 150.5-20433.5 15.3 264.4 12 689.9
2.5-5.7 65.7 0.3 20.1 5.1-5.9 37.0 0.4 20.2
50.0 2.0 98.0 44.0 5.5 264.8
16.2-51.7 21.5 1.0 47.3 14.6-26.8 50.7 2.1 2.9 17.1-33.0 26.5 1.2 56.4 5.0-19.7 135.5 2.2 104.3
11.1-17.5 26.3 0.4 27.5
N = number of samples. AM =arithmetic mean exposure. T= average sampling time. TWA-8=8-h time weighted average exposure assuming no exposure occurred during the rest of the 8 h. TWA-lo= IO-min time weighted average assuming that exposure only lasted 10 min.
Table 6. Task-specific exposure to MA (pg mm3)
Handling bags Charging Sampling/testing Finishing resin
AM Range T TWA-8 TWA-10 (a m-7 (a me31 (min) (kit mm31 (mm-7
6.9 - 30.0 0.4 20.8 17.3 10.1-28.6 13.0 0.4 20.1
5.5 1.49.7 83.5 0.4 20.2 10.8 5.9-15.7 37.0 0.9 41.4
N=number of samples. AM =arithmetic mean exposure. T= average sampling time. TWA-8=8-h time weighted average exposure assuming no exposure occurred during the rest of the 8 h. TWA-lo= IO-min time weighted average assuming that exposure only lasted 10 min.

56X M. J. A. von Tongeren et al.
almost 2 mg rnm3, which is about a factor of 13 below the Short-term Exposure Limit (24 mg me3) (HSE, 1994).
Exposure during charging of TMA into the reactor vessel caused very high exposure (AM: 6340.3 pg me3) with a maximum exposure of 20433.5 pg me3 over 24 min. The average 8-h TWA based on this task was 264.4 pg me3 which exceeded the Occupational Exposure Standard (40 pg mm3). Exposure during the other tasks were much less (Table 5). The tasks in factory 2 associated with exposure to TMA (cleaning workplace, mixing TMA batch, mixing inks, loading inks in printing machines and cleaning of equipment contaminated with inks) had similar average exposures to those found during the full shift measurements. Exposure to MA was always very low even during the charging of MA in the reactor vessel (Table 6).
DISCUSSION
Exposure to PA, TMA and MA was assessed in four factories as part of an epidemiological study to determine exposure-response relationships in the develop- ment of acid anhydride induced asthma. Full-shift samples were taken using a random sampling strategy. The highest PA exposures occurred among the resin operators in factory 3, the only resin manufacturing factory where the resin operators charged PA manually into the reactors. The exposure levels are, however, low compared to the Occupational Exposure Limit (6000 pg mm3). Exposure to PA in the other resin factories was caused mainly by sampling and testing of the mixture in the reactor, as seen in the task-specific measurements.
The variability in the results of the exposure measurements for PA was very high, especially in factory 3 and for the resin operators. This was due to the fact that PA was not used every day as PA or other acid anhydrides were not constituents of all resins. In addition, it required between 8 and 20 h to produce a resin, and the majority of the sampling and testing of the reactor mixture is done towards the end of the production cycle. Results from repeated measurements among the resin operators in factory 4 show that almost all the variance is caused by the day-to-day component, while the between worker component is negligible.
Factory 2 was the only factory to use TMA or TMA containing materials daily. The other factories did not use any TMA during any of the periods the full-shift samples were taken. The use of MA was also very infrequent. For this reason, arithmetic mean exposure levels for TMA and MA were very low at the alkyd resin plants (factories 1,3 and 4) and were not detectable in more than half of the samples. In factory 2 the arithmetic mean exposure to TMA was 19.3 pg rnm3, which is close to the Occupational Exposure Limit for TMA. The highest levels among the printers and de- reel and reel-up operators occurred during a major breakdown in the factory. During this period, layers of inks were mechanically removed from the floor generating dust within the factory. Arithmetic mean exposure levels were 74.1 pg me3 (N=6) for the printers and 60.0 pg m-3 (N=3) for d e-reel and reel-up operators, above the Occupational Exposure Limit of 40 pg m -3. During normal working days the exposure levels were a factor of 10 lower.
Exposure to acid anhydride found in this study were generally lower than those reported in the literature. It is difficult to compare our data with previous work, as different sampling and analytical techniques were used and the measurements reported

Exposure to acid anhydrides 569
in the literature were not taken as part of a random sampling strategy. Comparison of our results of the task-specific PA and MA measurements with previously published results show that generally ours were lower, although high levels of PA exposure were found during charging of PA in reactors (range 53.8-1862.6 pg mp3) and during sampling and testing of the reactor mixture (range 8.8-1267.5 pg me3). Assuming that these tasks were carried out in 10 min, the IO-min TWA exposure were a factor 13 and 17 below the respective Short-term Exposure Limit (24 mg mm3). Very high levels of TMA exposure were found in a resin factory during the charging of TMA in the reactors (range 150.5-20433.5 pg mm3). TMA was used as a very fine powder, while PA and MA were used in flakes and briquettes, respectively, which may explain the large difference in exposure to TMA as compared to MA and PA during loading activities.
Full respiratory protection (air-fed hood) with disposable suits, rubber gloves and boots were always worn whilst TMA was being loaded at factories 1 and 3 and real exposure by the workers will have been much less than that measured in the air. Nevertheless, one very short sample (2 min) in the dressing room after charging of TMA detected TMA in the air close to the workers breathing zone. The concentration was more than 4 mg rnw3, although accuracy is limited by the small sampling volume. In factory 2, strict use of respiratory protective equipment occurred only during the mixing of the TMA master batch. When handling MA, half-face masks were usually worn and respiratory protection was rarely used whilst loading PA or taking samples of the resin.
In summary, our results show that full-shift acid anhydride exposure was generally low in the resin producing factories. In the case of TMA and MA, this was due to their infrequent use. Short-term measurements showed that high exposures occurred during charging of acid anhydrides and sampling and testing of the reactor mixture. Full-shift exposures to TMA were highest in the cushioned flooring factory although the short- term peak exposure were less than in the resin factories. Individual TMA exposure will however have been generally reduced by the use of air-fed hoods.
Peak exposure may be of major importance in the development of occupational asthma (Gardiner, 1995; Venables, 1987; Vandenplas et al., 1993) and although the full-shift exposures appear to be low, the risk of sensitization may still remain. It is therefore important to reduce the exposure to acid anhydrides to an even greater degree and more importantly to ensure that high peak exposures are avoided. These peak exposures could occur during routine and breakdown maintenance, spillages and handling of split bags. Although no data on exposure during these events was collected in this study, this is one of the main areas in which prevention and/or control should be prioritized.
The use of liquid PA enables automatic loading and therefore potentially high exposure during loading is avoided. Unfortunately, only PA is available in liquid form. In case of TMA and MA, the anhydrides should be used in a form, such as flakes or briquettes, which minimize the release of dust during loading. Furthermore, the way in which empty bags are disposed off can be an important means in reducing exposure levels and the workforce should receive proper training in the safe handling of these chemicals.
Installation of properly designed and maintained local exhaust ventilation at the loading points and where the samples are taken and analysed, could further reduce

570 M. J. A. von Tongeren et al.
exposure. The maintenance of the ventilation systems is of great importance in the resin manufacturing plants, because the condensed resin fumes can block the system and thereby reduce its efficiency considerably.
Acknowledgements-The study was supported by the Health and Safety Executive. The authors are grateful to Narsim Murthy and Siromi Wijayawickrama who carried out the chemical analysis of the samples, to Marianne Veerman and Joost Thissen for their help with the data collection and to the employees at the factories for their co-operation and assistance.
REFERENCES
Ahmad, D. A., Morgan, W. K. C., Patterson, R., Williams, T. and Zeiss, C. R. (1979) Pulmonary haemorrhage and haemolytic anaemia due to trimellitic anhydride. Lancet ii, 328330.
Armstrong, B. G. (1992) Confidence intervals for arithmetic means of lognormally distributed exposures. Am. ind. Hyg. Ass. J. 53, 481485.
Barker, R. D. (1995) Aetiology and outcome of asthma caused by acid anhydrides. MD thesis, University of London.
Bernstein, D. I., Roach, D., McGrath, K. G., Larsen, R. S., Zeiss, C. R. and Patterson, R. (1983) The relationship of airborne trimellitic anhydride concentrations to trimellitic anhydride-induced symptoms and immune responses. J. Allergy clin. Immun. 72, 709-713.
Boxer, M. B., Grammer, L. C., Harris, K. E., Roach, D. E. and Patterson, R. (1987) Six-year clinical and immunologic follow-up of workers exposed to trimellitic anhydride. J. Allergy clin. Zmmun. 80,147-152.
Durham, S. R., Graneek, B. J., Hawkins, R. and Newman Taylor, A. J. (1987) The temporal relationship between increases in airway responsiveness to histamine and late asthmatic responses induced by occupational agents. J. Allergy clin. Zmmun. 79, 398406.
Fawcett, I. W., Newman Taylor, A. J. and Pepys, J. (1977) Asthma due to inhaled chemical agents-epoxy resins systems containing phthalic acid anhydride, trimellitic acid anhydride and triethylene tetramine. Clin. Allergy 7, l-14.
Gardiner, K. (1995) Exposure profiles and respiratory sensitisers. Occupational hygiene-risk management of occupational hazards. (In press.)
Herbert, F. A. and Orford, R. (1970) pulmonary hemorrhage due to inhalation of resins containing trimellitic anhydride. Chest 76,546551.
HSE (1988) Aromatic carboxylic acid anhydrides in air. Laboratory method using glass-fibre filter/Tenax tube sampling and high performance liquid chromatography. MDHS 62. Health and Safety Executive. HMSO, London.
HSE (1994) EH 40/94 Occupational Exposure Limits 1994. Health and Safety Executive. HMSO, London. Kern, R. A. (1939) Asthma and allergic rhinitis due to sensitisation to phthalic acid. J. Allergy 10, 164-165. Lee, H. S., Wang, Y. T., Cheong, T. H., Tan, K. T., Chee, B. E. and Narendran, K. (1991) Occupational
asthma due to maleic anhydride. Br. J. ind. Med. 48, 283-285. Letz, G., Wugofski, L., Cone, J. E., Paterson, R., Harris, K. E. and Grammer, L. C. (1987) Timellitic
anhydride exposure in a 55-gallon drum manufacturing plant: clinical, immunological, and industrial hygiene evaluation. Am. J. ind. Med. 12, 407417.
Liss, G. M., Albro, P. W., Hartle, R. W. and Stringer, W. T. (1985) Urine phthalate determinations as an index of occupational exposure to phthalic anhydride and di(2-ethylhexyl)phthalate. Stand. J. Wk Environ. Hlth 11, 381-387.
Maccia, C. A., Bernstein, L., Emmet, E. A. and Brooks, S. M. (1976) In vitro demonstration ofspecific IgE in phthalic anhydride hypersensitivity. Am. Rev. resp. Dis. 113, 701-704.
McGrath, K. G., Roach, D., Zeiss, R. and Patterson, R. (1984) Four-year evaluation of the workers exposed to trimellitic anhydride. J. occup. Med. 26, 671-675.
Nielson, J. (1992) Airways’ effects in workers exposed to organic acid anhydrides. Doctoral dissertation, Lund University, Sweden.
Nielson, J., Bensryd, I., Almquist, H., Dahlquist, M., Welinder, H., Alexandersson, R. and Skerfving, S. (1991) Serum IgE and lung function in workers exposed to phthalic anhydride. Znt. Archs &cup. Environ. Hlth 63,199-204.
Nielson, J., Welinder, H., Schlitz, A. and Skerfving, S. (1988) Specific serum antibodies against phthalic anhydride in occupationally exposed subjects. J. Allergy clin. Zmmun. 82, 126133.
NIOSH (1978) Current intelligent bulletin 21: trimellic anhydride (TMA). NIOSH Publication No. 78-121. U.S. Department of Health, Education, and Welfare.

Exposure to acid anhydrides 571
Pfaffli, P. (1986a) Phthalic acid excretion as an indicator of exposure to phthalic anhydride in the work atmosphere. Int. Archs Occup. Environ. Hlth 58, 209216.
Pfaffli, P. (1986b) Phthahc anhydride as an impurity in industrial atmospheres: assay in air samples by gas chromatography with electron-capture detection. AnaIyst 111, 813-817.
Ridgway, P., Morris, L., Smith, A., Cocker, J., Nicholls, S. and Ogunbiyi, A. (1994) Draft Criteria Document for an Occupational Exposure Limit: phthalic anhydride, trimellitic anhydride, maleic anhydride. Health and Safety Executive. HMSO, London.
Sale, S. R., Roach, D., Zeiss, C. R. and Patterson, R. (1981) Clinical and immunologic correlations in trimellitic anhydride airway syndromes. J. Allergy clin. Immun. 68, 183-193.
Saunders, K. J. (1988) Organic Polymer Chemistry. An Introduction to the Organic Chemistry of Adhesives, F&-es, Paints, Plastics and Rubbers (2nd Edn). Chapman & Hall, London.
Turner, G. P. A. (1988) Introduction to Paint Chemistry and Principles of Paint Technology (3rd Edn). Chapman & Hall, London.
Vandenplas, O., Malo, J.-M., Saetta, M., Mapp, C. E. and Fabbri, L. M. (1993) Occupational asthma and extrinsic alveolitis due to isocyanates: current status and perspectives. Br. J. ind. Med. 50, 213-228.
Venables, K. M. (1987) Epidemiology and the prevention ofoccupational asthma. Br. J. ind. Med. 44,73- 75. Venables, K. M. (1989) Low molecular weight chemicals, hypersensitivity, and direct toxicity: the acid
anhydrides. Br. J. ind. Med. 46, 33-232. Wernfors, M., Nielson, J., Schutz, A. and Skerfving, S. (1986) Phthalic anhydride induced occupational
asthma. Int. Archs. Allergy Appl. Zmmun. 79, 77-82. Zeiss, C. R., Patterson, R., Pruzansky, J. J., Millier, M. M., Rosenberg, M. and Levitz, D. (1977) Trimellitic
anhydride-induced airway syndromes: Clinical and immunologic studies. J. Allergy c&n. Immun. 60, 96-103.
Recommended


