
ESTONIAN APPAREL RETAIL MARKET Positioning the Brand Madonna
Signe Kirt
Bachelor’s Thesis May 2012
Degree Programme in Fashion and Clothing Culture

DESCRIPTION
Author(s) KIRT, Signe
Type of publication Bachelor’s Thesis
Date 15042012
Pages 53
Language English
Confidential No ( ) Until
Permission for web publication ( X )
Title ESTONIAN APPAREL RETAIL MARKET - POSITIONING THE BRAND MADONNA
Degree Programme Fashion and Clothing
Tutor(s) LAITINEN, Outi
Assigned by Madonna Fashion OÜ
Abstract RESEARCH OBJECTIVE, QUESTION AND TASK The aim of the study was to examine the Estonian clothing retail market from the perspective of position-ing the brand Madonna, i.e. the current economic situation, consumers, competitors and possibilities of successful business in the market. The study was a background study for opening a store selling Madonna clothes and part of the business plan and market research. IMPLEMENTATION AND RESEARCH METHODS The research is an observation study carried out personally in shopping centres. The competitors’ stores similar to the price segment of the Madonna brand price segment were the observation objects. The background information of the market was collected with a secondary data research method, and was explored and analysed to illustrate the background of the Estonian apparel retail market. RESULTS AND CONCLUSIONS The study resulted in an assessment of the position and segment of the brand Madonna in the Estonian clothing business. The results also include suggestions for the location, size and strategies for the stores. As there are few competitors on low-price level in Estonian market, and as almost half of these stores have opened their first brand stores in the last 3 years, the market ready for this kind of a products – trendy but wallet-friendly products with medium level quality targeted to younger consumers. The big-gest minus is that H&M will open their first store in Riga and in the Baltic countries in autumn 2012, which means H&M has a strategy to expand to all the Baltic countries as the Baltic’s market is quite simi-lar and therefore it is rational to expand to all the Baltic countries. Therefore, H&M will be the biggest competitor. For this reason, a Madonna’s store opening has to take place before H&M opens their first store in Estonia as it is possible for Madonna to build the necessary brand awareness.
Keywords Marketing research, brand positioning, competition survey, apparel, clothing, observation, Estonian retail market, apparel retailing.
Miscellaneous …

1
CONTENTS
CONTENTS ................................................................................................................... 1
1 INTRODUCTION ....................................................................................................... 3
2 THEORETICAL BASIS ............................................................................................. 4
2.1 Market Research ................................................................................................... 4
2.2 Market Segmentation and Brand Positioning....................................................... 8
2.3 Implementation ..................................................................................................... 9
3 INTRODUCTION TO THE BRAND MADONNA ................................................. 12
3.1 Background ........................................................................................................ 12
3.2 Technology and Quality ..................................................................................... 13
3.3 Price Level .......................................................................................................... 14
3.4 Target Consumer ................................................................................................ 15
3.5 Competitors Profile ............................................................................................ 16
4 OVERVIEW OF ESTONIAN CLOTHING MARKET ........................................... 17
4.1 Brief History of Estonian Economy ................................................................... 17
4.2 Estonian Retail Market ....................................................................................... 20
5 RESULTS .................................................................................................................. 24
5.1. Location ............................................................................................................. 24
5.2 Competitors ........................................................................................................ 28
5.3 Market Size and Share of Madonna ................................................................... 30
5.4 Estonian Consumer Behaviour ........................................................................... 31
5.5 Future Trends ..................................................................................................... 33
6. ANALYSIS OF THE RESULTS AND RECOMMENDATIONS.......................... 34
LIST OF REFERENCES ............................................................................................. 38
APPENDICES .............................................................................................................. 43
Appendix 1: Visualisation of Madonna FW 2011 Collection .................................. 43
Appendix 2: Price comparison ................................................................................. 44
Appendix 3: Estonian GDP ...................................................................................... 45
Appendix 4: Average gross wages ........................................................................... 46
Appendix 5: Retail venues ....................................................................................... 47
Appendix 6: Sales profit ........................................................................................... 48
Appendix 7: the Map of the Main Locations of Tallinn’s Retail Venues ................ 49
Appendix 8: Turnover Calculation Based on the Observation ................................ 50
Appendix 9: Market Share Calculation of Low-Price Level Brands ....................... 52
Appendix 10: Efficiency Calculations on the Example of New Yorker .................. 53

2
CONTEST OF FIGURES
FIGURE 1: 6 steps in market research process …………………………………….6
FIGURE 2: The logo of the brand Madonna……………………………………….13
FIGURE 3: Madonna’s main competitors on German Apparel market …………...17
FIGURE 4: Tax rate changes in Estonia ……………………….…………………..18
FIGURE 5: Unemployment rate in Estonia 1996-2010 ……………………………19
FIGURE 6: People working in the field of apparel retail in 2005 to 2009………....21
FIGURE 7: Estonian average monthly gross salary compared with apparel retail sec-
tor average monthly gross salary and the monthly expenses to employees from 2005
to 2009, in Euros ……………………………………………………………….....22
FIGURE 8: Apparel merchandise sales period in days from 2001 to 2011, *2011 in-
formation is average from 3 first quarters. ………………………………...……... 23
FIGURE 9: Sales margin % from 2002 to 2011* (*three first quarters) ………..... 23
FIGURE 10: Approximate rental prices in Tallinn, stores 100-300m2, price € per m
2
…………………………………………………………………………………….. 27
FIGURE 11: Madonna’s competitors in Estonian market……………………….... 29
CONTEST OF TABLES
TABLE 1. Price classes by product groups, prices in Euros ……………………...36

3
1 INTRODUCTION
As the Estonian apparel retail market has been long suffering from quite a high price
level due to the small size of Estonian market, which makes it unattractive to many
businesses, it is not the best place for earning profits. Therefore, several well-known
brands all around Europe will enter the Estonian market with a delay, for example
Estonia is still lacking H&M stores, and Zara opened their first brand store in Estonia
in 2004. However, the first Zara store was opened in Spain already in 1975 and later
expanded the stores network to a worldwide chain in the beginning of the 1990s. This
is a perfect example showing how far behind the Estonian market is.
The past years have shown a rapid increase in the lower-priced brands opening their
stores in the Estonian clothing market. 50% of the brands of this segment that are cur-
rently operating in the Estonian market opened their first stores in 2009 to 2011. So
the tendency is growing. That shows that a market need for these kinds of goods exists
and it is tremendous especially in the consumer group aged 14 to 25, who especially
appreciate the wallet-friendliness and trendiness.
The main purpose of this thesis is to examine the Estonian clothing retail market from
the perspective of positioning the brand Madonna. The market research was done for
the brand Madonna to enter into the market. In order to successfully enter, the answers
to the following questions needed to be found: Is there a market for the brand Madon-
na, and what would be the market opportunities.
There is no public analysis of Estonian clothing market available on the Internet or
libraries, but there are some pieces of information available about the strategies of the
competitors, behaviour of consumers, economic and financial data. The main idea is
to collect information from secondary data sources like sensory data, and through ob-
servation, all the methods are used to compose a larger picture of the Estonian cloth-
ing retail market.

4
2 THEORETICAL BASIS
2.1 Market Research
According to McQuarrie, Market research is an organized effort to gather information
about markets or their customers. This is a very important component of business
strategy. The process of researching marketing and marketing itself is very similar;
therefore these processes are commonly interchanged with the term marketing re-
search. However marketing research is targeted to invest in marketing processes and
market research is aimed to provide important information to identify and analyse the
market needs, market size and competition. (McQuarrie, 2006)
The market research process can be divided into 6 steps (see Figure 1. p. 7.). The first
step is to define the problem; well-defined problems allow concentration on the acqui-
sition of narrower, but more specific information. This can also be interpreted as cur-
rent situation clarification. A logical starting point is very important to conduct valua-
ble research. (Kurtz, 2008, p. 251)
The second step is to conduct exploratory research, which involves reviewing all the
information that already exists, discussing problems and examining information from
secondary sources. (Kurtz, 2008, p. 252) The purpose of exploratory research is to
look in-depth at the nature of the problem, in order to formulate suppositions and dis-
cuss them further. The result of this process is to determine the priorities and direction
of this research; also it is needed for clearer understanding of the soon to be studied
topic. (McQuarrie, 2006)

5
FIGURE 1: 6 steps in market research process (Kurtz, 2008)
After conducting exploratory research, the next stage is to formulate a hypothesis. In
terms of market research this is to state the objectives of the research. The third step
will help to answer to question: What do you need to find out? And the forth step is
about designingthe reasearch. (Ag Strategies, 2003).
According to Kurtz (2008, p. 253) the fifth step is the data collection. There are possi-
ble to gather two different kinds of data: secondary data and primary data. Secondary
data is information from previously published or compiled sources, for example cen-
sus data. (Kurtz, 2008, p.253). Primary data can be collected only one time, the next it
is already secondary data, because the data already exists (McQuarrie, 2006). The last
step in the process is the data analysis and interpretation. It is very important step,
because in that step collected facts get some kind of meaning. This is also complex
and critical process, because the end results are dependent of that step. Interpretation
means the conclusion making out of the analysed data. It changes collected data and
facts suitable for research targets and hypothesis. Analysis and interpretation are dif-
ferent actions, but they are closely connected and influencing each other. Even the
most thorough analysis procedure is useless if suitable interpretation is not managea-
ble to conduct and vice-versa interpretation can be as good as analysis procedures
enable it to be. (McQuarrie, 2006)
Market Research
Problem definition
Product/service definition
Hypothesis formulation
Research design creation
Data collection
Analysis and intepretation

6
Secondary data is pre-existing data gathered by another source and it is always gath-
ered before the primary data because reviewing the secondary data helps to find out
what kind of primary data needs to be collected. Secondary data has two major ad-
vantages: it is always less expensive to gather than primary data and it also takes less
time to locate and use secondary data. (Kurtz, 2008) The importance of secondary
data is growing due to the better availability of data. Secondary data is possible to
obtain from various databases, the Internet, articles and other public sources. An anal-
ysis of the secondary data is an important basis for collecting the primary data. There
are also some problems with using and collecting secondary data: availability, rele-
vance, accuracy and sufficiency, data might not be available because the problem is
too new, data exist but it is not possible to reach it, for example competitor holds that
data, some of the data is also reachable for a fee, e.g. companies’ financial reports.
Another problem is that data is not relevant because it will expire. Secondary data
comes from various sources and due the abundance of that data it is always a chal-
lenge to select the essential data only for a current topic. Data accuracy is also a prob-
lem. The last problem with secondary data is the sufficiency of that data, which means
that the data will satisfy the need only partially and therefore it will be necessary to
collect primary data. (McQuarrie, 2006)
Secondary data can be divided into two types: internal and external data. Internal data
is generated inside the company: accounting, sales reports, etc. (McQuarrie, 2006).
External data comes from a variety of sources: Internet, libraries, government records,
research services, and industrial publications. Nowadays, the data is mostly computer-
ised, which means it is quite easy and comfortable to obtain it. The Governmental data
is the nation’s most important source of market data. The Census data provides the
most frequently used government statistics. (Kurtz, 2008, p. 254). A census of a popu-
lation is conducted approximately every ten years, and it is available free on the Sta-
tistics Estonia Internet webpage (Statistics Estonia, 2012). It is very valuable infor-
mation because it breaks down the population into small geographic groups, and it
also divides people into age-groups, households, etc. Besides population’ it is also
possible to obtain information about financial reports of companies, the statistics
about employment and other special reports. (McQuarrie, 2006).

7
Primary data is the original data that is collected or observed in the course of the cur-
rent process. The advantages are that the information gained is richer and detailed than
secondary data information because the results are designed for a specific topic, and
the disadvantages are that collecting this data is more expensive and time consuming.
(Kurtz, 2008, p. 253)
Primary data types (Asrani, 2008):
Demographic and socioeconomic – age, marital status, income
Psychological and lifestyle – activities and interest
Attitudes and opinions – preferences, views and inclinations
Awareness and knowledge – facts about product, price and features
Intentions – planned or anticipated behaviour
Motivation – need, wishes
Behaviour – purchase, timing
There are three opportunities to gather primary data for research: observation, surveys
and controlled experiments (Kurtz, 2008, p. 258). As several authors (Hill, 2003;
Lindstrom 2008; Underhill, 2006) are indicating in their books then in contemporary
market or marketing research and analysis they do not believe and rely on what con-
sumers has to say about their preferences. Underhill and Hill are even indicating that
consumer behaviour observation gives more accurate data than questionnaires, be-
cause people tend to lie (Underhill, 2006; Hill, 2003). Hill is even more into scientific
approach to investigate consumer’s preferences with the help of sensor measuring
techniques, and Underhill is more into practical observation how consumers interact
with shopping environment. Underhill goes even further with his observation tech-
niques turning this into real science of shopping. In this study the main Underhill
technique – practical on-site observation is used and all conclusions are thrown from
the results. (Underhill, 2006)
Sampling is the process of selecting survey respondents or research participants
(Kurtz, 2008, p. 257). The advantage of designating sample is the time saving factor,
because choosing samples from general population and making conclusions based on
the samples and extending conclusions to all population helps to save time and costs.

8
The disadvantages are the generalisations made based on samples, it is known as the
sampling error. (McQuarrie, 2006)
According to Kurtz (2008, p.267) sales forecast is an estimate of a firm’s revenue for
a specified future period. Sales forecasts play usually a major role in new product de-
cisions, financial planning, distribution etc. This means the forecast has to be as accu-
rate as possible otherwise it will lead to incorrect decisions. There are three types of
forecasts: short-run (up to one-year period), intermediate (one to five years), and long-
run (beyond 5 years) forecasts. Forecasting trends fall into two broad categories: qual-
itative and quantitative forecast. Qualitative techniques rely on subjective data, which
means rather opinions, and quantitative technique relies on actual data gained from the
past. Most organisations use the combination of both techniques, but in this study
qualitative research methods are mostly used – the survey of consumers buying habits
are taken into the basics. Survey helps to predict short run and intermediate sales.
(Kurtz, 2008, p.267)
2.2 Market Segmentation and Brand Positioning
Market segmentation is the division of the total market into smaller, relatively homo-
geneous groups. (Kurtz, 2008, p.281) Consumer market is segmented into four major
sections: geographic, demographic, psychographic and product-related segmentation.
It is important to concentrate into ethnical segment because different ethnical origin
means different preferences, lifestyle and even taste. (Kurtz, 2008) Psychographic
segmentation means the division into groups by similar psychological characteristics,
values and lifestyle. Lifestyle refers to person’s mode of living on daily basis. Con-
sumer lifestyle is a collection of consumer individual needs, motives, attitudes and
also other influences such as family, job, social activities and culture. (Kurtz, 2008)
As market segmentation is basically done before from the initial brand creators, and
therefore already created image has to be followed. According to Trout (Trout 1969):

9
“Effective Brand Positioning is contingent upon identifying and communicating a
brand's uniqueness, differentiation and verifiable value. It is important to note that
"me too" brand positioning contradicts the notion of differentiation and should be
avoided at all costs. This type of copycat brand positioning only works if the busi-
ness offers its solutions at a significant discount over the other competitor(s).”
Generally, the brand positioning process involves several processes, such as identify-
ing direct competitors, and understanding how each competitor is positioned their
business, for example the fastest or the number one provider. If not dealing with start-
up business then it is important to document the provider's own positioning, compare
the company's positioning to its competitors', to identify viable areas for differentia-
tion, and develop a distinctive, differentiating and value-based positioning concept.
The last step is creating a positioning statement with the key messages and customer
value propositions to be used for communications such as advertising, media, PR,
website, etc. (Trout 1969)
2.3 Implementation
As for the exploratory research the secondary data were collected. Due to the topic of
this thesis is the research of Estonian apparel retail market, then no internal data exist.
In this report, all the secondary data collected is external secondary data. And the ex-
ternal data is gathered from all kind of ready made researches and articles.
Based on the authors like Underhill, Hill and Lindström this research is also primarily
modelled in the observation-based. How people act with the environment, what attract
their attention in given stores and also how many people purchase from the stores ob-
served. Therefore the main primary data observed is from the type of lifestyle and
behaviour e.g. which stores people do prefer and actually visit, and where the pur-
chases are made.
The idea of using observation as a part of research came from various authors as al-
ready mentioned. Observation is more adequate than questionnaires because the ac-
tions take place in real time and this kind of answers and interpretations are the most

10
authentic. Observation is the personal or mechanical monitoring and registering of the
chosen activities while they are attempted. There are several levels of complexity: the
lowest and the easiest technique is for example just counting the numbers of consum-
ers entering to the shop, and the most complex techniques include sensors to measure
consumers psychological reaction (McQuarrie, 2006). The observation methods used
for current research are as follows: the observed environment is natural – shopping
centres and apparel stores; the research is concealed, so the observed consumers do
not know that they are observed. Like McQuarrie referred this is useful for authentic
information, because the actions are more natural when consumers do not know that
they are observed. The observation is also personally conducted and direct, because
the consumer is observed in the shopping environment and conclusions are interpreted
accordingly. The observation technique used is more simple than complex – counting
the enterers and purchasers. (McQuarrie, 2006)
One the most used method in current report is interpretative research that is an obser-
vation research method that is developed by social anthropologist in which consumers
are observed in their natural setting and their behaviour is interpreted based on an un-
derstanding of social and cultural characteristics. According to Kurtz this is a method
that explains the behaviour that operates below the level of conscious, so this method
can provide insights into consumer’s behaviour either internationally or domestically.
Interpretative research focuses on understanding the meaning of a product or the con-
sumption experience in a consumer’s life. Through that method it is possible to see
consumers interact with the product in their environment. Mostly the interaction is
filmed, but in this case the personal observation was used with a little help of a pen
and a paper (Kurtz, 2008). The downside of interpretative research is that it takes a lot
of time and money.
McQuarrie defines that the process of observation includes 3 different parts: what,
where and how. (McQuarrie, 2006) The first part is to make a decision what and
where to observe. As the market research is done for Madonna then all the possible
competitors were mapped and then some of them were observed, besides this the ent-
erers and purchasers of the different price level stores were observed also, just to see
the advantage of bringing low-price level brand onto Estonian market. Next question

11
is how to register the outcome. In this research the outcome was registered manually
after it was formatted and inserted into Excel, analysed and interpreted. The choosing
the necessary figures to minimise the subjectivity of observer.
In this study the field research was used and it was conducted in Tallinn. Tallinn was
token account as the launching market for Madonna’s first brand store in Estonia, be-
cause of the size and the bigger financial abilities. The shopping centres were selected
as convenience sampling – the samples were chosen randomly. Viru centre was cho-
sen, because it is the most popular centre in Tallinn, situated in the city centre, Kristi-
ine centre was chosen because the location is just on edge of the centre of Tallinn and
Rocca Al Mare was chosen, because it is the biggest centre in Tallinn and it is located
on the suburb area. In this study the research participants – brand stores, were selected
according to stratified sample method – all the possible samples are divided into strata
from the price level objective, and further on random selection is applied from every
strata. So the price level is divided into three levels: low, medium and high. From each
price level are randomly chosen one brand to match the enterers and purchasers,
which means that from the three shopping centres three different stores were observed
(see Appendix 8). The observation took place from the end of October 2011 til the end
of November 2011, and the entrers and purchasers were counted. The outcomes of
low price level enterers and purchaser rate is taken into account in calculating turno-
ver and assessing opportunities (see Appendices 8 and 9).
Madonna offers goods for personal use – consumer products, so the segmentation of
consumer market is looked more closely. In Madonna’s case the geographic segmen-
tation is used, and it means the division of an overall market into homogenous group
based on the group location: in this study broadly Estonia, and narrower Tallinn popu-
lation. The second is demographic segmentation and it is a division of the market into
smaller groups based on variables such as gender, age, income, occupation, etc. As
Madonna is already created brand and the brand image is done then the prescribed
factors are considered. Ethnic segmentation belongs also into the demographic group
and this is very important factor in this study, because there are 30% of Russians liv-
ing in Estonia.

12
3 INTRODUCTION TO THE BRAND MADONNA
3.1 Background
Madonna is German fast-fashion brand that is targeted for young females who are
keen in fashion with low prices. Madonna launches a collection every month. See
Figure 2 for Madonna logo and see the visualisations of the brand Madonna in Ap-
pendix 1. The history of Madonna brand dates back to 1988, when the founder of the
company Juergen Hoch had a vision about current trends with fair prices. The home of
the brand is one of the biggest city in German – Düsseldorf, where Topaz Textilhan-
dels GmbH operates the Madonna brand (Madonna, 2012). According to Wer-zu-
wem, the turnover of the company was 102 million Euros in 2009, and the company
has approximately 700 employees in Germany alone. (Wer-zu-wem, 2012).
FIGURE 2: The logo of the brand Madonna (Madonna, 2012)
In 20 years, Madonna managed to establish herself to become an internationally suc-
cessful young fashion brand with a monthly changing complete collection. Madonna
can be found in over 15 countries. Madonna’s label started with outerwear, but now
the collection includes everything: tops, skirts, jeans, etc. Madonna covers all the cat-
egories of girl’s clothing and includes a varied assortment of accessories. It provides a
basic and trendy line and, as mentioned before, the new collection appears monthly.
For making the brand more diverse the Madonna jewellery line was launched at 2003.
The line “Madonna Juwel” was created to support the idea of getting everything at one

13
place at a low price. In addition to modern jewellery and watches, Madonna offers
bags, flip-flops, belts, caps and hair accessories. Besides clothing and accessories, it is
also possible to buy Madonna lingerie. The lingerie line “Little Secret” is also provid-
ing a basic and trend range on a monthly basis as Madonna clothing line. (Madonna,
2011)
3.2 Technology and Quality
Madonna’s product sewing technology and quality are quite similar to all the other
fast-fashion and good-priced brands. Most of the articles are made from cheaper fab-
rics and materials, like stretch jersey, cotton mixed with spandex, cotton or acrylic
knits (77onlineshop, 2012). In general the sewing technology is as simple as possible
and the fabrics used are as cheap as possible to obtain a good total cost of ownership
(TCO). Therefore, some of the problems with fabric pilling and colour fastness will
appear. Fabric pilling occurs when wearing and cleaning the product causes the fibres
to unravel and the loose ends ball up on the fabric surface. Fabrics containing fibres
such as acrylic, nylon, or polyester have a tendency to pill. Natural fibres like cotton,
linen, or wool may also pill, but the balls of fibres are usually removed during laun-
dering (Missouri Families, 2012). Madonna uses a lot of acrylic knits and polyester
mixed fabrics for tops and sweatshirts. These kinds of fabrics have tendency to pill.
Colour fastness is an other aspect of the quality. It means the resistance of colours to
fading, so it refers to the notion of an object having a colour that retains its original
hue without fading (Merriam, 2012). The fastness problem occurs especially with
multicoloured fabrics that include contrast colours, like black and white or any colour
combined with white– after some washing the white turn’s greyish or stains.
In conclusion, the biggest quality problem is pilling, due to the cheaper materials used
to obtain low TCO. Colour fastness is only problematic with multicoloured products
or products where the white colour is combined with other bright colours. The quality
of the technology and the product is quite acceptable especially when to take the low-
price level into account.

14
3.3 Price Level
Madonna’s price level is quite low and customer friendly. It has competitive price
level in comparison to several other fast-fashion brands. To draw parallel with the
biggest and the most successful fast-fashion brand H&M (See Appendix 2) then the
price level is quite similar. Retail Prices (RP) only vary about 10 %. The variations in
prices in different product groups are the result of different usage of materials and
technologies. So the main price influencers are the cost of materials and the complexi-
ty of technology. In general it is possible to see that Madonna offers the same product
with the same price as H&M. (77onlineshop, 2012; H&M, 2012; Bershka, 2012; New
Look, 2012)
As Seen on Appendix 2 Madonna’s prices are 7% higher than the prices of H&M. On
the other hand Madonna prices are 7% lower than Bershka’s prices, and almost similar
to New Look’s prices, with the difference of 0, 07%.Also the major difference be-
tween Madonna’s and Bershka’s price level comes from the T-shirt product group
which leads to a conclusion that Bershka is more into producing fashionable T-shirts
instead of more basic ones. As more prints and accessories are included and added to
the tee the more expensive the product becomes and that makes a difference in prices
between Madonna's and Bershka’s T-shirts. Excluding T-shirts then the price levels of
Bershka, Madonna and also New Look are quite similar, not to say the same. Again
the variation of prices comes from the different usage of materials, techniques and
accessories. Madonna’s brand operates at the same price level as New Look and Ber-
shka (excl. tees), and H&M can provide lower prices mostly because of the interna-
tionality and enormous bulk quantities. Also the fabric prices in the case of H&M are
more likely to be cheaper because H&M can afford purchasing big quantities of fabric
to supply wide range of products to its 2500 stores around the world. H&M has larger
manufacturing quantities than any other brand brought out in this report. (H&M,
2012)

15
3.4 Target Consumer
Madonna's brand is targeting youthful females who consume latest trends while look-
ing for bargain-price level. Madonna’s main goal is to be close to the consumer.
Therefore they are rapidly expanding their stores and shop-in-shops. They have 89
company operated stores mostly in Germany and Madonna also supplies over 600
retailers which increases the number of shop-in-shops abroad. Besides Germany the
label is represented in Belgium, Bosnia, Italy, Estonia, Finland, France, Luxembourg,
The Netherlands, Norway, Austria, Poland, The Russian Federation, Sweden, Switzer-
land and Czech Republic. (Madonna, 2011)
Madonna’s main target consumer profile (TAP) is a female between the ages 12-24
who live in cities and visits the stores or shop-in-shops 2-3 times per month. She is a
student or a pupil and because she is studying she is financially dependent on her par-
ents. Therefore prefers low-price brands such as Madonna, H&M, Primark etc., which
still offer latest trends. Madonna’s primary audience is a young female with the sense
of fashion, purchasing trendy items and new collections as soon as they reach sales.
The consumer is also price sensitive and at the same time trend-conscious. But in this
case the decision-makers are parents who are providing money to the Madonna’s tar-
get consumer. The influencers are friends, teenagers and coevals. Secondary TAP is
also female at any age living in the city or nearby from Madonna’s point of sale visit-
ing a Madonna store once a month. Secondary audience is female consumer who is
keen to buy low-price basic products. She is working and she is trend-conscious but at
the same time loves to mix expensive brands with lower priced high-fashion brands.
In this case the decision-maker is the target consumer and the influencer is also friend
or personal financial status. (Kennaugh, 2003)

16
3.5 Competitors Profile
The competitors are market-based because the selection is different in each country.
Madonna’s main market is Germany and below is given a brief overview about Ma-
donna’s competitors on the German market based on their prices (see Figure 3).
FIGURE 3: Madonna’s main competitors on German Apparel market
Madonna’s price level is quite low. Zara could also be the competitor, but on the Es-
tonian market it is not, as Zara is considered to be in middle-priced brand groups in
Estonia. For more information about Madonna’s price level see chapter 3.3. and Ap-
pendix 2. for comparison of prices. In general can say that the price is quite a big fac-
tor in designating the competitors because this is the core value of Madonna’s busi-
ness - providing trendy clothes with friendly prices. Another core value and a huge
factor of designing the competitors is the trendiness. The provided clothing has to be
trendy and youthful because of the target audience purchases trendy and youthful
items. Based on this theory we can assume that every brand that offers trendy goods to
women from age 12 to 24 with budget prices are competitors to the brand Madonna.
New
Yorker
Primark
New
Look
Breshk
a
C&A
Tally
Weijl
H&M
Madonna

17
4 OVERVIEW OF ESTONIAN CLOTHING MARKET
4.1 Brief History of Estonian Economy
The Estonian retail market started to develop with the beginning of the Estonian Re-
public in 1918, as a command economy. The shift from command economy to market
economy took place in the end of the 80s when the Soviet Union collapsed. Estonia
regained its independence on 20th
of August in 1991. After becoming independent,
several incidents have been influencing the Estonian economy: in 1995, a Free Trade
Agreement was made with the European Union (EU), in 1999 Estonia joined with the
World Trade Organisation (WTO), and Estonia started to use the EURO in the begin-
ning of 2011. (Alasoo, 2006)
In 1994, Estonia became one of the first countries in the world to adopt a flat tax, with
a uniform rate of 26% regardless of personal income (see Figure 4). Estonia has been
fast catching up with the other EU countries, having grown its Gross Domestic Prod-
uct (GDP) per capita from 34.8% of the EU-15 average in 1996 to 65% in 2007.
(Laar, 2007)
Tax rate
2624 23 22 21
0
5
10
15
20
25
30
1994 2005 2006 2007 2008
%
FIGURE 4: Tax rate changes in Estonia (Statistics Estonia, 2012)

18
In 2006 Estonian economy was one of the fastest growing in the world with the
growth rate even 10%. The GDP – Gross Domestic Product - is often considered an
indicator of a country's standard of living; but GDP is not used as a measure of per-
sonal income. See the data of Estonian GDP on Appendix 3. (The Guardian, 2009)
In July 2009, Estonian VAT (Value Added Tax) was increased from 18% to 20 %.
The other downside of the crisis was the explosion of the rate of unemployment. Esto-
nia has approximately 600 000 employees and in the first quarter of 2010 the unem-
ployment rate reached to 19.8%. Which means that there were almost 120 000 people
without a job. See Estonian unemployment rate changes on Figure 5. (Baltic Business
News, 2009). According to Statistics Estonia, then unemployment rate in 2011 was
8.4%.
FIGURE 5: Unemployment rate in Estonia 1996-2010 (Statistics Estonia, 2012)
The crisis forced many employers to reduce wages and lay off employees in order to
survive. The number of people entitled to employer insolvency benefit increased by
almost six times between 2007 and 2009, rising from 1,141 to 6,709 people (Euro-
fund, 2010). According to Statistics Estonia the average monthly gross wage in Esto-

19
nia was 809€ in the third quarter of 2011, and the minimum monthly gross wage is
290€ from 1st January 2012. See Appendix 4 (Statistics Estonia, 2011)

20
4.2 Estonian Retail Market
The first time the Estonian retail market sales volumes declined compared to the pre-
vious year, was in March 2008. After March 2008, the decrease has been constant. In
2007 was the peak period in retail sales, when sales volumes were significantly higher
than real growth of GDP. In the following years the retail sales followed the line of
overall economy. (Kose and Leppik, 2009, p. 25) Retail businesses sales increased by
5% in December 2011 compared to the year before. From February 2011 on, retail
sales were in stable growth. In December, they accumulated for an overall 389.1 mil-
lion Euros. Although the biggest influence was the grocery segment, apparel business-
es managed to grow their retail sales by 9% compared to December 2010. The sales
profit in 2011 reached almost 3.9 billion Euros, to which product retail contributed
83%.(Statistics Estonia, 2011)
Business sales areas have been in rapid growth as well. In 2001, they accounted for
less than 200 000 m2 in Tallinn, whereas in 2005 the number already rose above
300 000 m2 and in 2008 there was a total of over 430 000 m
2 of sales areas. That
equals 1, 05 m2
for each citizen. After 2008, the growth of sales areas slowed down.
(Kose and Leppik, 2009. p. 25). As shown in the Statistics Estonia, the number of
sales venues had increased from year to year, growing from nearly 2800 in 1992 to
almost 7000 venues in the year 2008. The number of square meters of these venues
also grew significantly. In 1992, a venue’s average size was 100 m2, while in 2008 it
had already doubled. For the illustration see Appendix 5. (Statistics Estonia, 2011)
The amount of companies operating in the Estonian apparel retail market had been in
constant growth, too. In 2005, there were 269 companies in comparison to 343 in
2009. Accordingly, the growth throughout the years had been constant but not signifi-
cant. This means the recession years had a positive effect on the market of apparel
brand retail stores, since it became more stable and optimized. See Appendix 5 for the
growth of clothing retail companies operating in Estonia. (Statistics Estonia, 2011)

21
The amount of people working in this sector had developed quite similarly to the
number of businesses. Meanwhile, the employee rate was clearly influenced by the
economy– it dropped in recession years. Accounting for 2300 people in 2005 working
in apparel retail. Whereas in 2009, they decreased again as the trend of maximising
work efficiency and laying off (some) workforce became common, since work load
and profits went down and overall cost saving measures were realized. See Figure 6
(Statistics Estonia, 2011).
Employees in apparel retail sector
23192561
31752888
2702
0
500
1000
1500
2000
2500
3000
3500
2005 2006 2007 2008 2009
FIGURE 6: People working in the field of apparel retail in 2005 to 2009 (Statistics
Estonia, 2011)
The trend of cost saving in recession years can also be seen in the expenses to work-
force and average salary development. See Figure 7, for the average salary and work-
force expenses in the field of apparel retail and Estonian overall average salary per
month from 2005 to 2009, the currency is Euro. As shown in Figure 7, then the aver-
age salary in apparel sector is considerably smaller than the Estonian overall average.
The average clothing retail gross wage in 2009 accounts for roughly 60% of overall
Estonian average monthly gross salary. (Statistics Estonia, 2011)

22
420
512
629
675
628
315
384
472
506
467
516
601
725
825
784
0 200 400 600 800 1000
2005
2006
2007
2008
2009Average salary per month,
Estonia
Average salary per month,
Clothing retail field
Average expences to
workforce per month,
Clothing retail field
FIGURE 7: Estonian average monthly gross salary compared with apparel retail sector
average monthly gross salary and the monthly expenses to employees from 2005 to
2009, in Euros. (Statistics Estonia, 2011)
The next indices looked at are the profitability of the sector and the market demand by
months. As indicated on Appendix 6, the profits follow the development of the overall
economy, the rising lasted till 2008 and falling began in 2009 (Statistics Estonia,
2011). Currently, sales are in a recovery phase, with several companies stating the
increase of retail sales at the end of 2011 and in the beginning of 2012. For example
Baltika, the largest Estonian apparel manufacturer claimed 17% increase in retail sales
in January 2012 compared to the same month a year ago. Baltika’s growing sales
trend started in November 2011 when they declared the rise in sales to be 13% (13%
in November, 15% in December and 17% in January 2012). (Esse, 2012)
The demand for clothes is highest in the beginning of the season: March, April, Au-
gust and September. See Appendix 6. These are the months when new merchandise is
displayed. Also, high sales profits are realized, because many goods are bought at full-
price and full margin. As can be seen in the trend, sales profits in January and Febru-
ary rose in 2008, which means people bought more clothes with discounted prices and
the importance of the trend has shifted away. Today, the Estonian consumer is more
price-sensitive. (Statistics Estonia, 2011)

23
Estonian consumers have become more price-sensitive because of the economic
changes and imbalances happened in previous years: many have lost their jobs, the
prices have increased and therefore the general quality of life has declined. This can
also be seen in the duration of products’ sales periods, which have increased. Longer
sales periods have negative consequences on companies, because the shorter the peri-
od they require to sell their merchandise the higher their cash flows, profits, etc. will
be (See Figure 8). Figure 9 refers to the change of sales margin in % throughout the
years, which proofs that the margin had been quite stable in past years, with only a
10% drop in 2009. Comparing these two figures then 2009 were the hardest year in
the apparel retail sector. (Statistics Estonia, 2011)
Merchandise sale period in days
140129
108 107 10391 88
104 113126
150
0
50
100
150
200
2001 2002 2003 2004 2005 2006 2007 2008 2009 2010 2011*
FIGURE 8: Apparel merchandise sales period in days from 2001 to 2011, *2011 in-
formation is average from 3 first quarters. (Statistics Estonia, 2011)
Sales margin %
51 51
7077
6475 75
6573 71
0
20
40
60
80
100
2002 2003 2004 2005 2006 2007 2008 2009 2010 2011
FIGURE 9: Sales margin % from 2002 to 2011* (*three first quarters) (Statistics Es-
tonia, 2011)

24
5 RESULTS
5.1. Location
This report will focus on the Tallinn venues as the first Madonna brand store will be
launched in Tallinn, as it is the biggest city and market in Estonia. As Tallinn will be
the first launching market this chapter will specify into Tallinn’s market perspectives
and options. The main districts and options of store location are introduced and ana-
lysed. Tallinn’s retail venues market mainly concentrates on 11 bigger shopping cen-
tres: Rocca Al Mare, Viru, Kristiine, Ülemiste, Sikupilli, Magistrali, Järve, Mustika,
Norde, Lasnamäe Centrum and Solaris. See Appendix 7 for the map of the main loca-
tions of Tallinn’s retail venues. There are also few retailers doing businesses in ground
floor venues in the centre and Old town, but this is not a trend in Estonia and most
clothing retailers do have stores in shopping centres. (Trubetskoi, 2011)
Viru Centre
Viru is located in the heart of Tallinn and it is the most visited centre with over 30 000
visitors per day, and there are approximately 100 stores and service places. The Viru
Centre is trend oriented and there are mostly apparel and shoe stores, also perfumeries
and pharmacies. One part of the Viru is also Tallinn department store, renting some
venues in the cellar, on 1st and 2
nd floor, which are also connected with the department
store building. Tallinn’s local transport bus terminal also lies beneath the Viru Centre
that has increased the rate of the visitors of the centre. The Viru centre has only
26 300 m2
of retail space. It was built in 2004, but it is the most important and expen-
sive shopping centre in Tallinn and also in the whole Estonia. Viru has the highest rent
prices per square meter as they also have the highest visitor rate. (Trubetskoi, 2011).
The turnover of the Viru centre increased with 10% in 2011 reached to 117, 4 million
Euros and there were 11 million visitors in the year 2011, which is 3, 4% more than in
2010. For 2012, they are expecting a 5-percent increase of the turnover. (Kald, 2012)

25
Rocca Al Mare Centre
The Rocca Al Mare centre is located in the West Tallinn in the Haabersti district, 7
km away from the centre of Tallinn. The Rocca Al Mare centre is reachable with pub-
lic transportation. It is the biggest shopping centre in Tallinn with 53 300 m2 of retail
space and was first opened in 1998. The centre is family oriented and there is a wide
range of stores – over 160 stores operating in this centre. Rocca Al Mare was renovat-
ed in 2008-2009, and after that it became the most logically built shopping centre in
Estonia, because it is divided into specific areas: shoes, apparel, sport, hobby, elec-
tronics, books etc. The biggest advantages of Rocca Al Mare are the size of the centre
and the convenient shopping environment; it is possible to easily and rapidly get eve-
rything what a consumer wants from one place. After the renovation, Rocca Al Mare
raised the prices of the rental spaces with 41%; because the turnover of the sales in
2010 also rose with 14% and the vacancies of the retail areas are close to zero (Arco
Vara, 2011). There is average of 17 600 persons visiting the centre per day (City24,
2012).
Kristiine Centre
The Kristiine Centre lies on the edge of the centre of Tallinn and it has a very good
transportation connection between several Tallinn’s districts. It was built in 1999 and
was renovated twice - 2002 and 2010. After last renovation the centre has a total of 42
500 m2 rental space and the average visitors per day 19 500. Kristiine is trend and
family oriented with over 170 retailers operating mostly in the field of apparel, shoes
and beauty, but also sport and electronic stores are present. The turnover increased
with 41% in the year 2011 but this was mainly because of the extension and several
new businesses started. The visitor rate also rose to 22, 3% in 2011 to 7, 12 million
people a year (City24, 2012). The Kristiine centre is also one of the most popular
shopping centres in Tallinn besides Viru, Rocca Al Mare and Ülemiste. Therefore
there are no vacant rental spaces available and this is also one reason why the rate of
the rental areas increased 8, 4% in 2011 (Arco Vara, 2011).
Ülemiste Centre
The Ülemiste centre was built in 2004. The centre has not been renovated nor extend-
ed due the economical instability of the past years. Ülemiste has 37 500 m2 of rental

26
space and is family oriented. It is situated near the Tallinn airport. The most conven-
ient way to visit the centre is by car because there are few bus connections between
the centre and the city. There are approximately 20 000 persons visiting the centre per
day and therefore it is quite popular among Estonians and Ülemiste also does not have
vacant rental spaces (Trubetskoi, 2011). The turnover increased with 10, 5% in 2011,
and for 2012, they are expecting a 5-percent increase of the turnover. Visitor’s rate is
expected to increase with 3, 5% in 2012 (Delfi Majandus, 2012).
Solaris
Solaris is the newest shopping centre in Tallinn - it was opened in autumn 2009. So-
laris offers besides retail various means of entertainment: a movie theatre, a concert
hall, dance studio, and several eating places. Solaris is quite small, it has 12 800 m2 of
retail space but it lies in the heart of Tallinn just near the Viru centre having 20 000
visitors per day (Trubetskoi, 2011). Solaris is an attractive place for Madonna’s store,
because of the younger age of Solaris visitors, although the rental prices are quite high
because locating directly in the city centre.
Magistrali Centre
Before the renovation, Magistrali had only local importance, because it is situated in
the district of Mustamäe and its main renter was grocery store Rimi. Before the reno-
vation Magistrali had approximately 11 500 visitors per day. Magistrali is re-opened
in May 2012. After the renovation the centre will have 2000m2 of extra rental space.
Owner of the centre, operator Citycon OY believe that in the future there will be
15 000 visitors per day. Magistrali was built in the year 2000 and it is also family con-
centrated offering goods from groceries to lingerie. (Trubetskoi, 2011)
Norde and Lasnamäe Centrum
These 2 shopping centres are with secondary importance because of the location and
targeted audience. Norde Centrum is situated next to Tallinn Harbour and its main
visitors are tourists buying food from Rimi. Lasnamäe Centrum is at the district of
Lasnamäe – Tallinn’s most populated district. This is the location for Russian targeted
fashion, where the selection is more shiny and glamorous. Lasnamäe Centrum has
12 900 visitors per day and there is 19 600 m2 of rental space. (Trubetskoi, 2011)

27
Järve, Mustika and Sikupilli Centre
The Järve and the Mustika Centre are concentrated to furnishing and home building so
they would be out of focus for Madonna’s store, and Sikupilli is more grocery orient-
ed. Visitor rate of these centres are between 10 000 to 16 000. (Trubetskoi, 2011)
In general there are several shopping centres in Tallinn that would be suitable for
brand Madonna to open its brand store. Viru would be the best choice because of the
enormous visitor rate, but the down side of Viru is high rental price. The same is with
Solaris, it has a huge amount of young visitors who are the exact target group for Ma-
donna, but high rental price is also the downside. (See comparison of rental prices in
Figure 10.) Rocca Al Mare, Kristiine and Ülemiste are very much known in the Esto-
nians and the rental prices are lower than in Viru and Solaris, which means the profit
could be quite the same as there are a lot of visitors too. See appendix 8 for the turno-
ver calculation. Magistrali Centre and Lasnamäe Centrum would be the secondary
choice, because they have a significantly smaller average visitor rate per day. So they
would as an expansion option in the future. The overall problem with opening a store
is the lack of vacant spaces in shopping centres.
Approximate rental prices
45 45
3025
20 1815 12
0
10
20
30
40
50
Viru
Sol
aris
Kris
tiine
Rocc
a
Üle
mis
te
Nord
e C.
Lasn
amäe
C.
Mag
istra
li
FIGURE 10: Approximate rental prices in Tallinn, stores 100-300m2, price € per m
2
(Statistics Estonia, 2011)

28
5.2 Competitors
Madonna’s competitors are the brands that have their own retail stores, trendy prod-
ucts with a similar price level and similar target consumer. See Table 1.
TABLE 1. Price classes by product groups, prices in Euros
Product group: Low Middle Expensive
Dress …- 29 30-79 80-...
Skirt …- 24 25-49 50-…
Trousers …- 29 30-59 60-…
T-shirt …- 9 10-19 20-…
Ls. Blouse …- 29 30-39 40-…
Knitwear …- 29 30-59 60-….
Jacket …- 49 50-119 120-…
In low-price range there are quite few competitors in Estonian market. As seen on
Figure 11 there are only 7 well-known brands operating their stores in Estonia - Ter-
ranova, New Yorker, Bershka, Stradivarius, Pull&Bear, Reserved, and Tally Weijl.
The trend of launching low-price brands in Estonia is quite new; in last 3 years 3 out
of 7 brands launched their first brand store in Estonian market – Tally Weijl in 2011,
Pull&Bear and Stradivarius in 2009 (Delfi, 2011; Pull&Bear, 2012; Femme.ee, 2009)
FIGURE 11: Madonna’s competitors in Estonian market
Reserved
Tally
Weijl
Terranova Pull &
Bear
Stradi-
varius
Bershka
New
Yorker
Madonna

29
The strengths of the competitors is that they have managed to strengthen the consumer
awareness with a long existence in the market and their timing of entering to the mar-
ket was very good – in the middle of recession years (2008-2010) when subsistence
level was low and consumers started to consider more over price. Late bloom of low-
er-priced brands is a sign that the Estonian clothing market does have the need for this
kind of segment. The strength is also the locations of these brand stores. Terranova
has stores in Viru and Kristiine, New Yorker stores are in Kristiine, Rocca Al Mare
and Ülemiste, and somewhat contrary are the location of Stradivarius, Pull&Bear and
Bershka, locating only in Tallinn with only 1 store of each brand, and not even in
shopping centres, but in the Tallinn centre, named Rotermanni Quarter.
The weaknesses of the competitors are mostly that several brands are owned by one
company, for example Apranga and it is operating with different brands in the same
segment. Apranga operates with brands Mango, Bershka, Zara, Pull&Bear and Stradi-
varius. All these brands are competitors in the segment for young fashion, so they are
not supporting the sales of each other. (Apranga, 2012)
There are also some indirect competitors in Estonian market, like Lindex, Zara etc
with higher price range but with youthful and trendy products. The main threat is that
Madonna does not succeed to embrace a market share from these higher priced brands
and they will become direct competitors as Estonian consumer is used with high ap-
parel prices, then it is hard to change their buying behaviour. On 13th
February 2012
H&M declared on their Facebook fan page that they are opening their first store in
Riga in the autumn of 2012, soon they will probably open also stores in Tallinn too (in
the perspective of 2-3 years). Believably H&M operates with Baltic States strategy to
expand its business to all the countries of Baltic States. When this happens H&M will
be the biggest competitor of Madonna and H&M’s expansion to Estonian market is a
big risk for Madonna’s profit (H&M in Facebook, 2012). The other indirect competi-
tor is Humana. Humana sells second hand clothes with quite high price range; the
price level is same as Madonna’s. Humana is extremely popular in Estonian retail
market, because it allows people to buy cheaper clothes. It holds 4% of the overall
market share and the turnover of Humana was 6, 6 million Euros in 2010 (E24, 2011).

30
5.3 Market Size and Share of Madonna
As the first Madonna brand store will be launched in Tallinn with the future plans of
expanding to all the largest cities in Estonia, then geographically Madonna’s market is
segmented into Estonia, Tallinn. There were 1, 34 million people living in Estonia in
2011 with 397 829 persons of them in Tallinn in 2011. The number of Estonians is
forecast to be constantly dropping, for example it is predicted that the citizen rate has
dropped to 351 900 to the year 2050. (Statistics Estonia, 2012)
It is targeted to women and the targeted consumer age is from 12 to 24. The age des-
ignates that the target consumer is more likely to study than work, is single and with
modest income. The secondary TAP is in the age group 25+ and is more basic product
oriented with the consumers or mothers buying for their daughters. In Tallinn there are
approximately 27 000 females aged 12 to 24, and 84 000 females aged 25-50. This
means that the total number of females aged 12 to 50 is approximately 111 000.
When segmenting Madonna’s target market by ethnic group, you have to keep in mind
that Estonian and Russian consumer preferences differ – Russians do like more col-
ourful and bright clothing and Estonians prefer more natural and somewhat modest
apparel. These kinds of differences influence the purchase of a selection and the loca-
tion of a store. There are more Russians in the Eastern regions of Estonia and also
Eastern Tallinn, like in the Lasnamäe district. Therefore opening a store in Lasnamäe,
where the Russian population is more numerous calls for a selection different from
one available in a Madonna store situated in the centre of Tallinn, where the basic
consumers are more likely Estonians or tourists. The last segmentation used is psy-
chographic section – because the brand Madonna emphasizes that its customer is
trendy and youthful. This means they are segmented by lifestyle and also this segmen-
tation has already been made by thebrand creators. An importer only has to follow the
basic lines that are already settled. The potential user range is much narrower than the
proportion of females in the age group 12 to 50, because not everybody in the age 12
to 24 wants to look like a follower of the latest trend, but most of them do, and the
situation is even worse in the age group 25-50, because older women have already
shaped their style, therefore, Madonna’s pieces would be uninteresting to them.

31
Madonna’s competitors held 20% of the overall Estonian Clothing Retail market in
2010, with the turnover of 44 million Euros. The market share of the lower-price level
brands is continuously growing as shown by Appendix 9. The growth of the lower-
price level brands was almost 12, 5% in 2010. As known, several new low-priced
brands opened their first stores in 2011 believing that the growth of the market share
of these brands would also continue in 2011. The growth comes from the medium-
price level brands, as several high-end brand retailers were also referring to the growth
of the profits, i.e. Tallinna Kaubamaja declared that the 4th
quarter of 2011 was the
highest net income in their history. Tallinna Kaubamaja sells high-end brands. That
allows to assume that high-end brands as niche brands do not lose market share and
therefore the growth of lower-priced brands market share comes from medium-priced
brands. The price sensitivity factor is also shown by the sales of Humana, the largest
chain of second hand stores in Estonia, holding almost 4% of the market share. Hu-
mana is Madonna’s indirect competitor. (Esse, 2012)
The potential market share of the brand Madonna with one operating brand store is
approximately 0, 5%. In the calculation of Madonna’s market share the chain store
New Yorker has token for the basis. As New Yorker owns 5% of Estonian Apparel
retail market share, operating with 6 stores in 4 major cities, and offering also boys’
clothing. Madonna operating one store in one city offering only girls clothing would
be reasonable share of 0, 5%. This means approximately a turnover of 0, 86 million
Euros a year. See in more detail from appendices 8 to 10.
5.4 Estonian Consumer Behaviour
Estonian consumer falls into two separate categories by ethnicity: Estonians and Rus-
sians. The behavioural factors of these two nationalities differ a lot, but there are also
huge differences in the nationalities varying by the income and economic well-being.
In this chapter the non-Estonians and Estonians are introduced separately. Non-
Estonians inhabit most of the East-Estonian regions such as Virumaa also there are a
lot of them living in Tallinn in Lasnamäe, which is a part of East-Tallinn (Statistics

32
Estonia, 2012). Non- Estonian form 30% of Estonian consumer market and they like
more to buy goods that are promoted than Estonians. They are more into trying and
testing new products because Russian speaking minority is more opened by their na-
ture. Because of the factor that Russians are more open for experiences they are keen-
er into spending their free-time for shopping, because this entertains them. Russians
are also watching and following more commercials than Estonians. The biggest group
of consumer is a Russian women from age 15 to 49, but the other hand Russian men
are buying new products when they like them thereby the price in some cases does not
matter. (Kann, 2005)
The huge gap between Russian and Estonian consumer comes from the price factor,
Estonians need the argument for purchaing the product. Although Russian speaking
consumer is eagerly testing and experimenting with new products, they are also very
loyal and principled. If they get disappointed with the brand then they usually stop
buying these brand products. The same with stores, if Russian speaking consumer is
used to shop in one store they would not easily change their shopping routine even if
another store is offering better prices. Basically Russian speaking consumer is also
more price sensitive than Estonian consumer, because the difference of the income.
Several Russian speaking persons do not speak fluent Estonian and therefore they are
working more in the filed where manual labour is needed, which means their income
is way below the average of Estonian salary limit, for example their consumption ex-
penditure is 12% smaller than Estonian consumers. (Kann, 2005)
Estonian consumer has also changed more price sensitive in the recession years, but
Estonian consumer is more and more purchasing conventional and familiar products.
Estonian consumer attitude has also changed more negative towards economy and
future. This change has made consumers more careful and aware what they are buy-
ing. As mentioned before Estonian consumers are not so open to new products as are
Russian consumers. One reason for this is the recession years and the change of
spending money more practically than ever. The price sensitivity has also increased
and Estonian consumer is looking for a better offer for similar product categories and
prefers the store and the brand that has the lowest price. This means Estonian consum-
er is not as loyal as a Russian consumer. (Koppel, 2011).

33
5.5 Future Trends
After the recession years Estonian economy had a big growth in 2011, but Bank of
Estonia prognoses a rapid slow down for 2012. A lot of the reasons is connected with
intense times in Europe economy and even the second wave of recession is possible if
the situation turns even worse. Analysts are optimistic about the year 2013. They be-
lieve 2012 allows again the economic situation to heal if the situations on macro level
start to improve. 2011 showed that the growth of retail businesses will be continuous,
but the figures of growth will be moderate. In several prognoses 2012 is considered to
be a steady year with small or no growth at all. The good thing is the employment rate
is expected to steadily increase, which means more liquid money in the market. The
second positive thing is the growth in wages, the analysts predict that wages will re-
sume to rise on the year 2013. (Bank of Estonia, 2011)
As the year 2011 showed that several low-price brands are interested from local mar-
ket –Tally Weijl opened their first store in 2011, and H&M is opening their first Baltic
store at Riga in the autumn 2012. The store opening in Riga is one step closer for
H&M launching its brand stores in Tallinn and Estonia. This is an indicator that even
gigantic clothing retailers are interested of this market. H&M entering is also one po-
tential risk factor for Madonna, because H&M is able to offer lower prices than no
other local business. H&M strength is wide product selection and a very known brand
name. In the other hand H&M launch in Estonian market would change local market
more flexible: makes corrections on businesses operating in the market; eliminates
small and weak businesses that cannot compete with offering similar selection and
price. It would be very welcome change for the Estonian consumer, as the selection
range would get broader and prices would go down. H&M will take the market share
from other low-priced brands and also from medium-priced brands. Believably H&M
could take approximately 5 to 8 % of Estonian Apparel retail market and even up to
10% later on when anchoring its reputation on Estonian market. H&M launching to
Estonian market will also decrease the prices of such medium price level brands such
as Zara. As known that Zara’s prices in Estonia are significantly higher than Zara’s
prices in Western Europe and one reason of this is the absence of competitors.

34
6. ANALYSIS OF THE RESULTS AND RECOMMENDA-
TIONS
This study was conducted to examine the Estonian clothing retail market from the
perspective of positioning the brand Madonna. Tallinn is the biggest city and the big-
gest market of Estonia which is observed more closely as the first store will be
launched in Tallinn’s market. The recommendations are based on the analysis.
The primary question was if there was a market for this kind of brand – a low-priced
youngster brand following latest trends. The answer to the question is quite simple
after analysing the latest year retailer behaviour and realising that almost 50% of the
low-priced brands opened their first brand stores within the last 3 years. Obviously,
there is a market for this kind of segment. The problem is that there are no vacant re-
tail areas. All the popular shopping centres are 100% fully booked, so renting a good
location is a matter of luck and existing popularity of your business, shopping centres
decide upon a brand name either they want this brand into their centres or not. The
waiting list for rental spaces is long, especially in the centre of Tallinn. Besides the
long queue the centres have the right to choose the renter as they have the right to de-
sign the layout and concept of the centre and therefore several brands with higher
popularity and bigger expected volumes of visitors are preferred. In general, an Esto-
nian consumer is looking for the alternatives for medium price level brands as they
have existed for quite long in the Estonian market.
The expected market share would be 0, 5% of the overall clothing retail market, which
means approximately a 0, 86 million Euros turnover per year. The majority of the
market share for Madonna comes from medium price level brands, and also from such
brands as Vero Moda, Terranova and New Yorker as Madonna’s closest price-wise
competitors. The gain of the calculated market share will be based on a good location
– a brand store operating in a popular shopping centre, and also a fresh selection as the
Estonian consumer is looking for alternatives and a lower price. This conclusion is

35
drawn as the market share of the lower-priced brands in Estonian clothing market
grew 12% in 2010, which is still considered the year of recovery from the recession
which is why the growth is a significantly good sign. The consumer volumes depend
on the location of the store. It is understandable that in the centre of Tallinn the vol-
umes are higher and in the suburban areas the number of consumers and visitors are a
bit lower, depending on the popularity of the shopping centre. As the Viru Centre, the
most visited shopping centre in Estonia then Madonna store in Viru can expect up to 1
million visitors per year and approximately 150 000 purchases per year. Madonna’s
store in Rocca Al Mare, as the biggest shopping centre in Tallinn can expect 50% of
Viru volumes, i.e. approximately 500 000 visitors and 75 000 purchases per year.
Following important topic is store location. There are several opportunities in Tallinn,
as 11 big shopping centres are situated all over the city. The determination of the loca-
tion is one of the most important steps in positioning and launching a new brand in
such a small market as Estonia. As analysed priorly in the thesis then several shopping
centres are excluded because of their image, like the Järve and Mustika centre as they
are more targeted to interior. The Viru centre needs to be excluded also, even though
the location is perfect then evaluating the possibilities to get a rental space at Viru is
close to zero. Next interesting location would be Solaris centre, locating also in the
heart of Tallinn just opposite the Estonian Opera Centre. Solaris is targeted to free-
time and younger audience. This option is interesting because there is already a signif-
icant amount of Madonna’s target audience spending their time in this centre. Launch-
ing would be much easier as the customer is already in the building. Negative side of
Solaris is the rental prices are high what is driven by the good location of the centre.
The prices of Solaris are approximately 50% higher than other popular shopping cen-
tres located in the suburban areas.
Centres like Kristiine, Rocca Al Mare and Ülemiste, which are the biggest and most
known suburban shopping centres in Tallinn and where the rental prices are still high,
but the potential consumer rate is also quite high reaching to approximately 18 000 to
20 000 visitors per day. As these shopping centres are well-known and locating out of
the centre which means they can offer lower rental prices as in central Tallinn and
through that minimise the risks as the expenses can be kept low. For this reason previ-

36
ously stated centres would be the potential locations where Madonna should open its
first brand store. As there are no vacant spaces of any of these shopping centres, it is
wise to already add a request for a space in all these centres which puts Madonna into
the renters list and then just wait when the first suitable space becomes free. Second-
ary options are not so popular centres what are located in suburban areas, like Magis-
trali, Norde and Lasnamäe Centrum. Magistrali would be the most interesting option
out of these three centres as it is currently being renovated and the image of the centre
will be renewed - more trend-concentrated than it was before. Otherwise these 3 op-
tions are more grocery stores with some additional stores offering shoes and clothing
and therefore the concept is not quite for Madonna. Lasnamäe Centre is quite interest-
ing place to target to Russian speaking consumers.
There is one significant risk in the future – H&M is also entering to the market in
coming years. H&M opens its first store in Riga in the autumn of 2012 and this means
the first opening in Tallinn is not that far. H&M is the biggest competitor for Madonna
as H&M price politics is at least 7-10% lower. As H&M could offer up to 10% lower
prices than currently in the market, H&M will probably get a 2 digit market share,
besides from medium priced brands, also from the existing low-price brands. It is im-
portant to anticipate H&M and open Madonna’s first brand store 6 months to one year
before H&M opening, because this is a minimum period to build audience awareness
and strengthen the brand image in the market.
Currently, Madonna’s competitors are Terranova, New Yorker, Tally Weijl, Reserved,
Bershka, Pull&Bear, Stradivarius etc. Quantity of the low-priced brands is still quite
low as compared with the amount of medium priced brands. Competitors are quite
strong as they have managed to establish their brand names and build an audience, but
Madonna has also been available earlier in Estonian market. Tallinna Kaubamaja was
the biggest reseller of the brand Madonna, but as they closed their youth department
lately which left Madonna out of the selection, because it did not fit among other
Women’s department clothing where the brand selection is more to high-end. There-
fore there is already a history for Madonna in Estonian market, which makes it easier
to launch and build consumer awareness. Believably this is a quite good strategy and

37
excellent starting point, as it can reduce money for presenting the brand and allows to
concentrate more to marketing the brand and regain its main audience attention.
One part of this research is based on facts that have been gathered from the data of
Staistics Estonia, such as sensus data, business data from businesses operating on cur-
rent field etc. This data has been gathered and analysed so this is quite reliable. The
facts have been suppored with the observation as this is the second method used in
this research. The data gathered from observation is alligned with the facts and this
shows that the methods used have been appropriate. Futher steps to continue the re-
search would be designing the questionnaire and executing consumer poll, to support
even more the outcomes. If to go even further and more scientific then the measure of
actual human reactions with all kind of neuropsychological instruments would give
some interesting answers to consumer preferences.

38
LIST OF REFERENCES
AG-Strategies, 2003. Market Research. Alberta - Agriculture, Food and Rural Devel-
opment. Accessed 10th
– 11th
January 2012
URL: www1.agric.gov.ab.ca/$department/deptdocs.nsf/all/agdex7222/$file/848-
6.pdf?OpenElement
Alasoo, K. 2006. Käsumajanduselt turumajandusele – Eesti võimalused ja valikud.
Article in K. Alasoo blog. Accessed 2nd
February 2012
URL: http://kauralasoo.net/category/ajalugu/
Arco Vara, 2011. Retail Spaces 2011 - 4th
quarter overview. Accessed 13th
February
2012. URL:
www.arcovara.ee/upload/turulevaated/EST/Kaubanduspinnad_IV_kvartal_2011.pdf
Apranga , 2012. Company’s Website. Accessed 20th
February 2012
URL: http://www.apranga.lt
Asrani, S. 2008. Primary and Secondary Data. Powerpoint Presentation. Accessed 12th
January 2012
URL: www.slideshare.net/gulsweet/primary-data-secondary-data-presentation
Baltic Business News, 18.06.2009, MPs approve plan to increase VAT rate to 20 pct
Accessed 2nd
February 2012 URL: http://bbn.ee/Default2.aspx?ArticleID=87f66124-
06d2-4a65-bc7b-49ccc6d69dfc
Bank of Estonia, 2011. Economical prognosis for 2011-2013. Accessed 29th
February
2012 URL:
www.eestipank.info/pub/et/dokumendid/publikatsioonid/seeriad/ylevaade/_2011_02/_
3_211.pdf?ok=1

39
Bershka, 2012. Bershka’s website and online store. Accessed 18th
January and 15th
February 2012 URL: www.bershka.com
City24, 11.01.2012. The two Tallinn centre of Citycon OY turnover increased 8, 4 and
41% in 2011. Real Estate portal. Accessed 13th
February 2012.
URL: www.city24.ee/206032/cityconi-kahe-tallinna-keskuse-kaibed-tousid-mullu-
8,4-ja-41-protsenti/est
Delfi majandus, 09.01.2012.The turnover of Ülemiste centre increased 10, 5% in
2011. Accessed 13th
February 2012. URL:
http://majandus.delfi.ee/news/tarbija/ulemiste-keskuse-poodide-kaive-kasvas-2011-
aastal-105-protsenti.d?id=63752612
Delfi, 21.03.2011. Tally Weijl avas esimese Eesti poe. Accessed 15th
February 2012
URL: http://noortehaal.delfi.ee/news/in/fotod-moebrand-tally-weijl-avas-esimese-
kaupluse-eestis.d?id=42453847
E24, 22.02.2011. Humana’s turnover increased 15%. Economy news. Accessed 1st
March 2012 URL: www.e24.ee/392725/humana-kaive-kasvas-mullu-15-protsenti/
Esse, F.-E., 1.12.2011. Baltika novembrikuu müük annab lootust. Äripäev. Accessed
8th
February 2012
URL: http://www.ap3.ee/Default.aspx?PublicationId=aca24a96-3d81-4ed8-a621-
42fb93898418
Esse, F.-E., 5.03.2012. Kes tõi investorile naeratuse näole? Äripäev. Accessed 5th
March 2012
URL: www.ap3.ee/article/2012/3/5/kes-toi-investorile-naeratuse-naole
Eurofund – European Industrial Relation Observatory on-line, 2010. Salaries continue
to decline. Accessed 3rd
February 2012
URL: www.eurofound.europa.eu/eiro/2010/06/articles/ee1006019i.htm

40
Femme.ee, 17.02.2009. Spanish chain-store Stradivarius comes to Estonia. Fashion
portal. Accessed 15th
February 2012.
URL: http://www.femme.ee/moekas/stiilivihjed/5234
Hill, D., 2003. Body of the Truth: Leveraging What Customers Can’t or Won’t Say.
1st Edition. John Wiley & Sons, Inc. Hoboken, New Jersey
H&M, 2012. Company’s website and online store. Accessed 5th
and 18th
January and
7th
, 15th
February 2012. URL: www.hm.com/de/
H&M Facebook fan page, 13.02.2012 post. Accessed 13th
and 20th
February 2012
URL: https://www.facebook.com/hm
Kald, I., 12.01.2012. Viru centre turnover increased 10%. Äripäev. Accessed 13th
Feb-
ruary 2012.
URL: www.ap3.ee/?PublicationId=77037af6-d5f4-4a8e-a84b-76fdb41c091b&ref=rss
Kann, E.-L., 22.11.2005. Venelane ostab hea meelega reklaamitud tooteid. Äripäev.
Accessed 5th March 2012
URL: http://leht.aripaev.ee/?PublicationId=464dc490-fb94-4024-9b75-
258ddc8543a9&articleid=1002&paperid=EB568290-3B5E-4C94-9B07-
F813667F73E5
Kennaugh, C., 2003. Discover the Importance of Target Audience Profiling. Accessed
3rd
January 2012
URL: http://office.microsoft.com/en-us/powerpoint-help/discover-the-importance-of-
target-audience-profiling-HA001141467.aspx
Koppel, K., 22.11.2011. Eestlased eelistavad osta tuttavaks saanud kaupa. Estonian
Traders Association. Accessed 5th March 2012
URL: www.kaupmeesteliit.ee/et/uudised-2012/uudised-2011/2097-eestlased-
eelistavad-osta-tuttavaks-saanud-kaupu

41
Kose, K. and Leppik, K., 2009. Eesti majandus 2010 (Estonian Economy 2010). Tark
Investor. Accessed 3rd
February 2012
URL: www.tarkinvestor.ee/files/Eesti%20majandus%202010.pdf
Kurtz, D. L., 2008. Contemporary Marketing. 13th
Ed. Mason (Ohio): Thomson
South-Western
Laar, M. August 7, 2007, "The Estonian Economic Miracle", Backgrounder On
“Worldwide Freedom and Human Rights and Human Rights” (The Heritage Founda-
tion), Accessed 2nd
February 2012
URL: www.heritage.org/Research/WorldwideFreedom/bg2060.cfm
Lindstrom, M., 2008. Buyology: Truth and Lies Why We Buy. New York, Doubleday
Madonna, 2011. About the Company. Company’s website. Accessed 2nd
-4th
January
2012 URL: www.madonna.eu/company.php
McQuarrie, E., 2006. The market Research Toolbox. 2nd
Edition. Sage Publications
Merriam-Webster, An online Encyclopedia. Accessed 2nd
February 2012
URL: www.merriam-webster.com/dictionary/colorfast
Missouri Families, 2012. Material Matters; Quick Answers: What is Pilling?
Accessed 2nd
February 2012
URL: http://missourifamilies.org/quick/materialqa/material13.htm
New Look, 2012. Company’s website and online store. Accessed 18th
January 2012
URL: www.newlook.com
Pull&Bear, 2012. Company’s webpage about the history. Accessed 15th
February
2012, URL:
www.pullandbear.com/webapp/wcs/stores/servlet/category/pullandbearde/en/pullandb
ear/205501

42
77onlineshop, 2012. Accessed 5th
, 18th January and 2nd
February 2012, URL:
www.77onlineshop.de
Statistics Estonia 2012. Statistical information about Estonia. Accessed 12th
January,
3rd
– 29th
February and 5th
March 2012 URL: www.stat.ee/en
The Guardian 14-09-2009.French President seeks alternatives to GDP, European Par-
liament, Policy Department Economic and Scientific Policy: Beyond GDP Study Ac-
cessed 2nd
February 2012
URL: http://www.guardian.co.uk/business/2009/sep/14/sarkozy-attacks-gdp-focus
Trout, J., (1969) ""Positioning" is a game people play in today’s me-too market
place", Industrial Marketing, Vol.54, No.6, (June 1969), pp. 51–55.
Underhill, P. 2006. Why We Buy: The Science of Shopping. New York, Simon &
Schuster
Trubetskoi, M., 31.05.2011. Eesti Kinnisvaraturu ülevaade kvartal I. DTZ Kinnis-
varaekspert. Accessed 3rd
and 13th
February 2012 URL:
www.bpe.ee/File/Eesti_kinnisvaraturu_yevaade_Ikv_2011.pdf
Wer zu wem – Firmenverzeichnis, 2012, website. Accessed 6th
January 2012
URL: www.wer-zu-wem.de/firma/madonna.html
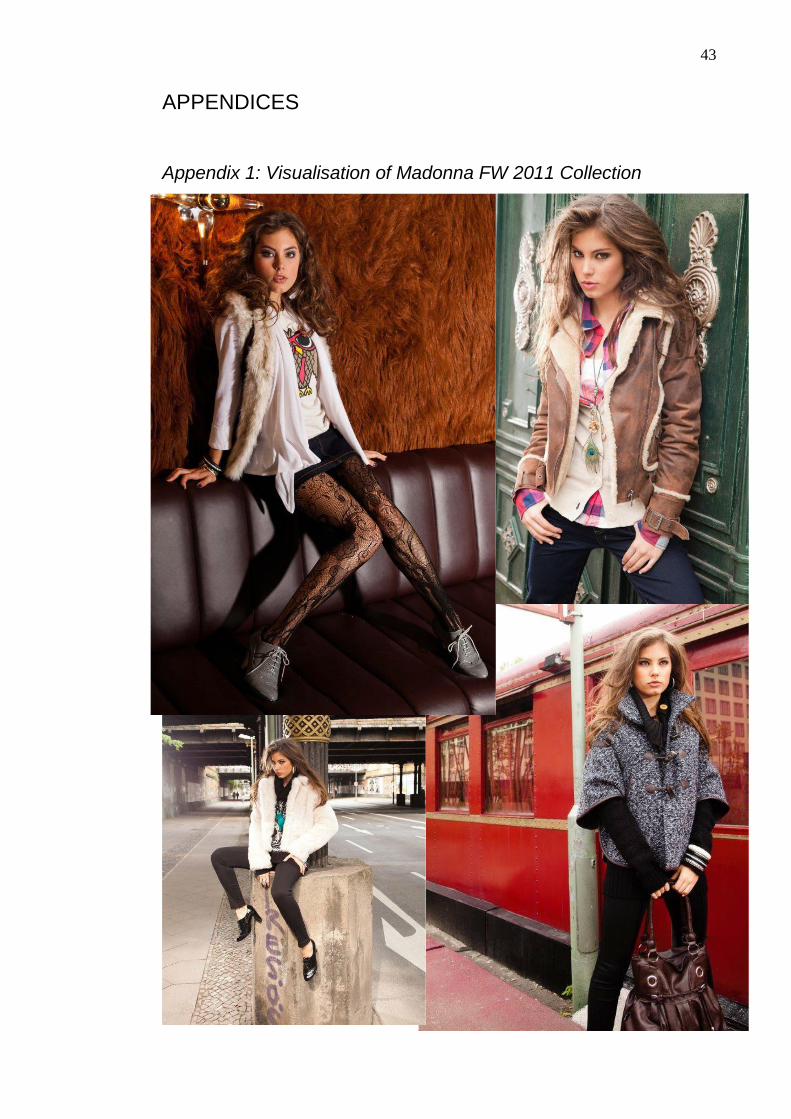
43
APPENDICES
Appendix 1: Visualisation of Madonna FW 2011 Collection

44
Appendix 2: Price comparison
0,005,00
10,0015,0020,00
25,0030,0035,0040,0045,00
T-sh
irt
Ls.T
unic B
lous
e
Knitw
ear
Dre
ss
Legg
ings
Jean
s
Trou
sers
Madonna
HM
Bershka
New Look
Price comparison through product categories between Madonna and its competitors:
H&M, Bershka and New Look. Prices are displayed in Euros
(77onlineshop, 2012; H&M, 2012; Bershka, 2012; New Look, 2012)
Average Difference from Madonna's price level
7,08%
-7,73%
0,07%
-10,00%
-8,00%
-6,00%
-4,00%
-2,00%
0,00%
2,00%
4,00%
6,00%
8,00%
H&M Bershka New Look
Average difference from Madonna’s price level, average taken from the prices of
product groups on previous Figure. (77onlineshop, 2012; H&M, 2012; Bershka, 2012;
New Look, 2012)

45
Appendix 3: Estonian GDP
The growth of Estonian GDP from 2000 to 2011* (2011 is prognosis) (Statistics Esto-
nia, 2011)
Estonian GDP
Services; 67%
Industry; 28%
Agriculture;
5,50%
The distribution of Estonian GDP (Statistics Estonia, 2011)

46
Appendix 4: Average gross wages
Percentage change in average monthly gross wages compared to the situation one year
earlier, 2007–2010 (Statistics Estonia, 2011)
Average salary in Estonia 1999-2011
819792
784825
725601
516466
430314
284284
0 200 400 600 800 1000
2011 2010 2009 2008 2007 2006 2005 2004 2003
2001 2000 1999
Monthly average salary from 1999 to 2011* (first 3 quarters) in Euros (Statistics Es-
tonia, 2011)

47
Appendix 5: Retail venues
The number of retail venues
28053168
3564
45234135 3989
47535366 5615
6198 6293 61506534
0
1000
2000
3000
4000
5000
6000
7000
1992 1993 1994 1995 1996 1997 1998 1999 2000 2002 2004 2006 2008
The growth of Estonian retail venues from 1992 to 2008 (Statistics Estonia, 2011)
Average size of retail venues
100 99 100 95 102 113 110122
133159 171
202213
0
50
100
150
200
250
1992 1993 1994 1995 1996 1997 1998 1999 2000 2002 2004 2006 2008
The growth of the average square meters per venue from 1992 to 2008 (Statistics Es-
tonia, 2011)

48
Appendix 6: Sales profit
91549
121095
144855152979
126715
8633 16751 23894
993
-4840-20000
0
20000
40000
60000
80000
100000
120000
140000
160000
180000
2005 2006 2007 2008 2009
Sales profit Net income
Sales profits compared to net profits from 2005 to 2009, thousand Euros (Statistics
Estonia, 2011)
Sales profit (million €)
0,00
5,00
10,00
15,00
20,00
25,00
30,00
Janu
ary
Febru
ary
Mar
chApr
ilM
ayJu
neJu
ly
Augus
t
Septe
mbe
r
Oct
ober
Nov
embe
r
Dec
embe
r
2000
2001
2002
2003
2004
2005
2006
2007
2008
Sales profit through months from 2000 to 2008, million Euros. (Statistics Estonia,
2011)

49
Appendix 7: the Map of the Main Locations of Tallinn’s Retail Venues
1 – Viru; 2 – Rocca Al Mare; 3 – Mustika; 4 – Magistrali; 5 – Järve; 6 – Kristiine; 7 – Norde Centrum; 8 – Sikupilli; 9 – Ülemiste; 10 –
Vesse area (building and interior); 11 – Lasnamäe Centrum; 12 – Tähesaju City (Trubetskoi, 2011)

50
Appendix 8: Turnover Calculation Based on the Observation
Visitors of low-price brand stores
Viru Kristiine Rocca Terranova Terranova New Yorker
Weekend
Date Friday
25.11.11 Friday
18.11.11 Friday 4.11.11
Time 14:45-15:45 13:26-14:26 12:28-13:28
Enterers 201 141 109
Buyers 37 16 19
Workday
Date Thurs.
24.11.11 Wed. 9.11.11 Monday 14.11.11
Time 14:19-15:19 16:04-17:04 12:49-13:49
Enterers 149 129 75
Buyers 21 13 13
Visitors of medium-price brand stores
Viru Kristiine Rocca Mohito Vero Moda Mango
Weekend
Date Friday 27.10. Friday 18.11. Friday 4.11.
Time 15:13-16:13 11:32-12:32 11:25-12:25
Enterers 165 40 73
Buyers 11 1 16
Workday
Date Tuesday
8.11. Thursday 3.11. Monday 14.11.
Time 13:01-14:01 13:40-14:40 11:47-12:47
Enterers 109 62 31
Buyers 3 3 2
Visitors of high-price brand stores
Viru Kristiine Rocca Pepe Jean Denim Dream Vive Maria
Weekend
Date Friday 27.10. Friday 18.11. Friday 4.11.
Time 14:09-15:09 13:26-14:26 12:28-13:28
Enterers 44 47 17
Buyers 1 1 0
Workday
Date Tuesday
8.11. Wed. 9.11 Monday 14.11.
Time 14:05-15:05 16:04-17:04 12:49-13:49
Enterers 31 41 9
Buyers 0 2 0

51
Low-Priced Brands Turnover Calculation:
VIRU (based on Terranova sales):
Mon-Thu 21 buyers per hour
Fri-Sun 37 buyers per hour
Total 11 136 buyers per month
Average purchase* 20 Euros
Average turnover 222 720 Euros/month
Net turnover 178 176 Euros/month
Net turnover 2 138 112 Euros/year
ROCCA AL MARE (based on New Yorker sales):
Mon-Thu 13 buyers per hour
Fri-Sun 19 buyers per hour
Total 6 144 buyers per month
Average purchase* 20 Euros
Average turnover 122 880 Euros/month
Net turnover 98 304 Euros/month
Net turnover 1 069 056 Euros/year
KRISTIINE (based on Terranova sales):
Mon-Thu 13 buyers per hour
Fri-Sun 16 buyers per hour
Total 5 568 buyers per month
Average purchase* 20 Euros
Average turnover 111 360 Euros/month
Net turnover 89 088 Euros/month
Net turnover 1 179 648 Euros/year
*Average purchase is calculated on the example of Rocca Al Mare New Yorker store.
Company’s 2010 Turno-ver
Company's Av-erage monthly Turnover 2010
Stores in Estonia
Average monthly turnover per store
Average buyers per month
8 800 000 733 333 6 1 912 362 6 144
Average purchase = Average monthly turnover per store / Average buyers per month
Average purchase = 1 912 362 Euros/6 144 purchases = 20 Euros per purchase

52
Appendix 9: Market Share Calculation of Low-Price Level Brands
Total Estonian Apparel Market turnover in 2009: 161 million Euros
Total Estonian Apparel Market turnover in 2010: 172 million Euros
LPP* NEW
YORKER APRANGA** TERRANOVA HUMANA
Turnover
2009 4,6 7,5 10,44 6,39 5,74
2010 7,8 8,8 10,48 7,67 6,6
GROWTH 69,6% 17,3% 0,3% 20,0% 15,0%
Market Share (MS)
2009 2,86 4,66 6,48 3,97 3,56
2010 4,53 5,12 6,09 4,46 3,84
GROWTH 58,6% 9,8% -6,1% 12,3% 7,6%
MS exp Humana
2009 17,97
2010 20,20
GROWTH 12,4%
*LPP Retail Estonia operates with brands Reserved, Croppdown, House
**Apranga Group operates with brands Zara, Stradivarius, Pull&Bear, Bershka and
Mango

53
Appendix 10: Efficiency Calculations on the Example of New York-er
New Yorker 2010
Stores 6
Average store m2 767 m2
Year Month Hour
Turnover 8 800 000,0 733 333 2 037
Turnover per store 1 466 667 122 222 340
Average purchase 20 €
Purchases 73 333 6 111 17
Average m2 productivity/€ 1 913 159 0,44
Madonna
Stores 1
Average store m2 400 m2
Year Month Hour
Turnover 860 000,0 71 667 199
Turnover per store 860 000,0 71 667 199
Average purchase 20 €
Purchases 43 000 3 583 10
Average m2 productivity/€ 2 150 179 0,50
Recommended


