
10.1101/gr.1687304Access the most recent version at doi: 2004 14: 478-490Genome Res.
Matthew L. Rise, Kristian R. von Schalburg, Gordon D. Brown, et al. CharacteristicscDNA Microarray: Data Mining and Interspecific Hybridization Development and Application of a Salmonid EST Database and
References
http://genome.cshlp.org/content/14/3/478.full.html#related-urlsArticle cited in:
http://genome.cshlp.org/content/14/3/478.full.html#ref-list-1This article cites 39 articles, 13 of which can be accessed free at:
serviceEmail alerting
click heretop right corner of the article orReceive free email alerts when new articles cite this article - sign up in the box at the
http://genome.cshlp.org/subscriptions go to: Genome ResearchTo subscribe to
Cold Spring Harbor Laboratory Press
Cold Spring Harbor Laboratory Press on July 13, 2011 - Published by genome.cshlp.orgDownloaded from
Development and Application of a Salmonid ESTDatabase and cDNA Microarray: Data Miningand Interspecific Hybridization CharacteristicsMatthew L. Rise,1 Kristian R. von Schalburg,1 Gordon D. Brown,1 Melanie A. Mawer,1
Robert H. Devlin,3 Nathanael Kuipers,1 Maura Busby,1 Marianne Beetz-Sargent,1
Roberto Alberto,1 A. Ross Gibbs,1 Peter Hunt,1 Robert Shukin,4 Jeffrey A. Zeznik,4
Colleen Nelson,4 Simon R.M. Jones,5 Duane E. Smailus,6 Steven J.M. Jones,6
Jacqueline E. Schein,6 Marco A. Marra,6 Yaron S.N. Butterfield,6 Jeff M. Stott,6
Siemon H.S. Ng,2 William S. Davidson,2 and Ben F. Koop1,71Centre for Biomedical Research, University of Victoria, Victoria, British Columbia V8W 3N5 Canada; 2Department of MolecularBiology and Biochemistry, Simon Fraser University, Burnaby, British Columbia V5A 1S6 Canada; 3Aquaculture Division, Fisheriesand Oceans Canada, West Vancouver, British Columbia V7V 1N6 Canada; 4Array Facility, Prostate Centre, Vancouver GeneralHospital, Vancouver, British Columbia V6H 3Z6 Canada; 5Pacific Biological Station, Fisheries and Oceans Canada, Nanaimo,British Columbia V9T 6N7 Canada; 6Genome Sciences Centre, BC Cancer Agency, Vancouver, British Columbia V5Z 4E6 Canada
We report 80,388 ESTs from 23 Atlantic salmon (Salmo salar) cDNA libraries (61,819 ESTs), 6 rainbow trout(Oncorhynchus mykiss) cDNA libraries (14,544 ESTs), 2 chinook salmon (Oncorhynchus tshawytscha) cDNA libraries (1317ESTs), 2 sockeye salmon (Oncorhynchus nerka) cDNA libraries (1243 ESTs), and 2 lake whitefish (Coregonus clupeaformis)cDNA libraries (1465 ESTs). The majority of these are 3� sequences, allowing discrimination between paralogs arisingfrom a recent genome duplication in the salmonid lineage. Sequence assembly reveals 28,710 different S. salar, 8981 O.mykiss, 1085 O. tshawytscha, 520 O. nerka, and 1176 C. clupeaformis putative transcripts. We annotate the submitted portionof our EST database by molecular function. Higher- and lower-molecular-weight fractions of libraries are shown tocontain distinct gene sets, and higher rates of gene discovery are associated with higher-molecular weight libraries.Pyloric caecum library group annotations indicate this organ may function in redox control and as a barrier againstsystemic uptake of xenobiotics. A microarray is described, containing 7356 salmonid elements representing 3557different cDNAs. Analyses of cross-species hybridizations to this cDNA microarray indicate that this resource maybe used for studies involving all salmonids.
[Supplemental material is available online at http://web.uvic.ca/cbr/grasp. The sequence data from this study havebeen submitted to GenBank dbEST under accession nos.: Salmo salar, BU965588–BU965906, CA036414–CA039704,CA039711–CA064598, CA767613–CA770910, and CB498694–CB518126; Oncorhynchus mykiss, CB485850–CB498693;Oncorhynchus tshawytscha, CB484816–CB485849; Oncorhynchus nerka, CD510521–CD511184; and Coregonus clupeaformis,CB483540–CB484653. The following individuals kindly provided reagents, samples, or unpublished information asindicated in the paper: C. Biagi, S. Dann, S. Temple, and R. Roper stimulated the S. salar head kidney cells used tocreate one cDNA library group.]
Gene and genome duplications are thought to be primarymechanisms of increasing the number of coding sequences sub-ject to selection, leading to new proteins, morphogenic varia-tions, and phenotypes (Ohno 1970; Holland et al. 1994; Sidow1996). Members of the teleost family Salmonidae, includingsalmon, trout, char, grayling, and whitefish, all diverged from acommon ancestor that is believed to have undergone a tetra-ploidization event 25 to 100 million years ago, after the teleostradiation (Allendorf and Thorgaard 1984). This relatively recentputative genome duplication in the salmonid lineage is sup-ported by karyological and genome size data. Members of thefamily Clupeidae (e.g., herring, alewife), thought to maintain the
ancestral diploid status, have 48 to 52 mostly acrocentric chro-mosomes per 2N cell and genome sizes of 0.8 to 1.4 pg/N,whereas salmonids have 52 to 102 chromosomes per 2N cell(over half metacentric or submetacentric) and genome sizes of1.9 to 3.8 pg/N (Ohno et al. 1968; Phillips and Ráb 2001; Gregory2002). Because extant salmonids exhibit quadrivalents in meiosis(primarily in males; Ohno et al. 1965; Allendorf and Thorgaard1984) and disomic and tetrasomic inheritance at different loci(Allendorf and Danzmann 1997), they appear to be in the processof re-establishing diploidy. Remarkably, ∼50% of examined sal-monid loci persist as functional duplicates (Bailey et al. 1978).Research on salmonid genomes will shed light on poorly under-stood evolutionary phenomena such as genome duplication andduplicate gene silencing.
In addition to their scientific importance as recent tetra-ploids, salmonids also serve as prominent models for studies in-
7Corresponding author.E-MAIL [email protected]; FAX (250) 472-4075.Article and publication are at http://www.genome.org/cgi/doi/10.1101/gr.1687304. Article published online before print in February 2004.
Resource
478 Genome Research 14:478–490 ©2004 by Cold Spring Harbor Laboratory Press ISSN 1088-9051/04; www.genome.orgwww.genome.org
Cold Spring Harbor Laboratory Press on July 13, 2011 - Published by genome.cshlp.orgDownloaded from

volving environmental toxicology (Katchamart et al. 2002), car-cinogenesis (Bailey et al. 1996), comparative immunology (Shumet al. 2001), and the molecular genetics and physiology of thestress response (Basu et al. 2002), olfaction (Zhang et al. 2001),vision (Faillace et al. 2002), osmoregulation (Tipsmarck et al.2002), growth (Devlin et al. 2001), and gametogenesis (Madigouet al. 2002). Furthermore, Atlantic salmon (AS; Salmo salar) are ofparticular importance to the global aquaculture industry. GRASP(Genomics Research on Atlantic Salmon Project), an initiativefunded by Genome Canada, is intended to improve understand-ing of physiological and evolutionary processes influencing thesurvival and phenotype of salmonids and other fish in naturaland aquaculture environments. GRASP has developed genomicsresources to help achieve these goals. There is a rich literature insalmonid genetics, physiology, and ecology to support these ge-nomics research tools.
A previously reported S. salar EST project surveyed 1152 ESTsfrom six cDNA libraries, with 510 BLAST-identified sequencesrepresenting 178 salmon genes (Davey et al. 2001). There arecurrently (August 2003) ∼60,000 S. salar nucleotide sequences inGenBank, of which >51,000 were submitted by GRASP. In addi-tion to forming an EST database containing >80,000 sequencesfrom five salmonid species, GRASP has built a microarray from3557 unique salmonid cDNAs. Initial cross-species testing of thismicroarray has shown it to be effective in hybridizations withsalmon, trout, and whitefish targets.
RESULTS AND DISCUSSION
EST SurveyThis report describes ESTs obtained from high-complexity nor-malized and non-normalized, directionally cloned cDNA librar-ies, as well as subtracted cDNA libraries, from the following spe-cies: S. salar (23 libraries/library groups representing 16 adult tis-sues and whole juvenile), O. mykiss (six libraries/library groupsfrom three adult tissues, and whole embryo and juvenile), O.tshawytscha (two libraries from adult mixed tissue), O. nerka (twolibraries from adult brain and whole juvenile), and C. clupeafor-mis (two libraries from adult brain; see Table 2 below). The set ofS. salar cDNA libraries represents most principal tissues in adultfish. EST clones are available from the corresponding author.
The 95,320 clones from these cDNA libraries (71,144 S. salar,19,093 O. mykiss, 1824 O. tshawytscha, 1051 O. nerka, and 2208 C.clupeaformis) were M13 forward-sequenced and quality checked.For all libraries except SSH (suppression subtractive hybridiza-tion), M13 forward sequences of properly oriented inserts shouldinclude 3� UTR. Because of low conservation in 3� UTRs and thepseudotetraploidy of salmonid genomes, we focused on 3� se-quencing to allow differentiation between paralogs arising fromthe recent salmonid genome duplication. 5� (reverse) sequencingwas attempted on 7487 of the 71,144 S. salar clones. The 80,388high-quality ESTs (55,082 forward and 6737 reverse S. salar,14,544 forward O. mykiss, 1317 forward O. tshawytscha, 1243 for-ward O. nerka, and 1465 forward C. clupeaformis) were assembledby using PHRAP under high stringency to identify EST clusters(contiguous sequences, or contigs) representing redundant tran-scripts (Tables 1, 2). The average trimmed PHRED20 length ofthese ESTs is 546 bases. The 61,819 S. salar ESTs were assembledinto 11,560 contigs (with 17,150 singletons remaining), 14,544O. mykiss ESTs formed 2370 contigs (6611 singletons), 1317 O.tshawytscha ESTs formed 136 contigs (949 singletons), 1243 O.nerka ESTs formed 291 contigs (229 singletons), and 1465 C. clu-peaformis ESTs formed 138 contigs (1038 singletons; Table 1).There are 28,710 assembled S. salar sequences (putative tran-scripts), 8981 O. mykiss putative transcripts, 1085 O. tshawytschaputative transcripts, 520 O. nerka putative transcripts, and 1176
C. clupeaformis putative transcripts (Table 1). Results of alternateassemblies (CAP3 and stackPACK) of this EST collection are avail-able at http://web.uvic.ca/cbr/grasp. The largest S. salar contigcontains 252 ESTs (prolactin); the largest O. mykiss contig is size93 (parvalbumen �); the largest O. tshawytscha contig is size 10(cytochrome c oxidase subunit II); the largest O. nerka contig issize 21 (similar to ribosomal protein L41); and the largest C.clupeaformis contig is size 28 (ependymin; Table 1). BLAST align-ments of ESTs against combined ribosomal and mitochondrialsequence databases (see Methods) identified 1052 S. salar, 396 O.mykiss, 103 O. tshawytscha, 40 O. nerka, and 157 C. clupeaformisreads.
Preliminary analysis of aligned S. salar and O. mykiss as-sembled ESTs identifies 1892 sequence pairs with >80% identity(see Methods). Of these, 1429 (∼76%) were contained within adistinct peak from 90%–97% identity (average ∼94%) at thenucleotide level. As it is difficult to distinguish orthologs fromsequence pairs related by paralogy resulting from gene or genomeduplications, a more focused study is underway.
REPuter (Kurtz et. al. 2001) identifies 11.9% of the totallength of assembled sequences (TLAS) as known classes of re-peats; 6.7% of the TLAS is composed of SINEs (predominatelyHpaI), whereas satellites, pseudogenes (including a large numberof transposable element-associated sequences), and transposableelements account for 3.4%, 1.1%, and 0.7% of the TLAS, respec-tively.
Library Complexity and Gene DiscoveryBy using the March 3, 2003, versions of our EST database andGenBank databases, each library’s ESTs were BLASTN- andBLASTX-aligned against a database composed of all nonredun-dant nucleic and amino acid sequences from that species in Gen-Bank plus our collection of nonredundant ESTs. Percentage ofsingleton values for each library were calculated by using theAugust 25, 2003, version of the GRASP database (Table 2). Higher“percent new,” higher “percent no significant BLAST hit,” andhigher “percent singleton” values indicate higher rates of genediscovery and higher complexity in a given library. For several ofour libraries, higher- and lower-molecular-weight (MW) fractionswere cloned separately. By using all three metrics, higher-MWfractions are of higher complexity (and higher rates of new geneidentification) than their corresponding lower-MW fractions(Table 2). For example, the lower-MW S. salar head kidney library(average insert size of 1031 bp) has values of 15.0% new, 12.7%no BLAST hit, and 12.0% singletons, whereas the correspondinghigher-MW library (average insert size of 2307 bp) values are38.2%, 38.4%, and 35.3% respectively (Table 2). In addition, dif-ferent suites of genes are identified in lower- and higher-MWfractions of a single cDNA library. This qualitative difference isevident in a list of the largest EST clusters in select non-normalized libraries/library groups (Table 3). Excluding ribo-somal and mitochondrial clusters, the most abundant transcriptsin the S. salar pyloric caecum lower-MW library are apolipopro-tein A-I (2 forms of the gene in separate EST clusters), apolipo-protein E, 28 kD � 1e apolipoprotein, and galectin, whereas thelargest EST contigs in the associated higher-MW library are sele-noprotein Pa, MHC class I heavy chain, meprin A �, an un-known, and type II keratin E2, (Table 3). Likewise, in the headkidney, different sets of highly prevalent transcripts are seen inlower- and higher-MW library groups (Table 3). These results in-dicate that the preparation and characterization of higher-MWfractions of cDNA libraries improved the rate of gene discovery inthe GRASP EST project.
Insert orientation in various types of cDNA library was ana-lyzed to determine its potential influence on gene discovery
Salmonid ESTs and Cross-Species cDNA Microarray
Genome Research 479www.genome.org
Cold Spring Harbor Laboratory Press on July 13, 2011 - Published by genome.cshlp.orgDownloaded from

rates. All libraries in this database were classified by type (i.e.normalized, subtracted), and insert orientations in two librariesfrom each class were determined (see Supplemental table athttp://web.uvic.ca/cbr/grasp for data, method, and discussion ofbias). Incidences of reverse-oriented inserts were as follows: 4.5%in non-normalized, nonfractionated libraries (average of twoanalyzed libraries’ values); 29% in non-normalized, higher-MWlibraries; 20% in non-normalized, lower-MW libraries; 10% innormalized libraries; and 71.5% in subtracted (randomly cloned)libraries. The weighted average across all four directionallycloned library types (contributing 84.9% of the ESTs in the da-tabase) is 9.1% reverse orientation. M13 forward-read ESTs fromreverse-oriented inserts give 5� sequence.
The somewhat higher incidence of reverse-oriented insertsin higher-MW fraction libraries might contribute to the higher“% new” and “% singleton” values of these libraries over theirlower-MW counterparts in our database (Table 2). However, in-sert orientation differences between library classes do not explainthe dramatically higher “% no BLAST hit” values seen in higher-MW libraries (Table 2). Because most EST projects contributing toGenBank databases are biased toward 5� sequencing, the higher“% no BLAST hit” values of our higher-MW libraries are likelyconservative indices of the elevated rates of gene discovery asso-ciated with these libraries.
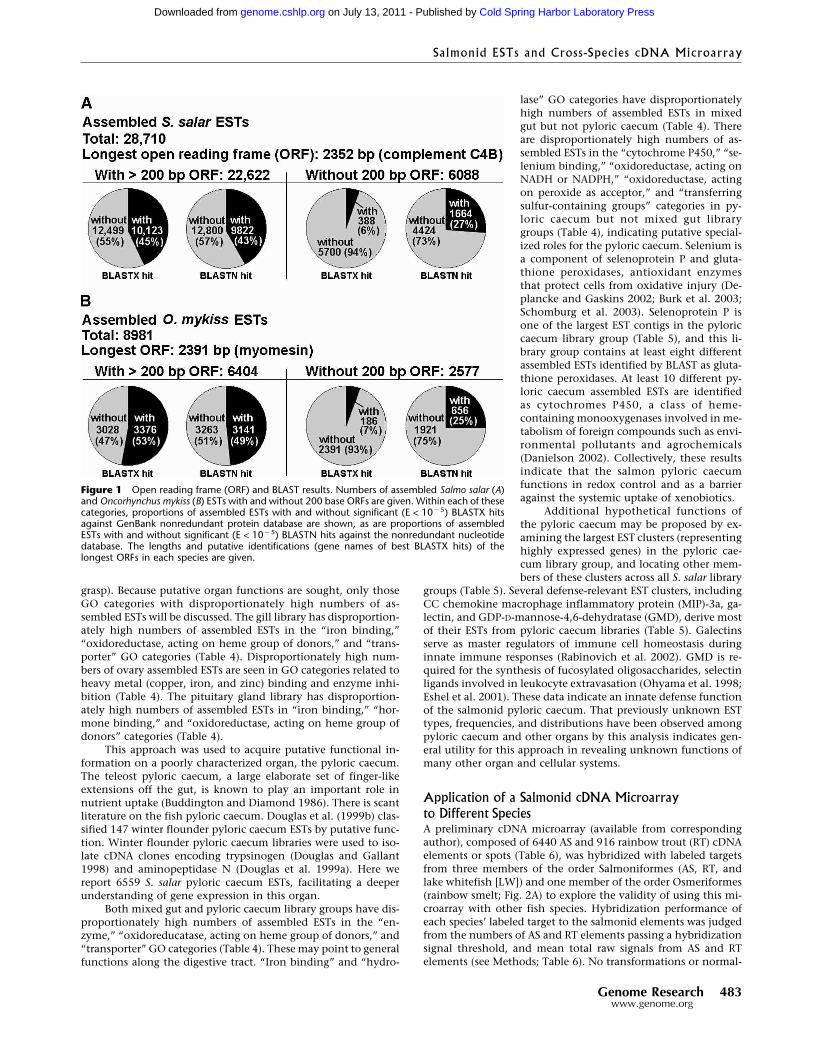
Assembled S. salar and O. mykiss ESTs were checked for openreading frames (ORFs) >200 bp (Fig. 1A). The chance of a random66 codon (198 bp) ORF is (61/64)66 = 0.04206 (P < 0.05). Most ofour ESTs are 3� reads. The average observed 3� UTR in this data-base is 264 bases (60 3� ESTs considered; range, 59 to 592 bases),
and average trimmed EST lengths are 484 to 563 bases (Table 1).Therefore, we believe that screening for 200-bp ORFs allows foradequate evaluation of the coding portion of the ESTs withoutexcessive bias against genes with longer 3� UTRs.
Of the 28,710 assembled S. salar sequences, 22,622 (79%)have ORFs >200 bp (Fig. 1A). Of these, 10,123 (45%) have sig-nificant (E < 10�5) BLASTX hits, and 9822 (43%) have significant(E < 10�5) BLASTN hits (Fig. 1A). Novel salmonid genes may beincluded in the 12,499 assembled ESTs containing 200-bp ORFsbut without BLASTX matches (Fig. 1A). Of the 6088 assembled S.salar ESTs without 200-bp ORFs, 388 (6%) have significantBLASTX hits (likely representing cDNAs coding for short pro-teins) and 1664 (27%) have significant BLASTN hits (likely rep-resenting cDNAs for short proteins as well as previously identi-fied salmonid intronic and untranslated sequences; Fig. 1A). The4424 assembled S. salar ESTs having neither 200-bp ORFs norBLASTN hits (Fig. 1A) probably include novel salmonid cDNAswith long 3� UTRs. The ORF and BLAST results for O. mykissassembled sequences are very similar to those for S. salar (Fig. 1B).
Using Functional Annotation to Infer PutativeOrgan FunctionsThe gene ontology (GO) statistics presented in this report reflectthe state of our database on March 3, 2003. For the collective S.salar libraries, and for each S. salar library group, assembled ESTswere assigned putative molecular functions based on BLASTXsimilarity to functionally annotated human protein sequences(Gene Ontology Consortium 2001).
Table 1. Salmonid EST Project Summary Statisticsa
Atlanticsalmonb
Rainbowtroutc
Chinooksalmond
Sockeyesalmone
Lakewhitefishf
Number of good sequencesg 61,819h 14,544 1317 1243 1465Average trimmed EST length (bp)i 563 484 492 456 486Number of contigsj 11,560 2370 136 291 138Number of singletons 17,150 6611 949 229 1038Number of putative transcripts 28,710 8981 1085 520 1176Max. assembled sequence size (no. of ESTs) 252 93 10 21 28Average assembled sequence size (no. of ESTs) 2.15 1.61 1.21 2.39 1.24Number of assembled ESTs withk
Significant BLASTX hits 10,511 3562 239 337 253Significant BLASTN hits 13,459 4337 462 331 466No significant BLAST hits 11,802 3667 566 118 663
Percentage with no significant BLAST hitsk 41.1 40.8 52.2 22.7 56.4Number of contigs containingi
2 ESTs 5606 1360 90 108 973 ESTs 2322 454 26 96 214–5 ESTs 2030 350 12 48 96–10 ESTs 1149 145 8 32 811–20 ESTs 331 41 0 6 121–30 ESTs 67 12 0 1 231–50 ESTs 36 4 0 0 0>50 ESTs 19 4 0 0 0
aAssembled from the March 3, 2003, version of the GRASP EST database using PHRAP. Results of CAP3 and stackPACK assemblies of the March 3,2003 GRASP EST database are available at http://web.uvic.ca/cbr/graspbSalmo salarcOncorhynchus mykissdOncorhynchus tshawytschaeOncorhynchus nerkafCoregonus clupeaformisgA sequence is considered “good” if its trimmed PHRED20 length is at least 100 bases.hIncludes 55.082 good forward (3�) and 6737 good reverse (5�) reads. Of 5606 good reverse reads from clones with good forward reads, 2268overlap/cluster with the corresponding forward reads.iVector, low-quality, and contaminating bacterial sequences are trimmed.jA contig (contiguous sequence) contains two or more ESTs.kThreshold for BLASTN and BLASTX significance: 10�5
Rise et al.
480 Genome Researchwww.genome.org
Cold Spring Harbor Laboratory Press on July 13, 2011 - Published by genome.cshlp.orgDownloaded from

To illustrate ways in which this salmonid EST database maybe mined for information on putative organ functions, we fo-cused on a selection of S. salar organ-specific library groups: gill,mixed gut (stomach + mid-gut + hind-gut, not including pyloriccaecum), ovary, pyloric caecum, and pituitary gland (Table 4).Overall, 26% of S. salar assembled ESTs matched sequences in theGO database (Table 4). For organ-specific libraries or library
groups, the percentage of assembled ESTs hitting GO sequencesranged from 25% (ovary) to 40% (pyloric caecum; Table 4). Z-statistics were used to determine if, for a given GO classification,the proportion of assembled ESTs in an organ-specific S. salarlibrary group differed significantly from the proportion of as-sembled ESTs from remaining S. salar library groups (see Meth-ods, Table 4, and Supplemental data at http://web.uvic.ca/cbr/
Table 2. Salmonid cDNA Library Summary Statisticsa
Library/library groupAverageinsert
No.good seq.b
No.putative trans.c Max. contig.
Ave.contig
% new(spec)d
% noBLASTe
%singlef
No. onchip
Salmo salarBrain 1413 bp 1161 891 23 1.30 38.4 47.3 30.4 0Normalized heart 494 bp 729 634 5 1.14 30.4 29.8 29.2 0Esophagusg 1908 bp 749 506 51 1.48 31.2 32.2 20.4 2Gill 840 bp 2308 1751 14 1.31 30.6 35.7 24.9 0Head kidney lower MW 1031 bp 784 425 68 1.84 15.0 12.7 12.0 0Head kidney higher MW 2307 bp 867 750 14 1.15 38.2 38.4 35.3 6Head kidney, infectedh 895 bp 1921 1173 24 1.63 65.8 36.1 35.0 315Head kidney, stimulatedi 984 bp 1233 898 71 1.37 50.5 32.3 39.8 0Normalized liver 619 bp 1379 977 16 1.41 24.5 22.6 21.2 362Mixed gutj 1450 bp 3753 2509 41 1.49 29.8 29.9 20.1 1Norm, skeletal muscle 928 bp 903 770 5 1.17 32.5 30.9 29.5 0Ovary 723 bp 2664 2239 17 1.18 40.2 45.7 33.0 0Pituitary gland 692 bp 2883 1512 123 1.90 34.7 35.8 17.7 214Pyloric caecum lower MW 1043 bp 329 251 16 1.31 11.9 15.5 10.6 2Pyloric caecum higher MW 2400 bp 716 564 16 1.26 39.8 36.2 30.4 24Norm pyl.caecum low MWk 884 bp 5514 3082 37 1.78 36.3 25.5 14.8 248Retinal 662 bp 1118 914 17 1.22 33.1 41.0 29.1 0Normalized mixed tissuem 1556 bp 24,534 15,458 29 1.58 65.3 39.7 34.7 1361Spleen lower MW 1278 bp 210 173 5 1.21 17.9 17.3 20.5 0Spleen higher MW 2089 bp 1926 1575 22 1.22 42.4 41.8 35.9 79Testesn 664 bp 2038 1530 14 1.33 34.2 41.4 24.5 2Whole juvenile 1046 bp 268 225 6 1.19 21.3 22.2 21.6 3Normalized whole juvenile 883 bp 3832 2494 47 1.53 37.4 31.1 20.5 500
Oncorhynchus mykissBrain 805 bp 330 284 8 1.16 61.6 39.1 50.9 0Mixed embryonic0 779 bp 1815 1314 34 1.38 78.2 47.9 50.8 0Mixed gonadp 574 bp 6956 4862 58 1.43 83.4 40.0 52.5 279Whole juvenile lower MW 1087 bp 296 234 6 1.26 37.1 15.4 31.8 65Whole juvenile higher MW 2181 bp 936 759 17 1.23 70.0 41.6 55.0 71Norm. whole juv. lower MW 962 bp 4211 2335 91 1.80 71.6 32.2 28.8 23
Oncorhynchus tshawytschaMixed tissue lower MW 1025 bp 576 498 8 1.15 83.5 46.2 60.1 0Mixed tissue higher MW 1294 bp 741 660 5 1.12 87.8 52.3 64.8 0
Coregonus clupeaformisBrain lower MW 802 bp 729 583 16 1.25 87.6 52.0 53.9 0Brain higher MW 1203 bp 736 649 18 1.13 90.2 58.4 67.0 0
Shading indicates statistics related to complexity and gene discovery rate in higher- and lower-molecular weight (MW) cDNA libraries discussed intext.aCompiled using the March 3, 2003, version of the GRASP EST database (except percent singletonsf)bSequence considered “good” if its trimmed PHRED20 length is at least 100 bases.cNumber of putative transcripts (assembled ESTs) = number of contigs + number of singletons.dPercent new (species) values, used to estimate gene discovery rate, is the number of previously unidentified EST clusters (including contigs andsingletons) divided by the total number of clusters.ePercentage of EST clusters (including contigs and singletons) with no significant BLASTN or BLASTX hit (E < 10�5).fPercent singletons, calculated using the August 25, 2003, version of the GRASP EST database, was the number of singletons in a library (consideringall data in the database) divided by the total number of ESTs (“good sequences”) from that library.gEsophagus library group contains three size fractions of a single cDNA library.hInfected head kidney library group contains four size fractions of a single suppression subtractive hybridization (SSH) library. Includes 82 goodreverse reads, 76 with good paired (from the same clone) forward reads (18 overlapping/clustering together).iStimulated head kidney library group contains four size fractions of a single SSH library and two size fractions of a single cDNA library.jMixed gut (stomach, mid-gut, hind-gut) library group contains six separately cloned size fractions of a single cDNA library.kIncludes 1949 good reverse (5�) reads, 1804 of which have good paired forward reads (1205 overlapping).lIncludes 143 good reverse (5�) reads without attempted forward reads.mNormalized mixed tissue (spleen, kidney, brain) includes 3929 good reverse (5�) reads, 3503 with good paired forward reads (871 overlapping).nIncludes 318 good reverse (5�) reads without attempted forward reads. Of 316 good reverse reads with attempted forward reads, 223 have goodpaired forward reads (174 overlapping). This library was contaminated with ovary and retina cDNAs during gel fractionation.oMixed embryonic library group contains four SSH libraries and two cDNA libraries from different stages.pMixed gonad library group contains 12 SSH libraries and 8 cDNA libraries.
Salmonid ESTs and Cross-Species cDNA Microarray
Genome Research 481www.genome.org
Cold Spring Harbor Laboratory Press on July 13, 2011 - Published by genome.cshlp.orgDownloaded from
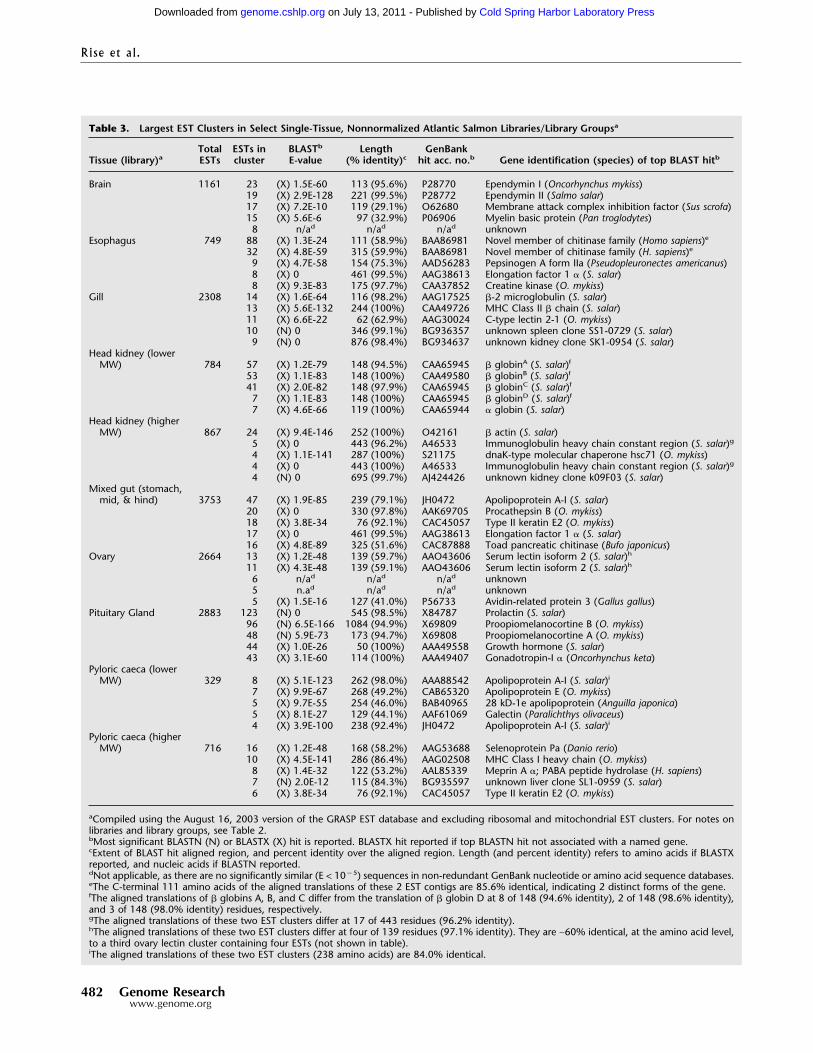
Table 3. Largest EST Clusters in Select Single-Tissue, Nonnormalized Atlantic Salmon Libraries/Library Groupsa
Tissue (library)aTotalESTs
ESTs incluster
BLASTb
E-valueLength
(% identity)cGenBank
hit acc. no.b Gene identification (species) of top BLAST hitb
Brain 1161 23 (X) 1.5E-60 113 (95.6%) P28770 Ependymin I (Oncorhynchus mykiss)19 (X) 2.9E-128 221 (99.5%) P28772 Ependymin II (Salmo salar)17 (X) 7.2E-10 119 (29.1%) O62680 Membrane attack complex inhibition factor (Sus scrofa)15 (X) 5.6E-6 97 (32.9%) P06906 Myelin basic protein (Pan troglodytes)8 n/ad n/ad n/ad unknown
Esophagus 749 88 (X) 1.3E-24 111 (58.9%) BAA86981 Novel member of chitinase family (Homo sapiens)e
32 (X) 4.8E-59 315 (59.9%) BAA86981 Novel member of chitinase family (H. sapiens)e
9 (X) 4.7E-58 154 (75.3%) AAD56283 Pepsinogen A form IIa (Pseudopleuronectes americanus)8 (X) 0 461 (99.5%) AAG38613 Elongation factor 1 � (S. salar)8 (X) 9.3E-83 175 (97.7%) CAA37852 Creatine kinase (O. mykiss)
Gill 2308 14 (X) 1.6E-64 116 (98.2%) AAG17525 �-2 microglobulin (S. salar)13 (X) 5.6E-132 244 (100%) CAA49726 MHC Class II � chain (S. salar)11 (X) 6.6E-22 62 (62.9%) AAG30024 C-type lectin 2-1 (O. mykiss)10 (N) 0 346 (99.1%) BG936357 unknown spleen clone SS1-0729 (S. salar)9 (N) 0 876 (98.4%) BG934637 unknown kidney clone SK1-0954 (S. salar)
Head kidney (lowerMW) 784 57 (X) 1.2E-79 148 (94.5%) CAA65945 � globinA (S. salar)f
53 (X) 1.1E-83 148 (100%) CAA49580 � globinB (S. salar)f
41 (X) 2.0E-82 148 (97.9%) CAA65945 � globinC (S. salar)f
7 (X) 1.1E-83 148 (100%) CAA65945 � globinD (S. salar)f
7 (X) 4.6E-66 119 (100%) CAA65944 � globin (S. salar)Head kidney (higherMW) 867 24 (X) 9.4E-146 252 (100%) O42161 � actin (S. salar)
5 (X) 0 443 (96.2%) A46533 Immunoglobulin heavy chain constant region (S. salar)g
4 (X) 1.1E-141 287 (100%) S21175 dnaK-type molecular chaperone hsc71 (O. mykiss)4 (X) 0 443 (100%) A46533 Immunoglobulin heavy chain constant region (S. salar)g
4 (N) 0 695 (99.7%) AJ424426 unknown kidney clone k09F03 (S. salar)Mixed gut (stomach,mid, & hind) 3753 47 (X) 1.9E-85 239 (79.1%) JH0472 Apolipoprotein A-I (S. salar)
20 (X) 0 330 (97.8%) AAK69705 Procathepsin B (O. mykiss)18 (X) 3.8E-34 76 (92.1%) CAC45057 Type II keratin E2 (O. mykiss)17 (X) 0 461 (99.5%) AAG38613 Elongation factor 1 � (S. salar)16 (X) 4.8E-89 325 (51.6%) CAC87888 Toad pancreatic chitinase (Bufo japonicus)
Ovary 2664 13 (X) 1.2E-48 139 (59.7%) AAO43606 Serum lectin isoform 2 (S. salar)h
11 (X) 4.3E-48 139 (59.1%) AAO43606 Serum lectin isoform 2 (S. salar)h
6 n/ad n/ad n/ad unknown5 n.ad n/ad n/ad unknown5 (X) 1.5E-16 127 (41.0%) P56733 Avidin-related protein 3 (Gallus gallus)
Pituitary Gland 2883 123 (N) 0 545 (98.5%) X84787 Prolactin (S. salar)96 (N) 6.5E-166 1084 (94.9%) X69809 Proopiomelanocortine B (O. mykiss)48 (N) 5.9E-73 173 (94.7%) X69808 Proopiomelanocortine A (O. mykiss)44 (X) 1.0E-26 50 (100%) AAA49558 Growth hormone (S. salar)43 (X) 3.1E-60 114 (100%) AAA49407 Gonadotropin-I � (Oncorhynchus keta)
Pyloric caeca (lowerMW) 329 8 (X) 5.1E-123 262 (98.0%) AAA88542 Apolipoprotein A-I (S. salar)i
7 (X) 9.9E-67 268 (49.2%) CAB65320 Apolipoprotein E (O. mykiss)5 (X) 9.7E-55 254 (46.0%) BAB40965 28 kD-1e apolipoprotein (Anguilla japonica)5 (X) 8.1E-27 129 (44.1%) AAF61069 Galectin (Paralichthys olivaceus)4 (X) 3.9E-100 238 (92.4%) JH0472 Apolipoprotein A-I (S. salar)i
Pyloric caeca (higherMW) 716 16 (X) 1.2E-48 168 (58.2%) AAG53688 Selenoprotein Pa (Danio rerio)
10 (X) 4.5E-141 286 (86.4%) AAG02508 MHC Class I heavy chain (O. mykiss)8 (X) 1.4E-32 122 (53.2%) AAL85339 Meprin A �; PABA peptide hydrolase (H. sapiens)7 (N) 2.0E-12 115 (84.3%) BG935597 unknown liver clone SL1-0959 (S. salar)6 (X) 3.8E-34 76 (92.1%) CAC45057 Type II keratin E2 (O. mykiss)
aCompiled using the August 16, 2003 version of the GRASP EST database and excluding ribosomal and mitochondrial EST clusters. For notes onlibraries and library groups, see Table 2.bMost significant BLASTN (N) or BLASTX (X) hit is reported. BLASTX hit reported if top BLASTN hit not associated with a named gene.cExtent of BLAST hit aligned region, and percent identity over the aligned region. Length (and percent identity) refers to amino acids if BLASTXreported, and nucleic acids if BLASTN reported.dNot applicable, as there are no significantly similar (E < 10�5) sequences in non-redundant GenBank nucleotide or amino acid sequence databases.eThe C-terminal 111 amino acids of the aligned translations of these 2 EST contigs are 85.6% identical, indicating 2 distinct forms of the gene.fThe aligned translations of � globins A, B, and C differ from the translation of � globin D at 8 of 148 (94.6% identity), 2 of 148 (98.6% identity),and 3 of 148 (98.0% identity) residues, respectively.gThe aligned translations of these two EST clusters differ at 17 of 443 residues (96.2% identity).hThe aligned translations of these two EST clusters differ at four of 139 residues (97.1% identity). They are ∼60% identical, at the amino acid level,to a third ovary lectin cluster containing four ESTs (not shown in table).iThe aligned translations of these two EST clusters (238 amino acids) are 84.0% identical.
Rise et al.
482 Genome Researchwww.genome.org
Cold Spring Harbor Laboratory Press on July 13, 2011 - Published by genome.cshlp.orgDownloaded from
grasp). Because putative organ functions are sought, only thoseGO categories with disproportionately high numbers of as-sembled ESTs will be discussed. The gill library has disproportion-ately high numbers of assembled ESTs in the “iron binding,”“oxidoreductase, acting on heme group of donors,” and “trans-porter” GO categories (Table 4). Disproportionately high num-bers of ovary assembled ESTs are seen in GO categories related toheavy metal (copper, iron, and zinc) binding and enzyme inhi-bition (Table 4). The pituitary gland library has disproportion-ately high numbers of assembled ESTs in “iron binding,” “hor-mone binding,” and “oxidoreductase, acting on heme group ofdonors” categories (Table 4).
This approach was used to acquire putative functional in-formation on a poorly characterized organ, the pyloric caecum.The teleost pyloric caecum, a large elaborate set of finger-likeextensions off the gut, is known to play an important role innutrient uptake (Buddington and Diamond 1986). There is scantliterature on the fish pyloric caecum. Douglas et al. (1999b) clas-sified 147 winter flounder pyloric caecum ESTs by putative func-tion. Winter flounder pyloric caecum libraries were used to iso-late cDNA clones encoding trypsinogen (Douglas and Gallant1998) and aminopeptidase N (Douglas et al. 1999a). Here wereport 6559 S. salar pyloric caecum ESTs, facilitating a deeperunderstanding of gene expression in this organ.
Both mixed gut and pyloric caecum library groups have dis-proportionately high numbers of assembled ESTs in the “en-zyme,” “oxidoreducatase, acting on heme group of donors,” and“transporter” GO categories (Table 4). These may point to generalfunctions along the digestive tract. “Iron binding” and “hydro-
lase” GO categories have disproportionatelyhigh numbers of assembled ESTs in mixedgut but not pyloric caecum (Table 4). Thereare disproportionately high numbers of as-sembled ESTs in the “cytochrome P450,” “se-lenium binding,” “oxidoreductase, acting onNADH or NADPH,” “oxidoreductase, actingon peroxide as acceptor,” and “transferringsulfur-containing groups” categories in py-loric caecum but not mixed gut librarygroups (Table 4), indicating putative special-ized roles for the pyloric caecum. Selenium isa component of selenoprotein P and gluta-thione peroxidases, antioxidant enzymesthat protect cells from oxidative injury (De-plancke and Gaskins 2002; Burk et al. 2003;Schomburg et al. 2003). Selenoprotein P isone of the largest EST contigs in the pyloriccaecum library group (Table 5), and this li-brary group contains at least eight differentassembled ESTs identified by BLAST as gluta-thione peroxidases. At least 10 different py-loric caecum assembled ESTs are identifiedas cytochromes P450, a class of heme-containing monooxygenases involved in me-tabolism of foreign compounds such as envi-ronmental pollutants and agrochemicals(Danielson 2002). Collectively, these resultsindicate that the salmon pyloric caecumfunctions in redox control and as a barrieragainst the systemic uptake of xenobiotics.
Additional hypothetical functions ofthe pyloric caecum may be proposed by ex-amining the largest EST clusters (representinghighly expressed genes) in the pyloric cae-cum library group, and locating other mem-bers of these clusters across all S. salar library
groups (Table 5). Several defense-relevant EST clusters, includingCC chemokine macrophage inflammatory protein (MIP)-3a, ga-lectin, and GDP-D-mannose-4,6-dehydratase (GMD), derive mostof their ESTs from pyloric caecum libraries (Table 5). Galectinsserve as master regulators of immune cell homeostasis duringinnate immune responses (Rabinovich et al. 2002). GMD is re-quired for the synthesis of fucosylated oligosaccharides, selectinligands involved in leukocyte extravasation (Ohyama et al. 1998;Eshel et al. 2001). These data indicate an innate defense functionof the salmonid pyloric caecum. That previously unknown ESTtypes, frequencies, and distributions have been observed amongpyloric caecum and other organs by this analysis indicates gen-eral utility for this approach in revealing unknown functions ofmany other organ and cellular systems.
Application of a Salmonid cDNA Microarrayto Different SpeciesA preliminary cDNA microarray (available from correspondingauthor), composed of 6440 AS and 916 rainbow trout (RT) cDNAelements or spots (Table 6), was hybridized with labeled targetsfrom three members of the order Salmoniformes (AS, RT, andlake whitefish [LW]) and one member of the order Osmeriformes(rainbow smelt; Fig. 2A) to explore the validity of using this mi-croarray with other fish species. Hybridization performance ofeach species’ labeled target to the salmonid elements was judgedfrom the numbers of AS and RT elements passing a hybridizationsignal threshold, and mean total raw signals from AS and RTelements (see Methods; Table 6). No transformations or normal-
Figure 1 Open reading frame (ORF) and BLAST results. Numbers of assembled Salmo salar (A)and Oncorhynchus mykiss (B) ESTs with and without 200 base ORFs are given. Within each of thesecategories, proportions of assembled ESTs with and without significant (E < 10�5) BLASTX hitsagainst GenBank nonredundant protein database are shown, as are proportions of assembledESTs with and without significant (E < 10�5) BLASTN hits against the nonredundant nucleotidedatabase. The lengths and putative identifications (gene names of best BLASTX hits) of thelongest ORFs in each species are given.
Salmonid ESTs and Cross-Species cDNA Microarray
Genome Research 483www.genome.org
Cold Spring Harbor Laboratory Press on July 13, 2011 - Published by genome.cshlp.orgDownloaded from

izations were performed on the data. Data and statistics for allslides are given in Table 6.
To evaluate the effect of element (cDNA spotted onto themicroarray slide) and target (labeled cDNA hybridized to theslide) species affiliations on hybridization characteristics, dataand statistics for AS and RT microarray elements were compiled
separately. On AS probes, AS target gave the highest signal (meanof three slides: 2.01E7, SEM 4.99E5), followed by RT (mean ofthree slides: 1.88E7, SEM 8.16E4), LW (mean of three slides:1.54E7, SEM 3.31E5), and rainbow smelt (mean of three slides:6.61E6, SEM 5.37E5; Table 6). On RT probes, RT target gave thehighest signal (mean of three slides: 2.53E6, SEM 4.19E4), fol-
Table 4. Gene Ontologya (Molecular Function) of Assembled ESTs From Organ-Specific Libraries/Library Groupsb
Library/library group:c Alld (26%) Gille (31%) MGf (35%) Ovaryg (25%) PCh (40%) Pituit.i (34%)
GO terma
All molecular function 6937 444 722 430 1192 441Antioxidant 10 2 0 1 2 0Apoptosis regulator 26 2 1 0 4 0Binding 3328 275 331 245 525 309Heavy metal binding 194 19 28 42 25 18Copper binding 7 0 0 2 1 0Iron binding 55 8 17 24 8 9Zinc binding 129 11 11 16 16 9
Oxygen binding 32 3 2 0 9 0Cytochrome P450 21 0 2 0 8 0
Protein binding 724 51 39 47 101 17Transcription factor binding 166 7 3 6 24 2
Receptor binding 177 8 14 7 31 37Cytokine 40 5 2 0 8 1Hormone 52 1 4 1 9 30
Selenium binding 9 0 3 0 6 0Cell adhesion molecule 44 1 8 1 4 2Chaperone 148 6 21 10 23 11Heat shock protein 53 3 9 6 9 6
Defense/immunity protein 192 7 13 4 13 0Antiviral response protein 29 1 3 1 5 0
Enzyme 2484 110 285 110 486 80Hydrolase 1116 37 154 39 212 26Kinase 292 6 12 7 34 4Oxidoreductase 478 44 66 38 127 37Disulfide oxidoreductase 20 1 0 1 5 2Oxidoreductase, acting on heme group ofdonors 66 15 16 8 19 11
Oxidoreductase, acting on CH-OH group ofdonors 89 4 10 0 22 2
Oxidoreductase, acting on NADH or NADPH 125 11 15 12 32 12Oxidoreductase, acting on peroxide as acceptor 26 2 6 3 11 2
Transferase 595 15 38 21 98 9Transferring phosphorus-containing groups 338 8 15 12 44 6Transferring sulfur-containing groups 16 0 1 0 6 0
Enzyme regulator 288 17 22 25 56 7Enzyme activator 123 7 11 11 28 1Enzyme inhibitor 167 11 12 19 28 5
Transcription regulator 517 14 15 22 66 11Transcription factor 427 9 13 18 49 10Transcription cofactor 145 6 3 6 22 1
Translation regulator 150 8 23 11 30 6Transporter 754 62 109 47 198 49
Z-statistics and associated P values were used to compare sample proportions (see Methods). Values with negative Z-statistics have fewer assembledESTs than expected (italics = P < 0.05, bold italics = P < 0.01). Values with positive Z-statistics have more assembled ESTs than expected (10% grey= P < 0.05; 25% grey = P < 0.01).aClassified using guidelines of the Gene Ontology Consortium 2001 (http://www.geneontology.org). Indented terms are children of the aboveparent term. A selection of GO categories is presented.bFor notes on libraries and library groups, see Table 2. ESTs were assembled by using PHRAP. GO statistics were compiled using the March 3, 2003,version of the GRASP EST database. Percentages are for assembled ESTs hitting GO sequences.cGO hits in all three categories (Molecular Function, Cellular Component, and Biological Process) are pooled for this calculation.dAll S. salar includes 61,819 ESTs; 6937 assembled ESTs having significant BLASTX hits (E < 10�5) are annotated by molecular function. “All S. salar”are inflated due to 1131 reverse (5�) reads without good corresponding forward reads, and 3338 reverse reads that do not overlap/cluster withcorresponding good forward reads.eOf 2308 Gill library ESTs 444 assembled ESTs with significant BLASTX hits are annotated by molecular function.fOf 3753 Mixed Gut library ESTs, 722 assembled ESTs with significant BLASTX hits are annotated by molecular function.gOf 2664 Ovary library ESTs, 430 assembled ESTs with significant BLASTX hits are annotated by molecular function.hPC = all pyloric caecum libraries (lower MW, higher MW, and normalized). Of 6559 pyloric caecum library ESTs, 1192 assembled ESTs withsignificant BLASTX hits are annotated by molecular function. PC values are slightly inflated due to 145 reverse reads without good correspondingforward reads, and 599 reverse reads that do not overlap/cluster with good corresponding forward reads.iOf 2883 pituitary gland library ESTs, 441 assembled ESTs with significant BLASTX hits are annotated by molecular function.
Rise et al.
484 Genome Researchwww.genome.org
Cold Spring Harbor Laboratory Press on July 13, 2011 - Published by genome.cshlp.orgDownloaded from

Table 5. Largest EST Clustersa in the Pyloric Caecum Library Group,b and Locations of Other Members of Clusters Across S. salar cDNALibrary Groupsb
GenBankhit acc. no.c
Gene identification(species) of top BLAST hitc
BLASTc
E-valueLength
(% identity)c pc br es gi he ki li mg ov pi re skb sp te w
CAA49679 Trypsin III (Salmo salar) (X) 5.0E-130 230 (100%) 4014 1 41 3CAB65320 Apolipoprotein E
(Oncorhynchus mykiss)(X) 9.9E-67 268 (49.2%) 349 11 1
P80961 Antifreeze protein LS-12 (M.octodecemspinosus)
(X) 5.4E-11 126 (41.2%) 274 1 1 7 2 4
AAG53688 Selenoprotein Pa (Daniorerio)
(X) 1.1E-48 167 (58.2%) 212 2 8 1 6 3
I51348 MHC class I (S. salar) (X) 4.4E-103 230 (70.5%) 162 6 2 1 1 17BAB40965 28 kDa-1e apolipoproteinA
(Anguilla japonica)d(X) 2.7E-39 234 (38.4%) 164 3
AAC52505 CRP ductin � (Musmusculus)
(X) 1.1E-81 412 (41.4%) 143 1
CAA10948 CC Chemokine MIP-3a (M.musculus)
(X) 7.9E-8 79 (37.8%) 145 1
CAB46819 Splicing factor (Canisfamiliaris)
(X) 1.7E-40 84 (92.8%) 135 3 1 4
AAL85339 Meprin A � (Homo sapiens) (X) 8.0E-107 340 (53.0%) 122 4BAA82366 Chymotrypsinogen 2
(Paralichthys olivaceus)(X) 5.5E-115 254 (81.1%) 124 1 3
BAA82370 Elastase 4 precursor (P.olivaceus)
(X) 0 261 (85.4%) 124 1 2
CAC45057 Type II keratin E2 (O.mykiss)
(X) 3.8E-34 75 (92.1%) 11 3 1 18 3
AAF00925 Intestinal fatty acid bindingprotein (D. rerio)
(X) 1.7E-58 131 (83.9%) 111 6
BAB40965 28 kDa-1e apolipoproteinB
(A. japonica)d(X) 9.7E-55 254 (46.0%) 111 6
n/ac unknown n/a n/a 113 2 2 1AAG60018 Acidic mammalian chitinase
(Mus musculus)(X) 7.5E-7 51 (45.0%) 113 1
AAM73701 C1q-like adipose specificprotein (S. fontinalis)
(X) 1.1E-31 162 (45%) 114 3 1 1 1
BG935597 unknown liver cloneSL1-0959 (S. salar)
(N) 2.0E-12 115 (84.3%) 10 1 2
CAA65953 �-globin (S. salar) (X) 1.4E-82 147 (99.3%) 10 1 1CAA49678 Trypsin II (S. salar) (X) 3.7E-141 231 (100%) 101 3 4 2n/ac unknown n/a n/a 101 1 1AJ424208 unknown kidney clone
k04A08 (S. salar)(N) 2.1E-53 336 (83.6%) 102 1
AAD30275 Heat shock protein hsp90 �(S. salar)
(X) 0 369 (100%) 102 2 2 5 3 4 1 1 1 3 13 31
AAF61069 Galectin (P. olivaceus) (X) 8.1E-27 129 (44.1%) 102 1P07514 NADH-cytochrome b5
reductase (Bos taurus)(X) 7.2E-105 267 (66.2%) 103 1 5 1
AAF89686 Catalase (D. rerio) (X) 4.2E-38 116 (73.2%) 103 3AAD34044 CGI-49 protein (H. sapiens) (X) 8.4E-48 139 (61.4%) 103 3NP_571833 Stomatin (D. rerio) (X) 1.2E-100 281 (70.8%) 103 1BAB40965 28 kDa-1e apolipoproteinC
(A. japonica)d(X) 2.6E-55 254 (44.4%) 104 1 4 1
AAL40376 High choriolytic enzyme 1(Takifugu rubripes)
(X) 4.1E-84 215 (67.4%) 104 4 4
CAC21508 Meprin A � (H. sapiens) (X) 1.4E-32 122 (53.2%) 9CAC87888 Toad pancreatic chitinase
(Bufo japonicus)(X) 0 327 (51.6%) 92 16
AAC24501 GDP-D-mannose-4,6-dehydratase (H. sapiens)
(X) 6.4E-51 121 (76.8%) 92 1 1
P02593 Calmodulin (H. sapiens) (X) 7.9E-82 149 (100%) 92 2 5 2 4 3 2
aCompiled using the August 16, 2003 version of the GRASP EST database, and excluding mitochondrial and ribosomal EST clusters. ESTs assembledusing PHRAP.bFor notes on S. salar libraries and library groups, see Table 2. Library abbreviations follow: pc indicates all pyloric caecum libraries; br, brain; es,esophagus; gi, gill; he, normalized heart; ki, all kidney libraries; li, normalized liver; mg, all mixed gut (stomach + mid-gut + hind-gut) libraries; ov,ovary; pi, pituitary gland; re, retina; skb, normalized (spleen + kidney + brain); sp, all spleen libraries; te, testis and w, all whole juvenile libraries.Subscripts following EST numbers denote the number of reverse or duplicate forward reads matching forward reads in the cluster.cSee notes on Table 3.dParalogs discussed in text. The aligned translations of B and C differ at 13 of 228 residues (94.3% identity); each differs from the translation of Aat 104 of 228 residues (54.4% identity).
Salmonid ESTs and Cross-Species cDNA Microarray
Genome Research 485www.genome.org
Cold Spring Harbor Laboratory Press on July 13, 2011 - Published by genome.cshlp.orgDownloaded from
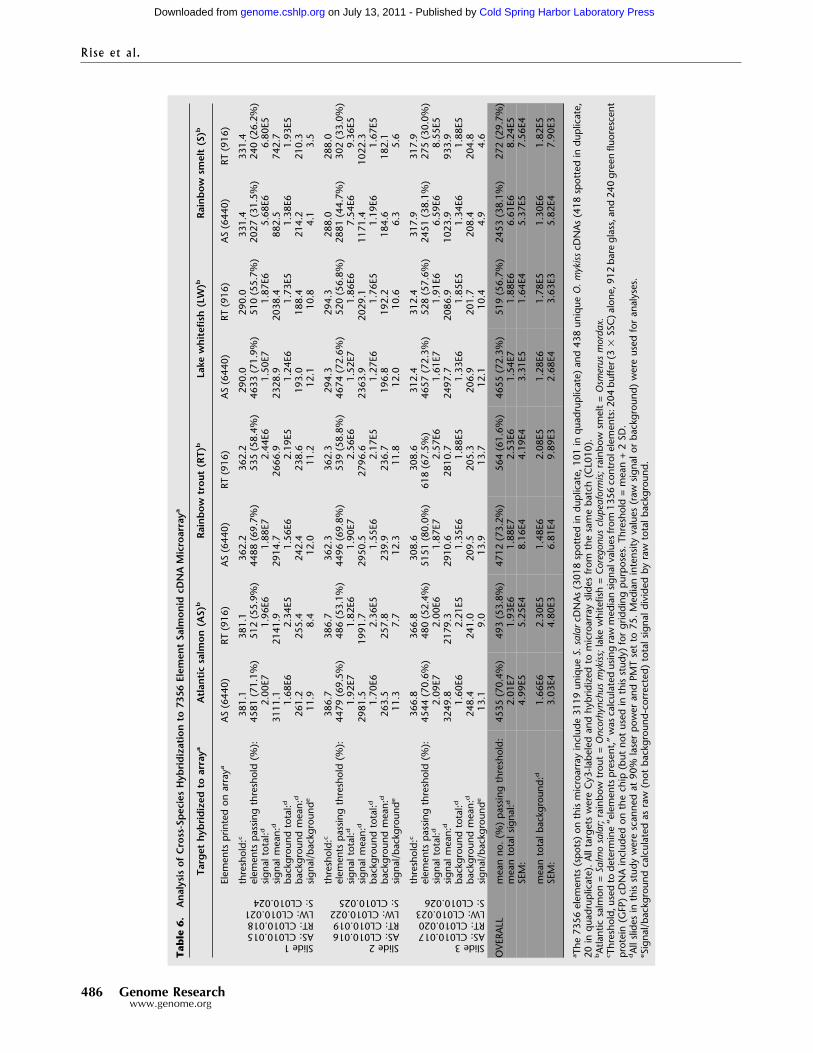
Table6.
Analysisof
Cross-SpeciesHybridizationto
7356
Elem
entSalmonidcDNAMicroarraya
Target
hybridized
toarraya
Atlanticsalmon
(AS)
bRainbow
trout(RT)
bLake
whitefish(LW)b
Rainbow
smelt(S)b
Elementsprintedonarraya
AS(6440)
RT(916)
AS(6440)
RT(916)
AS(6440)
RT(916)
AS(6440)
RT(916)
Slide1AS:CL010.015RT:CL010.018LW:CL010.021S:CL010.024
threshold:c
381.1
381.1
362.2
362.2
290.0
290.0
331.4
331.4
elementspassingthreshold(%):
4581(71.1%)
512(55.9%)
4488(69.7%)
535(58.4%)
4633(71.9%)
510(55.7%)
2027(31.5%)
240(26.2%)
signaltotal:d
2.00E7
1.96E6
1.88E7
2.44E6
1.50E7
1.87E6
5.68E6
6.80E5
signalmean:d
3111.1
2141.9
2914.7
2666.9
2328.9
2038.4
882.5
742.7
backgroundtotal:d
1.68E6
2.34E5
1.56E6
2.19E5
1.24E6
1.73E5
1.38E6
1.93E5
backgroundmean:d
261.2
255.4
242.4
238.6
193.0
188.4
214.2
210.3
signal/backgrounde
11.9
8.4
12.0
11.2
12.1
10.8
4.1
3.5
Slide2AS:CL010.016RT:CL010.019LW:CL010.022S:CL010.025
threshold:c
386.7
386.7
362.3
362.3
294.3
294.3
288.0
288.0
elementspassingthreshold(%):
4479(69.5%)
486(53.1%)
4496(69.8%)
539(58.8%)
4674(72.6%)
520(56.8%)
2881(44.7%)
302(33.0%)
signaltotal:d
1.92E7
1.82E6
1.90E7
2.56E6
1.52E7
1.86E6
7.54E6
9.36E5
signalmean:d
2981.5
1991.7
2950.5
2796.6
2363.9
2029.1
1171.4
1022.3
backgroundtotal:d
1.70E6
2.36E5
1.55E6
2.17E5
1.27E6
1.76E5
1.19E6
1.67E5
backgroundmean:d
263.5
257.8
239.9
236.7
196.8
192.2
184.6
182.1
signal/backgrounde
11.3
7.7
12.3
11.8
12.0
10.6
6.3
5.6
Slide3AS:CL010.017RT:CL010.020LW:CL010.023S:CL010.026
threshold:c
366.8
366.8
308.6
308.6
312.4
312.4
317.9
317.9
elementspassingthreshold(%):
4544(70.6%)
480(52.4%)
5151(80.0%)
618(67.5%)
4657(72.3%)
528(57.6%)
2451(38.1%)
275(30.0%)
signaltotal:d
2.09E7
2.00E6
1.87E7
2.57E6
1.61E7
1.91E6
6.59E6
8.55E5
signalmean:d
3249.8
2179.3
2910.6
2810.7
2497.7
2086.9
1023.9
933.9
backgroundtotal:d
1.60E6
2.21E5
1.35E6
1.88E5
1.33E6
1.85E5
1.34E6
1.88E5
backgroundmean:d
248.4
241.0
209.5
205.3
206.9
201.7
208.4
204.8
signal/backgrounde
13.1
9.0
13.9
13.7
12.1
10.4
4.9
4.6
OVERALL
meanno.(%)passingthreshold:
4535(70.4%)
493(53.8%)
4712(73.2%)
564(61.6%)
4655(72.3%)
519(56.7%)
2453(38.1%)
272(29.7%)
meantotalsignal:d
2.01E7
1.93E6
1.88E7
2.53E6
1.54E7
1.88E6
6.61E6
8.24E5
SEM:
4.99E5
5.25E4
8.16E4
4.19E4
3.31E5
1.64E4
5.37E5
7.56E4
meantotalbackground:d
1.66E6
2.30E5
1.48E6
2.08E5
1.28E6
1.78E5
1.30E6
1.82E5
SEM:
3.03E4
4.80E3
6.81E4
9.89E3
2.68E4
3.63E3
5.82E4
7.90E3
aThe7356elements(spots)onthismicroarrayinclude3119unique
S.salarcDNAs(3018spottedinduplicate,101inquadruplicate)and438unique
O.m
ykisscDNAs(418spottedinduplicate,
20inquadruplicate).AlltargetswereCy3-labeledandhybridizedtomicroarrayslidesfrom
thesamebatch(CL010).
bAtlanticsalmon=Salmosalar;rainbowtrout=Oncorhynchusmykiss;lakewhitefish=Coregonus
clupeaform
is;rainbowsmelt=Osm
erus
mordax.
c Threshold,usedtodetermine“elementspresent,”wascalculatedusingrawmediansignalvaluesfrom
1356controlelements:204buffer(3
�SSC)alone,912bareglass,and240greenfluorescent
protein(GFP)cDNAincludedonthechip(butnotusedinthisstudy)forgriddingpurposes.Threshold=mean+2S D.
dAllslidesinthisstudywerescannedat90%laserpowerandPMTsetto75.Medianintensityvalues(raw
signalorbackground)wereusedforanalyses.
eSignal/backgroundcalculatedasraw(notbackground-corrected)totalsignaldividedbyrawtotalbackground.
Rise et al.
486 Genome Researchwww.genome.org
Cold Spring Harbor Laboratory Press on July 13, 2011 - Published by genome.cshlp.orgDownloaded from

lowed by AS (mean of three slides: 1.93E6, SEM 5.25E4), LW(mean of three slides: 1.88E6, SEM 1.64E4), and rainbow smelt(mean of three slides: 8.24E5, SEM 7.56E4; Table 6).
The ranking of hybridization performances conformed toexpectations, given the evolutionary relationships of the speciestested (Fig. 2A,B). AS and RT, members of the subfamily Salmo-ninae, diverged in the Miocene 8 to 20 million years ago (Stearley1992; Devlin 1993; Coe et al. 1995). Phylogenies based on mor-phological (Nelson 1994) and molecular (Phillips and Oakley1997) data show that the genera Salmo and Oncorhynchus aremore closely related to one another than either group is relatedto Coregonus, the genus of LW. On both AS and RT chip elements,hybridization performance of LW target ranks third behind ASand RT targets (Table 6, Fig. 2C,D). Because the mean numbers ofAS and RT elements passing threshold are comparable for AS, RT,and LW targets (Table 6), the lower signal from LW-hybridizedslides likely reflects lower percentage of identity between salmo-nine probe and coregonine target sequences. These hybridizationresults match predicted distances of divergence for the salmonidspecies tested (Fig. 2B). Our preliminary analysis of AS and RTputatively orthologous EST contigs (primarily 3�) shows ∼94%identity and is in agreement with the success of these species’targets on one anothers’ probes (Table 6, Fig. 2C,D). Our ESTdatabase does not yet contain adequate numbers of LW EST con-tigs to permit large-scale alignment of putative orthologous se-quences. However, the high performances of LW targets on ASand RT probes (Table 6, Fig. 2C,D) are suggestive of high similar-ity between LW and salmonine orthologous cDNAs. Hybridiza-
tion performances of rainbow smelt targets were less than halfthose of salmonid (AS, RT, or LW) targets (Table 6, Fig. 2C,D),likely due to lower similarity (reflecting longer time since diver-gence) between cDNAs from members of the order Salmonifor-mes and orthologous sequences from members of the order Os-meriformes (Fig. 2A).
Identification of Candidate Duplicated GenesOsmerids are diploid and salmonids are degenerate tetraploids(Ohno et al. 1968; Fig. 2C,D), placing the putative, salmonid-specific genome duplication event after the divergence of Os-meridae and Salmonidae (Fig. 2A). Because at least 50% of recentgene duplicates are thought to persist in salmonids (Bailey et al.1978), it is expected that gene family expansion (the presence ofmultiple expressed paralogs) would be widespread in this group.Preliminary comparisons of robust EST clusters (in single AS li-braries/library groups) that have identical top BLASTX hits revealthe presence of multiple distinct forms (not splice variants) ofseveral genes (i.e., novel member of chitinase family, �-globin,and serum lectin, Table 3; 28 kD � 1e apolipoprotein, Table 5).Further work (i.e., molecular phylogenetics, fluorescence in situhybridization) will be required to distinguish paralogs arisingduring the recent salmon-specific genome duplication fromthose with origins in other gene/genome duplication events. TheGRASP EST database, and an improved salmonid presence inGenBank databases, will facilitate identification of additionalmembers in gene families, contributing to a better understandingof the evolution of related genes within and between genomes.
Figure 2 Evolutionary relationships, genome sizes, and microarray hybridization characteristics of three salmonids relative to smelt. (A) Phylogenetictree, based on morphological characters, showing evolutionary relationships among teleosts relevant to this study, and other fish orders with genomeprojects (Nelson 1994). (B) Phylogenetic tree, based on morphological characters, showing evolutionary relationships of select salmonids (Smith andStearley 1989; Kido et al. 1991). Arrows indicate putative genome duplication events (Wolfe 2001). (C, D) Mean total signals on Atlantic salmon (AS)or rainbow trout (RT) chip elements/spots (Table 6) are converted to “smelt units” by dividing by 0.661E7 for AS chip elements, or 0.824E6 for RT chipelements. Genome sizes for AS (Salmo salar), RT (Oncorhynchus mykiss), and smelt (Osmerus eperlanus, close relative of Osmerus mordax used in thisstudy) were measured by DNA flow cytometry (Vinogradov 1998). Genome size of lake whitefish (LW, Coregonus clupeaformis) was measured by Feulgendensitometry (Booke 1968). Error bars (C) show mean total signal SEM values (Table 6) converted to “smelt units” as above. n indicates number ofmicroarrays hybridized with labeled target from each species.
Salmonid ESTs and Cross-Species cDNA Microarray
Genome Research 487www.genome.org
Cold Spring Harbor Laboratory Press on July 13, 2011 - Published by genome.cshlp.orgDownloaded from

METHODS
Aquaculture and SamplingS. salar (McConnell strain) juveniles were obtained from HeritageAquaculture (British Columbia, Canada), and cultured through-out their life history. Subadult S. salar were sampled from varioustissues at 2.75 years of age (Fisheries and Oceans Canada, WestVancouver, British Columbia) and used for generating all adultcDNA libraries and labeled targets for microarray hybridizations.For juvenile cDNA libraries, S. salar (McConnell strain) and O.mykiss (Tzenzaicut Lake strain) were obtained from SeaSpringHatchery (Duncan, British Columbia) and Vancouver IslandTrout Hatchery (Duncan, British Columbia), respectively. For la-beled targets used inmicroarray hybridizations, embryonic stagesof O. mykiss were derived from a domesticated strain (Spring Val-ley Trout Farm, Langley, British Columbia) and cultured to ∼80 gbefore sampling. O. mykiss gonadal tissues (�1.5 years; SpringValley Strain), used to generate subtractive cDNA libraries, wereobtained from Mountain Trout Sales (Sooke, British Columbia).O. tshawytscha tissues were obtained from 4-year-old females(Robertson Creek, British Columbia); O. nerka tissues were obtainedfromwhole juvenile fish (Dr. L.J. Albright, Simon Fraser University);C. clupeaformis brain and liver were obtained from 3-year-old ani-mals (Laboratoire Bernatchez, Université Laval, Quebec), and Os-merus mordax livers were obtained from adult smelt (NRC Institutefor Marine Biosciences).
Fish were raised in fiberglass tanks with natural lighting andat densities <10 kg/m3 with water input rate >1 L min�1 kg�1. S.salar and O. tshawytschawere reared in fresh 10°C well water untilsmolt stage (1.5 years) and then transferred to sea water untilsexual maturation. O. mykiss were cultured only in fresh 10°Cwell water. Most fish were fed to satiation three times per day withcommercial salmon diets (Pacific Apollo 1000, Moore Clarke, Van-couver, British Columbia) comprised of 40% protein and 25% lipid.
Fish were killed by a blow to the head, followed by rapiddissection. Tissues were flash-frozen in liquid nitrogen and storedat �80°C until RNA extraction. For gut tissues, discrete sectionswere excised and the lumen gently rinsed free of food and feceswith a stream of ice-cold phosphate-buffered saline (10 mM PO4,138 mM NaCl, and 27 mM KCl at pH 7.4).
cDNA LibrariesFlash-frozen tissues were ground by using baked (5 h, 220°C)mortars and pestles under liquid N2, and poly(A)+ RNA was pu-rified by using MicroPoly(A)Pure kits (Ambion) or Oligotex Di-rect mRNA Micro Kits (Qiagen). With the exception of the O.nerka libraries, the normalized S. salar mixed tissue library, andthe suppression subtractive hybridization (SSH) libraries, cDNAlibraries were directionally constructed (5� EcoRI, 3� XhoI), usingthe pBluescript II XR cDNA Library Construction Kit, followingmanufacturer’s instructions (Stratagene). Size fractionation, per-formed on XhoI-digested cDNAs immediately prior to ligationinto vector, was by 1% agarose gel extraction (Qiagen). O. nerkalibraries were size-fractionated by using CHROMA Spin-400 col-umns (Clontech), and directionally constructed (5� SfiIA, 3� SfiIB)in pDNR-LIB using the Creator SMART cDNA Library Construc-tion Kit (Clontech). Select cDNA libraries were normalized toCot = 5 by using the Soares method (Soares et al. 1994; Bonaldoet al. 1996). The normalized (Cot = 10) S. salar mixed tissue(spleen, head kidney, brain) library was directionally constructedin pCMV Sport6.1 (ResGen). SSH libraries were constructed byusing the PCR-Select cDNA Subtraction Kit (Clontech) followingmanufacturer’s instructions, and were TA cloned into pCR4-TOPO (Invitrogen). Insert sizes of cDNA libraries were determinedby visual comparison of clone restriction fragments with the DNAsize markers �HindIII (GIBCO-BRL) and 1-kb ladder (GIBCO-BRL).
Sequencing, Sequence Analysis, and Contig AssemblyLibraries were manually arrayed in 96-well microtiter plates orwere robotically arrayed in 384-well plates. Glycerol stocks ofovernight cultures were prepared in 96-well or 384-well format.Plasmid DNAs were extracted and BigDye Terminator (ABI) cycle
sequenced on ABI 3700 and 377 sequencers by using conven-tional procedures and the following primers: 5�-T18-3�, M13 for-ward (5�-GTAAAACGACGGCCAGT-3�), and M13 reverse (5�-AACAGCTATGACCATG-3� or 5�-AACAGCTATGACCAT-3�). Base-calling from chromatogram traces was performed by using PHRED(Ewing andGreen 1998; Ewing et al. 1998). Vector, poly-A tails, andlow-quality regions were trimmed from EST sequences; sequencesthat had <100 good-quality bases after trimming were discarded.
Vectors were screened by using cross_match (part of thePHRAP package, version 0.990329), with minscore = 18. This ismore sensitive than Consed, allowing detection of adaptor se-quences in subtractive libraries. All vector was trimmed from theends of the sequence. If there was remaining vector in themiddle, it was removed and the shorter of the two remainingfragments trimmed with it.
To trim poly-A tails, sequences were scanned from theirends forward to the beginning of the last run of consecutive As.If the tail of the sequence up to that point was at least 60% A,then it was considered part of the tail. This test was repeated fromthat point forward until it failed. The portion of the sequence thatpassed was considered poly-A tail. If this test found nothing, thenthe last 100 bases of the sequence were scanned for a run of at least15 consecutive As. If found, then the trailing sequence was assumedto be bad or vector, and all sequence up to and including the run ofAs was trimmed. To scan for poly-T tails, the same tests were per-formed on reverse-complemented sequences. Sequences were notconsidered poly-A or poly-T tails if they were <10 bases in length.
PHRAP (http://www.genome.washington.edu/UWGC), un-der stringent clustering parameters (minimum score, 100; repeatstringency, 0.99), was used to assemble ESTs into contigs. Contigconsensus sequences and singleton sequences were aligned withnonredundant GenBank nucleotide and amino acid sequence da-tabases by using BLASTN and BLASTX, respectively (Altschul etal. 1990, 1997). Results of EST clustering using CAP3 (40-bp over-lap, 95% identity, other parameters default) and stackPACK (us-ing RepeatMasked sequences without quality scores) are availableat the GRASP Web site (http://web.uvic.ca/cbr/grasp). To deter-mine the approximate amount of ribosomal and mitochondrial se-quence in the GRASP EST database, each species’ ESTs were alignedagainst a BLAST database containing the same species’ GenBanksequences annotated as ribosomal plus the GenBankmitochondrialsequences from that species or its closest relative. BLAST hits with Evalues <10�5 qualified ESTs as ribosomal or mitochondrial.
Assembled EST contigs were scanned for repeats by usingREPuter (Kurtz et al. 2001). Candidate repeats (length >50 bases, fewerthan eight mismatches, and E < 10�4) were assembled into contigsby using PHRAP, and compared with GenBank nr and nt databasesby using BLASTX and BLASTN, respectively. Threshold for a signifi-cant BLAST hit was set at 10�15. BLAST results were deposited in adatabase, and a Web interface for querying was implemented(http://woodstock.ceh.uvic.ca/nkuipers/public_html/).
O. mykiss orthologs to S. salar contigs were detected bysemiglobal (end-gaps-free) pairwise alignment of forward and re-verse-complement contigs. Alignments with overlaps of <100nucleotides were discarded. O. mykiss contigs were consideredorthologous to an S. salar contig if either the forward- or reverse-complement alignment showed at least 80% identity.
Functional Characterization of EST ContigsBy using the March 3, 2003, version of the GRASP EST database,assembled S. salar ESTs from select organ-specific libraries or li-brary groups (pyloric caecum, gill, mixed gut, ovary, and pitu-itary gland), and all S. salar libraries collectively, were comparedvia BLASTX with annotated protein sequences from the GO da-tabase (November 2002 version; Table 4). Sequences with signifi-cant matches (E-value < 10�5) were classified according to theGO classification(s) of their strongest hit. For several GO func-tional categories of genes, Z-statistics were used to determine ifthere were significant differences between the proportions of as-sembled ESTs in an organ-specific library/library group (i.e., gill)and the proportions of assembled ESTs in remaining (i.e., non-gill) libraries. Z-statistics, used for the comparison of two sample
Rise et al.
488 Genome Researchwww.genome.org
Cold Spring Harbor Laboratory Press on July 13, 2011 - Published by genome.cshlp.orgDownloaded from
proportions (Anderson and Finn 1997), were calculated by usingthe following equation:
Z =p1 − p2
Square root (p*�1 − p)*(1�nl + 1�n2��
where p1 is the proportion of assembled ESTs in the organ ofinterest (2/444 for gill library, antioxidant GO category; Table 4),p2 is the proportion of assembled ESTs in nonorgan libraries(9/6869 for nongill, antioxidant; see Supplemental data at http://web.uvic.ca/cbr/grasp), p is the overall proportion (10/6937 forantioxidant; Table 4), n1 is the number of organ-specific as-sembled ESTs (444 for gill; Table 4), and n2 is the number ofnonorgan assembled ESTs (6869 for nongill; see Supplementaldata at http://web.uvic.ca/cbr/grasp). Z has a standard normaldistribution, so P-values are computed as 1 � (CDF (abs(Z)) � 2),where CDF is the cumulative distribution function of the stan-dard normal distribution and abs is absolute value. This P-valuegives a two-tailed test for the probability that the proportions oforgan and nonorgan EST contigs in a given molecular functioncategory are equal.
Microarray Fabrication and Quality ControlThe 3557 clones from 18 high-complexity salmonid cDNA librar-ies/library groups (Table 2) were selected with an emphasis onimmune relevant genes. Clones were robotically rearrayed fromdaughter glycerol stock 384-well plates into 96-well plates pre-filled with 7% glycerol in LB + ampicillin, incubated overnight at37°C, and checked for uniform optical density. Plasmid insertswere PCR-amplified in a Tetrad PTC-200 thermocycler (MJ Re-search) by using 1 µL overnight culture, 0.2 µM M13/pUC for-ward primer (5�-CCCAGTCACGACGTTGTAAAACG-3�), 0.2 µMM13/pUC reverse primer (5�-AGCGGATAACAATTTCACACAGG-3�), 2 mM MgCl2, 10 mM Tris-HCl, 50 mM KCl, 250 µM dNTPs,1U AmpliTaq (PerkinElmer), and nuclease-free H2O (GIBCO) to100 µL. PCR conditions were as follows: 2 min at 95°C denatur-ation; 35 cycles of 30 sec at 95°C, 45 sec at 60°C, and 3 min at72°C; and 7 min at 72°C. Five microliters of each PCR productwere run on a 1% agarose gel to assess yield and quality. Out of3557 clones, there were 3312 strong single bands (93%), 170absent (5%), and 75 multiple bands (2%). PCR products wererobotically cleaned (Qiagen) and consolidated into 384-well plates,lyophilized by speed-Vac, and resuspended in 15 µL 3� SSC.
All cDNAs were printed as double, side-by-side spots onTelechem Superamine slides (Arrayit) with the Biorobotics Mi-crogrid II microarray printer (Apogent Discoveries). Microspot10K quill pins (Biorobotics) in a 48-pin tool were used to deposit∼0.5 nL (0.2 ng cDNA) per spot onto the slide. The resultingmicroarrays have a 4 � 12 subgrid layout with 132 spots persubgrid, each spot having approximate diameter and pitch of 100µm and 250 µm, respectively. A 280-bp GFP (green fluorescentprotein) cDNA was amplified from a GFP clone (Clontech) byusing the primers (5�-GAAACATTCTTGGACACAAATTGG-3�)and (5�-GCAGCTGTTACAAACTCAAGAAGG-3�), and printed insubgrid corners to assist in placing on the grid. The slides werecrosslinked in a UV Stratalinker 2400 (Stratagene) at 120 mJ. Spotmorphology was assessed by visual inspection, SYBR Green 1(Molecular Probes) staining, or hybridization with labeled non-specific probe. To check clone tracking, 42 high-quality se-quences were obtained from randomly selected wells of thecleaned, consolidated 384-well plates used for microarray print-ing. All 42 had BLAST identifiers matching gene identificationspredicted from the rearray spreadsheet, indicating highly accurateclone tracking throughout the process of microarray fabrication.
Microarray Hybridization and AnalysisThis microarray experiment was designed to comply withMIAME guidelines (Brazma et al. 2001). All scanned microarrayTIF images, an ImaGene grid, the gene identification file, andImaGene quantified data files are available at http://web.uvic.ca/cbr/
grasp. To minimize technical variability, all targets were synthe-sized in one round, and all hybridizations were conducted simul-taneously on slides from a single batch (CL010, Table 6). TotalRNA, prepared from flash-frozen adult liver tissues using TRIzolreagent and methods (Invitrogen), was quantified and quality-checked by spectrophotometer and agarose gel. Hybridizationswere performed by using the Genisphere Array50 kit and instruc-tions. Briefly, 15 µg total RNA were reverse-transcribed by usinga special oligo d(T) primer with a 5� unique sequence overhangfor the Cy3 labeling reactions. Microarrays were prepared for hy-bridization by washing two times at 5 min in 0.1% SDS, washingfive times at 1 min in MilliQ H2O, immersing 3 min in 95°CMilliQ H2O, and drying by centrifugation (5 min at 2000 rpm in50-mL conical tube). The cDNA was hybridized to the salmoncDNA microarray in a formamide-based buffer (25% formamide,4� SSC, 0.5% SDS, 2� Denhardt’s solution) for 16 h at 48°C. Thearrays were washed one time for 10 min at 48°C (2� SSC, 0.1%SDS), two times for 5 min in 2� SSC, 0.1% SDS at room tempera-ture (RT), two times for 5 min in 1� SSC at RT, and two times for5 min in 0.1� SSC at RT, and dried by centrifugation. The Cy33-dimensional fluorescent molecules (3DNA capture reagent, Geni-sphere) were hybridized to the bound cDNA on the microarray; theCy3 3DNA capture reagent bound to its complementary cDNA cap-ture sequence on the Cy3 oligo d(T) primer. The second hybridiza-tion was done for 3 h at 48°C, and washed and dried as before.
The fluorescent images of hybridized arrays were acquiredby using ScanArray Express (PerkinElmer). The Cy3 cyanine fluorwas excited at 543 nm, and the same laser power (90%) andphotomultiplier tube (PMT) setting (75) were used for all slidesin the study. Fluorescent intensity data was extracted by usingImagene 5.5 software (Biodiscovery). To avoid transformationsassociated with background correction (i.e., setting negativebackground corrected median signal values to zero), raw mediansignal values were analyzed. No normalization was applied to thedata. From the raw Imagene fluorescence intensity report files,the gene lists were sorted, and median signal values from 1356control elements (204 buffer alone, 912 bare glass, and 240 GFPcDNA) were analyzed. For each slide, threshold was calculated asthe mean intensity for these 1356 controls plus 2 SD. For dataanalyses, the 6440 S. salar (AS) chip elements and 916 O. mykiss(RT) chip elements were considered separately. The mean num-bers of AS and RT elements passing threshold, mean total slidesignal (salmonid elements only) and SEM, mean total slide back-ground (local background fluorescence intensities associatedwith salmonid elements) and SEM, and average signal and back-ground per salmonid element were calculated by slide and by spe-cies. To assess array-wide performance, signal-to-background ratiowas calculated as raw total signal divided by raw total background.
ACKNOWLEDGMENTSThis research was supported by Genome Canada, Genome BC,and the Province of BC and, additionally, by the Natural Sciencesand Engineering Research Council of Canada (B.K., W.D.). Wewould like to thank Carlo Biagi, Steve Dann, and Shelby Templefor their assistance in obtaining tissues for cDNA library con-struction; Bento Soares and Brian Berger for providing methodsand advice on normalizing cDNA libraries, and all those at theBCCA Genome Sciences Centre who contributed to this work.
The publication costs of this article were defrayed in part bypayment of page charges. This article must therefore be herebymarked “advertisement” in accordance with 18 USC section 1734solely to indicate this fact.
REFERENCESAllendorf, F.W. and Danzmann, R.G. 1997. Secondary tetrasomic
segregation of MDH-B and preferential pairing of homologues inrainbow trout. Genetics 145: 1083–1092.
Allendorf, F.W. and Thorgaard, G.H. 1984. Tetraploidy and theevolution of salmonid fishes. In Evolutionary genetics of fishes (ed. B.J.Turner), pp. 1–53. Plenum Press, New York.
Altschul, S.F., Gish, W., Miller, W., Myers, E.W., and Lipman, D.J. 1990.Basic local alignment search tool. J. Mol. Biol. 215: 403–410.
Altschul, S.F., Madden, T.L., Schäffer, A.A., Zhang, J., Zhang, Z., Miller,
Salmonid ESTs and Cross-Species cDNA Microarray
Genome Research 489www.genome.org
Cold Spring Harbor Laboratory Press on July 13, 2011 - Published by genome.cshlp.orgDownloaded from

W., and Lipman, D.J. 1997. Gapped BLAST and PSI-BLAST: A newgeneration of protein database search programs. Nucleic Acids Res.25: 3389–3402.
Anderson, T.W. and Finn, J.D. 1996. The new statistical analysis of data.Springer-Verlag, New York.
Bailey, G.S., Poulter, R.T., and Stockwell, P.A. 1978. Gene duplication intetraploid fish: Model for gene silencing at unlinked duplicated loci.Proc. Natl. Acad. Sci. 75: 5575–5579.
Bailey, G.S., Williams, D.E., and Hendricks, J.D. 1996. Fish models forenvironmental carcinogenesis: The rainbow trout. Environ. HealthPerspect. 104: 5–21.
Basu, N., Todgham, A.E., Ackerman, P.A., Bibeau, M.R., Nakano, K.,Schulte, P.M., and Iwama, G.K. 2002. Heat shock protein genes andtheir functional significance in fish. Gene 295: 173–183.
Bonaldo, M.F., Lennon, G., and Soares, M.B. 1996. Normalization andsubtraction: Two approaches to facilitate gene discovery. Genome Res.6: 791–806.
Booke, H.E. 1968. Cytotaxonomic studies of the coregonine fishes of theGreat Lakes, USA: DNA and karyotype analysis. J. Fish. Res. BoardCan. 25: 1667–1687.
Brazma, A., Hingamp, P., Quackenbush, J., Sherlock, G., Spellman, P.,Stoeckert, C., Aach, J., Ansorge, W., Ball, C.A., Causton, H.C., et al. 2001.Minimum information about a microarray experiment (MIAME): Towardstandards for microarray data. Nat. Genet. 29: 365–371.
Buddington, R.K. and Diamond, J.M. 1986. Aristotle revisited: Thefunction of pyloric caeca in fish. Proc. Natl. Acad. Sci. 83: 8012–8014.
Burk, R.F., Hill, K.E., and Motley, A.K. 2003. Selenoprotein metabolismand function: Evidence for more than one function forselenoprotein P. J. Nutr. 133: 1517S–1520S.
Coe, I.R., von Schalburg, K.R., and Sherwood, N.M. 1995.Characterization of the Pacific salmon gonadotropin-releasinghormone gene, copy number, and transcription start site. Mol. Cell.Endocrinol. 115: 113–122.
Danielson, P.B. 2002. The cytochrome p450 superfamily: Biochemistry,evolution and drug metabolism in humans. Curr. Drug Metab.3: 561–597.
Davey, G.C., Caplice, N.C., Martin, S.A., and Powell, R. 2001. A surveyof genes in the Atlantic salmon (Salmo salar) as identified byexpressed sequence tags. Gene 263: 121–130.
Deplancke, B. and Gaskins, H.R. 2002. Redox control of thetranssulfuration and glutathione biosynthesis pathways. Curr. Opin.Clin. Nutr. Metab. Care 5: 85–92.
Devlin, R.H. 1993. Sequence of sockeye salmon type 1 and type 2growth hormone genes and the relationship of rainbow trout withAtlantic and Pacific salmon. Can. J. Fish. Aquat. Sci. 50: 1738–1748.
Devlin, R.H., Biagi, C.A., Yesaki, T.Y., Smailus, D.E., and Byatt, J.C.2001. Growth of domesticated transgenic fish. Nature 409: 781–782.
Douglas, S.E. and Gallant, J.W. 1998. Isolation of cDNAs for trypsinogenfrom the winter flounder. Pleuronectes americanus. J. Mar. Biotechnol.6: 214–219.
Douglas, S.E., Bullerwell, C.E., and Gallant, J.W. 1999a. Molecularinvestigation of aminopeptidase N expression in the winterflounder. Pleuronectes americanus. J. Appl. Ichthyol. 15: 80–86.
Douglas, S.E., Gallant, J.W., Bullerwell, C.E., Wolff, C., Munholland, J.,and Reith, M.E. 1999b. Winter flounder expressed sequence tags:Establishment of an EST database and identification of novel fishgenes. Mar. Biotechnol. 1: 458–464.
Eshel, R., Besser, M., Zanin, A., Sagi-Assif, O., and Witz, I.P. 2001. TheFX enzyme is a functional component of lymphocyte activation.Cell. Immunol. 213: 141–148.
Ewing, B. and Green, P. 1998. Base-calling of automated sequencertraces using PHRED, II: Error probabilities. Genome Res. 8: 186–194.
Ewing, B., Hillier, L., Wendl, M.C., and Green, P. 1998. Base-calling ofautomated sequencer traces using PHRED, I: Accuracy assessment.Genome Res. 8: 175–185.
Faillace, M.P., Julian, D., and Korenbrot, J.I. 2002. Mitotic activation ofproliferative cells in the inner nuclear layer of the mature fish retina:Regulatory signals and molecular markers. J. Comp. Neurol.451: 127–141.
Gregory, T.R. 2002. Animal genome size database.http://www.genomesize.com.
Holland, P.W., Garcia-Fernandez, J., Williams, N.A., and Sidow, A. 1994.Gene duplications and the origins of vertebrate development.Development (Suppl.) 1994: 125–133.
Katchamart, S., Miranda, C.L., Henderson, M.C., Pereira, C.B., andBuhler, D.R. 2002. Effect of xenoestrogen exposure on theexpression of cytochrome P450 isoforms in rainbow trout liver.Environ. Toxicol. Chem. 11: 2445–2451.
Kido, Y., Aono, M., Yamaki, T., Matsumoto, K., Murata, S., Saneyoshi,M., and Okada, N. 1991. Shaping and reshaping of salmonid
genomes by amplification of tRNA-derived retroposons duringevolution. Proc. Natl. Acad. Sci. 88: 2326–2330.
Kurtz, S., Choudhuri, J.V., Ohlebusch, E., Schleiermacher, C., Stoye, J.,and Giegerich, R. 2001. REPuter: The manifold applications of repeatanalysis on a genomic scale. Nucleic Acids Res. 29: 4633–4642.
Madigou, T., Uzbekova, S., Lareyre, J.J., and Kah, O. 2002. Twomessenger RNA isoforms of the gonadotrophin-releasing hormonereceptor, generated by alternative splicing and/or promoter usage,are differentially expressed in rainbow trout gonads duringgametogenesis. Mol. Reprod. Dev. 63: 151–160.
Nelson, J.S. 1994. Fishes of the world, 3rd ed. John Wiley & Sons, New York.Ohno, S. 1970. Evolution by gene duplication. Springer-Verlang,
Heidelberg, Germany.Ohno, S., Stenius, C., Faisst, E., and Zenzes, M.T. 1965. Post-zygotic
chromosomal rearrangements in rainbow trout (Salmo irideusGIBBONS) Cytogenetics 4: 117–129.
Ohno, S., Wolf, U., and Atkin, N.B. 1968. Evolution from fish tomammals by gene duplication. Hereditas 59: 169–187.
Ohyama, C., Smith, P.L., Angata, K., Fukuda, M.N., Lowe, J.B., and Fukuda,M. 1998. Molecular cloning and expression ofGDP-D-mannose-4,6-dehydratase, a key enzyme for fucose metabolismdefective in Lec13 cells. J. Biol. Chem. 273: 14582–14587.
Phillips, R.B. and Oakley, T.H. 1997. Phylogenetic relationships amongthe Salmoninae based on nuclear and mitochondrial DNAsequences. In Molecular systematics of fishes (eds. T.D. Kocher andC.A. Stepien), pp. 145–162. Academic Press, San Diego, CA.
Phillips, R. and Ráb, P. 2001. Chromosome evolution in the Salmonidae(Pisces): An update. Biol. Rev. 76: 1–25.
Rabinovich, G.A., Rubinstein, N., and Toscano, M.A. 2002. Role ofgalectins in inflammatory and immunomodulatory processes.Biochim. Biophys. Acta 1572: 274–284.
Schomburg, L., Schweizer, U., Holtmann, B., Flohe, L., Sendtner, M.,and Kohrle, J. 2003. Gene disruption discloses role of selenoproteinP in selenium delivery to target tissues. Biochem. J. 370: 397–402.
Shum, B.P., Guethlein, L., Flodin, L.R., Adkison, M.A., Hedrick, R.P.,Nehring, R.B., Stet, R.J.M., Secombes, C., and Parham, P. 2001.Modes of salmonid MHC class I and II evolution differ from theprimate paradigm. J. Immunol. 166: 3297–3308.
Sidow, A. 1996. Gen(om)e duplications in the evolution of earlyvertebrates. Curr. Opin. Genet. Dev. 6: 715–722.
Smith, G.R. and Stearley, R.F. 1989. The classification and scientificnames of rainbow and cutthroat trouts. Fisheries 14: 4–10.
Soares, M.B., Bonaldo, M.F., Jelene, P., Su, L., Lawton, L., andEfstratiadis, A. 1994. Construction and characterization of anormalized cDNA library. Proc. Natl. Acad. Sci. 91: 9228–9232.
Stearley, R.F. 1992. Historical ecology of the Salmoninae, with specialreference to Oncorhynchus. In Systematic historical ecology and NorthAmerican freshwater fishes (ed. R.L. Mayden), pp. 622–658. StanfordUniversity Press, Stanford, CA.
Tipsmarck, C.K., Madsen, S.S., Seidelin, M., Christensen, A.S., Cutler,C.P., and Cramb, G. 2002. Dynamics of Na+,K+,2Cl� cotransporterand Na+,K+-ATPase expression in the branchial epithelium of browntrout (Salmo trutta) and Atlantic salmon (Salmo salar). J. Exp. Zool.293: 106–118.
Vinogradov, A.E. 1998. Genome size and GC-percent in vertebrates asdetermined by flow cytometry: The triangular relationship.Cytometry 31: 100–109.
Wolfe, K.H. 2001. Yesterday’s polyploids and the mystery ofdiploidization. Nat. Rev. Genet. 2: 333–341.
Zhang, C., Brown, S.B., and Hara, T.J. 2001. Biochemical andphysiological evidence that bile acids produced and released by lakechar (Salvelinus namaycush) function as chemical signals. J. Comp.Physiol. B 171: 161–171.
WEB SITE REFERENCEShttp://www.geneontology.org; the Gene Ontology Consortium (2001).http://web.uvic.ca/cbr/grasp; University of Victoria Centre for
Biomedical Research.http://woodstock.ceh.uvic.ca/nkuipers/public_html/; Web interface for
querying a database containing BLAST-identified candidate repeatsin the GRASP EST database.
http://www.genome.washington.edu/UWGC; University of WashingtonGenome Centre (PHRED version 0.990722.j; PHRAP version0.990329).
Received June 25, 2003; accepted in revised form December 12, 2003.
Rise et al.
490 Genome Researchwww.genome.org
Cold Spring Harbor Laboratory Press on July 13, 2011 - Published by genome.cshlp.orgDownloaded from
Recommended


