Embed Size (px)
Citation preview
Weekly Waste Projects Update – week ending 4th
February 2016
Weekly Waste Projects Update: week ending 4th
February 2016 Source: AcuComm Business Database
01
Incineration (with
energy recovery)
17.6%
Integrated/mixed
facilities
9.2%
Waste processing
4.4%
Anaerobic Digestion
1.1%
Landfill
0.8%
Others
66.9%
Est. Value of New Projects by Facility Type (w/e 4th Feb 2016)
New/Updated Projects Reported (w/e 4th Feb 2016)
Number
Estimated Value (all projects)
Estimated Value (new projects only)
US$ millions US$ millions
Anaerobic Digestion 3 68 23
Biofuel 5 407 1
Biogas 2 48 -
Gasification 1 319 -
Incineration (with energy recovery) 12 1,007 352
Incineration (without energy recovery) - - -
Integrated/mixed facilities 5 1,106 185
Landfill 1 16 16
MBT - - -
Other 4 4,396 1,334
Recycling 4 98 7
Waste processing 6 1,024 89
Total 43 8,489 2,008
In the week ended 4th February 2016, AcuComm added 43 new or updated waste projects to
our Business Database, worth an estimated US$8,489 million and waste capacity of just over
7.6 million tonnes.
This takes the cumulative total to 3,840 active projects since 2013,
with a total estimated investment value of US$330 billion.
To find out more information about the projects and investments
covered in this update, click here
Weekly Waste Projects Update – week ending 4th
February 2016
Weekly Waste Projects Update: week ending 4th
February 2016 Source: AcuComm Business Database
02
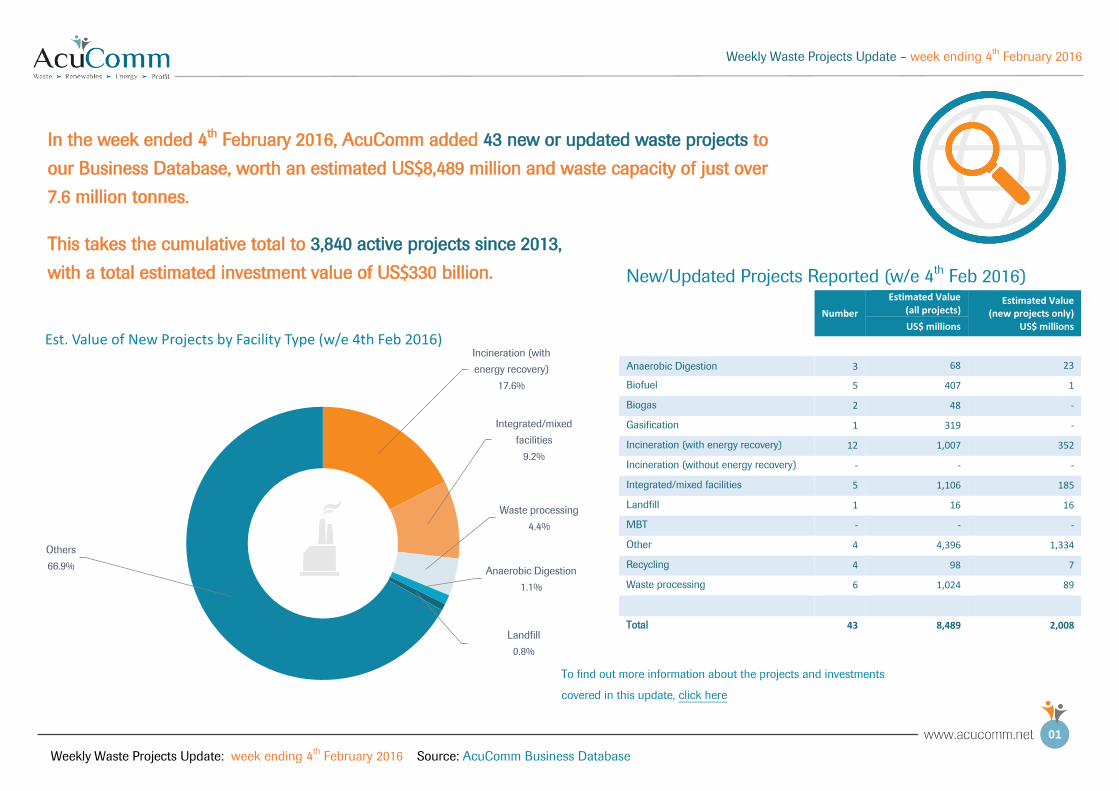
New/Updated Projects Reported (w/e 4th Feb 2016)
Number Capacity (tonnes) MW
Anaerobic Digestion 3 185,555 7
Biofuel 5 1,809,761 140
Biogas 2 23,193 5
Gasification 1 200,000 28
Incineration (with energy recovery) 12 2,115,387 276
Incineration (without energy recovery) - - -
Integrated/mixed facilities 5 1,497,692 82
Landfill 1 358,950 -
MBT - - -
Other 4 330,975 27
Recycling 4 457,174 -
Waste processing 6 669,318 -
Total 43 7,648,005 565
The total estimated waste capacity of projects reported on
in the past week is just over 7.6 million tonnes. WtE
incineration was the largest category, accounting for 2.1
million tonnes.
The total estimated power generation from these projects
was 565 MW. WtE incineration was the largest category,
accounting for 276 MW.
Incineration (with
energy recovery)
27.7%
Biofuel
23.7%
Integrated/mixed
facilities
19.6%
Others
29.1%
Reported Capacity of Projects by Facility Type (w/e
4th Feb 2016)
To find out more information about the projects and investments
covered in this update, click here

Weekly Waste Projects Update – week ending 4th
February 2016
Weekly Waste Projects Update: week ending 4th
February 2016 Source: AcuComm Business Database
03
New Projects Reported by Waste Types (w/e 4th Feb 2016)
Number Capacity (tonnes) MW
Animal 1 45,359 2
Clinical - - -
Construction/Demolition - - -
e-Waste 1 30,000 -
Food - - -
Gas 3 - 27
Glass - - -
Hazardous - - -
Heat - - -
Industrial - - -
Metals - - -
MSW 17 4,163,489 233
Oil - - -
Organic (general/unspecified) 2 114,965 5
Other - - -
Paper - - -
Plant biomass (non-waste) - - -
Plant biomass (waste) 3 1,480,180 124
Plastics 2 29,093 -
Radioactive 3 331,509 -
Rubber - - -
Sewage/wastewater 2 23,193 5
Wood 9 1,430,219 170
Total 43 7,648,005 565
Municipal Solid Waste accounted for the largest
share of projects by feedstock type in the past
week, with an annualised figure of just under 4.2
million tonnes.
MSW
54.4%
Plant biomass
(waste)
19.4%
Wood
18.7%
Others
7.5%
Reported Capacity of Projects by Waste Type (w/e
4th Feb 2016)
To find out more information about the projects and investments
covered in this update, click here
Weekly Waste Projects Update – week ending 4th
February 2016
Weekly Waste Projects Update: week ending 4th
February 2016 Source: AcuComm Business Database
04
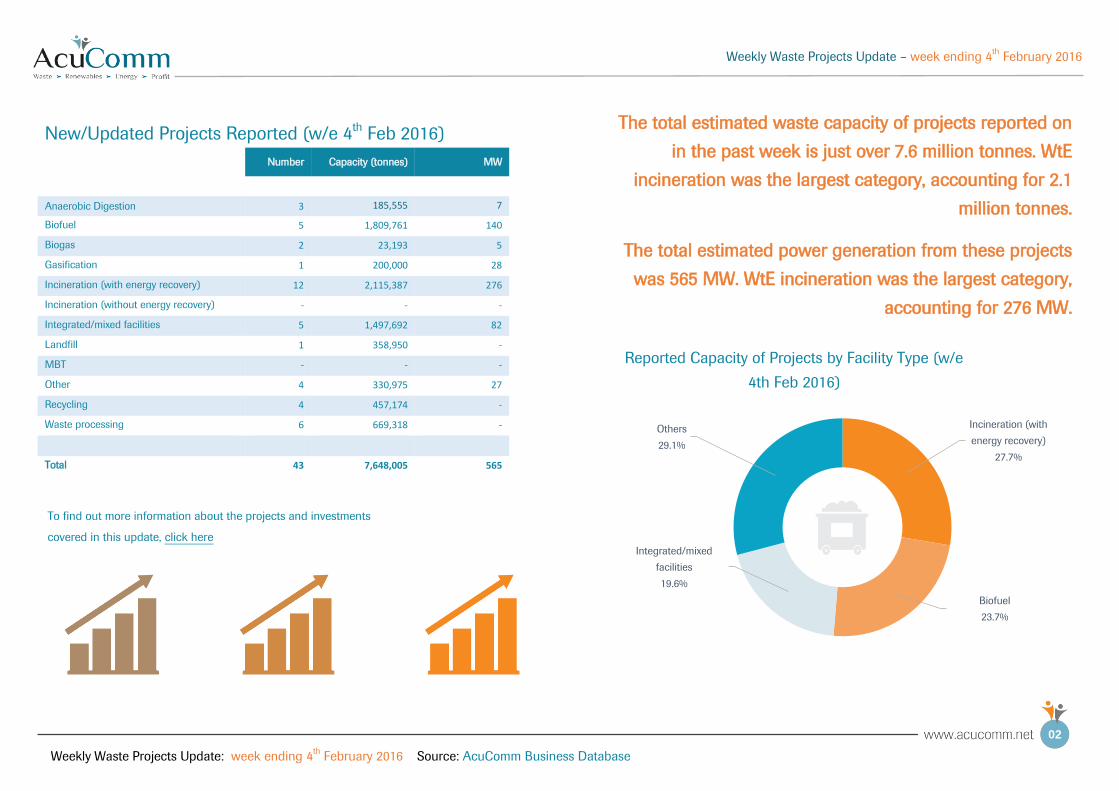
New/Updated Projects, Country Coverage, (w/e 4th Feb 2016)
Projects
USA 11
UK 5
India 3
Spain 3
Canada 2
Finland 2
France 2
Japan 2
Other 13
Total 43
The leading countries in the past week were the USA
with 11 projects, the UK with five projects and
India/Spain with three each.
11
5
3 3
2 2 2 2
13
0
2
4
6
8
10
12
14
US
A
UK
Ind
ia
Sp
ain
Can
ad
a
Fin
lan
d
Fra
nc
e
Jap
an
Oth
ers
Reported Projects by Country (w/e 4th Feb 2016)
To find out more information about the projects and investments
covered in this update, click here

Weekly Waste Projects Update – week ending 4th
February 2016
Weekly Waste Projects Update: week ending 4th
February 2016 Source: AcuComm Business Database
05
Average Project Values by Facility Type
US$ millions
Anaerobic Digestion 23
Biofuel 120
Biogas 27
Gasification 177
Incineration (with energy recovery) 106
Incineration (without energy recovery) 72
Integrated/mixed facilities 184
Landfill 23
MBT 67
Other 332
Recycling 27
Waste processing 70
All Projects 86
Average Project Values by Feedstock Type
US$ millions
Animal 19
Clinical 34
Construction/Demolition 9
e-Waste 26
Food 19
Gas 229
Glass 14
Hazardous 88
Heat 25
Industrial 117
Metals 41
MSW 95
Oil 57
Organic (general/unspecified) 86
Other 70
Paper 84
Plant biomass (non-waste) 105
Plant biomass (waste) 82
Plastics 16
Radioactive 642
Rubber 44
Sewage/wastewater 44
Wood 83
All Projects 86
The average waste project is worth US$86 million. There are naturally wide
variations in average project value, due to the size, duration and complexity
of different types of project. The figures on this page represent our latest
estimates, based on data from 2013 to the current week.
To find out more information about the projects and investments
covered in this update, click here

Weekly Waste Projects Update – week ending 4th
February 2016
Weekly Waste Projects Update: week ending 4th
February 2016 Source: AcuComm Business Database
06
Top Five Projects, week ending 4th February 2016, by Estimated Value (US$ millions) Click the flag for more information on each project
1 USA 1,600 Construction of a gas-to-gasoline facility.
2 Australia 1,462 Construction of a National Radioactive Waste Management Facility.
3 USA 667 Construction of 2 MW power oxidiser unit.
4 USA 667 Installation of a 5.6 MW fuel cell power generation system.
5 UK 509 Construction of a >250,000 tonne capacity WtE facility.
Top Five Projects, week ending 4th February 2016, by Reported Waste Capacity (tonnes)
1 UK 400,000 Construction of a >250,000 tonne capacity WtE facility.
2 USA 293,565 Construction of a resource recovery project including MRF/AD/biogas facilities.
3 India 255,865 Construction of a waste treatment facility.
4 UK 230,000 Construction of an MSW recycling centre.
5 UK 230,000 Construction of a 230,000 tpa municipal solid waste facility.
Top Five Projects, week ending 4th February 2016, by Reported Power Generation (MW)
1 Spain 40 Development of a 40 MW biomass plant.
2 Spain 35 Upgrading of biomass plant.
3 Finland 30 Installation of a 30 MW biomass plant.
4 UK 29 Construction of a >250,000 tonne capacity WtE facility.
5 UK 28 Development of an energy recovery facility.

acucomm.net 01243 788 [email protected]
Click here to take a look at the Renewables and Energy from Waste projects in
AcuComm’s Business db database