Embed Size (px)
Citation preview

Monsanto Cover Crop Program
Tim Recker Ryan Malloy, Chuck Kolbet

2014 Pilot Program
• Limited, one year program for 2014 Oelwein seed growers.
• Goal – encourage seed growers with limited cover crop experience to undertake the practice.
• Program details
– Monsanto shared the cost of cover crop seed planted on 2014 Oelwein seed fields
– Participants provided field practice information for tracking

Telling our story High-Yield and Conservation?
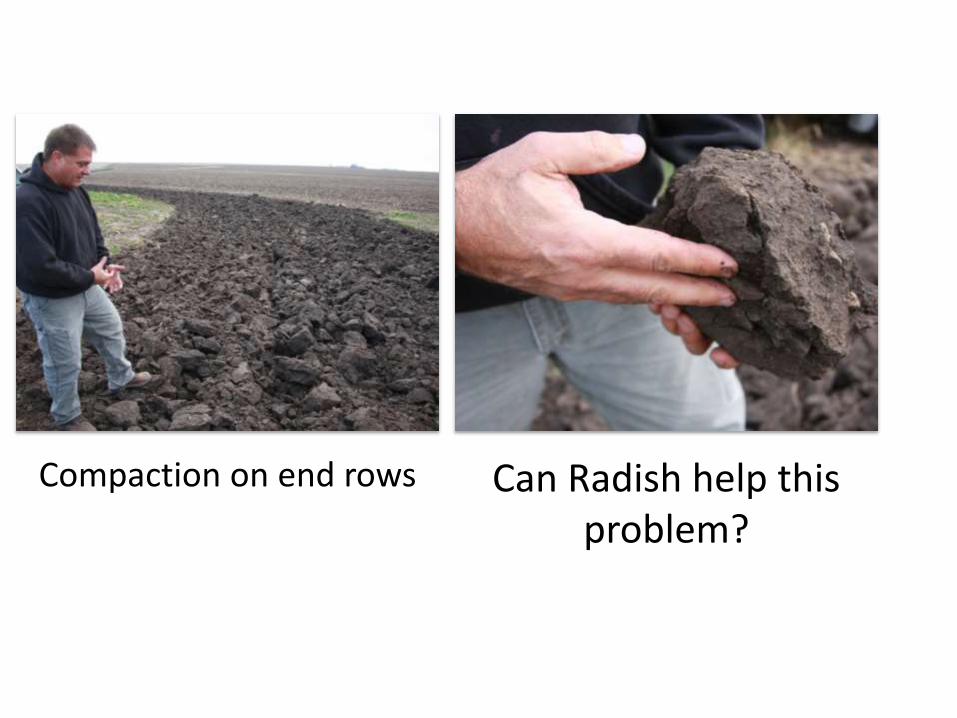
Compaction on end rows Can Radish help this problem?
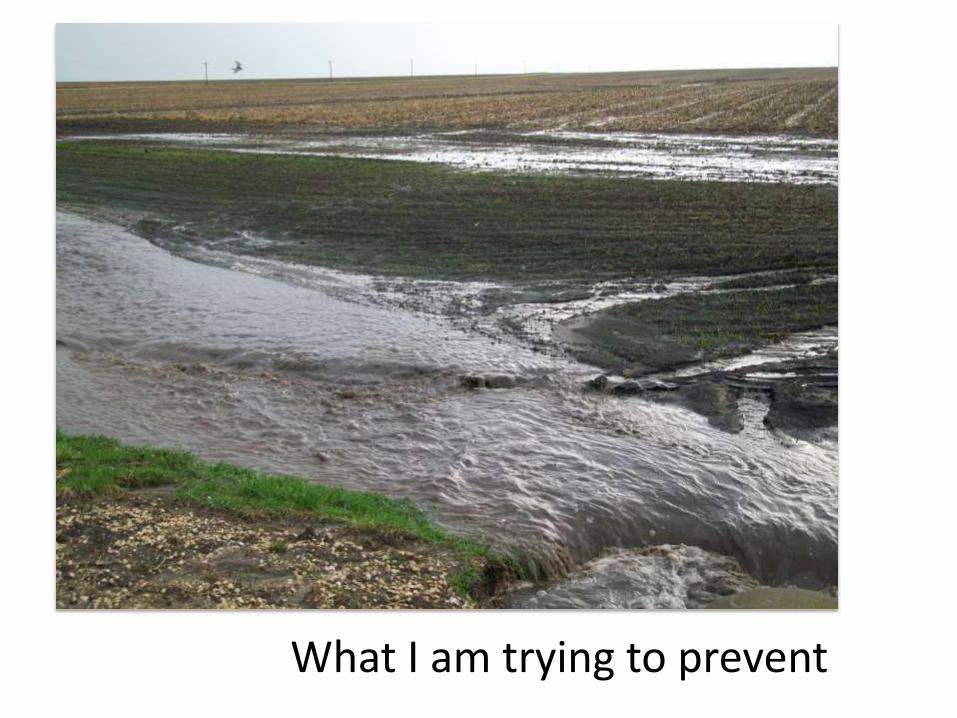
What I am trying to prevent

Proposed Benefits of Cover Crops
• Long-term soil health
• Erosion control
• Nutrient scavenging
• Ideal for seed production fields harvested in September
• Additional means to address compaction issues with seed fields.

Planting Headlands/Driveways
Broadcast Seeding Radish/Oat Mix. 70 Days After Planting
Incorporating Radish Early for Maximum Tillage Benefit. 81 Days After Planting

John Deere high clearance application
Male rows are cut out. This provides easy application for cover crops
Mixture of Oats, Radish, crop oil, and Potash

Planting Timing
9-8-14, 58 DAP 10-8-14, 28 DAP

Planting Method
Rye, Drilled 9-15-24, 51 DAPOats, broadcast after tillage, rolled. 9-24-14, 42 DAP

Planting Mixture
Rye planted in-field, radish/rye mix in headlands
Radish planted early in headlands, planted after harvest in field.

Seed Corn End Rows
Low Traffic area

Benefits of planting cover crops in Seed CornEasy to implementEliminated some mechanical tillage.Scavenge unused nitrogen and phosphorus.Natural living buffer around seed fields.Increase soil structure.Spring and fall erosion control.Help meet Iowa Nutrient Strategy.
*

Overall Comparison of Nitrate-N Practices
Nitrate-N
Reduction
Cost of N
Reduction
Other
Benefits
(Ecosystem
Services)
Practice/Scenario% (from
baseline)($/lb)
Reducing nitrogen application rate from
background to the MRTN9 -0.58
Cover crops (rye) on ALL CS and CC acres 28 5.96 ++
Install Wetlands to treat 45% of the ag acres 22 1.38 ++
Install Denitrification Bioreactors on all tile
drained acres18 0.92
Install Buffers on all applicable lands 7 1.91 ++
Installing Controlled Drainage on all
applicable acres2 1.29
Perennial crops (energy crops) on ~6.5
million acres18 21.46 ++

Example: Combination Scenarios that Achieve N and P Goal From Non-Point Sources
From Iowa Nutrient Reduction Strategy: Goals for Nonpoint Sources is 41% reduction on
Nitrogen and 29% reduction on Phosphorus
Nitrate-N
Reduction
Phosphorus
Reduction
Initial
Investment
Total Equal
Annualized
Cost
Statewide
Average EAC
Costs
Practice/Scenario% (from
baseline)
% (from
baseline)(million $)
(million
$/yr)($/acre)
MRTN Rate, 60% Acreage with
Cover Crop, 27% of ag land treated
with wetland and 60% of drained land
has bioreactor
42 30 3,218 756 36
MRTN Rate, 95% of acreage in
Cover Crops, 34% of ag land in
heavily tile drained land treated with
wetland, and 5% land retirement
42 50 1,222 1,214 58

Wetland in May Mississippi River
Water quality starts on my farm
No Silver Bullet in Achieving Soil and Water QualityMy Goal is to get 100% of watershed stakeholders to do
something new.

Summary• 18 of 27 seed fields in Oelwein have some portion of
their acres covered.
• Range of establishment success• Planting timing and weather • Experimenting with several cultural practices
• Best Practices• Plant at earliest opportunity
– End rows early, in-field after harvest
• Increase seed-to-soil contact – Drilling vs. spreading– Tillage incorporation

Monsanto Effort
Questions?