Embed Size (px)
Citation preview

POPULATION DYNAMICS,
CARRYING CAPACITY, AND
CONSERVATION BIOLOGY
The Walker School
Environmental Science

Population Ecology
The study of individual
species in relation to the
environment.
The field is concerned
with conservation and
focuses on Population and
Population Viability
Analysis (PVA)

Population Viability Analysis
A species-specific method of risk assessment.
Brings together species characteristics and environmental variability to forecast population health and extinction risk.
Begins with the question: “Is this species at risk of becoming endangered? If so, why?”.
A research example may include: “What are the effects of industrial forestry on biodiversity.”

WHAT ARE THE MAJOR
CHARACTERISTICS OF A
POPULATION?

Populations
A group of individuals of a single species that
simultaneously occupy the same general area.

Populations Under Study
Diseases (prions, viruses, bacteria)
Vegetation (crops, orchards, forests)
Terrestrial Animals (cattle, sheep, pigs, chickens)
Aquatic Organisms (fish, shrimp)
Humans

HIV Population in South Africa
Arcview GIS

Characteristics of Populations
Distribution
Numbers (size)
Age Structure
Density (#/area)
Celestichthys

WHAT IS BIOGEOGRAPHY?

Biogeography
The study of the size and
distribution of biodiversity
over space and time. It
aims to reveal where
organisms live, and at
what abundance.
Giant Pandas

Factors Explaining Species Distributions
Speciation
Extinction
Continental drift
Glaciations
(associated variations
in sea level, river
routes)
River capture

Speciation & Population Types
Ranges
Physical Structures
Food Resources

Paleobiogeography
goes one step further
to include
paleogeographic data
and considerations of
plate tectonics.
Uses molecular
analyses and fossils to
determine the change
in a species over
millions of years.Hominid Evolution

HOW ARE POPULATIONS
TRACKED?

Mark-Recapture Method
A method commonly used in ecology to estimate population
size and population vital rates (i.e., survival, movement, and
growth)

The Process
1. Researcher visits a study area and uses traps to capture a group of individuals alive.
2. Captured animals are marked with tags, collars, bands, or spots of dye and then is released unharmed back into the environment.
3. Sufficient time is allowed to pass for the marked individuals to redistribute themselves among the unmarked population.
4. Next, the researcher returns and captures another sample of individuals.
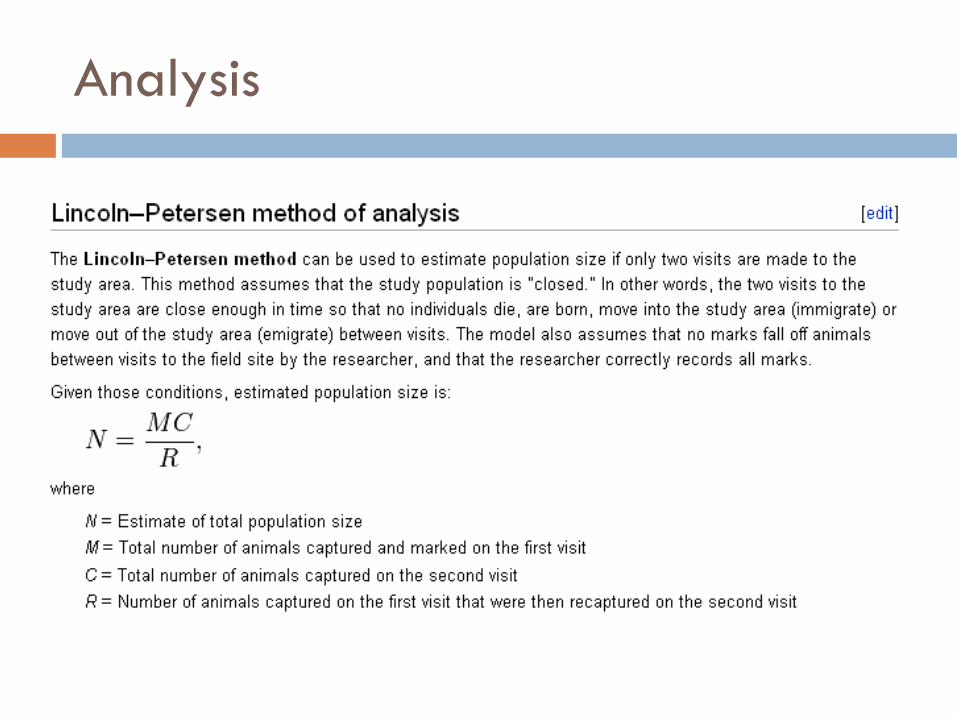
Analysis

WHAT FACTORS GOVERN
CHANGES IN POPULATION
SIZE?

Demography
The study of the vital statistics that affect population
size.•Size•Density•Age Distribution•Dispersion

Clumped
(elephants)
Uniform
(creosote bush)
Random
(dandelions)
Population Dispersion Patterns

Factors Affecting Distribution
Competition for
Resources
Predation
Parasitism
Infectious Disease
Floods
Hurricanes
Unseasonable
Weather
Fire
Clear Cutting
Pesticide Spraying
Density Dependant Density Independent

Changing and Clumping
Availability and variation
of resources
Provide protection in
numbers
Packs have a better
chance of obtaining food
Temporary groups for
mating
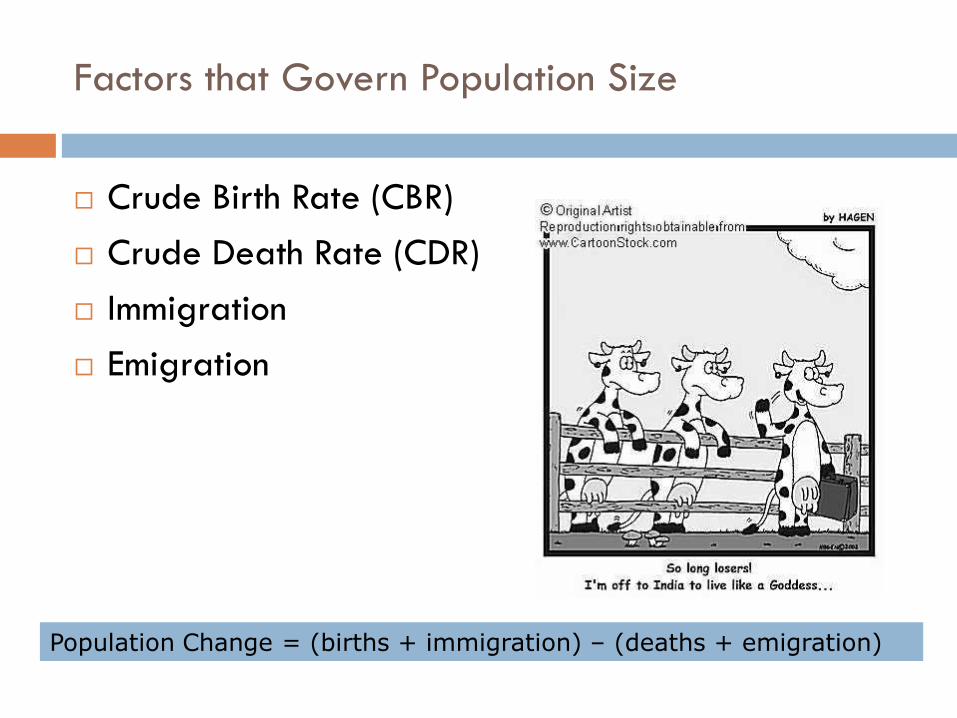
Factors that Govern Population Size
Crude Birth Rate (CBR)
Crude Death Rate (CDR)
Immigration
Emigration
Population Change = (births + immigration) – (deaths + emigration)

Population Age Structures

WHAT LIMITS POPULATION
GROWTH?

Resources and Competitors
Biotic Potential (r)
Ecosystem Carrying
Capacity (K)
Rate of Increase
Environmental
Resistance
Carrying Capacity

© 2004 Brooks/Cole – Thomson Learning
Time (t) Time (t)
Po
pu
lati
on
siz
e (
N)
Po
pu
lati
on
siz
e (
N)
K
Exponential Growth Logistic Growth
Population Growth Curves:
J-Curve & S-Curve

2.0
1.5
1.0
.5
Nu
mb
er
of
sh
eep
(m
illi
on
s)
1800 1825 1850 1875 1900 1925
Year
Population growth strives for dynamic equilibrium:
Logistic Growth of a Sheep
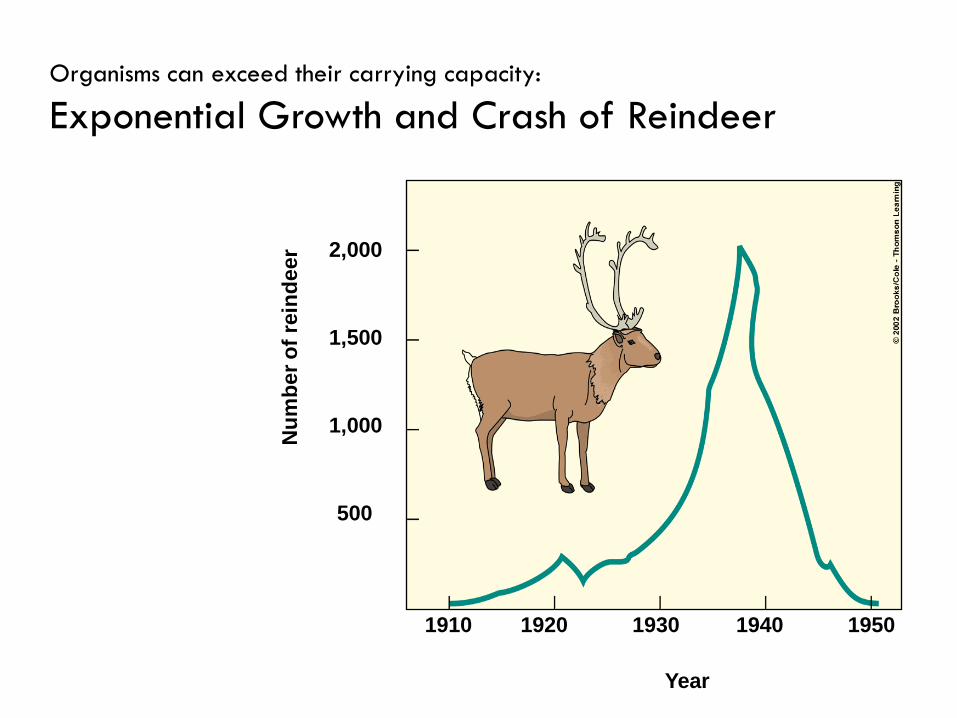
2,000
1,500
Nu
mb
er
of
rein
de
er
1910 1920 1930 1940 1950
Year
1,000
500
Organisms can exceed their carrying capacity:
Exponential Growth and Crash of Reindeer

Reasons for Diebacks
Catastrophic Loss of Resources
Introduction of New Predator
Disease

WHAT KINDS OF POPULATION
CHANGE CURVES DO WE FIND
IN NATURE?

© 2004 Brooks/Cole – Thomson Learning
Nu
mb
er
of
ind
ivid
ua
ls
Time
Irruptive
Stable
Cyclic
Irregular
General Types of Population Curves in Nature

Po
pu
lati
on
siz
e (
tho
us
an
ds
)
160
140
120
100
80
60
40
20
01845 1855 1865 1875 1885 1895 1905 1915 1925 1935
Year
Hare
Lynx
Cycles in Hare and Lynx
Populations

Community Organization –
Trophic Cascade Model
Postulates that it is mainly predation that controls
community organization
Predators control herbivores
Community Organization –
Bottom-Up Model
Mineral nutrients control community organization
Nutrients control plant types and numbers
Plants control predators
Changes in this community are done by adding or
removing minerals

Activity: Radio Expeditions
Species Extinctions
Audio Evidence of Ivory-Billed Woodpecker
http://www.npr.org/templates/story/story.php?storyId=4814860
Audubon Bird Count, Lost Woodpecker Rediscovered
http://www.npr.org/templates/story/story.php?storyId=5067655
Slate's Explainer: Determining Species Extinction
http://www.npr.org/templates/story/story.php?storyId=5015201

Activity: Radio Expeditions
Species Extinctions Questions
Populations are classified by size, density, age distribution, and dispersion type. Briefly explain each of these concepts and describe one environmental factor that would limit the population growth of a bird species.
Discuss the difference between an endangered and a threatened species.
Design a population count experiment to determine if a bird population is threatened or endangered. Make sure to discuss how the study area was selected and what method will be used to estimate population.
Discuss one biological intervention, economic incentive and one legislative policy to restore an endangered bird population.
Discuss what technology could be used to periodically monitor the program.

WHAT TYPE OF
REPRODUCTIVE PATTERNS DO
SPECIES HAVE?

Sexual Partners Are Not Always Needed
Asexual Reproduction
Sexual Reproduction

Sexual Reproduction Methods
Semelparity
Onetime reproductive event
Iteroparity
Repeated reproduction

Many small offspring
Little or no parental care and protection of offspring
Early reproductive age
Most offspring die before reaching reproductive age
Small adults
Adapted to unstable climate and environmental
conditions
High population growth rate (r)
Population size fluctuates wildly above and below
carrying capacity (K)
Generalist niche
Low ability to compete
Early successional species
r-Selected Species
cockroach dandelion
General Characteristics of r-Selected Species

Fewer, larger offspring
High parental care and protection of offspring
Later reproductive age
Most offspring survive to reproductive age
Larger adults
Adapted to stable climate and environmental
conditions
Lower population growth rate (r)
Population size fairly stable and usually close
to carrying capacity (K)
Specialist niche
High ability to compete
Late successional species
elephant saguaro
K-Selected Species
General Characteristics of k-Selected Species
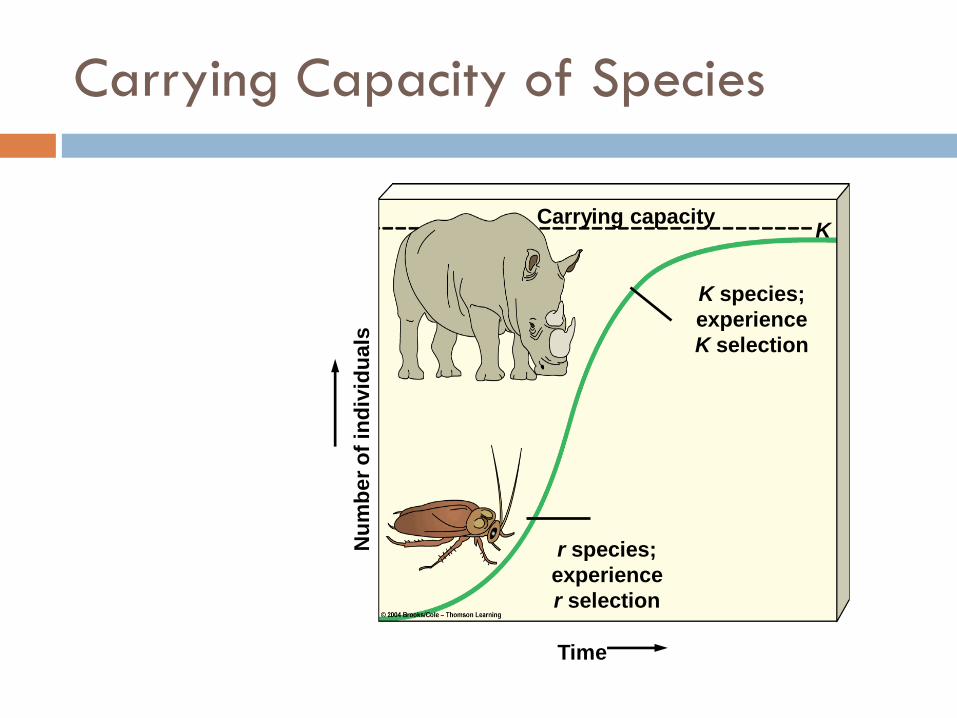
Carrying Capacity of Species
Nu
mb
er
of
ind
ivid
ua
ls
Time
Carrying capacity
K species;
experience
K selection
r species;
experience
r selection
K

WHAT ROLE DOES GENETICS
PLAY IN THE SIZE OF
POPULATIONS?

Vulnerability of Populations
Founders Effect Results from the migration of a population to a geographically
isolated area.
Demographic Bottleneck Results from a natural catastrophe such as fire or a hurricane.
Genetic Drift Results from random changes in the gene frequencies in a population.
Interbreeding Results when individuals from a small population breed with each
other.

HOW DO ECOLOGISTS USE
LIFE TABLES AND
SURVIVORSHIP CURVES TO
MONITOR POPULATIONS?

Death Will Come:
Survivorship Curves
Late Loss
Early Loss
Constant LossP
erc
en
tag
e s
urv
ivin
g (
log
scale
)
100
10
1
0
Age

Life Table
Life Expectancy at Birth of Epidemic Malaria Area in Papua New Guinea
An age-specific summary of the
survival pattern of a population.
Life tables are constructed by
following a cohort from birth to
death.
A cohort is a group of individuals
of the same age.
The table is constructed from the
number of individuals that die in
each age-group during a
defined time period.
Life tables are graphically
displayed in survivorship curves.

Geographical Information SystemsUsed to Map Population Data
Captures, stores, analyzes,
manages, and presents data
that refers to or is linked to
location.
Geographic information system
technology can be used for
scientific investigations for the
environmental science,
environmental impact
assessment, urban planning and
other purposes.
Can be used for spacial
analysis and data modeling.


