Embed Size (px)
Citation preview
Technical Assistance Consultant’s Final Report
This consultant’s report does not necessarily reflect the views of ADB or the Government concerned, and ADB and the Government cannot be held liable for its contents. (For project preparatory technical assistance: All the views expressed herein may not be incorporated into the proposed project’s design.
Project Number: 43295 December 2011
Socialist Republic of Viet Nam: Climate Change Impact and Adaptation Study in the Mekong Delta (Cofinanced by the Climate Change Fund and the Government of Australia)
Prepared by Peter Mackay and Michael Russell
Sinclair Knight Merz (SKM)
Melbourne, Australia
For Vietnam Institute of Meteorology, Hydrology and Environment (IMHEN), the Ca Mau Peoples Committee and the Kien Giang Peoples Committee

Ca Mau Peoples Committee
Institute of Meteorology, Hydrology and Environment
Climate Change Impact and
Adaptation Study in
The Mekong Delta – Part A
Final Report
Kien Giang Peoples Committee
Climate Change Vulnerability & Risk
Assessment Study for Ca Mau and Kien Giang
Provinces, Vietnam

Ca Mau Peoples Committee
Kien Giang Peoples Committee
Institute of Meteorology, Hydrology and Environment
Climate Change Impact and Adaptation Study in The Mekong Delta – Part A
Final Report
Climate Change Vulnerability & Risk Assessment Study for Ca Mau and Kien Giang Provinces,
Vietnam
December 2011

Climate Change Impact and Adaptation Study in Mekong Delta – Part A
PAGE i
FOREWORD

Climate Change Impact and Adaptation Study in Mekong Delta – Part A
PAGE i
CONTENTS
ABBREVIATIONS AND ACRONYMS ........................................................................................................... VII
KEY TERMS ................................................................................................................................................. IX
EXECUTIVE SUMMARY ................................................................................................................................ X
1. INTRODUCTION .................................................................................................................................. 1
1.1 PURPOSE OF THIS STUDY ......................................................................................................................... 1 1.2 THE REGIONAL CONTEXT ......................................................................................................................... 1
1.2.1 The Mekong Delta ........................................................................................................................ 3 1.2.2 Socio-Economic Context ............................................................................................................... 4 1.2.3 Sectoral Growth and Diversification ............................................................................................. 4 1.2.4 The Agriculture Sector .................................................................................................................. 6 1.2.5 Industry Sector .............................................................................................................................. 7 1.2.6 Energy Sector ................................................................................................................................ 8 1.2.7 Urban Settlements ........................................................................................................................ 9 1.2.8 Transport ...................................................................................................................................... 9
2. CVRA APPROACH AND METHODOLOGY ............................................................................................ 11
2.1 CONCEPTUAL FRAMEWORK ................................................................................................................... 11 2.2 EVALUATING VULNERABILITIES ............................................................................................................... 13
2.2.1 Key Sectors ................................................................................................................................. 14 2.2.2 Vulnerability Indicators .............................................................................................................. 15 2.2.3 Analysing Adaptive Capacity ...................................................................................................... 18 2.2.4 Control Measures ....................................................................................................................... 19 2.2.5 Vulnerability Profiles .................................................................................................................. 20 2.2.6 Mapping Vulnerability ................................................................................................................ 21 2.2.7 The Adaptation Assessment Process .......................................................................................... 22
2.3 IDENTIFYING AND ANALYSING FUTURE RISK .............................................................................................. 24
3. CLIMATE CHANGE ............................................................................................................................. 28
3.1 CLIMATE IN THE MEKONG DELTA ............................................................................................................ 28 3.1.1 Observed Changes ...................................................................................................................... 28
3.2 GLOBAL CLIMATE CHANGE .................................................................................................................... 34 3.2.1 Climate Change and Emission Scenarios .................................................................................... 34
3.3 CLIMATE MODELS AND DOWNSCALING .................................................................................................... 35 3.3.1 Modelling used in the Project ..................................................................................................... 36
3.4 FUTURE CLIMATE CHANGE SCENARIOS (2030 AND 2050) .......................................................................... 40 3.4.1 Temperature ............................................................................................................................... 40 3.4.2 Rainfall ....................................................................................................................................... 41 3.4.3 Sea Level Rise.............................................................................................................................. 43 3.4.4 Wind Speed ................................................................................................................................. 44 3.4.5 Other Climatic Factors ................................................................................................................ 44 3.4.6 Model Discrepancies ................................................................................................................... 45
3.5 CLIMATE CHANGE IMPACT ASSESSMENTS .................................................................................................. 45 3.5.1 Hydrology and water resources .................................................................................................. 45 3.5.2 Coastal impacts .......................................................................................................................... 46
4. CA MAU PROVINCE ........................................................................................................................... 47
4.1 POPULATION AND PEOPLE ..................................................................................................................... 47 4.1.1 Socially Vulnerable Groups ......................................................................................................... 51 4.1.2 Poverty Incidence ....................................................................................................................... 52 4.1.3 Unemployment ........................................................................................................................... 53 4.1.4 Health ......................................................................................................................................... 53

Climate Change Impact and Adaptation Study in Mekong Delta – Part A
PAGE ii
4.1.5 Education .................................................................................................................................... 55 4.2 PROVINCIAL DEVELOPMENT CONTEXT ...................................................................................................... 56 4.3 LANDUSE ........................................................................................................................................... 57 4.4 AGRICULTURE ..................................................................................................................................... 59
4.4.1 Cropping and Livestock ............................................................................................................... 59 4.4.2 Aquaculture ................................................................................................................................ 60 4.4.3 Fisheries ...................................................................................................................................... 61 4.4.4 Water resources ......................................................................................................................... 62 4.4.5 Natural areas, biodiversity and forests ...................................................................................... 62
4.5 INDUSTRY ........................................................................................................................................... 63 4.5.1 Seafood Processing ..................................................................................................................... 63 4.5.2 Ship Building ............................................................................................................................... 64 4.5.3 Other Industrial Sectors .............................................................................................................. 65 4.5.4 Tourism ....................................................................................................................................... 66
4.6 ENERGY ............................................................................................................................................. 67 4.6.1 Ca Mau Gas-Power-Fertilizer Complex ....................................................................................... 67 4.6.2 Electricity Transmission and Distribution System ....................................................................... 69 4.6.3 Other Energy Sources ................................................................................................................. 72
4.7 TRANSPORT SYSTEM ............................................................................................................................. 73 4.7.1 Roads .......................................................................................................................................... 76 4.7.2 Airports ....................................................................................................................................... 76
4.8 URBAN SETTLEMENTS ........................................................................................................................... 77 4.8.1 Urban Utilities............................................................................................................................. 78
5. KIEN GIANG PROVINCE ..................................................................................................................... 81
5.1 POPULATION AND PEOPLE ..................................................................................................................... 81 5.1.1 Socially Vulnerable Groups ......................................................................................................... 86
5.2 PROVINCIAL DEVELOPMENT CONTEXT ...................................................................................................... 90 5.3 LANDUSE ........................................................................................................................................... 92 5.4 AGRICULTURE ..................................................................................................................................... 92
5.4.1 Cropping and Livestock ............................................................................................................... 94 5.4.2 Aquaculture and Fisheries .......................................................................................................... 95 5.4.3 Fisheries ...................................................................................................................................... 96 5.4.4 Water resources ......................................................................................................................... 98 5.4.5 Natural areas, biodiversity and forests ...................................................................................... 99
5.5 INDUSTRY ......................................................................................................................................... 100 5.5.1 Construction Materials Manufacturing .................................................................................... 101 5.5.2 Seafood Processing ................................................................................................................... 103 5.5.3 Tourism ..................................................................................................................................... 104 5.5.4 Other Industries ........................................................................................................................ 104
5.6 ENERGY ........................................................................................................................................... 106 5.6.1 Future Plans .............................................................................................................................. 108
5.7 TRANSPORT ...................................................................................................................................... 110 5.7.1 Roads and Ports ........................................................................................................................ 111
5.8 URBAN SETTLEMENTS ......................................................................................................................... 111 5.8.1 Urban Utilities........................................................................................................................... 111 5.8.2 Urban Drainage, Sewage Disposal and Solid Waste ................................................................ 112
6. EFFECTS ON NATURAL SYSTEMS ..................................................................................................... 114
6.1 THE EFFECTS OF SEA LEVEL RISE ........................................................................................................... 114 6.2 THE EFFECTS OF FLOODING AND INUNDATION ......................................................................................... 114 6.3 THE EFFECTS OF DROUGHT .................................................................................................................. 123 6.4 EFFECTS OF SALINITY AND SALINE INTRUSION .......................................................................................... 123 6.5 EFFECTS OF TYPHOONS AND STORM SURGE ............................................................................................ 128
6.5.1 Exposure to Typhoons............................................................................................................... 128

Climate Change Impact and Adaptation Study in Mekong Delta – Part A
PAGE iii
6.5.2 Typhoon Simulations ................................................................................................................ 130 6.5.3 Storm Surge .............................................................................................................................. 131
6.6 COASTAL SEDIMENTATION AND EROSION ............................................................................................... 132 6.6.2 Effects on Coastal Conditions ................................................................................................... 134 6.6.3 Other Effects ............................................................................................................................. 137
6.7 SYNTHESIS OF THE CLIMATE CHANGE IMPACTS ON NATURAL SYSTEMS ......................................................... 138
7. VULNERABILITY, RISK AND HOTSPOT ANALYSIS .............................................................................. 140
7.1 VULNERABILITY.................................................................................................................................. 140 7.1.1 Population Vulnerability ........................................................................................................... 141 7.1.2 Poverty Vulnerability ................................................................................................................ 145 7.1.3 Agriculture and Livelihoods Vulnerability ................................................................................. 149 7.1.4 Industry and Energy Vulnerability ............................................................................................ 159 7.1.5 Urban Settlements and Transport Vulnerability ....................................................................... 166
7.2 RISKS............................................................................................................................................... 175 7.2.1 Population; Hotspots ................................................................................................................ 176 7.2.2 Poverty; Hotspots ..................................................................................................................... 177 7.2.3 Agriculture and Livelihoods; Hotspots ...................................................................................... 178 7.2.4 Industry and Energy Impacts, Hotspots .................................................................................... 180 7.2.5 Urban Settlements and Transport; Hotspots ............................................................................ 181 7.2.6 Summary of District and Sectoral Hotspots .............................................................................. 182
7.3 SYNTHESIS OF REGIONAL VULNERABILITIES ............................................................................................. 184
8. INSTITUTIONAL CAPACITY ............................................................................................................... 187
8.1 NATIONAL INSTITUTIONS ..................................................................................................................... 187 8.1.1 Agriculture and Natural Resource Management ..................................................................... 187 8.1.2 Infrastructure Planning............................................................................................................. 188
8.2 NATIONAL PLANS AND PROJECTIONS ..................................................................................................... 189 8.2.1 The National Target Program ................................................................................................... 189 8.2.2 Sectoral Plans ........................................................................................................................... 190 8.2.3 Disaster management .............................................................................................................. 194
8.3 PROVINCIAL DEPARTMENTS ................................................................................................................. 196 8.3.2 Urban Settlements and Transport ............................................................................................ 197 8.3.3 Industry and energy sector. ...................................................................................................... 198
8.4 DISTRICT LEVEL ................................................................................................................................. 200 8.4.1 Agriculture and Livelihood ........................................................................................................ 200 8.4.2 Urban Settlements and Transport ............................................................................................ 201
8.5 SURVEY RESULTS ............................................................................................................................... 201 8.6 LOCAL LEVEL ..................................................................................................................................... 203 8.7 SUMMARY OF INSTITUTIONAL CAPACITY IN THE AREA OF CLIMATE CHANGE ADAPTATION .................................. 204
8.7.1 Measures of Capacity ............................................................................................................... 205
9. KEY FINDINGS & RECOMMENDATIONS ........................................................................................... 207
9.1 CLIMATE CHANGE PROJECTIONS ........................................................................................................... 207 9.1.1 Climate parameters .................................................................................................................. 207 9.1.2 Sea Level Rise & Inundation...................................................................................................... 207
9.2 VULNERABILITY TO CLIMATE CHANGE .................................................................................................... 207 9.2.1 Sea Level Rise & Storm Surge ................................................................................................... 208 9.2.2 Increased Damage to Coastal Areas ......................................................................................... 208 9.2.3 Risks to Population and People ................................................................................................ 208 9.2.4 Risks to Agriculture and Livelihoods ......................................................................................... 209 9.2.5 Risks to Urban Settlements & Transport .................................................................................. 210 9.2.6 Risks to Industry and Energy..................................................................................................... 212 9.2.7 Uncertainties & Unexpected Events ......................................................................................... 213
9.3 FUTURE CHALLENGES ......................................................................................................................... 214

Climate Change Impact and Adaptation Study in Mekong Delta – Part A
PAGE iv
9.4 SUGGESTED ADAPTATION THEMES ........................................................................................................ 214
10. REFERENCES ............................................................................................................................... 217
11. APPENDICES ............................................................................................................................... 221
APPENDIX 1. SUGGESTED VULNERABILITY INDICATORS AS RECOMMENDED BY INTERNATIONAL EXPERTS. ......................... 221 APPENDIX 2. SUMMARY CLIMATE VULNERABILITY ASSESSMENT – INDUSTRY ASSETS ................................................... 224 APPENDIX 3. SUMMARY CLIMATE VULNERABILITY ASSESSMENT – ENERGY ASSETS ...................................................... 225 APPENDIX 4. EXTREME PRECIPITATION EVENT ANALYSIS BASED ON GCM DAILY DATA ................................................... 227 APPENDIX 5. DETAILS OF MEETINGS WITH PROVINCE OFFICIALS .............................................................................. 231 APPENDIX 6. DETAILS OF WORKSHOP PARTICIPANTS ............................................................................................. 237 APPENDIX 7. OTHER ADAPTATION PROJECTS IN THE DELTA ..................................................................................... 239 APPENDIX 8. TA AND CONSULTANT TORS ........................................................................................................... 242

Climate Change Impact and Adaptation Study in Mekong Delta – Part A
v | P a g e
ACKNOWLEDGEMENTS
The Asian Development Bank (ADB) engaged Sinclair Knight Merz (SKM), in association with the Center for Environmental Research (CENRE) under the Vietnam Institute of Meteorology, Hydrology and Environment (IMHEN), Acclimatise and University of Newcastle, Australia to undertake ‘Part A’ of the AusAID funded Climate Change Impact and Adaptation Study in the Mekong Delta (TA 7377 – VIE).
This report presents information from Ca Mau and Kien Giang provinces together with modelling and GIS outputs from IMHEN. Provincial and district authorities supplied intensive survey data and made staff available for interviews. The Kien Giang PPC and the Ca Mau PPC and district departments contributed to the inception and mid project workshops. The department of DARD in Ca Mau and the Departments of DARD and DONRE in Kien Giang allocated contact persons who organized data and accompanied team members on trips to visit key locations/projects relating to the subject of the working paper.
The report was compiled by Peter Mackay and Michael Russell and relies heavily on working papers produced by the international assessment experts. The report represents a considerable effort from a dedicated team:
Peter Mackay Team Leader SKM Duong Hong Son Deputy Team Leader IMHEN Michael Russell CC Assessment Specialist (Agriculture & Natural Resources) ;
Data Coordinator; Atlas Editor SKM
Hoang Minh Tuyen CC Assessment Specialist (Agriculture & Natural Resources) IMHEN Hoang Duc Cuong Climate Change Prediction Modeller IMHEN Dam Duy Hung Climate Change Prediction Modeller IMHEN Anthony Kiem Climate Change Prediction Modeller University of Newcastle Hoang Van Dai GIS Expert IMHEN Ian Hamilton CC Assessment Specialist (Transport & Urban Planning) SKM Dinh Thai Hung CC Assessment Specialist (Transport & Urban Planning) IMHEN Frank Pool CC Assessment Specialist (Energy & Industry) SKM Tran Thi Dieu Hang CC Assessment Specialist (Energy & Industry) IMHEN Ronny Venegas Carbonell CC Assessment Specialist (Socio-Economic Issues) SKM Ngo Thi Van Anh CC Assessment Specialist (Socio-Economic Issues) IMHEN Nguyen Thi Hang Nga Secretary IMHEN Le Ha Phuong Interpreter/Translator IMHEN Lucinda Phelps Assistant Coordinator SKM Sonya Sampson SKM Project Manager SKM Aman Mehta SKM Project Director SKM Nguyet Mai Administrator IMHEN Cover Photo; M. Russell.

Climate Change Impact and Adaptation Study in Mekong Delta – Part A
vi | P a g e
DISCLAIMER
This report was prepared by agents on behalf of Vietnam Institute of Meteorology, Hydrology and Environment (IMHEN), The Ca Mau Peoples Committee and The Kien Giang Peoples Committee through The Asian Development Bank. Although all effort is made to ensure that the information, opinions and analysis contained in this document are based on sources believed to be reliable - no representation, expressed or implied, is made guaranteeing accuracy, completeness or correctness. The boundaries, colours, denominations, and other information shown on any map in this work do not imply any judgment on the part of the Authors concerning the legal status of any territory or the endorsement or acceptance of such boundaries.
Neither Australian Aid; Asian Development Bank; IMHEN; Ca Mau PPC; Kien Giang PPC nor any agency thereof; their employees; contractors; subcontractors or their employees; assumes any legal liability or responsibility for the consequences of any third party’s use of the information, opinions and analysis contained in this report.
Cite as
IMHEN, Ca Mau Peoples Committee, and Kien Giang Peoples Committee (2011). Climate Change Impact and Adaptation Study in The Mekong Delta – Part A Final Report: Climate Change Vulnerability and Risk Assessment Study for Ca Mau and Kien Giang Provinces, Vietnam. Institute of Meteorology, Hydrology and Environment (IMHEN), Hanoi, Vietnam.

Climate Change Impact and Adaptation Study in Mekong Delta – Part A
vii | P a g e
Abbreviations and Acronyms ADB Asian Development Bank AusAID Australian Agency for International Development CCFSC Central Committee for Flood and Storm Control CENRE Center for Environmental Research (Under IMHEN) CRU Climate Research Unit CSIRO Commonwealth Scientific & Industrial Research Organisation (Australia) DARD Department of Agriculture and Rural Development DDMFSC Department of Dyke Management and Flood and Storm Control DOIT Department of Industry and Trade DONRE Department of Natural Resources and Environment DoPI Department of Planning and Investment DOST Department of Science and Technology DOT Department of Transport DWRM Department of Water Resource Management ENSO El Nino-Southern Oscillation FAO Food and Agriculture Organization FICEN Fisheries Information Centre FMMP The MRC’s Flood Management and Mitigation Program GIS Geographic Information System GIZ Deutsche Gesellschaft für Internationale Zusammenarbeit IMHEN Institute of Meteorology, Hydrology and Environment IPCC Intergovernmental Panel on Climate Change IRRI International Rice Research Institute JICA Japanese International Cooperation Agency MARD Ministry of Agriculture and Rural Development (Viet Nam) MoC Ministry of Construction MoF Ministry of Finance MoFI Ministry of Fisheries MoIT Ministry of Industry and Trade MoND Ministry of National Defence MoNRE Ministry of Natural Resources and Environment MoST Ministry of Science and Technology MoT Ministry of Transportation MPI Ministry of Planning and Investment MRC Mekong River Commission MRCS Mekong River Commission Secretariat MRD Mekong River Delta NAPA National Adaptation Program of Action. NCAR National Centre for Atmospheric Research NCEP National Centre for Environmental Prediction NTP National Target Program NWRC National Water Resources Council PPC People’s Party Committee

Climate Change Impact and Adaptation Study in Mekong Delta – Part A
viii | P a g e
ROMS Regional Oceanographic Modelling System SKM Sinclair Knight Merz SLR Sea Level Rise TA Technical Assistance UNDP United Nations Development Program UNIDO United Nations Industrial Development Organisation VNMC Vietnam National Mekong Committee VRSAP Vietnam River System and Plains model WMO World Meteorological Organization

Climate Change Impact and Adaptation Study in Mekong Delta – Part A
ix | P a g e
Key Terms Adaptation Actions taken in response to actual or projected climate change and impacts that lead to a
reduction in risks or a realization of benefits. A distinction can be made between a planned or anticipatory approach to adaptation (i.e. risk treatments) and an approach that relies on unplanned or reactive adjustments.
Adaptive capacity
The capacity of an organization or system to moderate the risks of climate change or to realise benefits, through changes in its characteristics or behaviour. Adaptive capacity can be an inherent property or it could have been developed as a result of previous policy, planning or design decisions of the organisation.
Climate change
Climate change refers to a change of climate that is attributed directly or indirectly to human activity that alters the composition of the global atmosphere and that is in addition to natural climate variability observed over comparable time periods (United Nations Framework Convention on Climate Change).
Climate scenario
A coherent, plausible but often simplified description of a possible future climate (simply, average weather). A climate scenario should not be viewed as a prediction of the future climate. Rather, it provides a means of understanding the potential impacts of climate change, and identifying the potential risks and opportunities created by an uncertain future climate.
Climatic vulnerability
Climatic vulnerability is defined by the IPCC as “the degree to which a system is susceptible to, and unable to cope with, adverse effects of climate change, including climate variability and extremes. Vulnerability is a function of the character, magnitude, and rate of climate change and variation to which a system is exposed, its sensitivity, and its adaptive capacity”.
Hazard A physically defined source of potential harm, or a situation with a potential for causing harm, in terms of human injury; damage to health, property, the environment, and other things of value; or some combination of these.
Mitigation A human intervention to actively reduce the production of greenhouse gas emissions (reducing energy consumption in transport, construction, at home, at work, etc.), or to remove the greenhouse gases from the atmosphere (sequestration).
Resilience A measure of the current ability of a community to resist, absorb, and recover from the effects of hazards, by quickly preserving or restoring its essential basic structures, functions and identity.
Risk Risk is defined in general terms as the product of the frequency (or likelihood) of a particular event and the consequence of that event, be it in terms of lives lost, financial cost and/or environmental impact.
Sensitivity Refers to the degree to which a system is affected, either adversely or beneficially, by climate related variables including means, extremes and variability.
Exposure Defines the likelihood of a community being affected by a hazard. This is determined by GIS modelling and mapping of the predicted extent of hazards.
Vulnerability Vulnerability is a function of risk and response capacity. It is a combination of the physical parameter of the hazards and its consequences such as personal injuries, degradation of buildings and infrastructure and functional perturbations. It may vary depending on non physical factors such as emergency preparation, education and recovery capacity.

Climate Change Impact and Adaptation Study in Mekong Delta – Part A
x | P a g e
EXECUTIVE SUMMARY Overview
The Asian Development Bank (ADB) engaged Sinclair Knight Merz (SKM), in association with Center for Environmental Research (CENRE) under the Vietnam Institute of Meteorology, Hydrology and Environment (IMHEN), Acclimatise and University of Newcastle, Australia to undertake ‘Part A’ of the Climate Change Impact and Adaptation Study in the Mekong Delta (TA 7377 – VIE).
This Report is one of two products that represent the culmination of Part A of the Climate Change Prediction and Impact Assessment study. This report ‘Climate Change Vulnerability & Risk Assessment Study for Ca Mau and Kien Giang Provinces, Vietnam’ presents three key outputs: an identification of future climate conditions in the Mekong Delta region; an assessment of the effects of future climate scenarios on natural, social, and economic systems in the Mekong Delta region; and a baseline analysis of existing climate change capacity within the Government. It provides practical measures that provincial and district administrations can take to inform and strengthen their programs. Importantly, it addresses factors which may constrain or limit collaborative action between communities, leaders, experts and development partners and identifies themes and strategies for follow up work to be completed in Part B of the Project.
Part B of the Climate Change Impact and Adaptation Study will commence in early 2012, and will focus on the identification of appropriate climate change adaptation measures for target provinces and targeted regional sectors; and the development of pilot projects for up-scaling and replication of Technical Assistance (TA) outcomes and support to collaborative mechanisms for information sharing and coordinated action on climate change.
A fundamental principle of the project is the implementation of a participatory approach involving national and provincial government representatives. With this in mind, a second ‘knowledge product’, an atlas outlining the key findings of the project at a province level and for each district was also produced. It is expected that the atlas which contains maps of the projected impacts of climate change and of present and projected vulnerability will be an important tool for policy makers at national, provincial and district level.
Target Provinces
Ca Mau and Kien Giang are the two most southern provinces of Vietnam. The economies of both provinces are primarily based on agriculture, aquaculture, fishing and primary industries. Twenty four districts from the two provinces were considered in the scope of this assessment.
Stakeholder consultations and field surveys were conducted in all districts, including:
Ca Mau City, Cai Nuoc, Dam Doi, Nam Can, Ngoc Hien, Phu Tan, Thoi Binh, Tran Van Thoi and U Minh districts in Ca Mau province; and
Rach Gia City, Ha Tien, An Bien, An Minh, Chau Thanh, Giang Thanh, Giong Rieng, Go Quao, Hon Dat, Kien Luong, Tan Hiep, U Minh Thuong, Vinh Thuan and the island districts of Kien Hai and Phu Quoc in Kien Giang province.
Tasks and objectives
The methodologies and key activities of the Technical Assistance brief for the project (Appendix 8). Part A of the project was expected to cover outputs 1 and 2. Outputs 3 and 4 will be completed in part B and while output 5 is commenced in Part A it will be completed in more detail in Part B. The relevant outputs and extent to which this study has achieved the expected outputs is described below.
Output 1: identification of future climate conditions in the Mekong Delta region

Climate Change Impact and Adaptation Study in Mekong Delta – Part A
xi | P a g e
Modelling future climate change scenarios in 2030 and 2050, building on work already carried out by the Ministry of Natural Resources and Environment (MONRE) and donors, and using Global circulation models, regional downscaled models, and local and international climate data as appropriate. Modelling activities will be undertaken initially at the regional level with more detailed modelling carried out for the regional target sectors and provinces. Modelling will investigate threats related to; rising sea level, rainfall patterns (including drought frequency), temperature patterns, salinity patterns, and storm surge.
This objective was successfully achieved, and the study produced comprehensive climate scenario modelling for the whole Mekong Delta region using the most up to date climate scenario information that is available for Vietnam. The report outlines detailed climate projection data for both Ca Mau and Kien Giang. However a number of knowledge gaps and limitations of the various modelling applications have been noted.
Output 2: assessment of the effects of future climate scenarios on natural, social, and economic systems in the Mekong Delta region.
a. Carry out an impact risk assessment at Mekong Delta regional level using an approach based on GIS (geographic information system) to identify the effects of future climate change scenarios on; hydro-meteorological characteristics (e.g., flooding, sea levels and tides, salinity, river flows), natural systems (e.g., biodiversity, water resources and quality, soils.), social systems (e.g., population, poverty, gender, public health, urban settlements), economic systems (e.g., industry, gross domestic product, agricultural production), and important development sectors (including, but not limited to, the identified target sectors).
b. Identify regional hotspots of climate change sensitivity, including vulnerable infrastructure items in the target sectors.
c. Integrated assessment modelling will then be carried out for target provinces and sectors to provide a more detailed assessment of climate change effects.
This objective was substantially achieved, but instead of moving from a Mekong Delta scale down to province scale, the assessment started at the province scale. However, while the assessment was only applied to the two target provinces, the observations, key findings and conclusions can be extrapolated to apply to other provinces in the Delta. The study successfully used the outputs from a hydrological / hydrodynamic model and a coastal model in MapInfo GIS to assess the effects of future climate scenarios. The outputs from the modelling covered the entire region but due to time and data constraints, detailed analysis of projected effects was restricted to Ca Mau and Kien Giang. The evaluation did however consider the interconnections within the whole region, including inter linkages of people, transport, trade, and water.
The outputs from the GIS were successfully used to determine the current and projected extent of the effects on hydro-meteorological and natural systems, but again analysis was restricted to Ca Mau and Kien Giang rather than at a regional level. In order to identify the effects on the social, economic and development systems the study used three separate components; the results from the GIS exposure modelling, observations and findings from the sectoral consultations, and district survey data to determine the relative levels of risk for particular threat sources. The chosen methodology allowed for the identification of hotspot districts in each target sector. Due to the data intensive nature of the adopted risk assessment method, rather than applying a preliminary coarse regional assessment as described in b, the study commenced with a detailed vulnerability assessment for the target provinces and sectors only.
Output 5: incorporate institutional strengthening activities for Government decision makers and technical staff, as well as awareness raising activities for the community.

Climate Change Impact and Adaptation Study in Mekong Delta – Part A
xii | P a g e
Activities for output 5 will be commenced under part A. An analysis of existing climate change capacity within the Government will be carried out as the baseline to develop a tailored capacity building program for provincial and sector authorities (PART B)
This output was only partially achieved. No formal climate change capacity assessment of national government decision makers was carried out. However the international specialists did carry out informal assessment of province and district capacity during the initial district surveys to varying degrees. The status of future plans was examined and the extent to which climate change adaptation is incorporated was analysed as a basis to assess existing capacity. It is recommended that a formal institutional capacity assessment be carried out in Part B.
Project Outcomes
Output 1: Climate Change Projection Modelling.
Based on the review of relevant literature relating to climate change impacts and adaptation and the preliminary analysis of secondary data for the Mekong Delta region undertaken during the project it was evident that there were significant knowledge gaps and limitations surrounding the quantification of climate change impacts in Vietnam, especially for the Mekong Delta region. In 2010 IMHEN produced climate change scenarios for a select range of climate change development scenarios: Low emissions scenario (B1); Intermediate emissions scenario of the medium scenario group (B2); and the intermediate scenario of the high emission scenario group (A2 and A1Fi). This data has significantly improved the climate change and sea level projections for Vietnam, and provides sea level scenarios for 25 cm, 50 cm, 75 cm and 100 cm.
The study utilised statistically downscaled data for temperature and rainfall, together with the regionally downscaled scenarios for sea level rise produced by IMHEN 2010 and the latest hydrological river flow scenarios developed for the Mekong mainstream above Kratie by the Mekong River Commission. The scenarios developed by the MRC were based on PRECIS, and have been used in a number of reports prepared by IMHEN relating to climate change impacts in the Mekong River upstream of Vietnam. As of mid-March 2011, the official Digital Elevation Model for the Mekong Delta was released and a copy was made available for use by the project.
Extreme precipitation change projections were also derived for Ca Mau City and Rach Gia City by CLIMsystems. Projections for changes in multiple day and one day extreme rainfall events were explored for 2030 and 2050 (A2 and B2) by applying ensemble pattern scaling to the daily precipitation output of 12 GCMs
The approach and methodology employed to produce the climate change scenarios and climate change impact assessments is illustrated in Figure 1. The components that were used to produce the final outputs of an outline of the threats are described below.
Two modelling efforts were used to determine the potential impacts of anthropogenic climate change in the region.
1. Hydrological/ Hydrodynamic modelling was conducted by IMHEN using the outputs from the regional climate modelling, historical climate data and the DEM to determine the potential impacts on; flooding caused by increased streamflow, salinity and saline intrusion, drought, and water resource demand and supply. Hydrological modelling was performed using the Integrated Quality and Quantity Model (IQQM) to simulate the flow of water through the Mekong Delta river systems, making allowance for control structures such as dams and irrigation abstractions. Hydrodynamic modelling performed using the ISIS software enabled representation of the complex interactions caused by tidal influences, flow reversals between wet and dry seasons, and overbank flow in the flood season. Salinity intrusion modelling was also performed using ISIS.
Hydrological and hydrodynamic modelling was conducted under baseline (1980-1999 and for the 2000 flood event), 2030 (2020-2039) and 2050 (2040-2059) time horizons with flood inundation

Climate Change Impact and Adaptation Study in Mekong Delta – Part A
xiii | P a g e
projections produced for both A2 and B2 emission scenarios and salinity intrusion projections projected for B2.
Figure 1- Schematic outlining this project’s climate change scenario and impact assessment methodology.
Note that sea level rise was taken into account in the hydrological and hydrodynamic modelling but storm surges, typhoon impacts, and wind and ocean wave processes were not. While existing flood and salinity control/protection infrastructure was incorporated planned infrastructure was not included.
2. Coastal modelling performed by Dr Nhan at the Institute of Coastal and Offshore Engineering was used to simulate the combined processes of hydrodynamics, wind induced waves, mud transport, sand transport, erosion/deposition, storm surge, and typhoons in the near shoreline coastal zone of Kien Giang and western Ca Mau provinces. This modelling utilizes the MIKE 21/3 Coupled Model Flow Model and used as its input the hydrological modelling outputs, particularly the streamflow and river flood inundation modelling results.
Analysis of the projected changes to the key input variables to coastal modelling revealed minimal differences between 2030 and 2050 or A2 and B2 so only 2050 and only under the B2 scenario was modelled in detail. Rather than the standard baseline of 1980-1999 this modelling used 2000-2009 as a baseline.
The comprehensive climate scenario modelling work used in this study utilizes the most up to date climate scenario information that is available for Vietnam. However there are a number of knowledge gaps and limitations of the various modelling applications in Vietnam. These include:
The application of the MAGICC/SCENGEN 5.3 model in the development of climate change scenarios, which produces low-resolution grid maps (300 by 300 km) and makes it difficult to accurately reflect the local specificities of climate change in Vietnam;
SIMCLIM modelling Outputs: Extreme rainfall vents

Climate Change Impact and Adaptation Study in Mekong Delta – Part A
xiv | P a g e
There is currently a lack of in-depth analysis to distinguish and assess impacts induced by climate change from other natural phenomena (e.g. El Nino/Southern Oscillation etc);
The current hydro-meteorological observation network is insufficient and inadequately distributed across climate zones and therefore unable to meet the demands for climate monitoring and/or early disaster warning.
The knowledge gaps were significant barriers to overcome in achieving the stated objectives of this project (and some were only partially conquered), in particular the limited availability of observed historical data and regionally-specific climate change scenario information for means and extremes at the provincial level.
Sea Level Rise Projections
The different climate scenarios show little difference for the time periods that this study is concerned with. Sea level is projected to rise by approximately 15 cm by 2030 and by approximately 30 cm in 2050. By the end of the 21st century, the sea level from Ca Mau to Kien Giang could rise up to 72 cm (low scenario), 82 cm (medium scenario) and 105 cm (high scenario) compared with 1980-1999.
The hydrological modelling indicated that a 15 cm or 30 cm sea level rise would not result in an appreciable increase in land area of the target provinces that would be "permanently inundated" primarily as a result of the protection afforded by the current system of sea-dykes and flood protection infrastructure. The exception is Ngoc Hien in Ca Mau province - which is already affected by inundation in periods of high seasonal tides.
The most important effects of sea level rise relate to the corresponding changes in flooding and drainage, its relative effect on salinity and importance for low lying areas in terms of enhancing coastal erosion, proneness to inundation and increases storm surge/storm tide vulnerability. Any change in the mean sea level, combined with the effects of storm surge associated with large storms or cyclones are likely to have dramatic consequences, especially for Ngoc Hien and for the island districts of Kien Hai and Phu Quoc.
Rainfall Projections
The most recent IMHEN projections for the end of the 21st century under both A2 and B2 emissions scenarios are that:
By the end of 21st century, rainfall is expected to increase by about 3 to 4% in both Kien Giang and Ca Mau compared to the baseline.
Rainfall tends to increase in rainy months (by up to 25% by the end of the century) and decrease in dry months (can be from 30 to 35%).
In other words the dry seasons will get drier and rainfall in the rainy season will be more intense (i.e. larger volumes in shorter periods). This will exacerbate flooding and drought conditions.
Extreme events
The CLIMsystems modelling projected that for both provinces the 10 and 100 yr extreme rainfall events will be ~6% larger for 2030 (both scenarios) and 10% (B2) and 11% (A2) larger for 2050. However, it should be noted that these values represent increases of only 13 mm and 22 mm in a 150 mm+ event for Ca Mau and only 15 mm and 32 mm during a 150- 300 mm event for Rach Gia.
Temperature Projections
The general trend of maximum and minimum temperature over the past 50 years has been an increase with the minimum temperature increasing faster than the maximum temperature. Projected future trends are:
Increased seasonal air temperature ranging from 0.7°C warmer by 2030 to 1.4°C warmer by 2050 for Ca Mau, and 0.5°C to 0.9°C warmer for Kien Giang by 2050;

Climate Change Impact and Adaptation Study in Mekong Delta – Part A
xv | P a g e
By the end of 21st century, the annual temperature would increase by about 1.5 to 2.0°C in Ca Mau and Kien Giang. The increase of Ca Mau is higher than in Kien Giang.
The maximum temperature increases by less than the minimum temperature. By the end of 21st century, the maximum temperature may be higher than current record about from 2 to 2.5°C compared with an increase of 3.5 to 4.0°C for the minimum temperature.
Other Climate Change Projections:
Relative humidity decreases in the dry months and increase in rainy months in both provinces. However, the annual relative humidity tends to decrease slightly.
Average wind speed increases in winter, spring and autumn months in both provinces, but decreases in the summer months. Annual average wind speed increases in most areas of Ca Mau and does not have a clear trend in Kien Giang.
Some of the results that have emerged from the downscaling are confusing and will require further detailed investigation to clarify: The A2 temperature results are very close to the B2 results, even out to 2050, which is
contrary to IPCC (2007). The A2 scenario temperatures are sometimes not as warm as B2, which is also
contrary to IPCC (2007). The change in temperature out to 2050 is sometimes not as large as the change to
2030 which is inconsistent with the known physics of climate change; The spatial pattern of warming is difficult to interpret, which requires further
investigation. The projected rainfall change under A2 is sometimes less than the change under B2
(this is for both the seasonal and monthly projections). There is a lack of significant differences in wind speed between the 2030 and 2050
scenarios and further investigation is required to determine whether this is a real result.
Salinity Projections
Changes in hydrological conditions in the canal and river systems of the two provinces are projected to occur due to the changes in the dynamics of flow between the higher sea level and the flows in the Bassac branch of the Mekong River. As a result the intrusion of saline water into the canal system is projected to change in the future. Salinity is found to be highest in late April and early May with recorded values of salinity in the study area reaching as much as 29.4 ‰ (parts per thousand).
Figure 2 summarise the findings from IMHEN modelling for the current and future extent of salinity in the region in 2050 for the A2 scenarios. Most notable is that all the districts in Ca Mau, and the majority of districts in Kien Giang (with the exception of the island districts of Phu Quoc and Kien Hai) are already affected by salinity. In the northern part of Kien Giang salinity is projected to decrease in extent while in the south it is projected to increase in extent. The models predict an increase in area of high salinity (>0.28 ‰) for both scenarios.
Storm Surge Projections
During a storm event, the combined effect of low pressure and high winds result in higher than normal water levels. For both the East and West coastlines, storm surge will occur on the ocean facing coastlines that are exposed to waves from the northeast and southwest monsoons.
It is clear from the climate simulations that extreme weather events pose a significant threat to both provinces. Typhoons (defined as tropical depressions of sufficient intensity to produce gale force

Climate Change Impact and Adaptation Study in Mekong Delta – Part A
xvi | P a g e
winds) are not only dangerous because they produces destructive winds but also because they are associated with torrential rains (often leading to floods), storm surge and wild sea conditions.
Figure 2 - Current and projected (2050 A2) maximum extent of salinity in the two provinces.
An analysis of Typhoon trends by IMHEN showed that while the frequency in the East Sea increased slightly, the frequency of typhoon landings in Vietnam has no clear trend. However, Typhoon landings have moved toward the South and the frequency of very strong storms (> level 12) has increased. The analysis also showed that the typhoon season is ending later. This indicates that areas that have not typically suffered from storms (such as the south eastern portion of the country and HCMC) may increasingly be vulnerable. However, cyclones are a complex phenomenon and their formation is very difficult to predict.
As part of the coastal modelling, the observations from Typhoon Linda in 1997 were used to simulate the potential effects of typhoons and storm surge on the coastlines of Ca Mau and Kien Giang under different sea level rise scenarios. The simulations show that the water surface elevation for a large scale typhoon event could be as high as 2 m in elevation, and in combined with 4-5 m waves could result in severe damage to coastal protection dykes, and fishing villages in estuaries and canal mouths along the entire coast.
Output 2: assessment of the effects of future climate scenarios on natural, social, and economic systems in the Mekong Delta region
Impacts on hydro-meteorological characteristics
The outputs from the hydrological / hydrodynamic and coastal models were imported into MapInfo GIS for further spatial analysis to determine the spatial extent of the projected impacts. While the model outputs covered the western portion of the Mekong Delta, detailed analysis presented in the report covers only the target provinces. Analysis of the model outputs indicates that a number of projected climate changes will have notable impacts.
Both the projected changes to rainfall patterns and increase in sea level will combine to alter the extent of impacts of extreme flood events. With the projected increase in total annual precipitation,

Climate Change Impact and Adaptation Study in Mekong Delta – Part A
xvii | P a g e
and the projected changes to the hydrology of the Bassac River, flood danger is expected to increase in all districts (except Phu Quoc and Kien Hai which are island districts) by 20 to 50% between now and 2030 and 2050 respectively. Higher sea levels will reduce the ability of flood waters to escape to the sea and will thus lead to more widespread and deeper inundation during extreme flood events.
The difference in the projected extent and depth of extreme event flooding (based on the 2000 flood) for baseline sea level and climate conditions compared to the projected extent for sea level and climate conditions for 2050 are illustrated in Figure 3. Most of Kien Giang is only just above sea level and for twelve out of fourteen districts, the projected threat of flooding is considered to be moderate to severe. Extreme threat of flooding from an extreme event is projected to be lower in Ca Mau with only five out of nine districts with vulnerability to flooding considered to be moderate to severe. Districts experiencing the greatest increases in area inundated include: An Minh – 55% increase; Vinh Thuan – 53% increase; Ca Mau – 51% increase; and An Bien – 43% increase.
Figure 3 - Current and projected (2050 A2) extent and depth of extreme event flooding (based on the 2000 flood).
In the majority of the districts, flood protection is not adequate. Upgrading of flood protection is urgently needed for all the districts, especially for the major settlements and industrial areas. Flood protection upgrading is also needed along the Bassac River which is outside the study area but influences flooding in Kien Giang and to a lesser extent in Ca Mau.
Increases in sea level, and the associated reduction in sediment transport and changes in deposition patterns will lead to general and wide scale deterioration in coastal conditions, including lower levels of sedimentation on the east coast and an increase in coastal erosion on the west coast. In addition, the area of Ca Mau exposed to storm surge is projected to increase from 9% to 15%, while the area of Kien Giang that is exposed is also projected to increase. Ngoc Hien district in Ca Mau is most likely to be adversely effected as are the island districts of Phu Quoc and Kien Hai in Kien Giang, especially Kien Hai with between 6 and 13% of their land area inundated. The combined effect of sea level rise and increased storm surge will have detrimental effects on the fringing strip of mangroves that

Climate Change Impact and Adaptation Study in Mekong Delta – Part A
xviii | P a g e
currently help protect the coastline and provide valuable livelihood opportunities. In addition to this it is likely that there will be a deterioration of beaches on Phu Quoc and other low set islands in the Kien Hai Island group. These could become greater problems should climate changes result in ‘unexpected’ changes in oceanic circulation patterns, local currents, wind direction and wave dynamics
Climate Change Impacts on Natural Systems
For each sector expert opinion was used to make an assessment of the existence and adequacy of in 2030 and 2050. Table 1 below summarises the projected impacts of climate change on natural systems in each district of the two target provinces. In the Table the impact of each hazard on the infrastructure is rated according to the combination of exposure to the hazard and the extent of existing measures that are in place to reduce the impacts.
Table 1 - Summary of climate change impacts on natural systems in each district.
District
Hazard Erosion &
Sedimentation Flooding &
Drought Saline
Intrusion Storm Surge
Ca
Mau
Pro
vinc
e
Ca Mau • ••• ••• • Cai Nuoc •• •••• ••• • Dam Doi •• •• ••• •• Nam Can •• ••• ••• •• Ngoc Hien •••• •• ••• •••• Phu Tan •• ••• ••• •• Thoi Binh • •• ••• • Tran Van Thoi •• ••• ••• •• U Minh •• •• ••• ••
Kie
n G
iang
Pro
vinc
e
Rach Gia •• ••• ••• •• Ha Tien •• ••• ••• •• An Bien •• ••• ••• •• An Minh •• •• ••• •• Chau Thanh •• •••• ••• •• Giang Thanh •• •••• •• • Giong Rieng • •••• •• • Go Quao • •••• ••• • Hon Dat •• •••• ••• •• Kien Hai •• • • •••• Kien Luong •• •••• ••• •• Phu Quoc •• • • •• Tan Hiep • •••• ••• • U Minh Thuong •• ••• ••• • Vinh Thuan •• ••• ••• •
• Adequate, now and in the near future (around 10 years)
••• Improvements are desirable in view of economic development (medium term)
•• Adequate, but adaptation needed in view of climate change (long term)
•••• Rehabilitation or upgrading urgently needed
As illustrated in the Table above, whilst the exposure to salinity is widespread and considered to be major for just about all of the mainland districts, where control measures are largely in place the impacts are generally only moderate. This is the same for the nature and extent of coastal erosion. Whilst all of the coastal districts are exposed to coastal erosion, for most districts the impacts were assessed as intermediate and/or partly controlled. However Ngoc Hien was assessed as major and largely uncontrolled as it is the only coastal district not protected by the sea-dyke system.

Climate Change Impact and Adaptation Study in Mekong Delta – Part A
xix | P a g e
In terms of magnitude and extent, river flooding and inundation clearly represent the greatest threats to both provinces and especially to Kien Giang where twelve of the fifteen districts were assessed as having major exposure with little control mechanisms in place. In particular, the districts of Chau Thanh, Giang Thanh, Giong Rieng, Go Quao, Hon Dat, Kien Luong and Tan Hiep were considered to be highly vulnerable and threatened by flooding and inundation.
Impact Risk Assessment of social and economic systems in important development sectors.
The study approach to impact risk assessment emphasises the need to understand localised ‘current vulnerability and risk’ as the best basis for predicting future vulnerabilities and risks, as regional downscaling of long-term climate forecasts need to be supplemented by assessments of who within geographically vulnerable regions are the most socially and physically vulnerable.
Several conceptual frameworks have been proposed that incorporate these concepts to describe the general processes that lead to vulnerable people and places. This study has adopted the following definitions:
Hazard refers specifically to physical manifestations of climatic variability or change, such as droughts, floods, storms, episodes of heavy rainfall, long-term changes in the mean values of climatic variables, and potential future shifts in climatic regimes;
Exposure refers to the types of assets at risk. They can include property, infrastructure, natural resources, and the services those natural resources can provide (protection of health, provision of food or water, etc.);
Sensitivity is the degree to which a system (natural, human, or built) is likely to be affected by change, such as climate‐related environmental change;
Risk is a measure of the consequence (severity or sensitivity) and likelihood (probability) of potential impact; and
Adaptive capacity is the ability of a community or system to mitigate, cope with, or accommodate change
Resilience is the opposite of vulnerability, and building resilience is the primary goal of adaptation planning. Resilience is a community’s ability to absorb disturbance while retaining its basic structure and function.
Hence, the most vulnerable people, communities, districts or systems are those that are most exposed to climate hazards or impacts, and who are the most sensitive to those effects, and who have the lowest capacity to respond to the changing conditions.
In this context, the study developed a Comparative Vulnerability Assessment (CVRA) conceptual framework that identified key geographic areas and sectors that are particularly vulnerable to the combined effects of climate change and sea level rise, and particularly the impacts of flooding, inundation, salinity, and storm surge. The CVRA incorporates a range of vulnerability indicators that cover the important aspects of the social, economic and development systems that lead to climate change vulnerability. The indicators incorporate measures of, exposure, sensitivity, and adaptive capacity. The method also incorporates weighting factors that are based on expert opinions that estimate the current status of existing protection measures and assess their suitability to provide protection from projected changes to the extent of climate change impacts.
The method uses the results from the exposure modelling together with the key observations and findings from the sectoral consultations and surveys to determine the relative levels of risk for a particular threat source - expressed as a function of ‘likelihood’ and ‘consequence’ to highlight the major risks at the district and provincial levels.
Due to the data intensive nature of the adopted CVRA method, rather than applying a preliminary coarse regional assessment, the study focused on a detailed vulnerability assessment for the target provinces and sectors only.

Climate Change Impact and Adaptation Study in Mekong Delta – Part A
xx | P a g e
The study focused on developing a range of comparative baseline indicators at the ‘district’ level for each sector in order to provide a more detailed picture of the nature and extent of human settlements and infrastructure that are likely to be most vulnerable to future climate change, and to develop ‘vulnerability profiles’ for each district that explicitly illustrate the ’comparative vulnerability’ of each area under present conditions and for 2030 and 2050.
This CVRA (Comparative Vulnerability Risk Assessment) framework is a useful approach to presenting quantitative estimates of the risks that climate change poses, at both the regional and the local level. However, it is important to understand the limitations of this approach, namely that the quantitative estimates are reliant on the quality of information available. In addition the CVRA is unavoidably uncertain as it does not take account of changes in non-climatic factors. These include future adaptation measures that will influence both the baseline exposure and their sensitivity to climate effects.
Comparative Vulnerability Risk Assessment Findings
Risk
The risk assessment presented in Table 2 indicates the extent of the risks that are posed by the three major climate change threats to the 25 districts in the two target provinces. The island districts of Phu Quoc and Kien Giang have little risk from inundation or salinity. While five districts in Ca Mau and two mainland district in Kien Giang are currently at low risk from inundation, all mainland districts are projected to be at moderate risk from inundation by 2050. All mainland districts are currently at moderate risk from salinity and are projected to remain at moderate risk out to 2050. Ngoc Hien and
Table 2- Risks posed to each district from climate change impacts for baseline, 2030 and 2050.
Inundation Salinity Storm Surge District 2010 2030 2050 2010 2030 2050 2010 2030 2050 Ca Mau 3 8 9 10 10 10 0 0 0
Cai Nuoc 8 9 9 10 10 10 0 0 0 Dam Doi 3 8 8 10 10 10 4 4 4 Nam Can 8 8 8 10 10 10 4 4 6
Ngoc Hien 3 8 3 10 10 10 8 10 10 Phu Tan 8 8 8 10 10 10 4 4 4
Thoi Binh 3 3 8 10 10 10 0 0 0 Tran Van Thoi 8 8 9 10 10 10 4 4 4
U Minh 3 3 8 10 10 10 4 4 4 Rach Gia 9 9 9 10 10 10 4 4 4 Ha Tien 8 8 9 10 10 10 4 6 6 An Bien 8 8 9 10 10 10 4 4 4 An Minh 3 8 8 10 10 10 4 4 4
Chau Thanh 9 9 9 10 10 10 4 4 4 Giang Thanh 9 9 9 10 10 10 0 0 0 Giong Rieng 9 9 9 5 5 5 0 0 0
Go Quao 8 9 9 5 10 10 0 0 0 Hon Dat 9 9 9 10 5 5 4 4 4 Kien Hai 0 0 0 0 0 0 6 6 6
Kien Luong 9 9 9 10 10 10 4 4 4 Phu Quoc 3 3 3 0 0 0 4 4 4 Tan Hiep 9 9 9 10 5 5 0 0 0
U Minh Thuong 3 8 8 10 10 10 0 0 0 Vinh Thuan 3 8 8 10 10 10 0 0 0
>20 Extreme; requires urgent attention. 5 - 12 Medium; existing controls sufficient in the short
term, will require attention in the medium term.
12 - 20 High; requiring attention in the near term. <5 Low; existing controls will be sufficient.

Climate Change Impact and Adaptation Study in Mekong Delta – Part A
xxi | P a g e
Kien Hai are currently at moderate risk from storm surge but are projected to remain at moderate risk out to 2050. Nam Can and Ha Tien are projected to be at moderate risk from storm surge by 2050.
Sectoral Vulnerability
Population and Poverty
The provinces of Kien Giang and Ca Mau are home to approximately 2.92 million people and have some of the highest population densities in the country. The main pressures driving socio-economic vulnerability in the region are demographic trends, population growth, pressure on land and water use, limited space (available land) and industrial development.
Whilst poverty is important in terms of resilience and adaptive capacity, the relatively low levels of poverty in the region would indicate that it is not a principal driver of vulnerability. However, higher incidences of poverty reduce adaptive capacity. It should be noted that there is also a strong correlation between ethnicity and poverty in the study region.
Agriculture and Livelihoods
It is highly likely that economic development of both provinces will be adversely affected by climate change, primarily due to the direct and indirect effects of climate change on primary industry. Agriculture as an economic sector accounts for approximately 40% of the regional GDP, provides for the livelihoods of more than 75 % of the people and is the major contributor to the economies of both provinces. Any increase in the negative impacts on the agricultural systems from flooding, inundation, salinity and coastal erosion and sedimentation will impact not only on the livelihoods of local people, but also on the regional and national economies.
The most severe socio-economic vulnerabilities in this sector relate to the combined effects of flooding, inundation and saline intrusion associated with sea level rise on agricultural lands and aquaculture lands and the resulting impacts on livelihoods, GDP and primary industry.
Increased temperature may result in decreased rice yields due to heat stress and decreased flowering potential. However, crop models incorporating CO2 fertilization predict increased yield if irrigation requirements are met. The yields of sugar cane and maize are predicted to increase. Other fruit and vegetable crops may have decreased yields due to impacts on flowering/fruiting and/or changes in growth rates. For aquaculture, shrimp mortality may increase due to high water temperature, increase in disease levels and increased mortality in larvae production systems.
Higher wet season rainfall may reduce rice yields through inundation damage, or localised flooding damaging farm infrastructure. Aquaculture may experience a reduction in salinity leading to decreased growth rates and disease or localised flooding damaging pond infrastructure. And fisheries may see a reduction in estuarine or near shore salinity leading to dramatic changes in fish ecology and reduction in catch. Lower dry season rainfall may result in increased salinity in canals leading to reduced growth rates for aquaculture and reduced rice yields. A decreased capacity for irrigation will affect not only rice but other crops.
A potential climate impact specific to the rice shrimp farming system is a reduced cropping window through delays in planting the rice crop (because of need for rain to flush out salts) and reduced yields due to end of season salinity damage. Irregular seasonal changes can cause poor water quality and shrimp stress and disease.
Industry and Energy
The industrial sector will be most at risk from the effects of sea level rise and inundation. The industries of both provinces are primarily based on the processing of agricultural, aquacultural and ocean fishing products. Kien Giang has large natural resource based industries primarily cement manufacturing from local limestone deposits and Ca Mau has fertiliser production and large existing energy sector assets with new energy based developments underway. Both provinces have small

Climate Change Impact and Adaptation Study in Mekong Delta – Part A
xxii | P a g e
service industries based around tourism, ice making, ship building and agriculture and aquaculture service industries.
The shrimp and fish processing plant sites are generally in the order of only 0.5 to 1.5 m above water level. Some plants already come close to flooding in spring tides in the wet season, so they are vulnerable to any sea level rise (SLR) climate change effects.
Many of the new industrial zones and shrimp and fish processing plant sites are also only around 0.5 to 1.5 m above water level and are vulnerable to sea level rise and inundation and will eventually either need to be raised or defended or abandoned. In some cases it is clear that the industrial sites would be defended in almost any realistic climate change impact scenario for their remaining lives. This includes the Ca Mau fertilizer complex and the two medium-large cement plants and the new brick making plant in Kien Luong district of Kien Giang province
The main climate change vulnerability of the provincial power transmission and distribution system, and particularly the large number of low and medium voltage distribution level poles traversing low lying rice paddies and aquaculture areas, is their vulnerability to extreme events, in particular high winds and typhoons. There will also be increased corrosion vulnerability from inundation and salinity, primarily on medium and low voltage distribution level poles. High voltage steel transmission towers are well engineered to international standards and are not significantly vulnerability to climate change
Urban Settlements and Transportation
The urban settlement patterns in Ca Mau and Kien Giang are on the Mekong Delta are unique, consisting of the two provincial centres of Rach Gia and Ca Mau and 41 other provincial towns and district centres, connected by an extensive and complex system of waterways and roads. The main drivers of vulnerability in relation to human settlements in the region are population growth and urbanisation, and the associated pressure on land and water use, limited space (available land) and migration.
The highest risks facing urban settlements in the region relate to the combined effects of sea level rise and severe flood risk and storm surge associated with extreme events. However, the overall socio economic resilience and adaptive capacity in the urban areas is considered to be relatively high, primarily due to higher levels of income, wealth and support services and infrastructure in comparison with rural populations.
Water transport is of crucial importance in both provinces as demonstrated by the disproportionately high volume of goods shipped out of both provinces. Water transportation (rivers/canals) provides the natural comparative advantage of the Province compared to other areas with only roads. Inland waterways provide a cheap, all-weather and easily accessible network for all the population. However, significant investments in the roads network have been made in the last 10 years in Ca Mau and Kien Giang in an integrated system of national, provincial and district level roads that service the main population centres. The region is also serviced by 3 domestic airports and there is a major border crossing to Cambodia near Ha Tien.
The most important vulnerabilities for the transport sector relate to the combined effects of river based flooding and coastal inundation associated with sea level rise. Whilst roads are usually considered to be highly vulnerable to SLR and only modest inundations may cause significant damages to a network, the actual designs of newly built or upgraded roads are based on flood records and local conditions. National Roads are designed for 1 in 100 year floods and Provincial Roads for 1 in 50 year floods offering a high level of resilience. Elevation Codes for roads in Ca Mau mean they will be much higher than surrounding lands leading to potential difficulties for: access to frontage properties; access to lower access points; transverse drainage under the road may be reduced; roads may flood adjoining properties; and the incorporation of road drainage and other services along roads.
The move towards increased industrialisation will put more demands on both the land and water based transportation systems to ensure there is an efficient system to support processing and marketing of produce.

Climate Change Impact and Adaptation Study in Mekong Delta – Part A
xxiii | P a g e
Vulnerability hotspots
The vulnerability rankings for each of the district are based on a standard set of indicators so that the vulnerability can be compared not only between districts, but also across sectors. A regional vulnerability was calculated for each time period as the average value of the five sectors. The geographical distribution of the regional vulnerability for baseline, 2030 and 2050 is shown in Figure 4. Currently, while the Study Area has high exposure the vulnerability to the potential impacts of climate change are low to moderate. However the magnitude of exposure, sensitivity, vulnerability and risk associated with these changes will change into the future, with a number of areas being assessed as highly vulnerable by 2050.
Figure 4. - The regional vulnerability for baseline, 2030 A2 and 2050 A2.
Regional hotspots of climate change sensitivity
Hotspots are defined as geographical areas that inherently have the highest vulnerability to a climate change hazard or combination of hazards. Because the CVRA process uses a ranking method and is applied on a sector basis, the most vulnerable districts in each sector can be identified. The hotspot districts for each sector are shown in Table 3. In Ca Mau province, Tran Van Thoi, Dam Doi and Ca Mau City are vulnerable across multiple sectors. In Kien Giang, Chau Thanh is vulnerable in all sectors and Rach Gia city and Kien Luong are vulnerable across multiple sectors.
Table 3 - Vulnerability hotspot districts in each sector.
Sector
Population Poverty Agriculture & Livelihoods
Industry & Energy
Urban Settlements & Transport
Ca Mau Province
Ca Mau Ngoc Hien U Minh Dam Doi Cai Nuoc Tran Van Thoi Dam Doi Dam Doi Tran Van Thoi Tran Van Thoi Tran Van Thoi Ca Mau Ca Mau
Kien Giang
Province
Rach Gia Chau Thanh Hon Dat Chau Thanh Chau Thanh Chau Thanh Rach Gia Hon Dat Kien Luong Chau Thanh Rach Gia Ha Tien Kien Luong Rach Gia Giong Rieng Go Quao An Bien An Minh

Climate Change Impact and Adaptation Study in Mekong Delta – Part A
xxiv | P a g e
Output 5: an analysis of existing climate change capacity within the Government
Capacity at the national, provincial and district level capacity was assessed through an analysis of the current planning documents and the existing situation on the ground in combination with the results of the project survey. The assessment for the provincial/district level, summarised in Table 4, indicates that there is a considerable lack of institutional capacity at these levels of government. Capacity at the local (commune) level was not specifically assessed and would be an important component in the process of choosing sites for pilot projects. It is recommended that a formal assessment of adaptive capacity be carried out as a first step in designing an institutional climate change adaptation capacity building program.
Table 4 - Qualitative assessment of institutional capacity for nine key measures.
Capacity component Assessment Engage with stakeholders and create consensus
Key provincial development decisions are conceptualised at and delegated from the national level Awareness programs are often in place but poor understanding by the public is stated as barrier. Women and farmers unions are poorly represented in planning stages
Articulate the mandate of a new institution or vision a trajectory
Prime minister proclamations generally contain appropriate visionary components
Develop a strategy and translate into a plan and budget Strategies are poorly developed and plans lack concrete steps
Implement a programme or policy Lack of processes and checks in programme implementation Monitor and evaluate results Very weekly developed Effective and good leadership There is a distinct lack of tendency for individuals to take on decision
making roles Effective and well functioning institutions Many institutions do not function well
Environment conducive to knowledge sharing Institutional environment actively suppresses knowledge sharing
Transparent and independent accountability systems Complete absence of transparency accountability system
Further research needs and gaps
Capacity at the national level was only assessed by expert judgement based on future development plans and research output. While capacity at the local (commune) level was not specifically assessed and would be an important component in the process of choosing sites for pilot projects. It is recommended that a formal assessment of adaptive capacity be carried out as a first step in designing an institutional climate change adaptation capacity building program.
There are a range of other issues that were beyond the scope of the study that require further consideration, including:
How can the results of current future studies of this nature (and especially the meteorological and climate modelling), be disseminated more effectively so that the information can be more readily available to others? This is an extremely important point for the Government of Vietnam to address.
With a plethora of climate change studies being carried out by many different organizations in Vietnam, and especially on the Mekong Delta, how can future adaptation projects be coordinated so that work is not duplicated?
Internal migration from rural areas to provincial centres or to the large cities, and the question of how climate change impact on this is a highly sensitive issue, which only the Government of Vietnam can address.
How can existing networks and organizations be better used to improve cooperation on adaptation activities and enhance resilience.

Climate Change Impact and Adaptation Study in Mekong Delta – Part A
1 | P a g e
1. Introduction The Asian Development Bank (ADB) engaged Sinclair Knight Merz (SKM), in association with Center for Environmental Research (CENRE) under the Vietnam Institute of Meteorology, Hydrology and Environment (IMHEN), Acclimatise and University of Newcastle, Australia to undertake ‘Part A’ of the Climate Change Impact and Adaptation Study in the Mekong Delta (TA 7377 – VIE).
This Report, ‘Climate Change Vulnerability & Risk Assessment Study for Ca Mau and Kien Giang Provinces, Vietnam’ represents the culmination of Part A of the Climate Change Prediction and Impact Assessment study, and incorporates the most up-to-date projections of future climate conditions in the Mekong Delta region; and a detailed vulnerability and risk assessment (VRA) of the potential effects of future climate scenarios on natural, social and economic systems in the Mekong Delta region.
Part B of the Climate Change Impact and Adaptation Study will commence later this year, and will focus on the identification of appropriate climate change adaptation measures for target provinces and targeted regional sectors; and the development of pilot projects for up-scaling and replication of TA outcomes and provide support to collaborative mechanisms for information sharing and coordinated action on climate change.
1.1 Purpose of this Study The purpose of this study was to identify potential future climate conditions in the Mekong Delta region, and assess the effects of future climate scenarios on natural, social and economic systems in the region, so as to inform and assist decision makers and development partners in the Mekong Delta region to adapt to the future impacts of climate change and sea level rise.
The study focuses on assessing the potential impacts of climate change on the three target sectors in Kien Giang and Ca Mau provinces, these being energy and industry, transport and urban planning, and agriculture and forestry.
In this context, the study primarily targets provincial and district level decision makers in the Kien Giang and Ca Mau provinces, as well as major development partners. It provides practical measures that provincial and district administrations can take to inform and strengthen their programs.
Importantly, it addresses factors which may constrain or limit collaborative action between communities, leaders, specialists and development partners. It suggests target provinces and targeted regional sectors, which may be suitable for future development as pilot projects for up-scaling and replication in Part B of the project. And finally the study has attempted to identify a range of sectoral adaptation themes for the target sectors where non-structural adaptation options suitable for addressing social and natural system vulnerability can be futher explored in Part B of the project.
1.2 The Regional Context Vietnam is considered to be one of the countries likely to be most affected by global climate change. Within Vietnam, the Mekong Delta region in the south of the country has been identified as being particularly susceptible to the impacts of extreme climate events and climate variability. The focus of this study is the Mekong Delta provinces of Ca Mau and Kien Giang. With a sea level rise of 75 cm, Kien Giang and Ca Mau are two of the top four most affected provinces in terms of areas inundated in Vietnam (according to the Sea Level Rise Report – IMHEN 2010b).

Climate Change Impact and Adaptation Study in Mekong Delta – Part A
2 | P a g e
Figure 5 - Map of the Study Area

Climate Change Impact and Adaptation Study in Mekong Delta – Part A
3 | P a g e
1.2.1 The Mekong Delta The Mekong Delta region covers 12% of the area of Vietnam, and comprises the provinces of Long An, Dong Thap, Tien Giang, An Gian, Vinh Long, Ben Tre, Tra Vinh, Soc Trang, Can Tho, Bac Lieu, Kien Giang and Ca Mau and is home to one fifth of the national population (i.e. approximately 17 million people). Two-thirds of the Mekong delta is located in southern Vietnam and one third in Cambodia. The Vietnamese portion of the Mekong Delta occupies 40,058 km2, of which 24,000 km2 are now used for agriculture and aquaculture and 4,000 km2 for forestry.
The population density in the Vietnamese part of the Delta is relatively high (425 inhabitants/ km2) when compared to other regions of the country which averages around 250 inhabitants/km2. With a population growth rate of 0.6% the pressure on the available space is increasing, and is considered to be one of the major drivers of change in the Delta along with economic development and climate change.
Poverty remains an important challenge for the region. Despite a considerable decline in poverty since 1998, there are still around four million poor people living in the Vietnamese Mekong Delta provinces. This is the highest number of poor people of any of Vietnam’s seven regions, and has the highest percentage of ’near poor’ people who are vulnerable to falling back into poverty through adverse impacts on household livelihoods and income from climate change. The Mekong Delta is primarily a rural landscape, with approximately 85% of the population living in rural circumstances and reliant on agriculture for their livelihoods.
The Vietnamese part of the Mekong Delta is one of the most productive and intensively cultivated areas in Asia, and is considered to be a priority area for national economic development and food security. Around two thirds of the Mekong delta (10,000 km2) is used for agricultural production with the rice dominant product. The delta is responsible for producing half of the country’s rice, 60 percent of its fish-shrimp harvest, and 80 percent of its fruit crop.
Aquaculture, forestry and non-rice agricultural crops are also important in some areas. Both freshwater and brackish water aquaculture have recently expanded in both area and economic importance. Aquaculture exports from the delta grew by over 425 percent between 1998 and 2008, and exceed USD 4 billion in value in 2009. The delta now contains 65 percent of the country’s area under aquaculture.
Primary production accounted for 41 percent of value added to the delta GDP in 2007, with agriculture, aquaculture, fisheries and forestry the largest primary sectors. Industry, construction and service sectors have grown much faster and collectively account for 59 percent of the regional economy. However much of the industry is either involved in processing primary products such as rice, aquatic products, and sugar or provides agricultural support services such as fertiliser production and machinery servicing.
Many changes have occurred in the Mekong Delta to support agricultural and aquacultural expansion and intensification. Canals, dikes and roads have altered the natural dynamics of the floodplain. Mangroves have been cleared and replaced with shrimp ponds, and canals and dams have opened up brackish areas to rice farming. Continuing agricultural and aqua cultural expansion threatens more loss of mangroves in the delta. Increasing use of groundwater is also of concern, increasing risks of saltwater intrusion, as well as contributing to compaction of the sediment layers (WWF Vietnam).
Whilst rice and aquaculture are the primary livelihood pursuits, over the last 5-10 years there has also been a rapid uptake of new economic activities, primarily due the Government’s economic restructuring initiatives in the area. In recent years both shrimp cultivation and fruit production have expanded rapidly, with government providing subsidised credit in support of these activities. Many of those who can afford the inputs for these activities have profited. Intensive shrimp farming requires high levels of investment to ensure that the ponds do not become polluted and to limit losses from

Climate Change Impact and Adaptation Study in Mekong Delta – Part A
4 | P a g e
shrimp disease. People who have managed to invest on a scale to do this properly and efficiently have, in some cases, become very wealthy.
Another significant trend in the delta is that of increased mechanisation and land consolidation. In comparison with other lower Mekong Basin countries, Vietnam’s Delta has both the highest levels of chemical inputs and the largest number of tractors per capita. Currently, 90 percent of the rice land on the delta is prepared by tractor, 80 percent is mechanically harvested and almost 100 percent of rice is machine threshed.
1.2.2 Socio-Economic Context Over the last 25 years, Vietnam’s economy changed dramatically from a planned economy to a modern free market economy. Vietnam’s economy was among the fastest growing economies of Asia, with the profound reforms under ‘Doi Moi’, which literally means ‘change and renewal’, contributing to impressive increases in production and substantial declines in the incidence of poverty from 37 per cent in 1998 to 29 per cent in 2002, and 13 per cent in 2008.
Under Doi Moi, the Government of Vietnam identified the Mekong Delta as a priority area for economic development, and established targets to increase the production of food, commodities and consumer goods in the Delta by 8 percent annually. According to figures from the General Statistics Office in Hanoi, Vietnam’s economy grew 8.5 percent in 2007, the fastest pace since 1996. Industry and construction accounted for 42 percent of Vietnam’s economy in the first quarter of 2008. Agriculture, forestry and fisheries, which accounted for 14 percent of Vietnam’s economy in the first quarter, grew at 2.9 percent, up from 2.6 percent in the same period in 2007. Per capita GDP increased from US$ 200 in 1996 to over US$ 700 in 2006.
With its strong economic performance, Vietnam has become attractive as a country for foreign investment with a cheap, well-educated labour force and large domestic market. Compounded Annual Growth Rate (CAGR) was about 7.6 per cent in the period from 2000 to 2010 and as a result GDP per capita increased from US$400 in 2000 to almost US$1,100 in 2010, buoyed by the continued expansion of investment in infrastructure, labour-intensive manufacturing and service activities.
Triggered by the global financial crisis, GDP growth fell to about six per cent in 2008 and 4.5 percent in 2009, the lowest level in almost a decade and a sharp drop from the 8.5 per cent in 2007. At the same time, inflation rose to 25 per cent in 2008, the highest in the region which also includes Laos, Thailand, and Cambodia. Projected real GDP growth (excluding inflation) for the period 2012-2020 targets about 7% per year.
However, the drop in GDP growth rate during the financial crisis was less than in neighbouring countries as the Government began addressing the threat of an overheated domestic economy decisively, starting in late 2007. In response to the first shock of the current crisis, the authorities shifted emphasis from growth to stabilisation in March 2008. In late 2008, they shifted once more to supporting economic activity through large interest rate reductions, injections of liquidity, and a fiscal stimulus package.
1.2.3 Sectoral Growth and Diversification The extraordinary economic growth in the Vietnam over the last 20 years has primarily been driven by the economic structural transition from what was primarily a centrally-planned rurally-based economy to a more dynamic and productive multi-sectoral market driven economy that promoted the rapid development of the private sector.
Between 1986 and 2005, the structure of the Vietnamese economy transitioned from an economy dominated by agricultural production to an economy dominated by industry and construction and services. Figure 6 illustrates the long-term economic structural transition in Vietnam. The relative contribution of agriculture to GDP has declined from 38.1% in 1986 to 20.7% in 2005, representing a
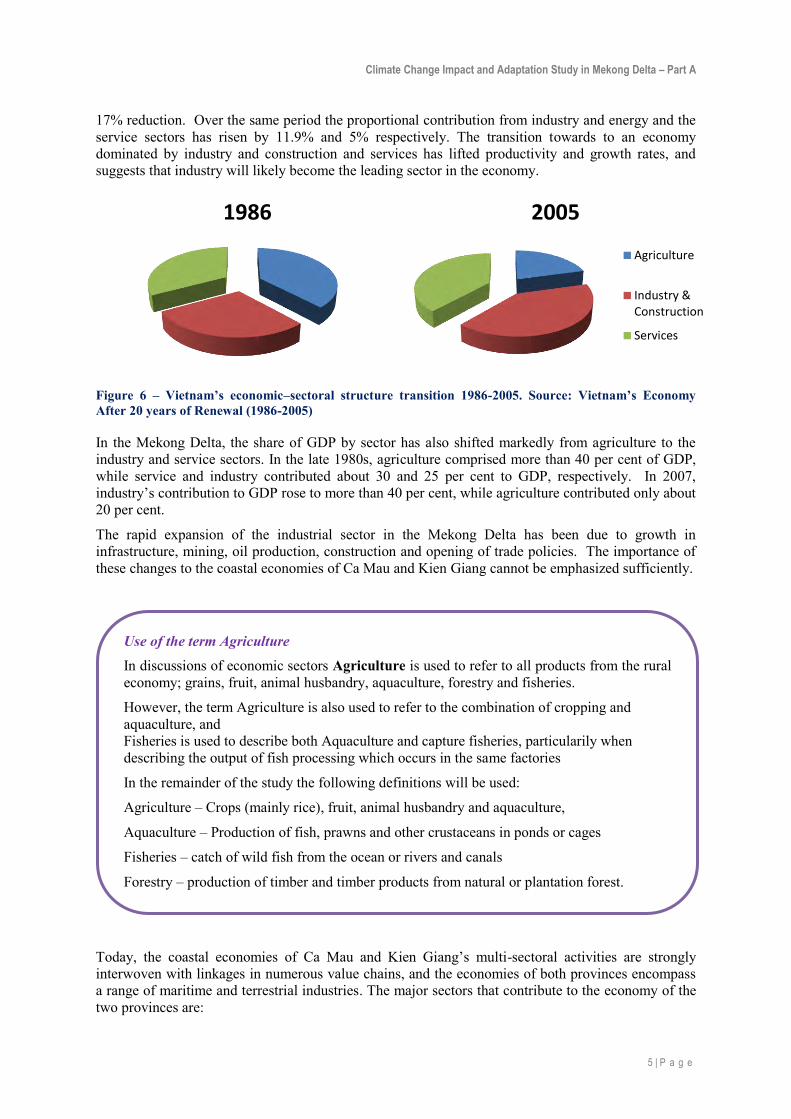
Climate Change Impact and Adaptation Study in Mekong Delta – Part A
5 | P a g e
17% reduction. Over the same period the proportional contribution from industry and energy and the service sectors has risen by 11.9% and 5% respectively. The transition towards to an economy dominated by industry and construction and services has lifted productivity and growth rates, and suggests that industry will likely become the leading sector in the economy.
Figure 6 – Vietnam’s economic–sectoral structure transition 1986-2005. Source: Vietnam’s Economy After 20 years of Renewal (1986-2005)
In the Mekong Delta, the share of GDP by sector has also shifted markedly from agriculture to the industry and service sectors. In the late 1980s, agriculture comprised more than 40 per cent of GDP, while service and industry contributed about 30 and 25 per cent to GDP, respectively. In 2007, industry’s contribution to GDP rose to more than 40 per cent, while agriculture contributed only about 20 per cent.
The rapid expansion of the industrial sector in the Mekong Delta has been due to growth in infrastructure, mining, oil production, construction and opening of trade policies. The importance of these changes to the coastal economies of Ca Mau and Kien Giang cannot be emphasized sufficiently.
Today, the coastal economies of Ca Mau and Kien Giang’s multi-sectoral activities are strongly interwoven with linkages in numerous value chains, and the economies of both provinces encompass a range of maritime and terrestrial industries. The major sectors that contribute to the economy of the two provinces are:
1986 2005
Agriculture
Industry &Construction
Services
Use of the term Agriculture
In discussions of economic sectors Agriculture is used to refer to all products from the rural economy; grains, fruit, animal husbandry, aquaculture, forestry and fisheries.
However, the term Agriculture is also used to refer to the combination of cropping and aquaculture, and Fisheries is used to describe both Aquaculture and capture fisheries, particularily when describing the output of fish processing which occurs in the same factories
In the remainder of the study the following definitions will be used:
Agriculture – Crops (mainly rice), fruit, animal husbandry and aquaculture,
Aquaculture – Production of fish, prawns and other crustaceans in ponds or cages
Fisheries – catch of wild fish from the ocean or rivers and canals
Forestry – production of timber and timber products from natural or plantation forest.

Climate Change Impact and Adaptation Study in Mekong Delta – Part A
6 | P a g e
Rice cropping;
Aquaculture;
Fisheries;
Sea transport and deep-sea ports;
Natural gas exploitation and power generation; and
Tourism
According to the Ministry of Planning and Investment, the coastal economy contributes about 50 per cent of the national GDP. Various sectors contribute significantly to this high percentage, e.g. oil and gas (64%) fisheries (14%) and tourism (9%).
Vietnam aims to increase the importance of its coastal economy, raising its GDP contribution to 55 per cent in 2020. However, changes in socio-economic patterns in these coastal provinces induced by climate change are likely to have a profound effect on the remainder of the country’s economy. Climate change implications therefore have to be assessed at a wider and even national scale to accommodate all down- and upstream economic implications. The following sections provide more details on the five sectors that are the focus of this study.
1.2.4 The Agriculture Sector Nationally, the sector employs about 55 per cent of the total labour forces, contributes 18 per cent of GDP and over 17 per cent of the country’s export. In the coastal areas, agriculture, aquaculture and fisheries are the main livelihoods. Although the contribution of agriculture to total coastal GDP is around 27 per cent, agriculture production generates jobs for more than 70 per cent of coastal inhabitants.
1.2.4.1 Crops Ministry of Agriculture and Rural Development has set the target for the 2011-2015 period of agriculture sector growth at 3.5 per cent per year. And for the period 2016-2020 period the agricultural growth rate is projected to be four per cent per year.
Rice production of the Mekong delta almost doubled from 1995 to 2009 (from 12 M tons to 20.5 M tons). Rapid growth of rice production is due to large scale water control projects, reclaiming of acid sulphate soils, expanding rice field areas into the wetlands, etc.
Recently, several new water control projects have been implemented in the Mekong Delta aiming to boost rice production. The most significant projects are:
The Plain of Reeds project with the goal is to reclaim the acid sulphate soils and provide irrigation for an area of 600.000 ha to cultivate rice.
The Long Xuyen Quadrangle project: focused on draining flood water to the Gulf of Thailand and reclaim the soils.
Ca Mau Peninsula project to bring fresh water to the salt-intruded areas for rice cultivation.
South Mang Thit project: saline water control project.
1.2.4.2 Aquaculture The aquaculture sector is considered as one of the key economic sectors of the country. Total estimated area used for aquaculture was estimated at 902.900 ha in 2010. The sector witnessed strong increases in production to 2010. In 2008, total aquatic production in Vietnam reached 4.6 million

Climate Change Impact and Adaptation Study in Mekong Delta – Part A
7 | P a g e
tonnes of which aquaculture production contributed 2.5 million tonnes or 54 percent. As a comparison, in 2004 the aquaculture contribution was only 37 percent of total fish catch.
Over the past decade, aquaculture, primarily shrimp and pangasius (Vietnamese catfish), has grown in production from a few thousand tons to over 1 million tonnes in 2009 generating a value of over US$1 billion while shrimp farming grew steadily to reach a total production of over 380,000 tons. These species, mainly farmed in the Mekong delta, are associated with great benefits to the Vietnamese economy (WWF Vietnam).
The Vietnamese portion of the delta yields an annual harvest of about 400,000 metric tonnes of fish. Approximately 156,000 tonnes of this are derived from the brackish water and estuarine zone. However, fish production has been declining in recent years as a result of over-exploitation, forest destruction, and drainage of wetlands for agricultural production.
1.2.4.3 Fisheries Fisheries play an important role in Vietnam’s economy, contributing some 7.3 percent of the country’s total export value in 2008, providing jobs to more than four million labourers, and bringing direct or indirect income to some 10 percent of the population. During the past 15 years, the sector has contributed over five percent of the country’s GDP. Fisheries catch has been a traditional livelihood in Vietnam. During the 1995-2005 period, annual catch in tonnes increased by five percent.
The lower Mekong River and its delta support one of the largest inland fisheries in the world. Vietnamese people in rural areas rely heavily on fisheries for their subsistence. Fish provide from 40% - 60% of animal protein intake for people in rural areas – even those living far from water.
1.2.5 Industry Sector The largest industrial sector in the region is agriculture-aquaculture-food processing which in 2010 accounted for 48% of industrial value. Aquaculture (in particular shrimp) processing (sorting, packing, freezing) has been an important industry in the region, particularly in Ca Mau province since the start of Vietnam's economic reforms in 1979 and Ca Mau accounts for around 70% of Vietnam’s aquaculture exports. Aquaculture inputs (esp. shrimp) are also imported from other provinces for processing. Along with wild fish processing and the transformation of low value "waste" fish into fish meal, aquaculture processing directly employs around 30,000 people in the two provinces. There is also a large service industry supplying larvae, feed, chemicals and supplying and servicing equipment to the aquaculture sector.
Although rice growing is the largest land use in Kien Giang province and the second largest land use in Ca Mau province, rice husking is no longer a major industry in the region as it appears that more than 90% of rice husking now takes place in neighbouring provinces. There is also a large service industry supplying seed, fertilizer and supplying and servicing equipment to the rice growing sector.
There are two important large industries in the region; the two large and three small cement plants in Kien Luong district - that supply most of the cement used in southern Vietnam, and the Ca Mau fertilizer (urea) project currently already under construction for 2012 which will produce 800,000 tons/year of urea (which is an output equivalent to 40% of Vietnam’s urea use).
There is also a small-medium size sugar cane processing plant established by the provincial government in 1997 processing cane 60% sourced from Kien Giang province and 40% imported from other provinces.
There is a number of ship building yards, ranging from yards that build and repair steel hulled ships of capacity up to 1500 tons, to ship yards that build and repair wooden offshore fishing boats, to plants building fibre glass inshore boats and ferries.

Climate Change Impact and Adaptation Study in Mekong Delta – Part A
8 | P a g e
There is also a range of smaller and less capital intensive general services provision industries of which the largest single (informal) sector is ice making. There is estimated to be over 200 plants making ice for domestic consumption and to service the aquaculture and fishing industries.
There is also a range of smaller industries; printing, machinery, apparel (clothing) manufacturing and a wide range of other mainly service industries, such as furniture making, construction, chop stick manufacturing, noodle making, bread making.
1.2.5.1 Tourism Viet Nam is one of the most popular tourist destinations in South-East Asia. In 2008, the country recorded around 4.25 million foreign visitors’ arrivals and the last decade witnessed a robust growth of about 2-3 percent per year in tourist numbers. Currently, the tourism industry employs more than 1 million people, of which 285,000 are directly employed. In 2009, tourism contributed 13% of the national GDP.
Rach Gia is already a significant domestic tourism destination. However, Phu Quoc Island is the main tourist destination in Kien Giang province, and major new investments are underway. Tourism takes several forms, from international and domestic visitors to Phu Quoc, border/historical tourism at Ha Tien; and weekend trips for domestic tourists to a range of sites for relaxation. Ca Mau has a number of important tourist attractions and in 2010, received 6,460 foreign and 218,540 domestic visitors. Kien Giang received more than 3.4 million tourists in 2010 with Phu Quoc as the main tourist destination. In many other parts of the region tourism is still largely underdeveloped. One of the most important reasons is weak infrastructure and the lack of a clearly defined tourist development strategy.
1.2.6 Energy Sector The Delta has a modern and extensive power distribution system managed by the EVN owned Southern Grid Company. The largest single existing energy sector project in the region is the PetroVietNam (PVN) Ca Mau gas-power-fertilizer complex using gas piped from the Malaysian-Vietnamese shared offshore PM3-CAA field
While the power supply is generally stable, in the dry season each year there are around 20 power outages, each of half to full day duration, when the national EVN grid runs out of generating capacity from its hydro power stations in central and northern Vietnam. Many industries therefore have back-up diesel generators.
1.2.6.1 Other Energy Sources As well as Phu Quoc Island, nine small islands have their own diesel generator powered stand-alone electricity grids funded by Kien Giang province.
LPG is widely used for cooking, but some poor rural people cannot afford LPG and use fuel wood and/or charcoal instead. There are at least two charcoal manufacturing plants in Ngoc Hien district, using mangroves as input material
There are some animal waste bio-digesters in use, but with little scope for more due to the lack of significant concentrated animal waste. There is some use of loose bulk rice husks and rice husk blocks for fish meal drying and household cooking, also some coal and fuel oil is used in the aquaculture processing industry.

Climate Change Impact and Adaptation Study in Mekong Delta – Part A
9 | P a g e
1.2.7 Urban Settlements The Mekong Delta has been settled for thousands of years: remains of the ancient (perhaps 1st century A.D.) settlement of Oc Eo lie just outside the project boundary in An Giang province; and Ha Tien in Kien Giang province has been a trading port for centuries. In the late nineteenth century large areas were drained and canalised for transportation purposes and for growing rice. Over the years the main urban areas have developed to service the surrounding agriculture and fisheries sectors. In the south in particular, urbanisation proceeded quite slowly: for example, it was only decided to locate the centre of Nam Can in Ca Mau province to its present location in 1993.
Settlements in the Mekong Delta formed much like in other then coastal rural areas: at the mouths of rivers related to fishing; at river crossing points; and at confluences of rivers. Before the road network became established a typical family ideally located along the raised banks of inland waterways and this pattern is still replicated today. For traders, the ideal situation is to have both water and road frontages. This historical connection to water in order to maximise trading opportunities means that many settlements are directly affected when there are high tides and/or over-topping of canals/rivers. However residents have long adapted to the usually short-term inconvenience of raised water levels.
As the economy has diversified over recent years the prosperity of existing urban areas is almost entirely dependent upon the processing and marketing of such primary products although tourism is also a growing attraction and employer in both of the provinces. The growth in aquaculture has fed into the urban economy, particularly in Ca Mau province, through increased shrimp processing and marketing. In Kien Giang, urban growth has also been fuelled by domestic tourism
In common with other developing countries it can be expected that the rural-urban drift will continue due to rural under-employment and growing perceived urban attractions. However, the relatively low population growth rates suggest that there is considerable net outward migration from the area to larger centres such as Can Tho and Ho Chi Min City. Both Ca Mau City and Rach Gia are benefitting from large influxes of local, repatriating and foreign capital into residential and commercial developments in new subdivisions on the outskirts of traditional centres. Planned large scale road expansions, particularly in Ca Mau, are likely to make the area even more regionally accessible.
1.2.8 Transport For hundreds of years transportation of goods and people throughout the Mekong Delta has predominantly been via inland rivers and canals. Settlements sprang up at confluences and dwellings typically located along the elevated banks of canals dug for communications, development or water control. Trade managed to develop and thrive using the many thousands of kilometres of inter-connected waterways which in turn are linked to provincial and international markets.
In much of the Delta the road network consists of narrow usually sealed roads which follow the routes of inland waterways. They are mostly used by motorbikes and the occasional car and light truck, the narrow and weight limited bridges and ferries being constraints for heavy vehicles. The two travel necessities for a rural family are a motorbike and a long tailed boat.
Transport is still dominated by canal and river especially for the transport of heavy and bulky goods such as agricultural products and construction materials. For personal travel and for transport of relatively small amounts of goods the motorbike is the most practical and cost efficient means as many bridges are too narrow for larger vehicles.
There is one main inland port at Tac Cau south of Rach Gia for 500 – 1000 tons boats. Marine fish landed in the Province is taken to Tac Cau as it has an industrial zone for fish processing. Much is also sent onwards from there to Can Tho and Ho Chi Minh City inside polystyrene containers on refrigerated lorries. Rach Gia port itself is only used for ferries. The lack of a mainland deep water port has been noted as a key factor restricting the Province’s growth, despite its key location on the border with Cambodia.

Climate Change Impact and Adaptation Study in Mekong Delta – Part A
10 | P a g e
Ca Mau and Rach Gia have domestic airports and there are plans to upgrade them to reach an annual capacity of 300,000 passengers. Phu Quoc has an international airport with construction of a new 2 million passengers/year airport underway.

Climate Change Impact and Adaptation Study in Mekong Delta – Part A
11 | P a g e
2. CVRA Approach and Methodology This study uses a ‘comparative vulnerability and risk assessment’ (CVRA) methodology and framework for estimating aggregate vulnerability for five dimensions, these being: population; poverty; agriculture and livelihoods; industry and energy; urban settlements and transportation. This approach is based on the generally accepted IPCC approach to vulnerability assessment for natural system, in combination with a risk-based approach for assessing the impacts of natural hazards such as flooding, inundation and sea level rise on human systems.
The integration of the risk-based and vulnerability-based approaches was seen as both a necessary and practical means of analysing and understanding the numerous threats that human and natural systems of the Mekong will face in the future as a result of climate variability and change, and also from non-climate hazards. Placing social vulnerability within the context of risk, and viewing biophysical vulnerability and risk as broadly equivalent, provides us with a relatively simple but pragmatic framework for assessing both the comparative geospatial and sectoral vulnerability on the Mekong Delta.
This approach recognises the need to not only identify ‘who’ are the most socially vulnerable – but ‘what’ infrastructure and services are physically more exposed and vulnerable, and reflects the variation and complexity of both human and natural systems, and incorporates social dimensions such as population, poverty, well-being etc., as well as the bio-physical attributes of topography, natural resources and physical infrastructure.
2.1 Conceptual Framework Figure 7 shows the conceptual framework adopted for this study. This framework helps to define the interrelationships between the natural and human systems, and identify and compare the vulnerability of peoples, communities and sectors across different geographic regions and at different scales. The framework comprises 4 key components, these being:
The assessment of global climate change and sea level rise scenario’s for Vietnam;
The evaluation of the effects of climate change on natural systems of the Mekong Delta;
The assessment of the potential impacts on human systems in the Study Area; and
The identification of vulnerability, and risks at the provincial and district levels.
The basic concepts presented in the framework described below have been examined in a variety of case studies that seek to characterize the vulnerability of specific populations or places (such as. Adger, 1999; Turner et al., 2003; O’Brien and Liechenko, 2000; Moss et al., 2000).

Climate Change Impact and Adaptation Study in Mekong Delta – Part A
12 | P a g e
Figure 7 - Methodological Framework for Comparative Vulnerability and Risk Assessment
1. Global Climate Change, Sea Level Rise Scenario’s for Vietnam
Statistically Downscaled Variable for the Mekong
Delta
Regional Downscaled Sea Level Scenarios for the
Mekong Delta
Hydrological Model
Hydrodynamic Model
Coastal Model
2. Effects on Natural Systems
Changes in Precipitation
Changes in Temperature
Sea Level Rise
Floods & Droughts
Saline Intrusion
Typhoons & Storm Surge
Coastal Erosion
3. Potential Impacts on Human Systems
Land Loss Food & Water
Security
Livelihood Disruption
Regional Economy
Urban Settlements & Transport
Energy & Industry
4. Vulnerability, Risk and Adaptation Planning
Vulnerability Analysis
Exposure Sensitivity
Risk Assessment Adaptation Options

Climate Change Impact and Adaptation Study in Mekong Delta – Part A
13 | P a g e
2.2 Evaluating Vulnerabilities The primary purpose of this vulnerability assessment study is to identify and evaluate the ‘net biophysical and social vulnerability’ of Ca Mau and Kien Giang provinces. In this context and for the purposes of this Report, ‘vulnerability’ is considered to be a function of:
Exposure to climatic hazards
Sensitivity to the impacts of climate change hazards;
The ability or adaptive capacity to respond to climate-related risks (including adaptive measures, coping strategies or actions taken in reaction to the impacts or to mitigate the risks); and
The frequency, magnitude and extent of climate-related risks to the community, assessed in terms of the probability of occurrence (likelihood) and magnitude of hazards (consequence).
These concepts or vulnerability characteristics (i.e. exposure, sensitivity, adaptive capacity and risk) are not new. They have emerged from the risk-hazards and international development literature, and over the last decade have been expanded and integrated into the discourse of the global environmental change research community.
The approach used in this study involves creating a current vulnerability baseline “exposure” for comparison between districts across both provinces. Future climatic conditions based on global climate scenarios and the outputs from our impact modelling are then use to produce estimates of sensitivity, vulnerability and attributable future risk.
This CVRA (Comparative Vulnerability Risk Assessment) framework is a useful approach to presenting quantitative estimates of the risks that climate change poses, at both the regional and the local level. However, it is important to understand the limitations of this approach, namely that the quantitative estimates are reliant on the quality of information available. In addition the CVRA is unavoidably uncertain as it does not take account of changes in non-climatic factors. These include future adaptation measures that will influence both the baseline exposure and their sensitivity to climate effects.

Climate Change Impact and Adaptation Study in Mekong Delta – Part A
14 | P a g e
2.2.1 Key Sectors In the context of this study it is important to understand that vulnerability incorporates a number of dimensions; social, demographic, geographic, environmental, economic and cultural processes that influence how ‘vulnerable’ a community or system is to the effects of climate change. In order to be able to conceptualise, evaluate and map the ‘dimensions of vulnerability’, a widely accepted approach for ranking the exposure and sensitivity for both natural and human systems using a range of indicators to ‘measure’ vulnerability across 5 key sectors was used, these being:
Population Vulnerability: refers to the vulnerability of people and populations in the study area to the effects of climate change, and recognises that there are distinct regional differences in demographic composition and trends (such as the migration of people towards coastal urban areas which yields a greater than average growth of the population in some districts). Population growth is a major driver for change in the delta, in terms of increasing the exposure of people and households to climate change hazards and the demands placed on the available natural resources and its implications on sustainable livelihoods. Over the long term, population growth in the study area is likely to contribute to and exacerbate not only the vulnerability to climate change as well as the difficulties in adapting to any detrimental changes in climate. In this context a district is considered to be vulnerable if it exhibits characteristics such as high population numbers, rates of growth or large family size.
Important terms Adaptation Actions taken in response to actual or projected climate change and impacts that
lead to a reduction in risks or a realisation of benefits. A distinction can be made between a planned or anticipatory approach to adaptation (i.e. risk treatments) and an approach that relies on unplanned or reactive adjustments.
Adaptive capacity
The capacity of an organisation or system to moderate the risks of climate change or to realise benefits, through changes in its characteristics or behaviour. Adaptive capacity can be an inherent property or it could have been developed as a result of previous policy, planning or design decisions of the organisation.
Hazard A physically defined source of potential harm, or a situation with a potential for causing harm, in terms of human injury; damage to health, property, the environment, and other things of value; or some combination of these.
Risk Risk is defined in general terms as the product of the frequency (or likelihood) of a particular event and the consequence of that event, be it in terms of lives lost, financial cost and/or environmental impact.
Sensitivity Refers to the degree to which a system is affected, either adversely or beneficially, by climate related variables including means, extremes and variability.
Exposure Defines the likelihood of a community being affected by a hazard. This is determined by GIS modelling and mapping of the predicted extent of hazards.
Vulnerability Vulnerability is a function of risk and response capacity. It is a combination of the physical parameter of the hazards and its consequences such as personal injuries, degradation of buildings and infrastructure and functional perturbations. It may vary depending on non physical factors such as emergency preparation, education and recovery capacity.

Climate Change Impact and Adaptation Study in Mekong Delta – Part A
15 | P a g e
Poverty Vulnerability: refers to the vulnerability of poor and near poor households and people in the study area to the effects of climate change. The use of this dimension recognises that the incidence of poverty varies across the region, due to a range of ‘special difficulties’ such as ethnicity, lack of access to agricultural land, education and health services, fresh drinking water, power and markets. Poverty diminishes the resilience and adaptive capacity of people and households, as people lack savings and capital for investment to adopt better production technology and also lack awareness and knowledge of adaption options available. Like population, poverty encompasses dimensions relevant to climate change vulnerability, such as the vulnerability to impacts and future shocks – and the ability to build resilience and adapt to climate change. In this study it is recognized that poverty is multi-dimensional and includes health, wealth, education and access to natural resources in addition to income. Combining information on these indicators with different poverty measures at a the district level not only provides an understanding of the spatial patterns of poverty but also allows for an analysis of the vulnerability of the poor and near poor communities and households to climate change impacts and hazards into the future.
Agriculture and Livelihoods Vulnerability: refers to the vulnerability of agricultural farming, infrastructure and livelihood systems in the study area to the effects of climate change. It recognizes that in Vietnam the single farmer household is recognized as the basic economic unit upon which the agricultural sector is built at the commune, district and provincial levels, and is central to understanding the current and future effects of climate change. In this context a household agricultural and livelihood system is considered to be vulnerable if there is a high probability of loss or damage from climate change and there is a high probability of it not recovering quickly or fully. This may be because the effects are either irreversible or the opportunities of recouping the losses are negligible. Household vulnerability is determined by access to resources (land and water) and the level and diversity of income sources (occupations) as well as availability of productive assets and infrastructure.
Industry and Energy Vulnerability: refers to the vulnerability of industrial and energy generation and transmission infrastructure and services to the effects of climate change, and recognises that industry and energy generation are important drivers for the economic development, growth and sectoral transition in the delta necessary to build resilience and adaptive capacity into the future.
Urban Settlements and Transportation Vulnerability: refers to the vulnerability of urban settlements and transportation to the effects of climate change, and recognises the need to protect people and property, and the importance of the transport system to support and promote regional development and economic growth in the Mekong Delta
2.2.2 Vulnerability Indicators The Vulnerability assessment process started with team meetings designed to develop questionnaires that were used to survey officials in the two provinces. The questionnaire was designed to make sure the information required to provide data for measures and indices considered to be useful by the experts in each sector was included. A description of the types of indicators that were recommended by the team of international experts is outlined in Appendix 1. The field district survey was executed in March and April 2011. And additional information was obtained from District - and Provincial Offices and also using pertinent document such as Provincial Master Plans.
The selection of vulnerability indicators was based on an assessment of the secondary literature on social vulnerability (including national and regional indicators for population, poverty and livelihoods), and a review of what data was available at provincial and district levels. A composite of over 40 independent ‘vulnerability indicators’ to describe the main sectoral areas and hazard that are nationally accepted and available were identified and are summarised in Table 5 below. We had to strike a balance here to accommodate data availability, internal and external validity of our inferences and duplicability of our approach. The importance, applicability and provincial values of each indicator are discussed in the chapters outlining the provincial profiles.

Climate Change Impact and Adaptation Study in Mekong Delta – Part A
16 | P a g e
The first phase of the vulnerability assessment is an evaluation of how specific systems, both natural and human, such as roadways, water resources, and industrial areas etc., were “exposed” to climate hazards and impacts. Baseline indicators outlined in Table 5 (below) describe the current situation and represent a measure of the current sensitivity and adaptive capacity. Maps of the current geographic extent of the exposure to the three climate change provide hazard indicators.
For each of the five sectors the districts were evaluated as a function of their comparative vulnerability across the key indices. To do this each district is first ranked by indicator, then, an average ‘comparative baseline exposure’ is calculated for each district.
In the second phase of the assessment, districts were rated according to their ‘respective sensitivity’ (low to very high) to future hazard projections generated from the hydrological modelling and coastal modelling work. The Forward Projection Indicators outlined in Table 5 (below) describe things that can be project forward. Population growth can be used to project changes in sensitivity indicators. And the output of the climate models showing future exposure to climate change impacts can be used to project changes in hazard indicators. The area affected by each hazard can be used to estimate the number of people that are projected to be affected. Hazard maps for flooding, inundation, saline intrusion and storm surge for 2030 and 2050 were used to forecast vulnerability under future conditions.
It should be noted that this is a relatively simple ranking methodology intended to allow us to compare ‘vulnerabilities’ between districts in the study area, and relies on the simplifying assumption that current vulnerability is a reasonable predictor of vulnerability under future climate change. For example, should climate change result in an increased frequency of flooding, a city at high risk from flooding today will be more vulnerable to this future impact than a city that currently has a low risk of flooding.

Climate Change Impact and Adaptation Study in Mekong Delta – Part A
17 | P a g e
Table 5 - Baseline and forward projection indicators used for each sector. Baseline Indicators Future Projection Indicators
Popu
latio
n
Total Population Population Density Average Family Size No. of Households Population at working age Average Natural Population Growth Rate
Total Population Population Density No. People Affected by each Hazard No. Households Affected by each Hazard
Pove
rty
Annual Average Income per Capita No. of Poor Households % of Poor Households No. of Teachers No. of Doctors Agricultural Land per person % Ethnic Households
Total no. of Poor Households Density of Poor Households No Poor Households Affected by each
Hazard % of Poor Households Affected by each
Hazard
Live
lihoo
ds
No. of Rural Households No. of Livelihood Streams No. of Employment Streams Employing >
10,000 or producing >250 Billion VND Average Annual GDP per Household Rice Crop Land per Person Aquaculture Land per Person
Total Population Agriculture land per Person No. Rural People Affected by each Hazard No Rural Households Affected by each
Hazard
Ener
gy &
Indu
stry
No. Households reliant on Industry Average Annual GDP per Household
contributed by Industry No. Households Connected to the National Grid Length of High/Medium Voltage Power Lines No. of Power Plants/High Voltage Substations % off-farm Income No. of Factories No. of Different Industries
No. Households reliant on Industry No. Households connected to the National
Grid No. Industry Reliant Households Affected
by each Hazard No. Households connected to the National
Grid Affected by each Hazard No Km of High Voltage Power Lines
Affected by each Hazard
Settl
emen
ts &
Tra
nspo
rt
Urban Population No. Urban Households Urban Area (ha) % Population That is Urban Access to Sewer/Septic Tank Access to Water Supply No. km of Major Waterways No. km of Major Roads No. km of District Roads No. Transport Hubs
Urban Population Urban Area Per Person (Ha) No. Urban Households Affected by each
Hazard Popn. of settlements Affected by each
Hazard No. Km Roads Affected by each Hazard

Climate Change Impact and Adaptation Study in Mekong Delta – Part A
18 | P a g e
2.2.3 Analysing Adaptive Capacity It is important to understand at this stage that our methodology for vulnerability assessment must not only represent and highlight the coupled natural–human system, but also the dynamic interaction between these components. In this light it is imperative to elucidate the existing adaptation capacity within a community as part of the evaluation of vulnerability required by our VRA framework.
Adaptive capacity is defined by Adger et al. (2004) as “the ability or capacity of a system to modify or change its characteristics or behaviour so as to cope better with existing or anticipated external stresses.” Adaptive capacity then can be characterised as a set of potential actions that contribute vulnerability, and can either influence either the existing or future exposure or sensitivity – or both.
Our approach to therefore has been to measure adaptive capacity in the same manner as for exposure and sensitivity through the adoption of a number of indicators that indicate the capacity of a community or system to build resilience (such as income levels, number of income streams, % people in full employment). These measures are then incorporated into our district profiles represent this potential on the vulnerability surface - so as to avoid distinguishing adaptive capacity from exposure and sensitivity measures and in order to keep it as an integrated whole system.
Like measures of vulnerability, measures of adaptive capacity vary considerably. The climate change literature is filled with attempts to develop specific indices of adaptive capacity that take into account all the factors that may go into adaptation and enhancement of resilience to climate hazards, but it has proven difficult to develop simple indicators, especially when the data from on-the-ground field studies has limitations (Yohe and Tol 2002; Smit and Wande 2006; Cutter et al. 2008). It is important that an assessment of adaptive capacity be informed by and reflective of exposure and sensitivity to climate impacts.
This study used statistical development indicators, such as the rankings for education, poverty incidence, income inequality, electricity coverage, irrigation, road density, and livelihoods of as indicators of vulnerability-resilience and adaptive capacity, which can be assessed with existing data sources by province or district.
Indicators used included measures of human resources capacity (i.e. literacy rates, health statistics etc), economic capacity (i.e. GDP per capita and measures of income inequality), Livelihood measures (diversity of occupations, income streams, number of adults in employment etc.) and social capacity (population density, percentage of productive land).
2.2.3.1 Institutional Capacity Adaptive capacity can also reflect the abilities of provincial and district agencies or organization responsible for managing natural and human systems. Their ability to adapt is determined by a range of issues, including their ability to collect and analyse information, communicate, plan, and implement adaptation strategies that ultimately reduce vulnerability to climate change impacts. In this study, institutional capacity is assessed through our focus group meetings and sectoral field surveys, and focused on the number, structure and effectiveness of climate change working groups; level of awareness of districts and localities; training and support for key government personnel in capacity for adaptation; presence of formal climate adaptation plans or strategies at local levels; experience with past climate disaster events; and communes and districts with active climate change working groups and programs.
As such Institutional capacity was not incorporated into the CVRA process.
Institutional capacity is further discussed in Section 9.

Climate Change Impact and Adaptation Study in Mekong Delta – Part A
19 | P a g e
2.2.4 Control Measures The proceeding discussions of vulnerability and adaptive capacity illustrated that factors such as poverty, inequality, health, access to resources and social status are likely to determine the vulnerability of communities and individuals to a range of different hazards. These “generic” determinants of vulnerability are incorporated into the indicators described above. However, vulnerability to a hazard will also depend on the extent to which populations and systems are exposed to the direct physical impacts of that hazard. Exposure will depend on a number of factors such as where populations choose to (or are forced to) live and how they protect their communities and livelihoods. Furthermore, the resilience of agricultural systems is determined by the extent to which existing coping measures such as dykes and irrigation structures are in place. The resilience of settlements and industry will depend on their location and the existence and status of dykes and other protection measures, while that of transport and energy infrastructure will depend on the depend on their location and building standards. These factors are “specific” to particular hazards and are not explicitly incorporated into the indices described above.
In order to incorporate measures of specific factors, an assessment of the existence and quality of hard measures to control the impacts of specific hazards was developed. Expert opinion was used to evaluate control measures for each of the five sectors as outlined in Table 6 below. Information on control measures was obtained through discussions and interviews with authorities at provincial and district levels, as well as from literature reviews for each sector. The assessments assumed that no further adaptation response (other than to existing climate risks) occurs to mitigate against climate change impacts for 2030 and 2050.
For each sector an assessment was made of; the adequacy of the control measures for the current situation, the adequacy of the measures to cope with projected climate change impacts in 2030, and in the adequacy of the measures to cope with projected climate change impacts in 2050.
The expert opinion of the existence and quality of control measures in each time period was incorporated into the vulnerability assessment as a weighting factor.
Table 6 - Components of hard control measures assessed by Expert opinion.
Component
Hazard
All hazards Inundation Salinity Storm surge
Agriculture & Livelihoods
Crop handling and processing,
Rice varieties, Cultivation methods
Dyke system Warning system
Sluice gates Coastal Dyke, Thick mangrove
belt Warning system
Settlements, Population and
Poverty
Suitable elevation of infrastructure
Urban drainage, Adherence to
suitable building codes
Water and sanitation
infrastructure
Coastal protection infrastructure
Warning system
Transport and Energy
Infrastructure
Suitable elevation of infrastructure
Dykes
Adherence to suitable building
codes
Suitable Building Materials
Coastal dyke and protection systems

Climate Change Impact and Adaptation Study in Mekong Delta – Part A
20 | P a g e
2.2.5 Vulnerability Profiles Figure 8 illustrates how the vulnerability assessment is used to develop ‘vulnerability profiles’ for each district. Conceptualising the dimensions of vulnerability using the radial graphs allowed us to examine and describe how the different aspects of vulnerability are related to each other, and for combining the findings from district and sectoral surveys with the outputs from the hydrological and coastal impact models. The shape and area of the vulnerability profile expressed in this form is proportional to sensitivity and exposure less the adaptive capacity. This approach links environmental and socio‐economic dimensions with the capacity for local communities and institutions to adapt to climate change.
While the specific functional form of vulnerability will vary by context and location, the general relationship between the sectoral dimensions and indicators allows us to characterize the vulnerability profile for each district. The goal is not to simply define quantifiable measures, but rather to represent inter-relationships between natural and human systems in a standard form that can be used as a tool to compare and contrast vulnerability in both a temporal and geospatial context.
Figure 8 illustrates how the profile can be used to predict the changes in scale and extent of sectoral vulnerabilities over time and provide an insight into which sectors and locations to intervene to build climate change resilience.
Figure 8 - Graphic representation of the five dimensions of vulnerability at the district level
-
5
10
15
20Population
Poverty
Agriculture &Livelihoods
Energy & Industry
Settlements &Transport
District Vulnerability Profile
Current
2030 A2
2050 A2

Climate Change Impact and Adaptation Study in Mekong Delta – Part A
21 | P a g e
2.2.6 Mapping Vulnerability The impacts of climate change vary across geographical regions (IPCC 2007). This study has developed a range of maps that sequentially identify climate change hazards, sectoral vulnerability and risk hotspots. Figure 8 (above) illustrates the five-dimensional profile where vulnerability is determined simply as a measure of sensitivity, exposure and adaptive capacity. These functions are then converted into ‘vulnerability maps’ which in turn have been used to compare vulnerabilities of each district based on the hazard maps for 2030 and 2050, together with the current baseline data for 2010.
Vulnerability mapping not only demonstrates the projected differentiation of regional impacts and vulnerabilities under the A2 and B2 climate change scenarios over time, but also provides a means for making comparisons between sectors, scenarios, provinces and districts in the study area to tackle questions such as:
Which geographic areas are most vulnerable to global change?
How do the vulnerabilities of the provinces compare?
Which sectors are the most vulnerable in a certain province or district?
What areas or sectors face the greatest risks?
It must be stressed however, that the estimates developed for future vulnerability under different climate change scenarios are at a relatively coarse-scale, and whilst vulnerability profiles were developed for both A2 and B2 Emission Scenarios for three time slices (current 2010, 3030 and 2050), only the A2 maps are presented in this Report for illustrative purposes. These scenarios are considered mid-range (B2) and high (A2), however as global emissions are currently tracking above
Interpreting Vulnerability Profiles The vulnerability profile illustrates the change in the vulnerability of a district over time in each of the five sectors. The shape of the profile for each time period can be interpreted on a sector by sector basis. Equal vulnerability for each sector will produce a balanced star shape, and deviations from the star indicate sectors that are more or less vulnerable. The hypothetical example above indicates: Current situation - while the control measures currently in place keep the vulnerability of the district low across all sectors, the vulnerability of the agriculture and livelihood sector is higher and the vulnerability of the energy and industry sector is lower. An analysis of the values of the varios indicators that make up each sector will reveal the factors that contributing to the different vulnerabilities. Low energy and industry vulnerability would likely reflect a low amount of development in the province. And high vulnerability to agriculture could be due to a high reliance on rice based systems that are exposed to inundation or salinity.
As the population grows and the exposure to hazards increases districts become increasingly vulnerable and the ability of the existing control measures to cope with the projected impacts is reduced.
2030 - the district becomes increasingly vulnerable . While the profile maintains a similar shape, the vulnerability to poverty increases more that for the other sectors. This may be due to a high initial proportion of poor households that is projected to increase and become exposed to climate change hazards. 2050 – the population growth, lack of adequate control measures and increased exposure have combined to increase vulnerability in all sectors. Agriculture and livelihoods show a more pronounced increase in vulnerable. The particular causes can be determined by an analysis of the indicators. An example of causes may be that vulnerability due to a large rural population and limited alternative income sources is exacerbated by a dwindeling amount of available rural land per head of population.

Climate Change Impact and Adaptation Study in Mekong Delta – Part A
22 | P a g e
the highest A1Fi scenario it should be considered that even the A2 hazard maps are potentially conservative with regards to actual climate impacts.
In reality, there was little appreciable difference between vulnerability assessed under the A2 and B2 scenarios over the 2030 and 2050 time periods – and these differences were not sufficient to affect the vulnerability mapping to any appreciable degree.
2.2.7 The Adaptation Assessment Process The focus of the overall study is the identification of potential adaptation options and strategies for each province in order to reduce vulnerability to risks. Part A of the study includes an assessment of the communities’ adaptive capacity to accommodate future climatic conditions, and considers the community’s current adaptive capacity, as well as the sustainability of current coping mechanisms. Figure illustrates our approach to evaluating vulnerability and risks, and identifying areas for strategic adaptation intervention that are aimed at reducing vulnerability to those risks. This approach combines the processes of vulnerability and risk estimation with the identification of areas where adaptation options, measures and strategies aimed at reducing vulnerability and risk, and at building resilience and adaptive capacity will be most required.
This conceptual approach is based on and incorporates aspects from frameworks currently in use internationally for ecological and social risk assessment studies, and their associated terminology.
The application of this approach provides a solid base for managing climate change risk for Ca Mau and Kien Giang in the future. In simple terms, risk management is about avoiding unacceptable consequences. Defining risk involves making many subjective judgements, based on limited available information and best judgement.
In this context the important point is that climate change decision making is essentially about determining what is the best course for the near-term, given the expected long-term climate change and accompanying uncertainties, and this requires frequent revision as new information comes to hand which alters the level of uncertainty. Thus adaptation planning should be considered as an on-going and iterative process – and not a one off exercise.

Climate Change Impact and Adaptation Study in Mekong Delta – Part A
23 | P a g e
Figure 9 - The CVRA Assessment and Adaptation Planning Process

Climate Change Impact and Adaptation Study in Mekong Delta – Part A
24 | P a g e
2.3 Identifying and Analysing Future Risk Various risk assessment methods and tools have been developed around the world, encompassing a broad range of application from cross cutting methods to specific sectoral methods from a local to global scale. Social and ecological assessments typically focus on vulnerability and sensitivity.
People are considered to be at ‘risk’ when they are unable to cope with a hazard. A disaster occurs when a significant number of vulnerable people experience a hazard and suffer from severe damage and/or disruption of their livelihood system in such a way that recovery is unlikely or prolonged, especially without external assistance.
Risk is assessed based on the probability of a particular climatic outcome multiplied by its consequences. This study focuses on four main considerations for assessing risks relating to sea level rise, flooding, inundation, salinity and the consequences of storm surges:
The negative impacts on the sustainability of the local economy, and especially to household livelihoods;
The negative impacts social vulnerability e.g. the incidence of extreme events with respect to mortality or social disruption;
The negative impacts to physical infrastructure and the intended service it provides to the community, industry, government and the natural environment (including buildings, roads, ports, water and electricity infrastructure etc.); and
The biophysical vulnerability that may be related to the disturbance of coastal and riverine environments and systems.
This study used the results from the exposure modelling together with the key observations and findings from the sectoral consultations and surveys to determine the relative levels of risk for a particular threat source - expressed as a function of ‘likelihood’ and ‘consequence’ to highlight the major risks at the district and provincial levels.
The risk assessment process involved rating the future risk, using the qualitative measures of ‘likelihood ’ and ‘consequence’ of potential climate change impacts on each of the target sectors as highlighted in Table 7, and the likelihood and consequence descriptors in Table 8 and Table 9, to determine the risk rating for each of the identified risks.

Climate Change Impact and Adaptation Study in Mekong Delta – Part A
25 | P a g e
Table 7 - Risk Rating Matrix
Likelihood
Consequences
Insignificant 1
Minor 2
Moderate 3
Major 4
Catastrophic 5
Almost certain (5) M (5) M (10) H (15) E (20) E (25) Likely (4) L (4) M (8) H (12) H (16) E (20) Possible (3) L (3) M (6) M (9) H (12) H (15) Rare (2) L (2) L (4) M (6) M (8) M (10) Unlikely (1) L (1) L (2) L (3) L (4) M (5)
E = >20 Extreme risks; require urgent attention to implement adaptation options immediately.
H = 12 - 20 High risks; requiring attention to developing adaptation options in the near term.
M = 5 - 12 Medium risks; it is expected that existing controls will be sufficient in the short term but will require attention in the medium term and should be maintained under review.
L = <5 Low risks; Control measures should be maintained under review but it is expected that existing controls will be sufficient and no further action will be required to treat them unless they become more sever.
Table 8 - Qualitative Measures of Likelihood
Level Descriptor Recurrent risks Single events
5 Almost Certain Could occur several times per year
More likely than not - Probability greater than 50%
4 Likely May arise about once per year
As likely as not - 50/50 chance
3 possible May arise once in ten years
Less likely than not but still appreciable - Probability less than 50% but still quite high
2 Rare May arise once in ten years to 25 years
Unlikely but not negligible - Probability low but noticeably greater than zero
1 Unlikely Unlikely during the next 25 years
Negligible - Probability very small, close to zero
The framework for assessing consequence is outlined below in Table 3.

Climate Change Impact and Adaptation Study in Mekong Delta – Part A
26 | P a g e
Table 9 - Risk Assessment Matrix
Level Infrastructure Services Community Local Economy Natural Environment
1 In
sign
ifica
nt
No infrastructure damage. No adverse human health effects or complaint.
Minor negative impacts on key economic elements (i.e. rice production, aquaculture, tourism, fisheries)
No environmental damage
2 M
inor
Localised infrastructure service disruption. No permanent damage. Some minor restoration work required. Early renewal of infrastructure by 5-10%.
Short-term disruption to employees, customers and all community. Slight adverse human health effects or general amenity issues. Isolated but noticeable examples of decline in social cohesion
Temporary disruption to one key economic element (i.e. agricultural production, tourism, fisheries)
Minor instances of environmental damage that could be reversed i.e. negative impact on a specific species
3 M
oder
ate
Widespread infrastructure damage and loss of service. Damage recoverable by maintenance and minor repair. Partial loss of local infrastructure. Early renewal of Infrastructure by 10-20%
Frequent disruptions to employees, customers or neighbours. General appreciable decline in social cohesion
Temporary disruption to one or more key economic elements (i.e. agricultural production, tourism, fisheries)
Isolated but significant instances of environmental damage that might be reversed with intense efforts i.e. reduced fish stock
4 M
ajor
Extensive infrastructure damage requiring extensive repair. Permanent loss of regional infrastructure services, e.g. a bridge washed away by a flood event. Early renewal of Infrastructure by 20-50%. Retreat of usable land i.e. agricultural and residential land
Permanent physical injuries and fatalities may occur from an individual event. Negative reports in national media. Severe and widespread decline in services and quality of life within the community
A key element of the economy is disrupted for an extended period of time (i.e. phosphate mines, tourism or fisheries)
Sever loss of environmental enmity and a danger of continuing environmental damage
5 C
atas
troph
ic Permanent damage and/or loss of
infrastructure service across state. Retreat of infrastructure support and translocation of residential and commercial development.
Severe adverse human health effects – leading to multiple events of total disability or fatalities. Emergency response. Region would be seen as unable to support its community
More than one key element of the economy is disrupted for an extended period of time (i.e. phosphate mines, tourism or fisheries)
Major widespread loss of environmental amenity and progressive irrecoverable environmental damage i.e. death of coral reef

Climate Change Impact and Adaptation Study in Mekong Delta – Part A
27 | P a g e
2.3.1 Risk Assessment
As the spatial extent of the three major impacts under consideration can be mapped, a range of consequence ratings could be determined depending on the exposure to the impact. Similarily the likelyhood of each hazard could also be determined. The risk values used in the study are presented in Table 10. The consequences and likelihoods were considered using the current (2010) level of adaptation response to climate change and do not include any uptake of potential adaptation responses by 2030 and 2050.
Table 10 - Values of likelihood and consequence used for levels of exposure to each climate change impact.
Exposure Consequence Likelihood Risk
Inun
datio
n
< 25% of Area Insignificant 1 Likely 3 4 Low < 75% of Area Minor 2 Likely 4 8 Moderate
>75% of Area and deep
Moderate 3 possible 3 9 Moderate
Salin
ity < 50% of Area Insignificant 1 certain 5 5 Moderate
>50% of Area Minor 2 certain 5 10 Moderate
Stor
m S
urge
Localised Minor 2 Rare 2 4 Low Widespread Moderate 3 Rare 2 6 Moderate Extensive Major 4 Rare 2 8 Moderate Permanent Catastrophic 5 Rare 2 10 Moderate
2.3.2 Identifying Hotspots
Hotspots are defined as geographical areas that inherently have the highest vulnerability to a climate change hazard or combination of hazards. These are considered to be the most vulnerable and highest-risk areas and include urban settlements, areas of significant transport, energy and industrial infrastructure, and rural areas that are highly exposed to the impacts of climate change (such as agricultural areas affected by sea level rise and inundation).

Climate Change Impact and Adaptation Study in Mekong Delta – Part A
28 | P a g e
3. Climate Change The Mekong Delta is almost entirely below 5 m above sea level, making it one of the 3 most vulnerable deltas in the world to sea level rise. If no mitigation measures are taken, about 38% of the delta would be submerged if the sea water rose by 1 m (Carew-Reid 2007). Compounding this is the possibility that the impacts of anthropogenic climate change could increase the frequency and intensity of extreme weather events (e.g. floods, droughts, typhoons etc.).
Increased extent and duration of flooding, changes in wet season and dry season precipitation, inundation from sea level rise and changes to salinity intrusion represent significant threats to the region’s agricultural and fisheries productivity, as well as what remains of the natural coastal ecosystems. Extreme hydroclimate events that effect water resources (e.g. like longer drought spells, earlier and more severe floods, higher temperature) are already affecting the crops and aquaculture production. Heavily populated, the Delta is also under threats associated with the spreading of tropical diseases caused by higher temperature.
3.1 Climate in the Mekong Delta The climate in the delta is tropical monsoon and is influenced by both the southwest and northeast monsoons. In general the dry season runs from December to April while the wet season is from May to November. The average annual temperature in the delta is close to 28°C. The mean monthly evaporation is around 150 mm. Monthly precipitation ranges between 0 mm in the dry season and around 250 mm in the wet season. There is a considerable spatial variation in annual rainfall across the Delta with average annual rainfall ranging from less than 1,500 mm in the northwest and central regions to over 2,350 mm in the south.
Floods are a common feature in the Delta, and one which local people have learned to cope with. Recently the Government of Vietnam adopted a ‘Living with Floods’ Strategy for the Mekong River Delta, meaning more attention to flood protection and the conservation of natural systems and ecosystem services.
3.1.1 Observed Changes IMHEN have performed detailed analysis of climate records for the past 50 years (IMHEN 2010a and MONRE, 2011). Based on this analysis a number of noteworthy trends in climate parameters have been detect. Discussion of these trends is provided below.
3.1.1.1 Air Temperature Air temperature evolution is important because it can have direct and indirect impacts on human activities. Increasing air temperature is especially important as a source of numerous indirect impacts (from sea level rise to enhanced cyclonic activities). Indeed, it is the main driving pattern of climate change impacts.
In Vietnam, the annual average temperature increased by about 0.5°C in the past 50 years and rainfall decreased in the northern part of the country and increased in the southern part of the country (Figure 10a).
Across Vietnam, the change in maximum temperature generally ranged from -3°C to 3°C from the current maximum. The minimum temperature change was -5°C to 5°C from the current minimum. The general trend of maximum and minimum temperature is increasing, with the minimum
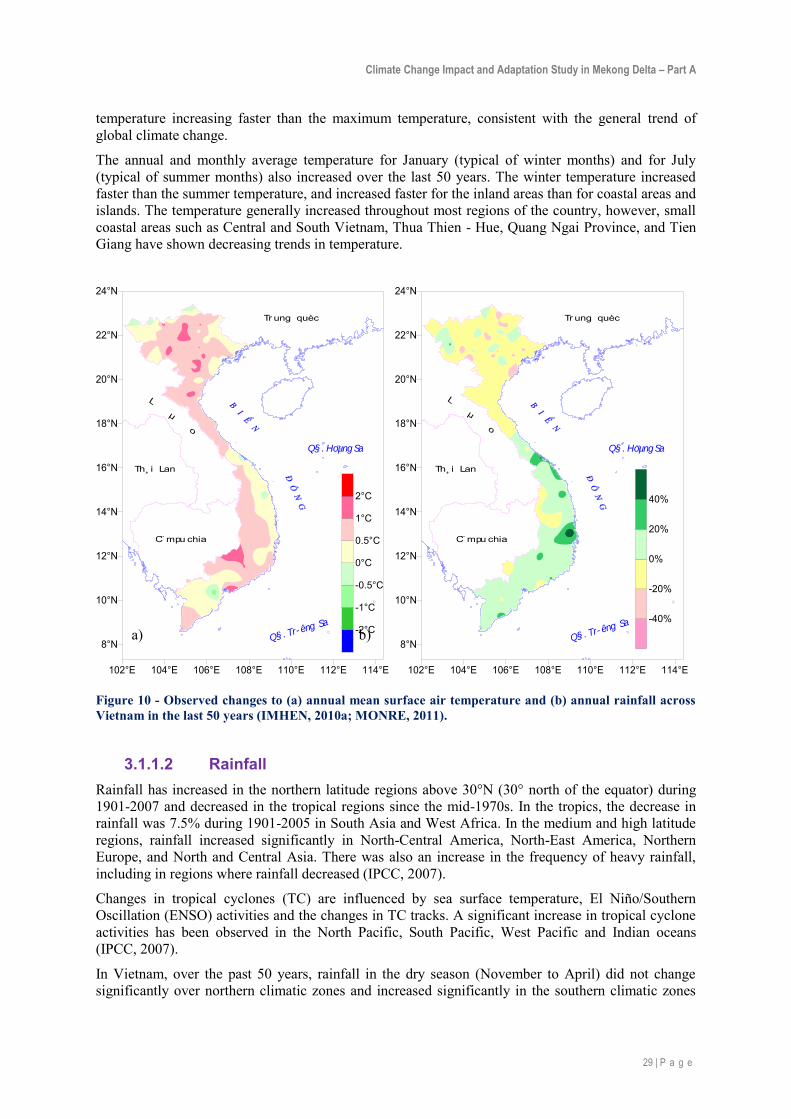
Climate Change Impact and Adaptation Study in Mekong Delta – Part A
29 | P a g e
temperature increasing faster than the maximum temperature, consistent with the general trend of global climate change.
The annual and monthly average temperature for January (typical of winter months) and for July (typical of summer months) also increased over the last 50 years. The winter temperature increased faster than the summer temperature, and increased faster for the inland areas than for coastal areas and islands. The temperature generally increased throughout most regions of the country, however, small coastal areas such as Central and South Vietnam, Thua Thien - Hue, Quang Ngai Province, and Tien Giang have shown decreasing trends in temperature.
Figure 10 - Observed changes to (a) annual mean surface air temperature and (b) annual rainfall across Vietnam in the last 50 years (IMHEN, 2010a; MONRE, 2011).
3.1.1.2 Rainfall Rainfall has increased in the northern latitude regions above 30°N (30° north of the equator) during 1901-2007 and decreased in the tropical regions since the mid-1970s. In the tropics, the decrease in rainfall was 7.5% during 1901-2005 in South Asia and West Africa. In the medium and high latitude regions, rainfall increased significantly in North-Central America, North-East America, Northern Europe, and North and Central Asia. There was also an increase in the frequency of heavy rainfall, including in regions where rainfall decreased (IPCC, 2007).
Changes in tropical cyclones (TC) are influenced by sea surface temperature, El Niño/Southern Oscillation (ENSO) activities and the changes in TC tracks. A significant increase in tropical cyclone activities has been observed in the North Pacific, South Pacific, West Pacific and Indian oceans (IPCC, 2007).
In Vietnam, over the past 50 years, rainfall in the dry season (November to April) did not change significantly over northern climatic zones and increased significantly in the southern climatic zones
102°E 104°E 106°E 108°E 110°E 112°E 114°E
8°N
10°N
12°N
14°N
16°N
18°N
20°N
22°N
24°N
Tr ung quèc
C̈ m pu chia
Th¸ i Lan
Q§ . Hoµng Sa
L µ o
Q§ . Tr êng Sa-2°C
-1°C
-0.5°C
0°C
0.5°C
1°C
2°C
102°E 104°E 106°E 108°E 110°E 112°E 114°E
8°N
10°N
12°N
14°N
16°N
18°N
20°N
22°N
24°N
Tr ung quèc
C̈ m pu chia
Th¸ i Lan
Q§ . Hoµng Sa
L µ o
Q§ . Tr êng Sa -40%
-20%
0%
20%
40%
a) b)

Climate Change Impact and Adaptation Study in Mekong Delta – Part A
30 | P a g e
(Figure 10b). Rainfall in the wet season (May to October) decreased about 5 to 10% for most of the northern part of the country and increased about 5 to 20% in the southern climatic zones.
In Vietnam the maximum daily rainfall increased in almost all climatic zones, particularly in recent years. The number of days of heavy rainfall also tended to increase proportionally, with much fluctuation occurring in the central region. The increase in the number of heavy rainfall days in the southern climatic zones related to the increase in air temperature and sea surface temperature in the east equatorial Pacific.
Both monthly and seasonal droughts tended to increase, however, the rate differs between regions and between stations in each climatic zone. The occurrences of heat wave conditions have increased markedly in some regions of Vietnam, particularly in the central and Southern areas.
Extreme events
CLIMsystems examined historical extreme rainfall (mm per period), for various return periods between 5 and 300 years and consecutive day events of 1-6 days. See Section 3.3.1.3 SIMCLIM Extreme Event Analysis on page 38 for a description of the analysis.
Figure 11 shows the results of the historical extreme rainfall analysis for Ca Mau City.
Figure 11 - Ca Mau City - Historic (observed) extreme rainfall (mm per event) for varying return periods and multi-day events. Source CLIMsystems.
The figure shows that in Ca Mau, one day rainfall events of around 136 mm have historically occurred on average once every five years, while 225 mm one day events occurred on average every 300 years. As would be expected the amount of rainfall increases with the length of the event. A six day event of 282 mm occurred on average once every 5 years while one of 614 mm occurred on average once every 300 years. The size of the 1 in 100 year extreme rainfall event is 203 mm for a one day event and 503 mm for a six day event. The study indicates that in Ca Mau, extreme rainfall events in the order of around 250 mm due to five to six day events or rarer larger one day events occur with a return period of 5-10 years and that large consecutive day rainfall events of over 300 mm occur at a 1 in 100 yr interval.
Figure 12 shows the results of the historical extreme rainfall analysis for Rach Gia City.

Climate Change Impact and Adaptation Study in Mekong Delta – Part A
31 | P a g e
Figure 12 - Rach Gia - Historic (observed) extreme rainfall (mm per event) for varying return periods and multi-day events. Source; CLIMsystems.
The figure shows that in Rach Gia, one day rainfall events of around 164 mm have historically occurred on average once every five years, while 342 mm one day events occurred on average every 300 years. As would be expected the amount of rainfall increases with the length of the event. A six day event of 311 mm occurred on average once every 5 years while one of 588 mm occurred on average once every 300 years. The size of the 1 in 100 year extreme rainfall event is 292 mm for a one day event and 511 mm for a six day event.
The study indicates that extreme rainfall events in the order of around 250 mm due to five to six day events or rarer larger one day events occur with a return period of 5-10 years and that large consecutive day rainfall events of over 500 mm occur at a 1 in 100 yr interval.
3.1.1.3 Sea Level Rise Sea level rise is consistent with the warming trend due to the contributions of:
Thermal expansion in oceans;
Melting ice in Greenland and Antarctica and other areas; and
Water holding capacity in the mainland.
With warming of the sea surface temperature, the global ice mass has decreased in the 20th century. Records since 1978 indicate that the annual average ice in the Arctic Ocean has decreased approximately 2.7% (from 2.1 to 3.3%) per decade (IPCC, 2007).
Studies from global sea level data showed that the global mean sea level increased about 1.8 0.5 mm/year during 1961-2003. Contribution from thermal expansion was about 0.42 0.12 mm/year and ice melt was about 0.7 0.5 mm/year over this period (IPCC, 2007).
Observation data from TOPEX/Poseidon satellite during 1993-2003 showed that speed of global sea level rise was about 3.1 ± 0.7 mm/year. The speed of sea level rise during 1993-2003 was faster than for during 1961-2003.

Climate Change Impact and Adaptation Study in Mekong Delta – Part A
32 | P a g e
In Vietnam, observed sea level data at coastal marine stations show differing trends in average sea levels. Most stations tend to increase; however, a few stations do not clearly reflect this trend. Along the coast of Vietnam, the average sea level change is about 2.8 mm per year.
Sea level data measured by satellite for the period of 1993 to 2010 show that the rising trend of sea level in the East Sea is 4.7 mm/year, Figure 13. For coastal Vietnam, the greater rising rate is in Central Vietnam and in the west of the Mekong delta. For the entire Vietnam coast, average rate is an increase of 2.9 mm/year (IMHEN, 2010).
Figure 13 - Changes to sea level (metres) around Vietnam inferred from satellite data (1993-2010) (IMHEN, 2010b; MONRE, 2011).
Flooding is a regular seasonal feature of the Mekong Delta and people are accustomed to dealing with it on an annual basis. In this study the impact of climate change on flooding and inundation is expressed in relation to the extreme flood event that occurred in September 2000 (considered to be a 1 in 100 year flood). This event provides a “real life” marker from which comparisons can be made and adaptation strategies assessed. Figure 14 illustrates the modelled maximum flooding and inundation scenarios for the year 2000 baseline event.

Climate Change Impact and Adaptation Study in Mekong Delta – Part A
33 | P a g e
Figure 14 – Modelled maximum extent of the inundation of Kien Giang and Ca Mau during the 2000 extreme flood event.

Climate Change Impact and Adaptation Study in Mekong Delta – Part A
34 | P a g e
3.2 Global Climate Change Climate change is a major environmental challenge for Vietnam. The main indicator of climate change is global warming due to greenhouse gas emissions from human activities. Over the past 100 years (1906-2010), the global average temperature has increased about 0.74°C, with most of this increase occurring during the last 50 years (Figure 15). Climate change is also projected to cause strong fluctuations in rainfall and an increase in extreme events such as floods, droughts and typhoons. Rising sea levels will also directly affect coastal areas, potentially inundating land or increasing salinity, decreasing mangrove forest areas, and increasing the cost of maintaining port facilities and coastal urban areas.
3.2.1 Climate Change and Emission Scenarios In 2000 the IPCC published a series of projected greenhouse gas emissions scenarios that could be used to assess potential climate change impacts. The Special Report on Emission Scenarios, known as the ‘SRES scenarios’, grouped scenarios into four families of greenhouse gas emissions (A1, A2, B1, and B2) that explore alternative development pathways, covering a wide range of demographic, economic, and technological driving forces:
A1 – the story line assumes a world of very rapid economic growth, a global population that peaks mid-century and the rapid introduction of new and more efficient technologies. A1 is divided into three groups that describe alternative directions of technological change: fossil intensive (A1Fi), non-fossil energy resources (A1T), and a balance across all sources (A1B).
B1 – describes a convergent world, with the same global population as A1, but with more rapid changes in economic structures toward a service and information economy.
B2 – describes a world with intermediate population and economic growth, emphasising local solutions to economic, social, and environmental sustainability.
A2 – describes a very heterogeneous world with high population growth, slow economic development and slow technological change.
The emission projections are widely used in the assessments of future climate change, and their underlying assumptions with respect to socioeconomic, demographic and technological change serve as inputs to many climate change vulnerability and impact assessments. Greenhouse gas emissions trajectories under various scenarios are depicted in Figure 16.
Global emissions are currently tracking close to (or possibly higher than) the A1Fi emissions scenario and it is unlikely that emissions will be constrained to the low or medium emissions target.
The climate change and sea level rise scenarios developed and published for Vietnam in 2009 were based on the low (B1), medium (B2) and high (A2, A1Fi) scenarios. The average B2 scenario was
Figure 15 - Time series of globally averaged temperature anomaly (Source: IPCC, 2007)

Climate Change Impact and Adaptation Study in Mekong Delta – Part A
35 | P a g e
recommended for all ministries, sectors and localities to initially assess the impact of climate change and sea level rise and to build action plans to respond to climate change. Using results of previous studies as a basis, the 2011 updated climate change and sea level rise modelling selected the following greenhouse gas emissions scenarios: B1 (low scenario), B2, A1B (middle scenario), A2 and A1Fi (high scenario).
For the purposes of this study, climate change modelling (including regional downscaling) has been completed by IMHEN using B2 and A2 scenarios, which have been used as inputs for the hydrological modelling. Coastal modelling has also been completed using the B2 scenario only. This is due to the very minor differences between the two scenarios up to 2050 that were found in the IMHEN modelling.
Figure 16 - Greenhouse gas emissions scenarios and the associated projected changes in global average surface temperature (from IPCC, 2007).
3.3 Climate Models and Downscaling Based on the review of relevant literature relating to climate change impacts and adaptation and the preliminary analysis of secondary data for the Mekong Delta region undertaken during the project it was evident that there are significant knowledge gaps and limitations surrounding the quantification of climate change impacts in Vietnam, especially for the Mekong Delta region. There are many reasons for this but the main one is that projecting the future impacts of climate change (for Vietnam or anywhere else in the world) is an evolving science, and providing locally specific (i.e. less than the ~250 km2 GCM grid resolution) interpretations of those projections is even more complex. The official climate model prepared by the Vietnamese government uses MAGICC/SCENGEN 5.3, and identifies climate change and sea level scenarios for Vietnam in the 21st century.
The MONRE report ‘Climate Change, Sea Level Rise Scenarios for Vietnam’ (2009), outlines climate change scenarios for a select range of climate change development scenarios: Low emissions scenario (B1); Intermediate emissions scenario of the medium scenario group (B2); and the intermediate

Climate Change Impact and Adaptation Study in Mekong Delta – Part A
36 | P a g e
scenario of the high emission scenario group (A2). Climate change scenarios for temperature and rainfall were developed for seven climate zones in Vietnam, including the Mekong Delta region.
The Climate Change, Sea Level Rise Scenarios for Vietnam report also highlighted a range of sea level rise scenario’s that were developed for a range of different emission scenarios: low (B1); medium (B2); and high (A2 and A1Fi). Since that time IMHEN have released the ‘Sea level rise – scenarios and possible risk reduction in Vietnam’ report in 2010, which significantly improves the climate change and sea level projections for Vietnam, and provides sea level scenarios for 25 cm, 50 cm, 75 cm and 100 cm.
IMHEN recently completed statistical downscaling for the whole Mekong Delta for the primary climate variables. In order to assess the impacts of climate change in the Mekong Delta and Ca Mau and Kien Giang, this study utilised the statistically downscaled data for temperature and rainfall, together with the regionally downscaled scenarios for sea level rise (IMHEN 2010) and the latest hydrological river flow scenarios developed for the Mekong mainstream above Kratie by the Mekong River Commission. The scenarios developed by the MRC were based on PRECIS, and have been used in a number of reports prepared by IMHEN relating to climate change impacts in the Mekong River upstream of Vietnam. As of mid-March 2011, the official Digital Elevation Model for the Mekong Delta was released and a copy was made available for use by the project.
3.3.1 Modelling used in the Project The approach and methodology employed to produce the climate change scenarios and climate change impact assessments is illustrated in Figure 17. The components that were used to produce the final outputs are described below.
Figure 17 - Schematic outlining this project’s climate change scenario and impact assessment methodology.
SIMCLIM modelling Outputs: Extreme rainfall
events

Climate Change Impact and Adaptation Study in Mekong Delta – Part A
37 | P a g e
After investigating the detail and the relevance to climatic conditions of Vietnam, a range of modelling applications were selected for use in this study, as outlined in Table 11. SDSM and SIMCLIM software were also used for reference and comparison.
Table 11 - Methods and outputs of the regional climate modelling used in this study.
Variable Modelling method Emission scenarios
Monthly, seasonal, annual average temperature and precipitation
Statistical downscaling using SimCLIM which incorporates outputs from 21 GCMs used in IPCC AR4
A2, B2, B1
Annual average sea level rise Dynamical downscaling using PRECIS A1Fi, B2, B1 Maximum and minimum monthly, seasonal, annual temperature
Dynamical downscaling using PRECIS B2
Number of days >35°C Output from Japan’s MRI AGCM A1B Seasonal and annual average relative humidity and wind speed
Dynamical downscaling using PRECIS B2
Information for all downscaling except Japan’s MRI AGCM was produced for a baseline period (1980-1999, consistent with IPCC AR4) and future 20 year time slices centred on 2030, 2050, 2070 and 2090 (i.e. 2020- 2039, 2040-2059, 2060-2079, 2080-2099 respectively). For Japan’s MRI AGCM the baseline (i.e. current) period is 1979-2003 and future scenarios are available for ‘near future’ (2015-2039) and ‘distant future’ (2075-2099). The spatial resolution of the climate change scenarios was to 20 km (for outputs of AGCM / MRI), 25 km (for outputs of PRECIS) and about 30 - 50 km for outputs of statistical downscaling.
3.3.1.1 Statistical Downscaling Methods The compatibility of the transfer functions used in the statistical downscaling can be tested by examining the magnitude of the linear correlation between the temperature or rainfall simulations and observations in Vietnam. For temperature, the correlation coefficient ranged from 0.65 to 0.95. The transfer function is therefore considered to be reliable, especially in the winter months. For rainfall, the correlation coefficient ranged from 0.4 to 0.7 in the dry season and about 0 to 0.2 or less in the rainy months. The transfer function is somewhat reliable in the dry season and but is not reliable for the rainy season. Statistical downscaling was therefore only used for annual rainfall.
3.3.1.2 Outputs of the AGCM / MRI model The quality of the temperature simulation model AGCM / MRI for the period 1979-2003 for stations in Vietnam was good; however, differences existed between simulated and measured temperature particularly for stations in Central and Southern Vietnam. The average temperature difference is up to 2-3°C.
For rainfall, the changes in the precipitation process were simulated quite well for the stations of the North, Central, and Southern Highlands. The model simulation did not reflect the rainfall during the peak rainy season in South Central.
PRECIS model
To assess the ability to simulate the PRECIS climate model in Vietnam, the Climate Research Unit (CRU) reanalysis data with a resolution of 0.5° x 0.5° were used for monitoring data stations in

Climate Change Impact and Adaptation Study in Mekong Delta – Part A
38 | P a g e
Vietnam. The assessment results showed a good model simulation for temperature (for both spatial distribution and values), with a small difference between the model and CRU data. However, the PRECIS model simulations of rainfall were lower than CRU data analysis in Central and South.
Results assessing the regional climate simulation period 1961-2000 with data sources ERA40 reanalysis show that the temperature variable in the simulation correlates well with the observed values. The correlation between observed temperature and that simulated by PRECIS was 0.5 to 0.8, the average maximum temperature difference was about 1-2°C and typically fell in the winter months.
Years of variable rainfall simulation match observed value in the North and the South. The model did not reflect the rainfall in the months of peak season in Central Vietnam. Correlation between simulated rainfall and observed rainfall was relatively high in the dry season, and relatively low or negative in the southern part of the country during the rainy season, with simulated rainfall usually lower than observed rainfall.
3.3.1.3 SIMCLIM Extreme Event Analysis The evaluation of observed and modelled trends has shown that the confidence in GCM projected extremes of precipitation is much less than that of temperature (e.g. Kharin et al. 2007). On the other hand, given the current state of scientific understanding and the limitations of GCMs in simulating the complex climate system, a large ensemble of GCM simulations is more appropriate in climate change projections than using individual GCM simulation outputs, particularly if such projections will be used for impact assessments (Murphy et al., 2004).
In order to demonstrate the expected changes in extreme precipitation, extreme precipitation change projections were derived for Ca Mau City and Rach Gia City by CLIMsystems. In lieu of the above, an extension of the pattern scaling method to extreme event analysis was used for analysing the climate change impact on extreme precipitation using daily GCM outputs at their original spatial resolution (Li and Ye, 2011). Research using the method for New Zealand and Australia extreme rainfall analysis has generated improved results that conform to other scientific research findings (Li and Ye, 2011). A step by step methodology is outlined in Appendix 4.
Projections for changes in multiple day and one day extreme rainfall events were explored for 2030 and 2050 (A2 and B2) by applying ensemble pattern scaling to the daily precipitation output of 12 GCMs. Two site specific extreme rainfall analyses with a medium sensitivity have been conducted by analysing of the historical daily rainfall record for Ca Mau City and Rach Gia City climate station from 1 January 1979 to 31 December 2007. The 5, 10 and 100 year return periods are examined using the specified 2030 and 2050 future projections.
The methods employed in the SIMCLIM modelling involve the following limitations and uncertainties:
Historical observation data limitations: Values presented in the study must be viewed as best estimates. The most important limitation in relation to this study is that historical meteorological observation data are not compiled appropriately for use in climate modelling.
Uncertainty in projections: SRES A2 and B2 with medium sensitivity were selected as high and low range scenario for future global mean temperature increases which then drive extreme precipitation. These scenarios are conservative and may unvalued the effects on climate change on extreme event frequency and magnitude. The uncertainty related to the projected temperature and precipitation values generated by the various GCMs was represented by the 25th, 50th and 75th statistical percentiles. However, the uncertainty range presented in this report cannot cover the full range of uncertainties of future climate change.

Climate Change Impact and Adaptation Study in Mekong Delta – Part A
39 | P a g e
Uncertainty in translating GCM (global)-scale results to the local Mekong Delta scale, particularly for extreme events: The future projections of precipitation were generated from AR4 GCMs using pattern scaling and spatial interpolation methods. No dedicated downscaling approach was applied for the study area. However this approach is based on the best available knowledge for this location. Further information on the Pattern Scaling Methodology is presented in Appendix 4.
3.3.1.4 Summary of model Application The comprehensive climate scenario modelling work used in this study represents an update to the scenarios produced in MONRE (2009). As such, our project utilizes the most up to date climate scenario information that is available for Vietnam. However a number of knowledge gaps and limitations of the various modelling applications in Vietnam were outlined in MONRE (2010). These include:
The application of the MAGICC/SCENGEN 5.3 model in the development of climate change scenarios, which produces low-resolution grid maps (300 by 300 km) and makes it difficult to accurately reflect the local specificities of climate change in Vietnam;
There is currently a lack of in-depth analysis to distinguish and assess impacts induced by climate change from other natural phenomena (e.g. El Nino/Southern Oscillation etc);
The current hydro-meteorological observation network is insufficient and inadequately distributed across climate zones and therefore unable to meet the demands for climate monitoring and/or early disaster warning;
The knowledge gaps identified in MONRE (2010), were significant barriers to overcome in achieving the stated objectives of this project (and some were only partially conquered), in particular the limited availability of observed historical data and regionally-specific climate change scenario information for means and extremes at the provincial level.

Climate Change Impact and Adaptation Study in Mekong Delta – Part A
40 | P a g e
3.4 Future Climate Change Scenarios (2030 and 2050)
3.4.1 Temperature The projected increase in monthly average temperature and in seasonal average temperature for both Ca Mau and Kien Giang provinces for the two time periods 2030 and 2050 are presented in Table 12 below. The increase in temperature is expected to be in the range of 0.7°C to 1.4°C for Ca Mau, and between 0.5°C to 0.9°C for Kien Giang.
Table 12 - Average temperature increase (°C), Scenario B2 and A2
Ca Mau Kien Giang B2 A2 B2 A2 2030 2050 2030 2050 2030 2050 2030 2050
January 0.6 1.2 0.7 1.1 0.5 0.8 0.5 0.8 February 0.5 0.8 0.5 0.8 0.3 0.5 0.3 0.5 March 0.6 1 0.6 1 0.3 0.6 0.3 0.6 April 0.6 1 0.6 1 0.4 0.6 0.4 0.6 May 0.8 1.5 0.8 1.4 0.5 0.9 0.5 0.9 June 0.8 1.4 0.8 1.3 0.7 1.2 0.7 1.1 July 0.9 1.6 0.9 1.5 0.6 1.1 0.6 1.1 August 0.9 1.6 0.9 1.5 0.3 0.5 0.3 0.5 September 1 1.8 1 1.7 0.5 0.8 0.5 0.8 October 0.9 1.5 0.9 1.5 0.5 1 0.5 0.9 November 0.8 1.4 0.8 1.3 0.7 1.2 0.7 1.2 December 0.8 1.4 0.8 1.3 0.6 1.1 0.6 1 Winter (Dec-Feb) 0.6 1.1 0.6 1.1 0.4 0.8 0.4 0.8 Spring (Mar-May) 0.7 1.2 0.7 1.1 0.4 0.7 0.4 0.7 Summer (Jun-Aug) 0.8 1.5 0.9 1.5 0.5 0.9 0.5 0.9 Autumn (Sep-Nov) 0.9 1.6 0.9 1.5 0.6 1 0.6 1 Average 0.7 1.4 0.8 1.3 0.5 0.9 0.5 0.8
The projected increase in monthly and seasonal maximum temperature and minimum temperature for both Ca Mau and Kien Giang provinces is presented in Table 13 below.
Table 13 - Increase in Maximum Temperature and Minimum Temperature (°C), Scenario B2
Increase in max temperature Increase in min temperature Ca Mau Kien Giang Ca Mau Kien Giang 2030 2050 2030 2050 2030 2050 2030 2050 January 1 2 2.4 1.6 -0.1 -0.9 0.8 1.7 February 1 1.3 1.7 1 0.7 0.2 1 1.3 March 1.2 1.8 -0.4 0.6 0.2 0.8 0.9 1.4 April 0.9 1.7 2.2 2.6 -0.3 0 0 0.4 May 1.7 2.2 1.5 2.2 0.3 0.9 2.2 1.9 June 1.8 2.5 1.8 1.8 1 0.8 0.6 1.5 July 2.2 2.6 1.4 1.6 1.3 1.6 0.7 1.6 August 0.3 1.1 2.2 3.7 0.8 1.7 0.8 1.3 September 1.1 2.2 1.7 0.9 1.4 1.5 0.7 1.4 October 1.3 2.3 1.6 2.3 1.4 1.3 0.9 1.9 November 1.5 1.7 1.3 0.9 1.5 1.4 1.4 2.1 December 1.5 1.8 1.7 1.3 0.7 0.5 0.9 1.4 Winter (Dec-Feb) 1 1.3 2.4 1.6 0.7 0.2 1 1.5

Climate Change Impact and Adaptation Study in Mekong Delta – Part A
41 | P a g e
Increase in max temperature Increase in min temperature Spring (Mar-May) 0.9 1.7 -0.2 0.8 0.2 0.8 0.3 0.7 Summer (Jun-Aug) 1.4 2 2.2 3 0.8 1.7 0.6 1.5 Autumn (Sep-Nov) 1.5 1.7 1.3 0.9 1.5 1.4 1.4 2.1
A summary of temperature change data is as follows:
According to the low emissions scenario (B1):
By the end of 21st century, the annual temperature would increase by about 1.5 to 2.0°C in Ca Mau and Kien Giang. The increase of Ca Mau is higher than in Kien Giang.
In the medium emissions scenario (B2):
By the end of 21st century, the annual temperature would increase in both Ca Mau and Kien Giang, with the increase of approximately 1.5 to 2.5°C relative to the baseline period. Again, the increase is greater for Ca Mau than for Kien Giang. The maximum temperature increases by less than the minimum temperature. By the end of 21st century, the maximum temperature can be higher than current record about from 2 to 2.5°C compared with an increase of 3.5 to 4.0°C for the minimum temperature. By the end of 21st century, the number of hot days (maximum temperature more than 35°C) would increase by about 15 to 20 days relative to the baseline period in both Ca Mau and Kien Giang.
For the high emissions scenario (A2):
By the end of 21st century, the increase is about 2.5 to 3.5°C in both Kien Giang and Ca Mau; however, it is higher in Ca Mau.
3.4.2 Rainfall The change in monthly average rainfall and in seasonal average rainfall for both Ca Mau and Kien Giang provinces is presented in Table 14 below.
Table 14 - Change in Rainfall (%), Scenario B2 and A2
Ca Mau Kien Giang B2 A2 B2 A2
2030 2050 2030 2050 2030 2050 2030 2050 January -3.7 -6.7 -3.7 -6.3 -5.8 -10.5 -5.9 -10.1 February -2.2 -4 -2.3 -3.8 -2.1 -3.8 -2.1 -3.6 March -4.1 -7.4 -4.1 -7.1 -10.8 -19.5 -10.9 -18.7 April -2.6 -4.7 -2.6 -4.5 -4 -7.2 -4 -6.9 May -0.2 -0.3 -0.1 -0.3 -0.3 -0.6 -0.4 -0.6 June 1.2 2.1 1.2 2 1.5 2.7 1.5 2.6 July 1.6 3 1.7 2.8 1.8 3.3 1.8 3.1 August 0.6 1.1 0.6 1 0.7 1.2 0.7 1.2 September 0.6 1.2 0.7 1.1 0.9 1.6 0.9 1.5 October 6.5 11.9 6.7 11.4 7.4 13.5 7.6 12.9 November 2.2 4 2.3 3.9 1.9 3.4 1.9 3.2 December -5.1 -9.3 -5.2 -8.9 -3.6 -6.5 -3.6 -6.3 Winter (Dec-Feb) -4.3 -7.8 -4.3 -7.4 -3.6 -6.6 -3.7 -6.3 Spring (Mar-May) -1.2 -2.3 -1.3 -2.2 -1.8 -3.2 -1.8 -3.1 Summer (Jun-Aug) 1.1 2 1.1 1.9 1.3 2.3 1.3 2.2 Autumn (Sep-Nov) 3.3 6.1 3.4 5.8 3.6 6.6 3.7 6.2 Average 1.3 2.4 1.3 2.3 1.5 2.8 1.5 2.6

Climate Change Impact and Adaptation Study in Mekong Delta – Part A
42 | P a g e
As seen in Table 14, the biggest increase in rainfall is in the autumn months, while the biggest decrease is in the winter months, leading to a more marked change in the start of the dry season.
A summary of rainfall data is as follows:
According to the low emissions scenario (B1):
By the end of 21st century, rainfall is expected to increase by about 3 to 4% in both Kien Giang and Ca Mau compared to the baseline.
In the medium emissions scenario (B2):
Rainfall tends to increase in rainy months (by up to 25% by the end of the century) and decrease in dry months (can be from 30 to 35%). By the end of the 21st century, rainfall would increase in both Kien Giang and Ca Mau with an increase of 5-10% compared with the baseline period. By the end of the 21st century, the heaviest daily rainfall decreases in both Ca Mau and Kien Giang at a rate of about 20 to 30%. However, rainy days with rainfall anomalies of half or twice the current record will continue to exist.
For the high emissions scenario (A2):
The annual rainfall would increase in the 21st century in both Ca Mau and Kien Giang; however, it is higher in Ca Mau.
3.4.2.1 Change in extreme daily rainfall intensity Ca Mau City
Table 15 expresses the 1-day total extreme rainfall with the current baseline represented by the analysis of the historical daily rainfall record for Ca Mau station from 1 January 1979 to 31 December 2007. The 5, 10 and 100 year return periods also are presented for the 2030 and 2050 future projections. Results are presented as extreme daily rainfall (in mm) and the percentage change from the baseline values. The percentile values arise from using a 12-GCM ensemble. For the 25th percentile, 75% of the models agree the extreme will be larger than the given value. Likewise, for the 75th-percentile, 75% of the models agree the extreme will be smaller than the given value i.e. the extreme value in 2050 under the A2-mid scenario, for a 10 year return period will be between 165 and 177 mm, corresponding to an increase of between 7.6 and 15.7%.
Table 15 - Absolute value (mm) and percentage change in extreme daily rainfall intensity with climate change for Ca Mau, for 2030 and 2050, for two emission scenarios (A2 and B2) specifying 25th, 50th and 75th percentile results.
Return period 5 year 10 year 100 year Percentile 25th 50th 75th 25th 50th 75th 25th 50th 75th Current (mm) 136 136 136 153 153 153 203 203 203 2030 A2-mid (mm) 140 143 147 159 162 166 211 215 223 % change 3.4% 5.3% 8.0% 4.2% 5.9% 8.5% 3.9% 5.9% 9.6% B2-mid (mm) 141 143 147 160 163 167 211 216 223 % change 3.5% 5.3% 8.4% 4.4% 6.3% 9.0% 4.1% 6.2% 10.0% 2050 A2-mid (mm) 144 149 156 165 170 177 218 225 239 % change 6.3% 9.7% 14.8% 7.6% 11.0% 15.7% 7.2% 10.7% 17.7% B2-mid (mm) 144 148 154 164 168 175 216 223 236 % change 5.7% 8.8% 13.4% 6.9% 9.9% 14.2% 6.6% 9.8% 16.0%

Climate Change Impact and Adaptation Study in Mekong Delta – Part A
43 | P a g e
The modelling indicates that by 2050 events with a 5 year return interval will increase in intensity by 9% (B2) to 9.5 % (A2) and that a 1 in a 100 extreme rainfall event will increase in intensity by 10 – 11 % (B2 and A2 respectively). However, it should be noted that these values represent increases of only 13 mm and 22 mm in a 150 mm+ event.
Rach Gia City
Table 16expresses the 1-day total extreme rainfall with the current baseline represented by the analysis of the historical daily rainfall record for Rach Gia station from 1 January 1979 to 31 December 2007. The 5, 10 and 100 year return periods also are presented for the 2030 and 2050 future projections. Results are presented as extreme daily rainfall (in mm) and the percentage change from the baseline values. The percentile values arise from using a 12-GCM ensemble. For the 25th percentile, 75% of the models agree the extreme will be larger than the given value. Likewise, for the 75th-percentile, 75% of the models agree the extreme will be smaller than the given value i.e. the extreme value in 2050 under the A2-mid scenario, for a 10 year return period will be between 210 and 228 mm, corresponding to an increase of between 7.6 and 15.7%.
The modelling indicates that by 2050 events with a 5 year return interval will increase in intensity by 8% (B2) to 9 % (A2) and that a 1 in a 100 extreme rainfall event will increase in intensity by 10 – 11 % (B2 and A2 respectively). However, it should be noted that these values represent increases in the order of only 15 mm and 32 mm during a 150- 300 mm event.
Table 16 - Absolute value (mm) and percentage change in extreme daily rainfall intensity with climate change for Rach Gia, for 2030 and 2050, for two emission scenarios (A2 and B2) specifying 25th, 50th and 75th percentile results.
Return period 5 year 10 year 100 year Percentile 25th 50th 75th 25th 50th 75th 25th 50th 75th Current (mm) 164 164 164 194 194 194 292 292 292 2030 A2-mid (mm) 170 173 179 203 206 212 304 310 323 % change 3.3% 5.0% 9.1% 4.4% 6.0% 9.4% 3.8% 6.1% 10.3% B2-mid (mm) 170 173 180 203 206 213 304 311 324 % change 3.5% 5.2% 9.5% 4.6% 6.2% 9.9% 4.0% 6.4% 10.8% 2050 A2-mid (mm) 174 179 192 210 215 228 313 325 348 % change 6.1% 9.2% 16.7% 8.1% 11.0% 17.3% 6.9% 11.1% 19.0% B2-mid (mm) 173 178 189 208 213 224 311 322 343 % change 5.5% 8.3% 15.2% 7.4% 10.0% 15.7% 6.3% 10.1% 17.2%
3.4.3 Sea Level Rise Sea Level Rise (SLR) scenarios for the coast of Ca Mau to Kien Giang under the low, medium and high scenarios are outlined in Table 17 below. By the end of the 21st century, the sea level from Ca Mau to Kien Giang could rise up to 72 cm (low scenario), 82 cm (medium scenario) and 105 cm (high scenario) compared with 1980-1999.
This study focuses on the periods 2030 and 2050 with corresponding SLR of 15 cm and 30 cm under the high A2 scenario.

Climate Change Impact and Adaptation Study in Mekong Delta – Part A
44 | P a g e
Table 17 - Sea Level Rise
Emission Scenario
Periods In The Future
2030 2050 2070 2090
Low (B1) 15 28 45 63
Medium (B2) 15 30 49 70
High (A1Fi) 16 32 57 88
3.4.4 Wind Speed The change in seasonal mean wind speed for Ca Mau and Kien Giang provinces for the B2 scenario are shown in Table 18 below. Average wind speed increases in winter, spring and autumn months, but decreases in the summer months. Annual average wind speed increases in most areas of Ca Mau and does not have a clear trend in Kien Giang.
Table 18 - Change in Seasonal Mean Wind Speed (m/s), Scenario B2
Ca Mau Kien Giang 2030 2050 2030 2050 Winter (Dec-Feb) 0.6 0.6 0.3 0.2 Spring (Mar-May) 0.6 0.7 0.1 0.1 Summer (Jun-Aug) -0.2 -0.2 -0.2 -0.2 Autumn (Sep-Nov) 0.2 0.1 0.2 0.2 Average 0.4 0.4 -0.1 -0.1
3.4.5 Other Climatic Factors Table 19 below shows the change in seasonal mean wind speed for Ca Mau and Kien Giang.
Table 19 - Change in Seasonal Mean Wind Speed (m/s), Scenario B2
Ca Mau Kien Giang 2030 2050 2030 2050 Winter (Dec-Feb) 0.6 0.6 0.3 0.2 Spring (Mar-May) 0.6 0.7
0.1 0.1
Summer (Jun-Aug) -0.2 -0.2 -0.2 -0.2 Autumn (Sep-Nov) 0.2 0.1 0.2 0.2 Average 0.4 0.4 -0.1 -0.1
The summary of other climatic variables is provided below:
Average surface pressure increases over the country.
Relative humidity decreases in the dry months, increase in rainy months. However, the annual

Climate Change Impact and Adaptation Study in Mekong Delta – Part A
45 | P a g e
relative humidity tends to decrease slightly over both 2 provinces.
Average wind speed increases in winter, spring and autumn months, but decreases in the summer months. Annual average wind speed increases in most areas of Ca Mau and does not have a clear trend in Kien Giang.
3.4.6 Model Discrepancies Some of the results that have emerged from the downscaling are confusing and will require further detailed investigation to clarify:
The A2 temperature results are very close to the B2 results, even out to 2050, which is contrary to IPCC (2007) and Figure 16.
The A2 scenario temperatures are sometimes not as warm as B2, which is also contrary to IPCC (2007) and Figure 16.
The change in temperature out to 2050 is sometimes not as large as the change to 2030 which is inconsistent with the known physics of climate change;
The spatial pattern of warming is difficult to interpret, which requires further investigation.
The projected rainfall change under A2 is sometimes less than the change under B2 (this is for both the seasonal and monthly projections).
There is a lack of significant differences in wind speed between the 2030 and 2050 scenarios and further investigation is required to determine whether this is a real result.
The discrepancies and highlighted issues reflect the nature of the modelling process that incorporated multiple downscaling as shown in Figure 17.
3.5 Climate change impact assessments
3.5.1 Hydrology and water resources As illustrated in Figure 17, the outputs from the regional climate modelling, historical climate data and DEM were used as inputs into hydrologic modelling to determine the potential impacts of anthropogenic climate change on flooding caused by increased streamflow, salinity and saline intrusion, drought, and water resource demand and supply.
The hydrological modelling was performed using the Integrated Quality and Quantity Model (IQQM) to simulate the flow of water through the Mekong Delta river systems, making allowance for control structures such as dams and irrigation abstractions. Flow coming from the upper Mekong was obtained for Kratie from the Mekong River Commission and also used as an input into this studies hydrological modelling.
Hydrodynamic modelling was also performed using the ISIS software. The ISIS hydrodynamic modelling enabled representation of the complex interactions caused by tidal influences, flow reversals between wet and dry seasons, and overbank flow in the flood season. Salinity intrusion modelling was also performed using ISIS. Hydrological and hydrodynamic modelling was conducted by IMHEN under baseline (1980-1999 and for the 2000 flood event), 2030 (2020-2039) and 2050 (2040-2059) time horizons with flood inundation projections produced for both A2 and B2 emission scenarios and salinity intrusion projections projected for B2. Note that sea level rise was taken into account in this modelling but storm surges, typhoon impacts, and wind and ocean wave processes were not.

Climate Change Impact and Adaptation Study in Mekong Delta – Part A
46 | P a g e
3.5.2 Coastal impacts As illustrated in Figure 17, the outputs from the regional climate modelling, historical climate data and DEM were also used as inputs into coastal modelling performed by Dr Nhan at the Institute of Coastal and Offshore Engineering. The coastal modelling also used as its input the hydrological modelling outputs, particularly the streamflow and river flood inundation modelling results.
This coastal modelling utilizes the MIKE 21/3 Coupled Model Flow Model to simulate the combined processes of hydrodynamics, wind induced waves, mud transport, sand transport, erosion/deposition, storm surge, and typhoons in the near shoreline coastal zone of Kien Giang and western Ca Mau provinces under current and projected future conditions. A baseline scenario (2000-2009) was modelled as was a future scenario for 2050 (i.e. 2050-2059) for the B2 SRES scenario.
Only 2050 was modelled and only under the B2 scenario because analysis of the projected changes to the key input variables to coastal modelling revealed minimal differences between 2030 and 2050 or A2 and B2 – so B2 2050 was chosen and modelled in detail.

Climate Change Impact and Adaptation Study in Mekong Delta – Part A
47 | P a g e
4. Ca Mau Province With a total population of more than 1.2 million, Ca Mau’s economy grew robustly in the period 2001-2010 with an annual GDP growth rate of 12 percent as compared with an annual growth rate of eight percent in the previous period of 1996-2000. In 2009, total provincial GDP reached US$1,107 million and GDP per capita increased from US$640 in 2006 to US$923 in 2009. Projected GDP growth for the period 2010-2030 averages eight percent, declining to about 5 percent for 2030-50.
Key drivers underpinning the province’s robust growth were the implementation of various investment related laws and polices resulting in a higher efficiency of capital allocated in the province. As a consequence private investments also grew strongly with significant spill-over effects to other economic sectors.
In 2005, there were only 200 registered companies in the province consisting of Small and Medium Enterprises (SMEs). This has now increased to more than 1,800 mainly in agro-processing sectors (fish, shrimp, lobsters, crabs). Factories have invested in modern technology such as cold storages, packing and sorting equipment and are now able to supply high and consistent quality products allowing them to enter highly demanding overseas markets.
Another driver of Ca Mau’s impressive economic performance has been investments in social (e.g. schools and hospitals) and physical infrastructure (e.g. roads, power and water management). These investments have had direct impact on jobs created but have also laid the foundation of infrastructure required for its sustained economic growth. At US$186.7 million in 2010, these investments have grown robustly at an average rate of 14% per year.
A salient investment project realized in the last year is an industrial cluster comprising gas, power and fertilizer production with an investment value exceeding US$1 billion. It comprises two power plants with an installed capacity of 1,500 MW, a fertilizer production plant of 800,000 tons per year and a wide array of infrastructure components. These investments ensure that Ca Mau can further develop its economic potential and sustain its growth in the medium and long term.
The following sections provide a profile of the makeup of the province. The profile describes the data that contributes to the vulnerability indicators used in the vulnerability analysis. The indicators are discussed by sector, and the chapter focuses first on measures of the social structure then looks at the economic makeup of Ca Mau. A description of the landuse is used to inform a discussion of the agriculture and livelihoods. The industries of the province and the energy system are then outlined followed by a discussion of the urban settlements and transport system.
4.1 Population and People Ca Mau’s total population exceeds 1.2 million people (2010). Its capital city is Ca Mau City and it has eight districts (Figure 18) and 101 communes and towns. The Key demographic statistics of the province are shown in Table 20. The average population density is 226 person/ km2 which is lower than the national density (260 persons/ km2) and that of other provinces in the Mekong delta (425 person/ km2). Population growth is 1.3 percent per year and females account for 49.6 percent of total provincial population.
Ca Mau City has the highest population density with 863 person/ km2 followed by Cai Nuoc district and Tran Van Thoi district with population densities of respectively 331 person/km2 and 260 person/ km2. Ngoc Hien district has the lowest population density with only 107 person/km2. Urban population is 20% versus 80% living in rural areas. Ca Mau’s immigration rate is 0.4% and emigration rate is 0.7% resulting in a net migration rate of -0.3%.

Climate Change Impact and Adaptation Study in Mekong Delta – Part A
48 | P a g e
Figure 18 - Ca Mau Administrative Map.

Climate Change Impact and Adaptation Study in Mekong Delta – Part A
49 | P a g e
Table 20 - Ca Mau - Key demographic indicators (2011).
Item Measure Value
Total population Number 1.206,980 Districts Number 8 Communes/towns Number 101 Population density Number/km2 226 Female population % of total population 49.6% Population growth % per year 1.3% Net migration per year % per year (-) 0.3%
Source: District Survey (2011).
A further breakdown in area (km2), population and population densities for each of the eight districts and the provincial capital, Ca Mau City, is depicted in Table 21 below. U Minh is the largest district in size with a relatively small population of over 100,000. As a result its population density is the lowest in the province. After the provincial capital, Cai Nuoc has the highest population density with 331 persons per km2. Tran Van Thoi has the highest population and a high population density as compared to the provincial average of 226 per km2.
Table 21 - Ca Mau - Areas and population per district (2010).
District Area (Km2) Population Population density (Pers./km2)
Ca Mau City 250 215,990 863
Thoi Binh 640 134,656 210 U Minh 775 100,048 129 Tran V. Thoi 716 186,570 260 Cai Nuoc 417 137,878 331 Phu Tan 464 104,284 225 Dam Doi 826 182,403 221 Nam Can 509 66,541 131 Ngoc Hien 733 78,610 107 Total 5,331 1,206,980 226 (average) Source: District Survey (2011).
These population densities per km2 are depicted in Figure 19 and shown graphically in Table 21. Ca Mau City has the highest population density and Ngoc Hien the lowest population density per km2.
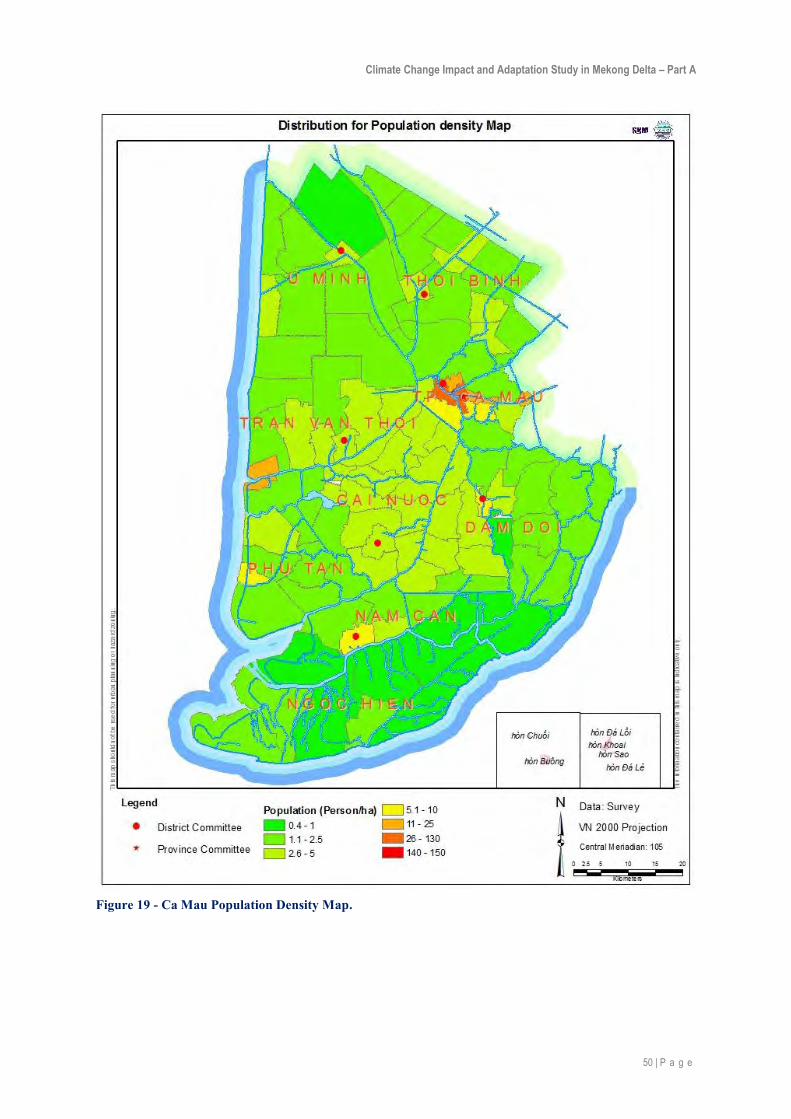
Climate Change Impact and Adaptation Study in Mekong Delta – Part A
50 | P a g e
Figure 19 - Ca Mau Population Density Map.

Climate Change Impact and Adaptation Study in Mekong Delta – Part A
51 | P a g e
Figure 20 - Ca Mau-population density/km/2 (2010). Source: District Survey (2011)
Ca Mau can be classified as a rural province with a 79% of the population living in rural areas and 21% living in urban areas. Ca Mau City has the highest percentage living in urban areas, as expected, amounting to 60 percent.
At the district level, significant variations exist with Thoi Binh, U Minh and Cai Nuoc being predominantly rural as compared to the provincial average of 79%. This is illustrated in Table 22 below. Two districts have a markedly higher urban population than provincial average: Tran Van Thoi and Nam Can. Ngoc Hien is the lowest with no urban population and Dam Doi follows with only five percent living in urban areas.
Table 22 - Ca Mau - Urban and rural population per district 2010 (# and %).
Districts Urban Population
% Urban Rural Population
% Rural
Ca Mau City 130,450 60% 85,540 40% Thoi Binh 10,340 8% 124,316 92% U Minh 6,712 7% 93,336 93% Tran V. Thoi 42,908 23% 143,662 77% Cai Nuoc 14,046 10% 123,832 90% Phu Tan 15,267 15% 89,017 85% Dam Doi 9,148 5% 173,255 95% Nam Can 18,600 28% 47,941 72% Ngoc Hien 0 0% 78,610 100% Total 247,471 21% 959,509 79% Source: District Survey (2011).
4.1.1 Socially Vulnerable Groups Ca Mau has about 20 ethnic minorities. The Kinh represent 97% of total minorities, followed by the Khmer (2%) and others (1%) including Hoa, Cham, Tay, Muong and Thai. The total ethnic minority population stands at 48,840 people (2010) or about four percent of Ca Mau’s population. Of crucial importance to this study is that the Khmer’s poverty rate exceeds 30%. The Khmer population (40,412) predominantly live in rural areas, mainly in Thoi Binh, Tran Van Thoi, Dam Doi and U Minh districts and have agricultural occupations. The other minorities live dispersed in the districts
863
210
129
260
331
225
221
131
107
226
0 200 400 600 800 1000
Ca Mau
Thoi Binh
U Minh
Tran V. Thoi
Cai Nuoc
Phu Tan
Dam Doi
Nam Can
Ngoc Hien
Average

Climate Change Impact and Adaptation Study in Mekong Delta – Part A
52 | P a g e
and do not have salient poverty characteristics. Table 23 below depicts the ethnic minorities’ population in total and as a percentage of the population for each district.
Table 23 - Ca Mau – Ethnic Population 2010.
District Ethnic Minority Population
% Total Population
Ca Mau 8,485 4% Thoi Binh 10,239 8% U Minh 5,331 5% Tran V. Thoi 10,239 5% Cai Nuoc 2,412 2% Phu Tan 3,371 3% Dam Doi 6,602 4% Nam Can 2,039 3% Ngoc Hien 2,925 4% Total/average 48,840 4%
Source: District Survey (2011).
Table 23 is summarized in Figure 21 below. Thoi Binh has the highest percentage of minorities (eight percent) in the province and Cai Nuoc the lowest (two percent).Provincial average of ethnic minorities stands at four percent of the total population.
Figure 21 - Ca Mau - Ethnic Minorities 2010 (Percentage of Population). Source: District Survey (2011)
4.1.2 Poverty Incidence Ca Mau’s official poverty rate stands at eight percent of the total population (2010). The new poverty thresholds issued by the Government of Vietnam (GOV) in 2010 define poverty as:
Rural Areas: VND400,000 per capita/month
Urban Areas: VND500,000 per capita/month
4%
8%
5%
5%
2%
3%
4%
3%
4%
4%
0% 1% 2% 3% 4% 5% 6% 7% 8%
Ca Mau
Thoi Binh
U Minh
Tran V. Thoi
Cai Nuoc
Phu Tan
Dam Doi
Nam Can
Ngoc Hien
Average

Climate Change Impact and Adaptation Study in Mekong Delta – Part A
53 | P a g e
Using these thresholds the percentage of the population classified as poor is depicted in Figure 22 below. There are a number of districts with significantly higher incidence of poverty than the provincial average. These are U Minh, Dam Doi and Ngoc Hien. In contrast, Ca Mau City and Thoi Binh score significantly lower.
Figure 22 - Ca Mau - Poverty rates per district 2010 (%).Source: District Survey (2011)
4.1.3 Unemployment Official unemployment in the province currently stands at five percent of the active population (2010) but significant variations exist between the districts depicted in Figure 23 below. Dam Doi has a high unemployment of 19 percent and also Thoi Binh stands out with a rate of nine percent. The reasons for such high unemployment rates were not identified in the District Survey. Only the lack of employment opportunities in the agricultural and commercial sectors was quoted.
Figure 23 - Ca Mau – District Unemployment % (2010). Source: District Survey (2011).
4.1.4 Health Table 24 below presents the key health Indicators for the province.
2%
12%
18%
11%
19%
9%
8%
12%
21%
13%
0% 5% 10% 15% 20% 25%
Ca Mau
Cai Nuoc
Dam Doi
Nam Can
Ngoc Hien
Phu Tan
Thoi Binh
Tran Van Thoi
U Minh
average
3%
3%
19%
3%
4%
3%
9%
3%
2%
5%
0% 2% 4% 6% 8% 10% 12% 14% 16% 18% 20%
Ca Mau
Cai Nuoc
Dam Doi
Nam Can
Ngoc Hien
Phu Tan
Thoi Binh
Tran Van Thoi
U Minh
average

Climate Change Impact and Adaptation Study in Mekong Delta – Part A
54 | P a g e
Table 24 - Ca Mau – Provincial Health Indicators (2010).
Indicator Total Number Number of Inhabitants per Indicator
Health establishments 44 27,431 Patient beds 2,795 431 Medical doctors 851 480
Source: District Survey (2011).
These health indicators broken down to the district level are presented in Table 25. Thoi Binh and Tran Van Thoi have a lower than average number of heath establishments.
Table 25 - Ca Mau- district key health indicators (2010).
District No. health establishments Number of Inhabitants per Indicator
Ca Mau City 12 17,999 Thoi Binh 4 33,664 U Minh 4 25,012 Tran V. Thoi 4 46,643 Cai Nuoc 4 34,470 Phu Tan 4 26,071 Dam Doi 4 45,601 Nam Can 4 16,635 Ngoc Hien 4 19,653 Total 44 27,431 Source: District Survey (2011).
The number of inhabitants per medical doctor in Ca Mau City and Nam Can are significantly higher. Figure 24 presents the number of inhabitants per medical doctor for each district. In Phu Tan and Ngoc Hien districts, each medical doctor has to attend a significantly higher number of inhabitants than the provincial average. Note for this indicator is reverse to many others as the lower the value, the higher the number of medical doctors relative to the population.
Figure 24 - Doctors per number of inhabitants. Source: District Survey (2011).
1,878 3,847
4,002
3,392
1,838
5,489
2,400
1,751
13,102
2,718
0 2,000 4,000 6,000 8,000 10,000 12,000 14,000
Ca Mau
Thoi Binh
U Minh
Tran V. Thoi
Cai Nuoc
Phu Tan
Dam Doi
Nam Can
Ngoc Hien
Average

Climate Change Impact and Adaptation Study in Mekong Delta – Part A
55 | P a g e
4.1.5 Education Adult literacy rates are presented in Figure 25. The provincial average of adult literacy rate is close to 100%, although Tran Van Thoi (90%) and Nam Can (96%) have lower rates. Underpinning explanations for this discrepancy could not be provided. As is widely recognized, education determines to a great extent an individual’s earning potential. Educational levels, and by extension GDP/per capita, determines a population’s earning potential and is therefore an important measure of a population’s adaptive capacity (or ability to cope with climate change impacts).
Figure 25 - Ca Mau – Adult Literacy Rate 2010 (%).Source: District Survey (2011).
The number of inhabitants per teacher at the district level can be used to determine if there are sufficient educational opportunities for the population without the need to migrate to a provincial capital. The number of teachers per population by district is shown in Figure 26. Provincial average of number of teachers per population stands at 127 (one teacher per 127 inhabitants). Both Cai Nuoc and Ca Mau City score higher than provincial average. Ngoc Hien shows a significant variation with only six teachers/’000 population (or one teacher per 170 in habitants). Like the health indicator, this indicator is reverse to many others as the lower the value, the higher the number of teachers relative to the population.
Figure 26 - Ca Mau - Teacher per number inhabitants (2010). Source: District Survey (2011).
100%
99%
99%
96%
99%
99%
100%
90%
100%
98%
84% 86% 88% 90% 92% 94% 96% 98% 100%
Ca Mau City
Cai Nuoc
Dam Doi
Nam Can
Ngoc Hien
Phu Tan
Thoi Binh
Tran Van Thoi
U Minh
average
127
144
156
124
96
170
116
142
87
107
0 20 40 60 80 100 120 140 160 180
Average
U Minh
Tran Van Thoi
Thoi Binh
Phu Tan
Ngoc Hien
Nam Can
Dam Doi
Cai Nuoc
Ca Mau

Climate Change Impact and Adaptation Study in Mekong Delta – Part A
56 | P a g e
4.2 Provincial Development Context Commencing in 2000, the Government has implemented a wide array of interventions targeting the opening of the provincial economy and reinforcing its productive structure. In particular, a significant area of rice paddies has been transformed into high yielding shrimp cultivation. This has further improved Ca Mau’s competitive advantages in shrimp cultivation with significant spin-offs and creation of jobs in the value chain (transport, processing of shrimps, agro-processing).
Down-stream these changes in productive structure have impacted the livelihood of individual farmers and improved their income and career options. Approximately 280,000 ha are currently used for aquaculture. This makes it the national power house in aquaculture. Aquaculture is of significant importance to the province’s economic structure and is strongly supported by an ever increasing demand for processed shrimps from both national and international buyers.
Total harvested aquaculture production in 2010 reached 377,500 tons and has grown strongly in the last 10 years. Abundant production factors, such as land, water, climate and capital, resulted in 120,000 tonnes of processed output in 2010. It is of note that total shrimp export from Ca Mau province amounted to more than US$4.3 million in 2010.
GDP per capita on average stands at about US$900 per year but significant variations exist. For instance, Ca Mau City has a much higher GDP/per capita of about US$2,400, whilst U Minh amounts to about US$500/per capita. GDP per capita/2010 for all districts is presented in Figure 27 below.
Figure 27 - Ca Mau - GDP/capita/year 2010 (US$). Source: District Survey (2011).
Living in predominantly rural areas, the population in the province often combines activities in various sectors. For instance, shrimp production is combined with a retail shop or restaurant, or a family is active both in rice farming and running a construction company. These various economic activities are often intertwined and cannot be easily be dissected. The greatest contribution to household income is from agriculture and fisheries, followed by industry, construction and services.
Agricultural production remains stable generally producing two crops per year, mostly rice. In addition, large areas have been transformed from paddy into higher yielding crops such as vegetables and fruit. Also the forest covered area, which currently stands at 19 percent, is a major concern in the province. Deforestation is occurring rapidly (exact data are not known) driven by population pressures. The two major national parks of Ca Mau Cape and U Minh Ha preserve rare and protected flora and fauna and offer an untapped potential for tourism.
Salient changes in the importance of economic sectors have occurred in the last five years (2005 to 2010). For instance, the industrial sector has grown rapidly driven by the strong increase in processed
$2,396
$737
$869
$1,085
$646
$742
$483
$622
$503
$898
$0 $500 $1,000 $1,500 $2,000 $2,500 $3,000
Ca Mau City
Cai Nuoc
Dam Doi
Nam Can
Ngoc Hien
Phu Tan
Thoi Binh
Tran Van Thoi
U Minh
Average

Climate Change Impact and Adaptation Study in Mekong Delta – Part A
57 | P a g e
shrimp. The importance of the three main economic sectors, agriculture, industry and services, also changed.
As depicted in Figure 28, there has been a decline in the GDP contribution of the agricultural sector from 46% in 2005 to 42 % in 2010. An opposite trend can be observed with service activities, with the importance of this sector’s contribution to GDP augmented as compared to 2005.
Figure 28 - Ca Mau - GDP contribution by economic sector 2005-10 (%).Source: District Survey (2011).
Employment in each economic sector in 2010 is presented in Table 26 below. About 75% of the population works in agriculture and fishery and only 10% of the population works in industrial activities. Population working in services (trade, transport and tourism) currently stands at 15 percent but is expected to grow in the coming years due to an expected increase in tourism. Detailed information at district level could not be obtained in our field survey (2011).
Table 26 - Ca Mau - Employment per economic sector 2010 (total & %).
Economic sectors Employees Percentage Agriculture, Forestry and Fishery 515,500 75% Industry and Construction 66,500 10% Services 96,500 15% Total employees 687,500 100% Source: District Survey (2011).
4.3 Landuse The landuse of the province is shown in Figure 29, and the proportion of the total occupied by each the major landuse types are shown in Figure 30. Landuse is dominated by aquaculture, with major contributions from rice and forestry. The major land use types and economic sectors are discussed below.
46% 42%
31% 24%
23% 34%
0%
10%
20%
30%
40%
50%
60%
70%
80%
90%
100%
2005 2010
agriculture industry and construction services (incl tourism)

Climate Change Impact and Adaptation Study in Mekong Delta – Part A
58 | P a g e
Figure 29 - Land use map of Ca Mau province.

Climate Change Impact and Adaptation Study in Mekong Delta – Part A
59 | P a g e
Figure 30 - Land Use of Ca Mau Province as a proportion of the total area. Source: District Survey (2011).
4.4 Agriculture Ca Mau has an area of 533,318 ha, with about 300,000 ha used for low yield or mixed rice-shrimp following strong growth in the last 10 years. The predominant crop is still rice, mainly double cropping in salt free zones. Total land area under rice is 130,000 ha, divided into 70,000 ha with double cropping and 60,000 ha with single cropping only. Over the last decade the area under cereal cultivation in Ca Mau has decreased by 43 percent.
The province can be divided into 3 eco-zones:
The southern 5 districts of Cai Nuoc, Dam Doi, Nam Can, Ngoc Hien and Phu Tan, experiencing minimal flooding but high salinity for long periods. This area is almost entirely under aquaculture.
The two northern coastal districts of Tran Van Thoi and U Minh with a mixture of forests, rice and, increasingly, aquaculture. This area contains the U Minh Ha national Park and most of the production forests of the province. A series of sluice gates along rivers and canals along the coastline is used to minimise saline intrusion to enable rice cultivation.
The two north eastern districts of Ca Mau and Thoi Binh which experience moderate flooding and saline intrusion. This area contains much the fruit production of the province and still has mostly rice crops around and north of Ca Mau city. Aquaculture is also becoming increasingly important in this eco-zone.
The entire province is subject to salinity for at least some of the dry season. Flooding is only moderate and concentrated in the centre of the province around Ca Mau, northern Cai Nuoc and south eastern Tran Van Thoi.
4.4.1 Cropping and Livestock Ca Mau has not experienced the same expansion in rice planting that has been seen in Kien Giang. The area under rice, and hence rice production, has decreased slightly in Ca Mau. According to national statistics despite decrease in area under cereals, the value of the output of agricultural products in has remained steady since 2005 and is currently $US509 million. The usual revenue to a rice farmers is 25 – 30 million VND per ha, yielding 5.5 t/ha.
Sugarcane area is established as just 1500 ha, mainly in Thoi Binh District, where a milling and sugar cane factory is located.
Rice
Perenial Crops
Aquaculture
Production Forest
Protection Forest
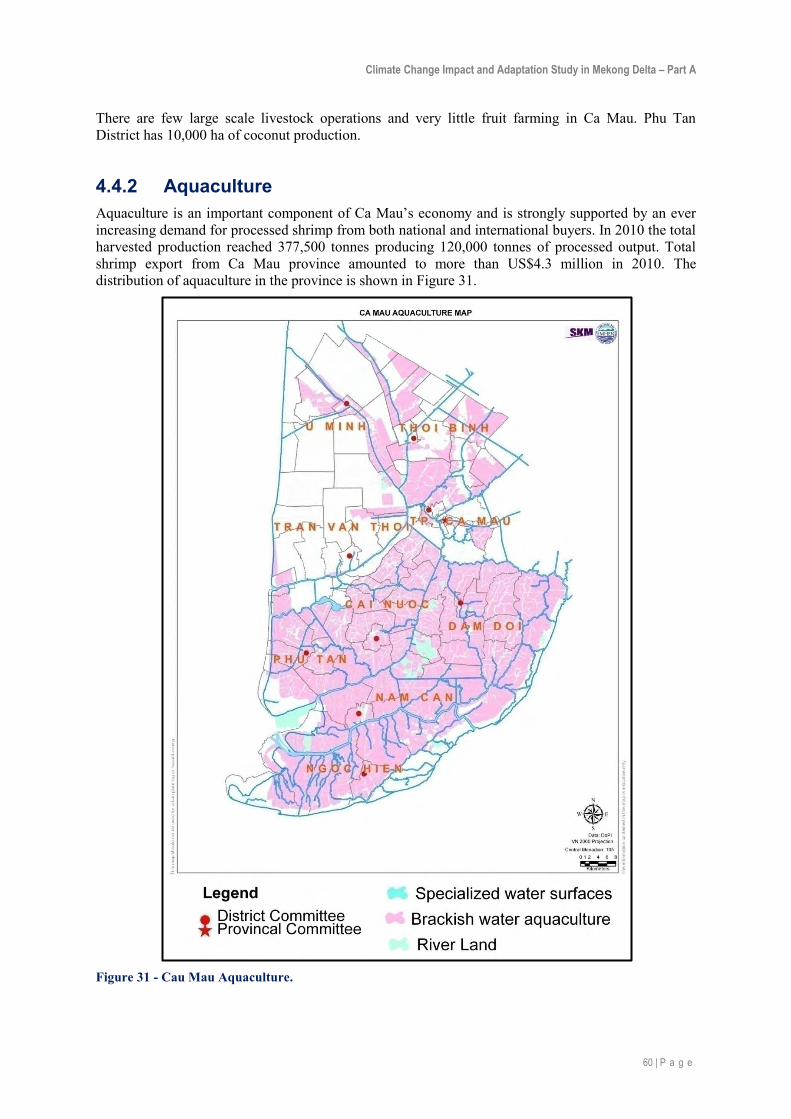
Climate Change Impact and Adaptation Study in Mekong Delta – Part A
60 | P a g e
There are few large scale livestock operations and very little fruit farming in Ca Mau. Phu Tan District has 10,000 ha of coconut production.
4.4.2 Aquaculture Aquaculture is an important component of Ca Mau’s economy and is strongly supported by an ever increasing demand for processed shrimp from both national and international buyers. In 2010 the total harvested production reached 377,500 tonnes producing 120,000 tonnes of processed output. Total shrimp export from Ca Mau province amounted to more than US$4.3 million in 2010. The distribution of aquaculture in the province is shown in Figure 31.
Figure 31 - Cau Mau Aquaculture.

Climate Change Impact and Adaptation Study in Mekong Delta – Part A
61 | P a g e
Aquaculture has grown considerably in Ca Mau in recent years from 160,000 ha in 1995 to 339,100 ha in 2009. In the past the southern eco zone contained a mixed aquaculture system with crab, mollusc and fish. The entire aquaculture sector is now dominated by shrimp farming with an area of 296,300 ha, of which 266,000 ha is extensive low-yielding shrimp or rice/shrimp farming, and 28,000 ha is commercial fish ponds. The industrial farming area increased by 6.93 percent to 1,080 ha, and the output increased by 28.1 percent to 12,150 million tonnes. The province’s shrimp farming area represents over 40 percent of the shrimp farming of all of the coastal provinces in the Mekong Delta. In comparison with 2009, the area under P.monodon increased by 5.56 percent and that under L.vannamei increased by 11.31 percent (VASEP 2011).
Figure 32 - The rice shrimp farming system in Ca Mau. Courtesy; M Russell.
The rice shrimp system is considered to be very important for eco-balance, as the co-benefits between the two systems are very high. This system dominates in Ca Mau, U Minh, Tran Van Hoi, and Thoi Binh. Intensive shrimp dominates in Phu Tan, Can Nuoc and Dam Doi Districts with about 25 percent of all aquaculture derived from the fish and crab sub-sectors.
Commercial intensive shrimp yield 5.5 t/ha and farms can gain incomes of 25-30 million VND per ha. Typical yields for shrimp in more extensive systems is 400 kg/ha with farmers earning 25-30 million VND /ha. In 2010 in Ca Mau it was estimated that about 80 percent of householders made an average of 50-60 million VND/hectare/householder which is considered to equate to at least break even or an after cost profit. About 820 hatcheries dedicated to shrimp reproduction are found in Ca Mau, Cai Nuoc and Dam Doi districts (VASEP 2011).
There are some environmental concerns relating to the current rice-shrimp farming systems. First, the current shrimp farming method is based on frequent water exchange (daily to weekly), which would result in high accumulation of sediment in the rice farms in the long-term. Many farmers reportedly dispose of accumulated sediment back into the canals or nearby river, which would induce negative environmental impacts. Furthermore, recent introduction of exotic species and introduction of more intensive shrimp aquaculture may also lead to more pollution in the effluent of the waste water from the shrimp farming.
4.4.3 Fisheries The wild fishing industry with 12,000 boats produces about 350,000 tonnes per year. Fishing is carried out in offshore areas from larger boats, in coastal areas in small boats, and in local waterways

Climate Change Impact and Adaptation Study in Mekong Delta – Part A
62 | P a g e
or wetlands using boats or from the land. A MRC survey found that 250,487 individuals in Ca Mau, of which 28 percent were females, cited their main job as marine fishing (MRC 2010).
Song Doc is the main fishing port in the Province, with more fish reported (72,000 + tons in 2009) than all the other Ca Mau districts together. However, it has been suggested that only a small proportion of the catch is actually landed there at present. Apparently, a large number of fishing boats often serve offshore mother ships which then take the majority of the catch to Ho Chi Minh City or Can Tho which has been designated as the major centre for fish processing in the Delta.
The official figures for fisheries catch for Ca Mau is shown in Figure 33. The figure indicates that while the total catch has increased, the increased catch is achieved through more boats each catching less fish. The subsequent poor return rates for individual boats means that any changes in fish numbers due to changed fish ecology as a result of climate change will have a larger impact on individual fishers.
20
30
40
50
60
70
-
50,000
100,000
150,000
200,000
Cat
ch p
er
bo
at (
t)
Cat
ch (
t)
Year
Other fisheries
Shrimp
Fish
catch per boat
Figure 33 - Fish Catch and Fishing Effort 2001 - 2009 Ca Mau. Source: Quynh 2010.
4.4.4 Water resources All of the canals in Ca Mau are potentially salt affected in the dry season. A series of sluice gates and canals is presently able to keep most of Tran Van Thoi and the southern part of U Minh under rice cropping. The shorter period of salt influence inland also allows for rice cultivation in parts of Thoi Binh and Ca Mau districts. The rest of the province is given over to aquaculture, and salinity is actively cultivated. Even much of the portion of the Quan Lo Phung Hiep irrigation system in Ca Mau, which was designed to keep salinity out, is now used for saline aquaculture.
4.4.5 Natural areas, biodiversity and forests More than 50 tons of wild honey is harvested yearly in U Minh. This mono-floral honey is very transparent and can be stored for years.
River and canal fishing is important in Ca Mau especially in terms of diversifying income generation streams. It is particularly associated with less productive locations such as in and around national parks and protected areas and low lying areas used for Melaleuca.

Climate Change Impact and Adaptation Study in Mekong Delta – Part A
63 | P a g e
Of the six provinces of the Mekong Delta, Ca Mau ranked second in 2006 in terms of the extent of production Melaleuca forest with 29,760 ha. In northern Thoi Binh, in Bien Bach, substantial enterprise is still actively using Melaleuca to produce 3,800 tonnes of timber.
In Ca Mau, mangroves are considered as protected areas within a 1 km wide coastal belt, where habitation is prohibited. In the Southern and SE coasts, mangrove belts are wide and well-managed, with few coastal erosion zones. On the West coast problems are much larger, with a requirement to establish, via natural regeneration, about 2,200 ha of new mangroves back into areas where mangrove was previously present.
Expected mangrove dieback due to excessive salinity (above 28 g/l) and to excessive inundation is not yet occurring.
A repeat of Typhoon Linda of 1997 would cause significant destruction to large trees in the southern zones, now recovered after that event.
Rhizophora timber is still extracted (legally and sustainably according to provincial authorities) in the southern and coastal zones of the province. However a report in the Vietnam News in September, 02 2011 reported that illegal logging of mangrove trees for producing charcoal in Ca Mau Cape National Park has worsened this year and forest protection authorities could not control the situation. The forest protection forces have found and destroyed more than 300 kilns so far this year. Each kiln has a capacity of 40-60 kilo a day, meaning hundreds of trees are cut down every day for producing charcoal (Vietnam News 2nd September 2011).
The output of fuelwood exploitation from natural forests in Ca Mau in 2001 was 250,000 cu meters, worth 13,500 million VND (Do and Bennett 2008). The gross revenue from wetland fuelwood is estimated at 7,503 million VND.
4.5 Industry Ca Mau province’s industries are mainly primary production processing (shrimp and fish meal) focused, with the exception of the fertilizer part of the gas-power-fertilizer complex in U Minh district. There is also a range of smaller and less capital intensive general services provision industries of which the largest single (informal) sector is ice making. Although rice growing is the largest land use in Kien Giang province and the second largest land use in Ca Mau province, rice husking is no longer a major industry in Ca Mau province as it appears that more than 90% of rice husking now takes place in neighbouring provinces. In Ca Mau province rice production is down to nearly half its previous levels.
There are five formal industrial zones established or being planned to be established by 2020 in Ca Mau province, but other than the U Minh district major gas-power fertilizer focused industrial zone the other four zones contain only eight factories to date, of which two factories are producing fish meal. In spite of strong official encouragement of the industrial zones, there seems little compelling reason for factories to move to the zones, industries are probably not so keen to be managed by DOIT, and the growth of industrial zone occupancy seems likely to continue to be slow.
4.5.1 Seafood Processing Aquaculture (in particular shrimp) processing has been an important industry in Ca Mau province since the start of Vietnam’s economic reforms in 1979. Along with “other” seafood processing and the transformation of low value “waste” fish into fish meal, aquaculture comprises the main Ca Mau province formal employment industry, employing around 25,000 people. There are ambitious plans to expand shrimp production and hence shrimp processing in the future, however the industry does not seem to have expanded much if at all in the 2007-2010 period. Expanding shrimp production depends on a combination of a reduction in rice production (which is still officially discouraged on food

Climate Change Impact and Adaptation Study in Mekong Delta – Part A
64 | P a g e
security grounds) as well as on an intensification of shrimp production per hectare. Shrimp production intensification has some considerable doubts attached to its long term sustainability - based on the last 40 years’ worldwide experience of shrimp intensification where it has generally been found to not be sustainable. Processed “other seafood” and fish meal production based on offshore caught wild fish is the second most important fisheries industry in Ca Mau province. However, it would seem that “other” seafood processing and fish meal production is approaching (or may have already exceeded) its ongoing sustainable yield basis.
Figure 34 - Seafood Processing. Courtesy: Frank Pool.
Ca Mau is the largest aquaculture processing province in Vietnam, accounting for around 70% of Vietnam’s aquaculture exports. Aquaculture inputs (esp. shrimp) are also imported from other provinces for processing in Ca Mau province. Capital requirements ($6 - $35M per plant) for shrimp and fish meal processing plants seem high but are actually low compared to the revenue streams of the seafood processing plants. Capital per plant is generally equivalent to around 1 -2 months (to a maximum of 2 years) revenue. For the estimated 15 plants in Ca Mau province = $100 -$300M total capital investment.
Figure 35 - Seafood Processing Plant. Courtesy: Frank Pool.
4.5.2 Ship Building There is one formal ship building plant at Nam Can that operated from 2006-08 when it built around five 400-500 ton displacement ferries (inland canal barges), but the plant was not building any ships when visited in March 2011. The Nam Can ship building plant can in principle build ships of up to 30,000 tons displacement. The plant still employs around 25 technical and administrative staff and would employ another 100 - 150 staff when building ships but would have to import skilled workers

Climate Change Impact and Adaptation Study in Mekong Delta – Part A
65 | P a g e
as there are none in the surrounding area. The plant has some fixed assets. The design elevation of the plant is 1.7 – 1.8 m ASL, but the site is apparently sinking as it is built on a peat ground site. Vietnam appears to have an excessive number of individual ship building plants, and the isolated plant at Nam Can is not part of any ship building cluster. The ownership of the Nam Can ship building plant has recently been transferred to Vinalines whose core business is operating and not building ships, so it’s long term future viability must realistically be seen as uncertain.
Figure 36 - Vinalines (formerly Vinashin) Nam Can Shipbuilding Plant – Currently Not Building Ships. Courtesy: Frank Pool.
There are apparently 2-3 private sector ship building and ship repair plants in Ca Mau city. These plants apparently build and repair wooden canal barges and fishing boats as well as ferries (barges) of up to 500 tons. These other shipbuilding plants were not able to be visited, but it is understood that they operate with minimal fixed assets.
4.5.3 Other Industrial Sectors Ca Mau province’s 2nd largest single industry (although it is not a formal industry for statistical purposes) appears to be ice making with around 159 plants in the province producing more than 300,000 tons of ice per year, although exact ice production figures vary considerably from year to year and may not be fully reliable. It is estimated from site visits undertaken during the project that there is around $400,000 capital deployed per plant, and plant economic life is around 20 years, 75% of investment is in chillers and water treatment plant, and the rest of the capital value is in low value simple cooling towers, ice making ponds, and lightweight buildings. For the 159 plants = $65M total capital investment.
Printing is a large industry in terms of formal industry structure terms but little is known about its structure. It is likely that it is a dispersed and mostly small scale industry based in urban centres.

Climate Change Impact and Adaptation Study in Mekong Delta – Part A
66 | P a g e
Figure 37 - Ca Mau Ice Making Plant. Courtesy: Frank Pool.
There is a minimal construction material manufacturing industry in Ca Mau province as there is no local source of construction materials available for exploitation.
One 900 tpd (tons per day of sugar cane) small-medium size sugar cane processing plant was apparently established in 1997. No specific data was able to be found on the plant and the site was not visited during the project. The plant is expected to have an around 2 MW steam turbine operating at a low around 3500C turbine inlet temperature to meet internal plant loads, and to not export any power to the grid. If the plant was operating profitably and at full capacity it would probably have the potential to double its power generation with a new high temperature boiler and steam turbine with same waste bagasse use and export say 2MW for 6 months a year at a competitive power export tariff. However, the plant is now apparently only operating at 40% of its former capacity so it does not seem that the plant would be viable into the future without ongoing subsidies or other ongoing policy support measures.
A wide range of other mainly service industries operate in Ca Mau province, such as furniture making, construction, chop stick manufacturing, noodle making, bread making, but most are small and have low fixed assets (primarily in buildings), with most of their capital assets being in their machinery which is either old, portable or movable.
4.5.4 Tourism Ca Mau has a number of important tourist attractions, including: Dat Mui national park (Ca Mau cape); U Minh Forest; Lam Truong 184 Diversity zone; Tu Na- Nam Can bird sanctuary; Ngoc Hien bird sanctuary; Ca Mau culture park bird sanctuary; Khoai Island; Da Bac Island; and Khai Long beach.
Tourism in the province is still largely underdeveloped. One of the most important reasons is weak infrastructure and the lack of a clearly defined tourist development strategy. In 2000, Ca Mau received 4,000 foreign - and 96,000 domestic visitors. In 2010, number of visitors increased up to 6,460 and 218,540, respectively. Average annual growth in tourist numbers in the period of 2000- 2010 equalled 16 percent.
There are plans to boost tourism with a new extension of Vietnam’s highway 1 to the southern tip of Vietnam. The road is already under construction, with implications to add new energy demands and for service industries alongside the new road and in any new settlements. However, the new road will go through a national park and mangrove swamps, so any new electricity loads are expected to be modest at a provincial level.

Climate Change Impact and Adaptation Study in Mekong Delta – Part A
67 | P a g e
4.6 Energy
4.6.1 Ca Mau Gas-Power-Fertilizer Complex The largest single existing energy sector project in Ca Mau province is the PetroVietNam (PVN) Ca Mau gas-power-fertilizer complex. This project comprises a 325 km long gas pipeline from the Malaysian-Vietnamese shared offshore PM3-CAA field (the pipeline was completed in 2007 at a cost of $300M, with a 30 year design life) and at Khanh An commune, U Minh District and 9 km Northwest from Ca Mau City there is the gas-power-fertilizer complex itself. The gas-power-fertilizer complex consists of: a gas distribution centre; two 750MW capacity conventional combined cycle gas turbine (CCGT) power plants (one completed in 2007 and one in 2008 for a total capital cost of $860M with a 20 - 25 year design life; and a urea fertilizer plant (to be completed in 2012 at a cost of $600M – $900M. The Ca Mau gas-power-fertilizer complex is located at the confluence of the Ong Doc, Cai Tau and Trem rivers, is affected by the tides of the South-western sea with a maximum tidal amplitude of 60 cm, and the area around the site is usually flooded in the rainy season for 2 - 3 months with general flooding depth of 30 - 50 cm (CM2 DEIA). Total capital investment is $1,760 – $2,060 million
The existing PP3 pipeline is of 18” diameter and runs from the Malaysian/Vietnamese offshore platform that was built by the Vietnam-Russian Oil and Gas Joint Venture (Vietsovpetro). The condensate and natural gas liquids (NGL) are removed at the offshore platform and exported by ship. The gas has its pressure regulated and some gas heating provided to avoid any gas condensation problems after pressure reduction at the gas distribution centre that is part of the Ca Mau gas-power fertiliser complex. There is no LPG (nearly 10%) or CO2 (8%) separation from the gas supplied to the two existing Ca Mau 750MW CCGT plants. There is no gas pressure drop power recovery in the pipeline or gas treatment plant. The total gas pipeline investment was apparently initially budgeted at $230 million, then estimated at $308 million in 2005 and apparently completed for US$214 million in April 2007.
The Ca Mau 1 and 2 power plants comprise two separate 750MW CCGT plants designed to run on natural gas and diesel oil. The Ca Mau 1 power plant was approved in October 2001. The feasibility study (FS) was completed in 2005, construction started in 2006 for Ca Mau 1 and in 2007 for Ca Mau 2. The two plants were completed in 2007 and 2008 with 720MW net export power output per plant over a 25 year design life with a total investment capital for the two power stations of US$860 million. The two F-Generation V94.3A gas turbines and the steam turbine in each unit are from Siemens, the Heat Recovery Steam Generator (HRSG) is by Dusan, and the substations and transformers are from Westinghouse. The two gas turbines and the one steam turbine per station each contribute 250MW to the station’s output.
There is 33,000 tons of diesel fuel stored on site to enable the plants to run for 23 days in the case of a loss of gas supply. The two power plants are designed to run at 90-99% capacity factor to generate 9 billion kWh annually for the national grid as base load plant plants, feeding the Vietnam national grid through 220 kV and 500 kV high voltage transmission lines. Plant rated outputs are at 32-33C maximum air temperature. The annual average site air temperature from 1980 - 2004 recorded at the Ca Mau Meteorological Station is 27.2oC, with the highest temperature recorded temperature being 37.8oC and the lowest recorded temperature being 16.20C (CM2 DEIA). At up to 5C higher than rated air temperatures, the DEIA states that more water would be pumped through the forced draft cooling water towers and there would be no need to reduce plant power output. Cooling water for both (Ca Mau 1 and Ca Mau 2) power plants is supplied from the nearby Cai Tau River through a 200 m long cooling water canal. The power plants’ cooling water is 90% seawater in the dry season (32, ppt salt) and 98% fresh water in the wet season (5 ppt salt compared to sea water at 35 ppt). Cai Tau river water flows are affected by the operation of the sluice gates at Tac Thu.
The power plant sites are apparently 1.57 m to 2.84 m above water level (AWL) which seems realistic (see photo below) but this could not be checked against the FS (Feasibility Study) figure as there was

Climate Change Impact and Adaptation Study in Mekong Delta – Part A
68 | P a g e
apparently no copy of the FS on site. The DEIA of June 2006 for power plant 2 (CM2 DEIA) states that the construction site was to be prepared and levelled to +1.97 m (at the boundary) and +2.84 m (at Centre) by geo-textiling/vacuum pumping and geo-textiling /consolidating, but it is not known if this was exactly followed. It is not known if sea level rise (SLR) or other climate change effects were considered in the plant design, but as there is not mention of designing for climate change effects in the June 2006 DEIA for the Ca Mau power plant 2 it therefore seems likely that climate change effects were not actually explicitly considered.
Figure 38 - Ca Mau Power Station. Courtesy: Frank Pool.
There is a major Ca Mau fertilizer (urea) project currently already under construction for 2012 completion at Khanh An commune, U Minh District by PetroVietNam. The project is being built next to the Ca Mau power plants 1 and 2 as part of the Ca Mau gas-power-fertilizer complex, has a 30 year design life, will produce 800,000 tons/year of urea (which is an output equivalent to 40% of Vietnam’s urea use), and will double Petro Vietnam’s annual urea production capacity. The plant uses technology that is very similar to the existing Vang Tau fertilizer plant North-East of HCMC in Vietnam, and uses a Danish technology ammonia plant, an Italian technology urea plant, Japanese technology urea granulation plant, utilities from various countries, and is being built by a Chinese EPC construction company. The plant will utilize a 17MW electrical supply from the adjacent Ca Mau power plant 2, as well as being connected to the grid, and it will also have a 2MW back up diesel generator. The granulated urea output will be sold in the Mekong Delta, Thailand, the Philippines and Cambodia. The granulated urea will be exported by ship from the gas-power-fertilizer complex’s adjacent 4 m draft wharf. The fertilizer plant feasibility study was apparently finalized in 2006. As the site has never had inundation issues, and did not suffer any impact from the major typhoon Linda in 1997, it was concluded that the site did not need to consider any special flooding impact or any site protection considerations. The plant’s management unit clearly considered that climate change is an environmental issue, alongside waste management and cooling tower make up water supply. The site is 2.38 m AWL according to the site plans on the wall at the EPC contractor’s site office.
The PM3 gas field supplying the Ca Mau gas-power-fertilizer complex is expected to start to significantly deplete from 2023 and to be completely depleted by 2033. From 2023 the Ca Mau gas-power-fertilizer complex will need to utilize gas from the new Vietnamese Block B offshore gas field (but this in turn is expected to be completely depleted from 2033), from new yet to be developed fields, or to import LNG. So it is realistic to assume that the Ca Mau gas-power-fertilizer complex will have minimal residual value from around 2030 onwards. No evidence could be found that climate change related sea/water level rise, increased cooling water supply temperatures, increased ambient temperatures, or increased salinity were considered in the planning of any part of the Ca Mau gas-power-fertilizer complex. Copies of the Feasibility Studies were requested in three separate site visits, no copies were known to be on site nor was it known where an FS copy could be obtained.
The existing two Ca Mau power plants are claimed to be 1.57 - 3.2 m AWL and the fertilizer plant currently under construction is apparently 2.32 m AWL). The current gas distribution plant and the proposed new gas processing plant seem to be at no immediate risk of inundation from tides and/or wet season inundation. Both the existing and the new elements of the gas-power-fertilizer complex could be relatively easily and cost-effectively defended against sea level rise or flooding from

Climate Change Impact and Adaptation Study in Mekong Delta – Part A
69 | P a g e
increased likelihood of extreme weather events with technically straightforward and cost-effective dykes and pumps as required.
Some minor corrosion was already noticeable at some existing gas distribution centre pipework. At the Ca Mau power plant No 1 there was considerable corrosion apparent in minor nuts, bolts, and brackets, also corrosion was apparent in the cooling tower concrete structure. Any changes in dry season salinity would therefore exacerbate this existing corrosion problem. This issue of early corrosion at the Ca Mau gas-power complex would seem to be a more significant issue for attention than any slight reduction in the already very high thermal efficiency of the two power plants, which would be hastened by increased temperatures.
For the Ca Mau gas-power-fertilizer complex both at an overall level and for its individual components, climate change was clearly seen to be an environmental issue to be dealt with by the environmental team, and not a business investment strategic issue. No information could be found from the relevant environmental management staff as to site heights above water level, nor any need to consider the practicalities of defending the site against any water level rise or other climate change effects. There was apparently no consideration of climate change impacts in the current five year power plant rehabilitation project.
4.6.2 Electricity Transmission and Distribution System Ca Mau has an extensive medium voltage (4,122.5 km of 22/12.7 kV lines of which 2865 km is 12.7 kV single phase) and low voltage (5,317 km of 380/220 V of which 5204 km is single phase 220V) distribution system. The major distribution components are shown in Figure 39. The distribution system poles mostly date from 1997 and apparently have a 12 - 15 year (salt / fresh water) design economic life. The high voltage 110 kV and some old 35 kV) high voltage transmission system towers/poles and transformers should have a 30 year economic life. Total distribution system capital investment = $34M.
The power distribution system is generally technically reliable to international standards; apparently there were only 24 power outages of over 10 minute’s duration in 2010 in the Ca Mau provincial 22/12.7 kV medium voltage lines. The EVN (state owned Electricity Vietnam) Ca Mau distribution company expects to only lose 2 – 5% of low/medium voltage poles in a major 1997 typhoon Linda type extreme weather event, but this could be an underestimate and could usefully be examined further in follow up studies to this ADB TA. There is a planned low/medium voltage distribution system replacement program at the end of its design life. So the worst case (cost wise) impact of increased salt water intrusion would be to accelerate the respective replacement poles/wires/insulators replacement program from its (design) 15 years down to 12 years. The installed low/medium voltage pole cost is $100 - $150 per pole. The total number of poles in Ca Mau province is around 100,000 and around 30% of poles are already in salt water affected areas.
In 2010, there was around 100 hours/year of dry season rotating power cuts from insufficient hydro water storage in the integrated EVN Vietnam power generating-transmission-distribution system. Many industries therefore have back-up diesel generators.
The 110 kV inter-province and 220 kV and 500 kV high voltage national-backbone power grid is managed by the EVN owned Southern Grid Company based in HCMC.

Climate Change Impact and Adaptation Study in Mekong Delta – Part A
70 | P a g e
Figure 39 - Ca Mau Electricity Network.

Climate Change Impact and Adaptation Study in Mekong Delta – Part A
71 | P a g e
Figure 40 - Examples of 22 kV 3-Phase Medium Voltage (with cross arms) and 220 kV Single Phase Low Voltage Poles (no cross arms) in a Typical District Urban Setting. Courtesy: Frank Pool.
There are plans for Ca Mau provincial electrification to be extended to an additional 15,000 households by 2015 to give 99% electrification coverage, which would probably be close to the ultimate practical electrification limit in Ca Mau province. Est. capital cost = $8 million.
There are strong plans that are apparently approved (and apparently now at the detailed design stage and waiting for its geological survey to be approved) for a new 400 km long gas pipeline (246 km offshore and 152 km onshore) from the new Block B offshore gas field, a new gas processing plant, new LPG and condensate export pipelines to the coast and to an offshore ship loading platform, and a new gas pipeline to Can Tho - in particular for the planned O Mon power plant complex with five 750MW CCGT (Combined Cycle Gas Turbine) units. The new 28” diameter Block B – O Mon gas pipeline would supply natural gas from a new 100% Vietnamese gas field owned 51% by Petro Vietnam (also Chevron, Japan's Mitsui Oil Exploration Co and Thailand's PTT Exploration and Production ) to Ca Mau. The new development is planned to include a new LPG and condensate separation plant and separate 6” diameter condensate and 8” diameter LPG export pipelines located 3 m from the existing PP3 pipeline route to the coast, the pipelines would travel 29 km to Moi Tram where there would be shore based storage facilities and then travel 19.8 km through two 12” diameter pipelines to an offshore docking point for export via 3,500 ton ships. Some of the new natural gas would be needed for the Ca Mau fertilizer (urea) processing plant currently under construction and which apparently will lack sufficient gas to operate at full output without the new gas pipeline. The gas from the new pipeline would also be needed for the two 750MW Ca Mau power stations as their current gas supply is only expected to be sufficient until around the year 2023. The new 28” O Mon gas pipeline and associated infrastructure construction is scheduled to take 36 months. The new pipeline will almost certainly proceed as it is needed to supply the necessary gas to run the fertilizer plant at full output, as there is not enough gas available from the existing PP3 pipeline for the two Ca Mau power stations and the fertilizer plant to all run at full output.
There are plans to build a new pipeline on a new route from the existing Ca Mau gas processing plant site, across Hau Giang, Kien Giang, and Bac Lieu provinces to O Mon near Can Tho City, capacity

Climate Change Impact and Adaptation Study in Mekong Delta – Part A
72 | P a g e
18.3 million m3/day (6.4 billion m3/year) – to supply new 5*750MW CCGTs power plants in Can Tho province. The project has been approved by the government, however the feasibility study (FS) is not yet apparently completed and EPC contractors do not seem to have yet been chosen. The scheduled construction period is 36 months. The new development would involve new pipelines parallel to the existing PP3 gas pipeline from the coast to the existing Ca Mau gas distribution site, and a new gas processing plant is to be built next to the existing Ca Mau gas pipeline-power-fertiliser complex. Asset value for the new gas pipeline and gas processing plant = $1.5 Billion.
4.6.3 Other Energy Sources LPG is widely used for cooking, but some poor rural people cannot afford LPG and use fuel wood and/or charcoal instead (made from mangroves and presumably other tree species as well).
Around 0.5 – 0.7% of households in electricity reticulated areas are too poor to use the electricity distribution system that is already running past their dwellings, they use kerosene lamps instead. These households are thought to disproportionately include ethnic minorities.
Around 100 animal waste bio-digesters are thought to be in use, and there is probably not a great scope for more as Ca Mau province is not a major livestock producer with significant concentrated animal waste availability. At least two charcoal manufacturing plants are in production in Ngoc Hien district, apparently using mangroves as input material, but their scale and output is unknown.
There is some use of loose bulk rice husks and rice husk blocks for fish meal drying and household cooking, also some coal and fuel oil is used in the aquaculture processing industry. Overall use of fuels for process heat in Ca Mau province appears to be small. There is some use of mangrove wood and coal for (mostly wild) shrimp and offshore fish drying which is widespread at a rural household small business level, but as this is an informal industry no official statistics are available.
Two 10MW grid connected rice husk/straw fuelled power plants are included in future provincial development plans to be developed in three northern rice growing areas. The rice husk/straw power plant concepts would each have a 3-5 ha plant area and they are proposed to be implemented by private developers for 2015. It does not appear that detailed investigations or design work has been undertaken to date. With most rice now being husked outside Ca Mau province, and rice production down 40% from its peak, it would seem more likely that rice husk power plants would be built in the neighbouring provinces near to the existing rice husking plants in other provinces. At an est. $1500/MW, the asset value for 20MW of rice husk fired plant = $30 M.
Figure 41 - a) Household Dried Wild Shrimp Sorting and b) Rice Husks for Fish Meal Factory Thermal Use. Courtesy: Frank Pool.

Climate Change Impact and Adaptation Study in Mekong Delta – Part A
73 | P a g e
4.7 Transport System For hundreds of years transportation of goods and people throughout Ca Mau Province (and the rest of the Mekong Delta) has predominantly been via inland rivers and canals. The major canals and waterways of the Ca Mau Peninsular are shown in Figure 42. Settlements sprang up at confluences and dwellings typically located along the elevated banks of canals dug for communications, development or water control. Trade managed to develop and thrive using the many thousands of kilometres of inter-connected waterways which in turn are linked to provincial and international markets. Even today it is quicker (and about the same price) for travellers to use either a hydrofoil or a slow boat (between 3 – 5 hours) between Ca Mau and Rach Gia cities than a bus (6 – 7 hours). With at least 4 trips each way per day, the slower boats also allow the transport of motorcycles, thereby eliminating the heavy wear and tear which would otherwise be experienced using the land route. The current combined road and waterway transport network of Ca Mau province is shown in Figure 44.
The linkages between economic activities, transportation and the main settlements are shown conceptually in Figure 43. Essentially, water is the key to the transport of heavy/bulky products to processing centres because it:
Can take bigger loads (roads are effectively constrained to 18 tons even assuming bridges have that capacity: the wide range of barge types can take between 20 - 100 tons)
Is cheaper (up to 60% according to discussions with the DoT),
Can reach remote areas whereas the road system has limited access (Class I or II roads); and there are still vehicle ferries to cross major rivers even on national roads
Is convenient: it allows goods to be delivered door to door with minimal fuss (of the 69,000 boats identified by the DoT at end 2010 only 25,000 were registered) and avoiding checkpoints on roads for those maintaining it, the cost is about 20 percent of typical road maintenance costs.
Figure 43 - Linkages between economic activities, transportation and the main settlements. Source: Ian Hamilton.
Figure 42 - Main Inland Waterways Ca Mau. Province (Vietnam Inland). Source: Ian Hamilton.

Climate Change Impact and Adaptation Study in Mekong Delta – Part A
74 | P a g e
Figure 44 - The Ca Mau Transport Network.
It is claimed that the inland waterway system accounts for over 80% in tons and tons/km of the total goods production in Ca Mau province, (World Bank, 2007). The proportions of goods carried by the two modes in the Mekong overall is shown in Table 27. Only perishable, small size or valuable cargoes, such as fisheries products, use roads in any significant way.

Climate Change Impact and Adaptation Study in Mekong Delta – Part A
75 | P a g e
Table 27 - Modal Split for Freight Transport in the Mekong Delta (2007).
Category Road Water
Rice 7% 93% Sugar 18% 82% Fishery Products 63% 37% Fertilizer 1% 99% Cement 3% 97% Construction materials 1% 99% Coal 14% 86% Refined oil 4% 96% Wood 22% 78% Steel 36% 64%
Source: World Bank (2007).
Figure 45 - Typical road and canal layout and standards Ca Mau Province. Courtesy: Ian Hamilton.
Song Doc town is the main fishing port in the Province, with more fish reported (72,000 + tons in 2009) than all the other Ca Mau districts together, (Tran Thi Phung Haa, 2010). However, it has been suggested that only a small proportion of the catch is actually landed there at present. Apparently, a large number of fishing boats often serve offshore mother ships which then take the majority of the catch to HCMC or Can Tho which has been designated as the major centre for fish processing in the Delta. Although some fish is sent onwards to Ca Mau City, the local road and bridge system is inadequate to take heavy goods vehicles. Observation of market stalls in Song Doc town suggests that stocks and variety of fish species for sale locally are limited.
The situation for transporting aquaculture products from the southern Districts to Ca Mau City is similar. There is a small vehicle ferry over the Bay Hap River south of Ca Mau City which again constrains goods transport by road. Hence fresh produce is mostly shipped by canal north to Ca Mau City. One complication in the equation is that produce must be delivered within 8 hours to remain fresh for processing. Information from the DoC suggests that it can be delivered within 2 hours by canal.

Climate Change Impact and Adaptation Study in Mekong Delta – Part A
76 | P a g e
Figure 46 - Main road into Song Doc and the Ferry over Bay Hap river. Courtesy: Ian Hamilton.
Access from the north is also constrained by the current standard of roads (sealed 3.5 metre carriageway) and bridges. One bridge at Tan Loc Commune has a capacity of 6 tonnes (wood & steel) with a single lane. Another single lane all steel bridge in the vicinity has an 8 tonne limit.
4.7.1 Roads It is clear from the limited length (392 km) of strategic (National/Provincial) roads within the province that there has been little focus on road building in the past and that which does exist is not built to high national or provincial standards. This situation has further reinforced the dominance of water, especially for the transport of goods. For personal travel and for transport of relatively small amounts of goods the motorbike is the most practical and cost efficient means as many bridges are too narrow for larger vehicles.
The current position for National and Provincial Road provision (hierarchy level and lengths) in the Province is shown in the next chapter together with details of planned upgrades of existing routes as well as new strategic roads.
4.7.2 Airports There is a domestic airport at Ca Mau City which is located about 2 metres above sea level and is currently well drained with a network of surrounding canals. There are currently two daily one hour flights to and from HCMC with Vietnam Airlines. A small military airfield exists in Nam Can.
Figure 47 - Bridge at Tan Loc. Courtesy: Ian Hamilton.

Climate Change Impact and Adaptation Study in Mekong Delta – Part A
77 | P a g e
4.8 Urban Settlements Amongst the 9 Districts in the province, Ca Mau City has a high level of centrality in terms of its provision of high level services and is a magnet for investment and residency compared to other centres. In the 5 official standard classes of urban centres (see Table 29), Ca Mau City is the only one not considered as Class 5 as shown in Table 28.
Table 28 - Current Urban Population (2008).
No. Centre Urban Population
Area (km2)
Density (pp/km2)
Class
1 Ca Mau City 145,118 70.74 2,051 III
2 Nam Can Town 19,054 27.08 704 V
3 Song Doc Town 32,050 33.49 957 V
4 – 15 All other centres < 15,000 V
Source: Provincial Development Report 2008.
Ca Mau City is the administrative and commercial centre: it is also the main location for processing of the outputs from the region’s primary sector. It is located inland but is well served regionally by both water and road (Highway 1 linking east to Can Tho) access.
Nam Can town, the southern port, has been chosen as one of 15 identified coastal economic zones in the country. It is currently a key transit centre for aquaculture products in the southern part of the Province.
As the main port on the west coast, Song Doc town has Marine Economic Town status but is not the District’s administrative centre (Tran Van Thoi Town). It serves as the base for small (<2,000 tons) fishing boats.
Table 29 - Hierarchy of Urban Centres (Asian Development Bank).
Class Type
I National centres. Very large cities, which play an important role in national development. Population not less than 1 million
II Regional centres. Large cities which play an important role in development of a territory. Population from 350,000 to 1 million.
III Provincial cities. Large-medium size towns, which play an important role in development of a province or sector in a territory. Population from 100,000 to 350,000.
IV Provincial towns. Small-medium size towns, which play an important role in development of a province. Population from 30,000 to 100,000.
V District towns. Small towns, which play an important role in development of a district. Population from 4,000 to 30,000 persons.
Others District towns and clusters
Source Asian Development Bank.

Climate Change Impact and Adaptation Study in Mekong Delta – Part A
78 | P a g e
4.8.1 Urban Utilities
4.8.1.1 Urban Water Supply The Ca Mau Water Supply, Sanitation and Urban Works (CMWSSUW) Company supplies 8 out of 9 Districts (except Ngoc Hien) in Ca Mau Province with treated piped water. The coverage is about 200,000 people which is close to the estimated current (2009) total urban population of around 260,000 persons. Consumption is around 60,000 m3 per day or 300 litres/capita/day delivered, although “unaccounted for water” is thought to be about 34%. The price of water to the consumer is subsidised at 4,100 VND/ m3 (20 cents).
Ca Mau City
There are 2 new water plants producing 4,800 m3 and 7,200 m3 per day. Together they cover 55% of current needs although they are currently working well below capacity. The depth of the wells is 260 metres. They are supplemented by 18 smaller older wells. The overall network is not fully automated. The CMWSSUW can monitor what is happening in other wells but cannot centrally coordinate flows. The system is now pressurised from the plants: water storage towers are no longer used. Water treatment at the new plants is through sand filter; flocculation
(ferrous oxide) and chlorination. There are no extra additives or other treatments as pH and quality are within standards. Apart from one small well (Station 1 at Ly Thuong Kiet Street at 120 metres) all wells have a depth range between 230 and 261 metres. Use of UPVC pipes is being discontinued and replaced by High Density Polyethylene (HDPE). These are 1.5 times more expensive but the underlying geology is so soft that the UPVC pipes move and leak at the joints.
The level of fresh groundwater is declining. Previously fresh water could be found at 5 – 6 metres down but now it is at least 20 metres. The CMWSSUW has to locate wells further from town to find fresh water. The CMWSSUW is unable to manage/control the many thousands of private wells and those of industries (especially seafood) which drill their own wells. Permission is supposedly required from DONRE to drill but it is unsure how many apply/obtain permits. Unregulated drilling is often not done well so that saline and fresh water layers become mixed.
There is a salinity issue especially on the west coast. Quality in some areas is poor. In the past individual households built their own individual wells, along rivers where they live. Erosion sometimes caused the river banks to collapse, the wells get destroyed and river water contaminates the well. People then build new wells and repeat the process. In urban areas, people move to a piped supply but may not properly cap their individual shallow wells. These can then be polluted with urban run-off and sewage.
Nam Can Town
Two wells currently provide piped water to 100% of households. One well is located in the centre of town and one in Hang Vinh Commune. They extract water from a depth of 230 – 265 metres with good quality. Treatment consists only of chlorination.
Song Doc Town
In the town there are 3 wells which provide piped water to the local population. The wells are around 245 metres deep. In new areas developers have to provide new wells themselves and should be at least
Figure 48 - New water treatment plant Ca Mau. Courtesy: Ian Hamilton.

Climate Change Impact and Adaptation Study in Mekong Delta – Part A
79 | P a g e
180 metres in depth. Treatment is by chlorination only. Each new subdivided development block is required to provide a new well to serve its area. Two new plants have recently been constructed in Song Doc.
4.8.1.2 Urban Drainage, Flooding and Sewage Disposal Ca Mau City
The drainage system is not working effectively, especially with high tides. At high tide the system is unable to drain to the river in certain locations. This is not a recent problem but is getting worse especially during extremely high tides (the latest was in autumn 2010). The problem is exacerbated by:
Blockage of drains with rubbish (even moderate rainfall causes flooding of roads as run-off is unable to escape into the roadside drains).
Two main output drains/gates to the river have been rendered less effective by local people (encroaching properties, rubbish, collapsed road) which has reduced the flows dramatically causing back-up and flooding.
Initial placement of drains was done without a proper topographical survey which is unfortunate considering that there is very little fall/gradient available throughout the city to ensure dispersal of regular flows
Surrounding lakes which formerly acted as retention ponds are being reclaimed thus reducing storage during flooding.
Silting of drains and canals
Increased urban run-off into system
Drainage system has been incrementally added to as the city has grown but not to any overall strategy.
Currently most buildings are reported to use septic tanks which discharge into the city’s drainage system. Each owner is responsible for their own septic tank maintenance.
Nam Can Town
Local authorities report that floods are becoming more serious each year, especially from October – January. The market and administrative areas flood during high tide/heavy rains. All household sewage drains direct to canals with no treatment. Industries are supposed to treat their own waste first.
Song Doc Town
Song Doc is not currently protected by the sea dyke. The current town is compact and of high density lying on both sides of the river close to the mouth. Flooding in the oldest parts of town along the river is normal at high tide but only for a few hours. There is no flooding from upstream flows. All sewage goes straight into the river with no treatment. Plans for new buildings since 2006 have to show a septic tank to be approved so over time the situation is expected to improve.
Figure 49 - Typical drain blockage Ca Mau. Courtesy: Ian Hamilton

Climate Change Impact and Adaptation Study in Mekong Delta – Part A
80 | P a g e
4.8.1.3 Urban Solid Waste Solid Waste collection and disposal is the responsibility of the CMWSSUW for 8 out of the 9 Districts in the Province (excludes Ngoc Hien). All Districts have landfill sites with uncontrolled dumping. Site locations are determined largely by land availability and proximity to towns. No provision is made for containing waste and effluent within sites except for chemical spraying. No soil covering layers are provided. In Song Doc a temporary site is located in a Protected Area: boats dump collected waste in the mangroves where it is then redistributed by tides. Scavenging for plastics and other saleable items occurs in several of the sites.
Collection systems range from individuals with baskets to purpose-built dump trucks collecting from kerbside wheelie bins. In all towns it is evident that large amounts of solid waste are carelessly dumped into waterways, along roads and in drains. These build-ups and blockages of solid waste in the drainage system have contributed towards localised flooding. There is also potential for increased health risks due to uncontrolled dumping. Vermin are a significant visual issue in Ca Mau City. Floating debris is proving a common annoyance to water transport through propeller fouling.
Figure 50 - Dumping in a Protected Area, Song Doc. Courtesy: Ian Hamilton.

Climate Change Impact and Adaptation Study in Mekong Delta – Part A
81 | P a g e
5. Kien Giang Province With a total population of more than 1.6 million, Kien Giang’s economy grew robustly in the period 2001- 2010 with an annual GDP growth rate of 12 percent as compared with a growth rate of 8 percent in the previous period of 1996-2000 period. In 2009, total GDP of the province reached US$ 1,592 million and GDP per capita increased from US$640 in 2005 to US$946 in 2010. Economic growth is projected at nine percent for the period 2010-30 and eight percent for 2030-50. While, as observed in Chapter 2, the reality of these long term growth projections seems limited they do illustrate the central governments long range planning horizon. Similar to Ca Mau, key drivers underpinning this robust growth were the implementation of various investment related laws and polices ensuing in a higher efficiency of capital allocated in the province. As a consequence private investments also grew strongly with significant spill-over effects to other economic sectors.
In 2005, there were only 240 registered companies in the province consisting of Small and Medium Enterprises (SMEs) which has now increased to more than 3,600 mainly in agro-processing sectors (fish, shrimps, lobsters, crabs) and tourism particularly in Phu Quoc and Ha Tien. Factories have invested in modern technology such as cold storages, packing and sorting equipment and are now able to supply high quality products to highly demanding overseas markets.
Other drivers of Kien Giang’s impressive economic performance have been investments in social (e.g. schools and hospitals) and physical infrastructure (e.g. roads, power, and water management). These investments have had not only a direct impact on employment opportunities but have also laid the foundation of the infrastructure underpinning a sustained long term growth. Currently at US$224 million in 2010, infrastructure investment has grown robustly at more than ten percent per year. Salient infrastructure developments are predominantly located in Phu Quoc with a new North-South highway currently being constructed. In 2013 a new international airport will be opened which will significantly increase the number of international visitors. As a result, the island’s tourism industry is expected to grow significantly.
Revenue from tourism amounted to VND 39.1 billion in 1998 and increased to more than 543 billion VND in 2010. More than 2,510 people are directly employed in the tourism sector accounting for more than 30 percent of the services sector for the province as a whole.
The following sections provide a profile of the makeup of the province. The profile describes the data that contributes to the vulnerability indicators used in the vulnerability analysis. The indicators are discussed by sector, and the chapter focuses first on measures of the social structure then looks at the economic makeup of Kien Giang. A description of the landuse is used to inform a discussion of the agriculture and livelihoods. The industries of the province and the energy system are then outlined followed by a discussion of the urban settlements and transport system.
5.1 Population and People Kien Giang’s populations amounted to more than 1.6 million in 2010. Its capital city is Rach Gia and it has Ha Tien as important deep sea port connecting the city with a wide array of destinations in the region. The province counts 13 districts (Figure 51), and 118 communes and towns. The key demographic indicators are presented in Table 30. Average population density is 266 person/km2 which is about equal to the national density (260 person/km2). Population growth is 1.3% per year and the female population accounts for 50% of the total population. Net emigration is (-)0.7%, less than in Ca Mau province, but nevertheless worrying as apparently its population still seeks economic opportunities in provinces, mostly in Ho Chi Minh City.

Climate Change Impact and Adaptation Study in Mekong Delta – Part A
82 | P a g e
Figure 51 - Kien Giang Administrative Map

Climate Change Impact and Adaptation Study in Mekong Delta – Part A
83 | P a g e
Table 30 - Kien Giang - Key demographic indicators (2010).
Item Measure Value
Total population Number 1,688,288 Districts Number 13 Communes/towns Number 118 Population density Number/km2 266 Female population % of total population 50% Population growth % per year 1.3% Net migration per year % per year (-) 0.7%
Source: District Survey.
A further breakdown in areas (km2), population and population densities (population/km2) for each of the districts is depicted in Table 31 and Figure 52 and Figure 53. Salient observations are: Hon Dat is the largest district in size with a relatively small population of over 166,000. As a result its population density is the lowest in the province. After the provincial capital Rach Gia City, Kien Hai has the highest population density with 813 persons per km2.
Table 31 - Kien Giang - areas and population per district (2010).
District Area Km2 Population Population density km2
Rach Gia city 103.6 224,197 2,163 Ha Tien town 98.7 44,400 449 Kien Luong district 472.4 78,165 165 Hon Dat district 1,046.7 166,797 159 Tan Hiep district 419.3 142,148 339 Chau Thanh district 285.41 148,732 521 Giong Rieng district 639.24 212,716 333 Go Quao district 439.47 136,915 312 An Bien district 400.29 122,058 305 An Minh district 590.56 115,634 196 Vinh Thuan district 394.74 89,814 228 Phu Quoc district 589.36 90,670 154 Kien Hai district 26.15 21,272 813 U Minh Thuong district 432.7 67,698 156 Giang Thanh district 407.44 27,012 66
Total/average 6,436.27 1,688,228 266 Source: District Survey (2011).

Climate Change Impact and Adaptation Study in Mekong Delta – Part A
84 | P a g e
Figure 52 - Kien Giang Population Density Map

Climate Change Impact and Adaptation Study in Mekong Delta – Part A
85 | P a g e
Figure 53 - Kien Giang - population density/km2 by district, compared to average (red line). Source: District Survey (2011).
Kien Giang can be classified as a rural province with a high percentage of the population living in rural areas (73 percent) although somewhat lower than in Ca Mau province (80 percent).
The district level assessment of urban or rural residence is depicted in Table 32 below. As can be observed, significant variations exist in these percentages with Ha Tien (67 percent) and Rach Gia City (93 percent) living in urban areas, In contrast only six percent urban population in An Minh district.
Table 32 - Kien Giang- urban vs. rural population/district 2010 (# and %).
District Urban Urban % Rural Rural %
Rach Gia city 208,615 93% 15,582 7% Ha Tien town 29,886 67% 14,514 33% Kien Luong district 33,070 42% 45,095 58% Hon Dat district 30,124 18% 136,673 82% Tan Hiep district 19,318 14% 122,830 86% Chau Thanh district 20,808 14% 127,924 86% Giong Rieng district 17,718 8% 194,998 92% Go Quao district 9,625 7% 127,290 93% An Bien district 11,668 10% 110,390 90% An Minh district 6,706 6% 108,928 94% Vinh Thuan district 13,614 15% 76,200 85% Phu Quoc district 52,788 58% 37,882 42% Kien Hai district 0 0% 21,272 100% U Minh Thuong district 0 0% 67,698 100% Giang Thanh district 0 0% 27,012 100% Total 453,940 27% 1,234,288 73% Source: District Survey (2011).
266
66
156
813
154
228
196
305
312
333
521
339
159
165
449
2163
0 500 1000 1500 2000 2500
Average
Giang Thanh
U Minh Thuong
Kien Hai
Phu Quoc
Vinh Thuan
An Minh
An Bien
Go Quao
Giong Rieng
Chau Thanh
Tan Hiep
Hon Dat
Kien Luong
Ha Tien
Rach Gia City

Climate Change Impact and Adaptation Study in Mekong Delta – Part A
86 | P a g e
Table 32 is summarized in Figure 54 below depicting urban population as a percentage of total population per district.
Figure 54 - Kien Giang-urban population by district 2010 (%), compared to average (red line). Source: District Survey (2011).
5.1.1 Socially Vulnerable Groups Kien Giang has about 10 ethnic minority groups, and total number of ethnic people is 244,780 people accounting for 16% of total provincial population. Khmer is the dominant group (13%) followed by Hoa (3%) and others (Tay, Nung, Muong, Cham, Ngai, H’mong, Ede) contributing less than 1%. Poverty ratio of ethnic people is still high except Hoa group. Poverty ratio of Khmer is 18% and for the other ethnic groups this is about 32%.
5.1.1.1 Poverty Kien Giang’s poverty rate stands at six percent of the total population.
The percentage of the population classified as poor is depicted in Figure 55 below. As can be observed, various districts have significantly higher poverty percentages than the provincial average, notably Giang Thanh, An Bien, An Minh and U Minh Thuong.
93%
67%
42%
18%
14%
14%
8%
7%
10%
6%
15%
58%
0%
0%
0%
27%
0% 10% 20% 30% 40% 50% 60% 70% 80% 90% 100%
Rach Gia city
Ha Tien
Kien Luong
Hon Dat
Tan Hiep
Chau Thanh
Giong Rieng
Go Quao
An Bien
An Minh
Vinh Thuan
Phu Quoc
Kien Hai
U Minh Thuong
Giang Thanh
average

Climate Change Impact and Adaptation Study in Mekong Delta – Part A
87 | P a g e
Figure 55 - Kien Giang - Poverty rates per district 2010 (%), compared to average (red line). Source: District Survey.
Official unemployment in the province currently stands at three percent of the active population (2010) but significant variations exist between the districts depicted in Figure 56 below. For instance Kien Hai has an employment figure of six percent, i.e. double the provincial average. Employment figures in many districts (marked in the figure below with zero percent unemployment) could not be obtained though as they remain unrecorded in Government statistics.
Figure 56 - Kien Giang - district unemployment % (2010), compared to average (red line). Source: District Survey.
6%
10%
11%
1%
2%
9%
7%
10%
9%
9%
4%
5%
4%
8%
2%
2%
0% 2% 4% 6% 8% 10% 12%
Average
Giang Thanh
U Minh Thuong
Kien Hai
Phu Quoc
Vinh Thuan
An Minh
An Bien
Go Quao
Giong Rieng
Chau Thanh
Tan Hiep
Hon Dat
Kien Luong
Ha Tien
Rach Gia City
4%
0%
2%
0%
2%
0%
0%
2%
3%
6%
2%
0%
0%
0%
0%
3%
0% 1% 2% 3% 4% 5% 6% 7%
Rach Gia
Ha Tien
An Bien
An Minh
Chau Thanh
Giang Thanh
Giong Rieng
Go Quao
Hon Dat
Kien Hai
Kien Luong
Phu Quoc
Tan Hiep
U Minh Thuong
Vinh Thuan
Average

Climate Change Impact and Adaptation Study in Mekong Delta – Part A
88 | P a g e
5.1.1.2 Health Table 33 below presents key health indicators at provincial level.
Table 33 - Kien Giang – provincial key health indicators (2010).
Indicator Total Number Number of Inhabitants Per Indicator
Health establishments 156 10,256 Patient beds 3,720 430 Medical doctors 851 1,880
Source: District Survey.
The above Key Health Indicators can now be further dissected at district level and are presented in Table 34 below. This study focus only on the number of health establishments and medical doctors as these drive the number of patient beds. Some salient discrepancies at district level can be observed e.g. Hat Tien has a relatively high number of medical establishments and in Tan Hiep this number is lower. If we look at number of medical doctors we can see Rach Gia City with a relatively low number of inhabitants per doctor as compared to e.g. U Minh Tong.
Table 34 - Kien Giang - district key health indicators (2010).
Districts # medical establishments
Per # inhabitants
# medical doctors
Per # inhabitants
Rach Gia City 15 14,946 542 542 Ha Tien 8 5,550 1,586 1,586 Kien Luong 14 5,583 2,443 2,443 Hon Dat 15 11,120 4,633 4,633 Tan Hiep 11 12,923 2,961 2,961 Chau Thanh 11 13,521 4,131 4,131 Giong Rieng 19 11,196 4,014 4,014 Go Quao 12 11,410 3,803 3,803 An Bien 10 12,206 3,212 3,212 An Minh 12 9,636 3,854 3,854 Vinh Thuan 8 11,227 1,952 1,952 Phu Quoc 7 12,953 2,667 2,667 Kien Hai 4 5,318 3,545 3,545 U Minh Thuong 10 6,770 8,462 8,462 Giang Thanh 0 0 4,502 4,502 Total/average 156 10,822 851 1,880
Source: District Survey (2011).

Climate Change Impact and Adaptation Study in Mekong Delta – Part A
89 | P a g e
5.1.1.3 Education Provincial adult literacy rates are shown in Figure 57. The provincial rate is about 100 percent with somewhat lower scores for Ha Tien (95 percent) and Giang Thanh (96 percent). Widely recognized, education determines to a great extent an individual’s ability to generate income. It is therefore an important measure of the population’s ability to cope with climate changes.
Figure 57 - Kien Giang – district adult literacy rate 2010 (%), compared to average (red line). Source: District Survey.
This study utilised the number of inhabitants per teacher as this allows us to pinpoint which districts have an average ability to educate its population without the need to migrate to a provincial capital or beyond. Provincial average of teacher per number of inhabitants stands at 203 depicted in Figure 58 below. An Bien has significantly less inhabitants per teacher than the provincial average.
99%
100%
100%
98%
99%
100%
100%
100%
100%
100%
96%
100%
100%
100%
95%
100%
92% 93% 94% 95% 96% 97% 98% 99% 100%
Average
Vinh Thuan
U Minh Thuong
Tan Hiep
Phu Quoc
Kien Luong
Kien Hai
Hon Dat
Go Quao
Giong Rieng
Giang Thanh
Chau Thanh
An Minh
An Bien
Ha Tien
Rach Gia

Climate Change Impact and Adaptation Study in Mekong Delta – Part A
90 | P a g e
Figure 58 - Kien Giang – no. inhabitants per teacher in each district (2010), compared to average (red line). Source: District Survey.
5.2 Provincial Development Context Commencing in 2000, the Government has implemented a wide array of interventions targeting the opening of the provincial economy and reinforcing its productive structure. Kien Giang has a more diversified economic fabric compared to Ca Mau building on its deep-sea port at Ha Tien and a buoyant tourism industry. In addition it also transformed low yielding paddies into high yielding shrimp cultivation. This has further improved Kien Giang’s competitive advantages with significant spin-offs to other economic sectors.
Both agriculture and aquaculture have seen dramatic yields increases in the last decade. Total rice production stands at more than 3 million tonnes (2010) and the area used for aquaculture currently stands at 107,523 ha with a total production of 318,255 tonnes (2010) creating numerous direct and indirect jobs in the value chain.
At provincial level GDP/capita stands at US$972 (2010) but significant variations exist. For instance, Rach Gia and Phu Quoc have a higher GDP/per capita of about US$1,450 whilst Giong Rieng amounts to about US$547/per capita. GDP per capita (2010) for all districts is presented in the Figure 59 below.
301
307
80
196
211
198
207
181
196
259
235
193
196
129
159
203
0 50 100 150 200 250 300 350
Rach Gia
Ha Tien
An Bien
An Minh
Chau Thanh
Giang Thanh
Giong Rieng
Go Quao
Hon Dat
Kien Hai
Kien Luong
Phu Quoc
Tan Hiep
U Minh Thuong
Vinh Thuan
Average

Climate Change Impact and Adaptation Study in Mekong Delta – Part A
91 | P a g e
Figure 59 - Kien Giang-GDP/capita per district 2010 (US$), compared to average (red line). Source: District Survey.
Living in predominantly rural areas, the population in the province often combines activities in various sectors. Shrimp production is combined with a retail shop or restaurant. As a result, the greatest contribution to household income is from Agriculture and Fishery. Relative importance of the three main economic sectors, being agriculture, industry and services, also changed. As depicted in Figure 60 the GDP contribution of the agricultural sector decreased from 48 percent in 2005 to 42 percent in 2010. An opposite trend can be observed with industrial and service activities and the importance of these sectors to GDP contribution increased in 2010 as compared to 2005.
Figure 60 - Kien Giang -- GDP contribution per economic sector 2005-10 (%).Source: District Survey.
Labour structure per economic sector in 2010 is presented in Table 35 below. About 56% of the population works in agriculture and fishery and only 12% of the population works in industrial activities. Population working in services (trade, transport and tourism) currently stands at 32% but is expected to grow in the coming years due to an expected increase in tourism.
972
1021
689
1063
1456
980
1323
808
910
547
923
750
698
729
1197
1480
0 200 400 600 800 1000 1200 1400 1600
Average
Vinh Thuan
U Minh Thuong
Tan Hiep
Phu Quoc
Kien Luong
Kien Hai
Hon Dat
Go Quao
Giong Rieng
Giang Thanh
Chau Thanh
An Minh
An Bien
Ha Tien
Rach Gia
0%
20%
40%
60%
80%
100%
2005 2010
Services
Industry & construction
Agriculture

Climate Change Impact and Adaptation Study in Mekong Delta – Part A
92 | P a g e
Table 35 - Kien Giang -employees per economic sector 2010 (# & %).
Economic sectors Employees %
Agriculture, Forestry and Fishery 493,692 56% Industry and Construction 106,660 12% Trade and Services 275,218 32% Total 875,570 100%
Source: District Survey
5.3 Landuse The distribution of the different land uses of the province is presented geographically in Figure 61. The proportion of the total land use occupied by each of the major land use types is shown in Figure 62. The figures indicate that agriculture, particularily rice is the dominant land use of the Province. There is also a growing area of land under aquaculture and some forested areas. The major land uses and the economic sectors of the Province are described below.
5.4 Agriculture Kien Giang has a total area of 634,000 ha, with agriculture the most important component of the primary production sector. The land use of the province is shown in Figure 62, 443,000 ha of the land area of the province is used for agricultural production with rice farming the main agricultural activity. The province can be divided into 3 eco-zones:
The Kien Luong/Hon Dat Square – bordering Cambodia and An Giang, affected by flooding every year, divided into a more saline area south-west of Hon Dat’s main canal/road; and a fresh water area to the NE of this alignment. This area is affected by flooding from September to November, with 62,000 ha under rice with harvests of 3.5 t/ha;
The central eastern districts between the Can Tho border and east of the Cai Lon River, containing Tan Hiep, Chau Thanh, Giong Rieng, and Go Quao. This region experiences flooding but is beyond the extreme salinity areas.
U Minh Thuong NP and An Bien/An Minh area west of the Cai Lon River with 64,000 ha of mostly rice/shrimp that is heavily affected by saline water.
Flooding affects most of the inland parts of the province every year. Flooding, even long lasting and deep ones were not stated as significant problems by province authorities, because the majority of the livelihoods in the Delta are agricultural. Awareness is high of the issue in DARD and wider society.
Traditional Rice-shrimp grown in An Minh and An Bien is considered desirable because it preserves rice production and supplies free feed for shrimps. These are now being filtered down to Commune level targets (40 – 60 ha per year per Commune).

Climate Change Impact and Adaptation Study in Mekong Delta – Part A
93 | P a g e
Figure 61 - The Land use of Kien Giang Province.

Climate Change Impact and Adaptation Study in Mekong Delta – Part A
94 | P a g e
Figure 62 Land Use of Kien Giang Province as a proportion of the total area. Source: Project Survey.
5.4.1 Cropping and Livestock The value of the output of agricultural products in Kien Giang has more than doubled since 1994 from 2905 Billion VND to 6344 Billion VND (at constant 1994 prices) and represents almost 4 percent of the national output. Both agriculture and aquaculture have seen dramatic yields increases in the last decade. Total rice production stands at more than 3 million tonnes (2010). Agriculture as an economic sector accounts for 42 percent of the provincial GDP and it employs 56 percent of the workforce.
Since 2000 over 8000 new farms have been developed which have increased the area of the province under rice paddy by 241 thousand ha (GSO 2011). An unfortunate trend resulting from this is a decrease in farm size. In 1994, 28 percent of rural households on the Delta had landholdings of less than 0.2 ha; by 1997 this figure had increased to 37 percent.
Figure 63 - Typical rice farm with vegetables, fruit, timber trees and a small pond for aquaculture. Courtesy M Russell.
Rice farmers in the coastal zone earn a lower income than those on alluvial soil and irrigated areas of the Delta, due to water and land constraints. In salinity areas, traditional rice is practised with one crop per year and rice yields are low.
Rice
Perennial Crops
Aquaculture
Production Forest
Protection Forest

Climate Change Impact and Adaptation Study in Mekong Delta – Part A
95 | P a g e
North east An Bien has 3,000 ha of double cropped rice with a yield of 4.2 t/ha/crop and also produces seed rice that is exported to other parts o Vietnam. An Bien and An Minh together have 32,000 ha of rice-shrimp production. Yield per unit area of rice-shrimp are 300 kg/ha/crop, with rice ranging from 3.6 to 4.00 t/ha for the autumn crop; and 3 t/ha from the dry season.
5.4.1.1 Other crops There is a small‐medium size sugar cane processing plant that was established in 1997 at Long Thanh village in Giong Rieng District. The mill operators purchase and transport cane from most of the other districts in the province. As cane does not transport well it requires processing plants to be nearby for optimum prices. The current extensive dispersed cane growing in the province require plans for sugar cane infrastructure to be developed in the future
Figure 64 - Mixed planting of rice and sugar cane. Courtesy M Russell.
There is also small scale production of a number of types of fruit in areas that are not subject to substantial flooding and where saline water is kept out by sluice gates. These include orchards of papaya, mangos and guava and plantations of coconuts, Pineapple (particularly in Go Quao) and bananas. There is a large coconut plantation on the saline affected area of the eastern Bank of the Ca Long River in the Chau Thanh district.
Phu Quoc has 300 ha of land under pepper crop averaging 3 tonnes per year. More than 700 households earn a yearly profit of 36-48 million VND per ha. There is some fruit production, with 900 ha given over to durian and mango.
5.4.1.2 Livestock In the project survey, the animal husbandry sector was stated as being largely for domestic local use, and that large scale specialized pig or chicken/egg farms do not exist. Duck farms are located along canals throughout the region. Houses in urban areas have swallow roosting sites on the roof to collect birds’-nests and 4-5 storey specialized buildings for swallow roosts. Pigeon coops are also found in both urban and rural areas.
5.4.2 Aquaculture and Fisheries Aquaculture is also becoming increasingly important to the province with the area used for aquaculture increasing from 13,000 ha in 1995 to 127,523 ha today, with a total production of 318,255 tonnes (2010). In Phu Quoc land based aquaculture produces 500 tonnes of shrimp and crab.
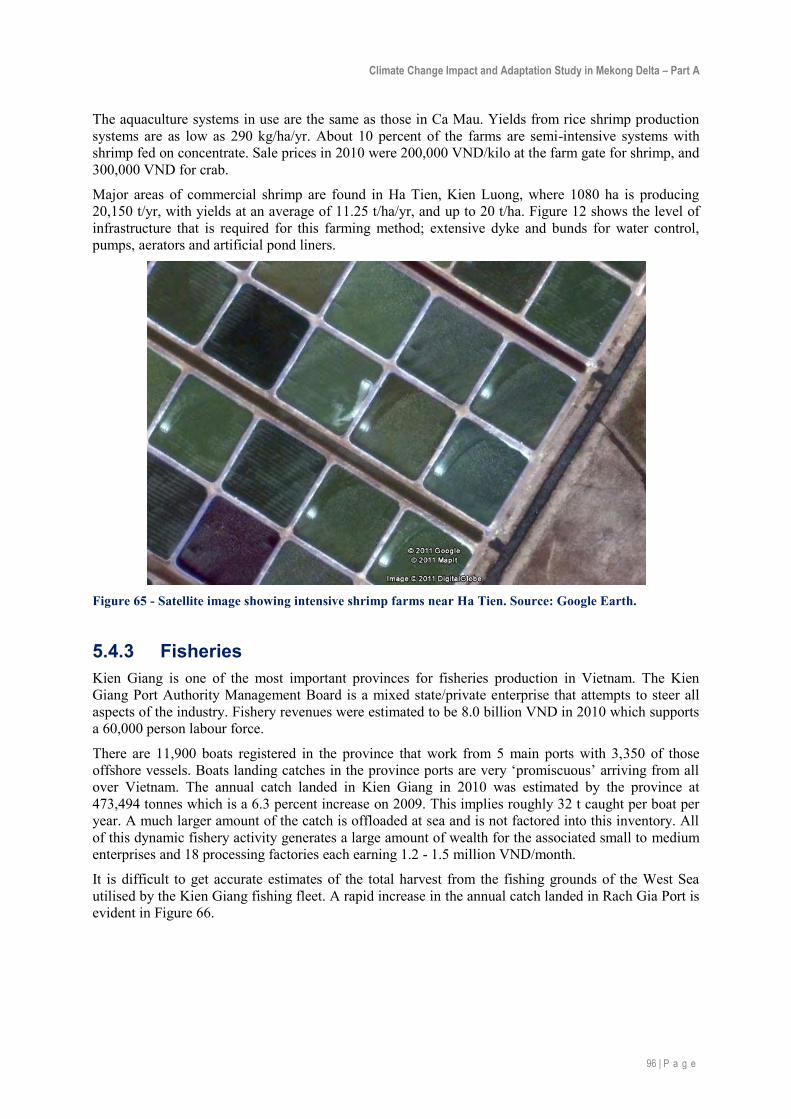
Climate Change Impact and Adaptation Study in Mekong Delta – Part A
96 | P a g e
The aquaculture systems in use are the same as those in Ca Mau. Yields from rice shrimp production systems are as low as 290 kg/ha/yr. About 10 percent of the farms are semi-intensive systems with shrimp fed on concentrate. Sale prices in 2010 were 200,000 VND/kilo at the farm gate for shrimp, and 300,000 VND for crab.
Major areas of commercial shrimp are found in Ha Tien, Kien Luong, where 1080 ha is producing 20,150 t/yr, with yields at an average of 11.25 t/ha/yr, and up to 20 t/ha. Figure 12 shows the level of infrastructure that is required for this farming method; extensive dyke and bunds for water control, pumps, aerators and artificial pond liners.
Figure 65 - Satellite image showing intensive shrimp farms near Ha Tien. Source: Google Earth.
5.4.3 Fisheries Kien Giang is one of the most important provinces for fisheries production in Vietnam. The Kien Giang Port Authority Management Board is a mixed state/private enterprise that attempts to steer all aspects of the industry. Fishery revenues were estimated to be 8.0 billion VND in 2010 which supports a 60,000 person labour force.
There are 11,900 boats registered in the province that work from 5 main ports with 3,350 of those offshore vessels. Boats landing catches in the province ports are very ‘promiscuous’ arriving from all over Vietnam. The annual catch landed in Kien Giang in 2010 was estimated by the province at 473,494 tonnes which is a 6.3 percent increase on 2009. This implies roughly 32 t caught per boat per year. A much larger amount of the catch is offloaded at sea and is not factored into this inventory. All of this dynamic fishery activity generates a large amount of wealth for the associated small to medium enterprises and 18 processing factories each earning 1.2 - 1.5 million VND/month.
It is difficult to get accurate estimates of the total harvest from the fishing grounds of the West Sea utilised by the Kien Giang fishing fleet. A rapid increase in the annual catch landed in Rach Gia Port is evident in Figure 66.

Climate Change Impact and Adaptation Study in Mekong Delta – Part A
97 | P a g e
Figure 66 - Changes in the annual wild fisheries catch landed in Rach Gia. Source Project Survey.
Perhaps a better idea of the fishing effort can be gained by an examination of the total revenue gained by the processing component of the industry, Figure 68. Comparison of the amount processed and the revenue reflects a shift in focus from lower quality species to higher end products and higher end markets. Export quality criteria are being strictly applied and the quality of the final product has been greatly raised. The data might also be the result of a concentration of aquaculture processing in other provinces leading to a reduction in the amount of trash fish landed in Rach Gia.
Figure 67 - Fishing boats from other Provinces anchored at Rach Gia. Courtesy M Russell.
Figure 68 - Comparison of total revenue and amount of fish products processed in Kien Giang from 2008 to 2009. Source: Quynh 2010.
280,000
300,000
320,000
340,000
360,000
380,000
2007 2008 2009 2010
Annual Catch (t)
Year
0
20
40
60
80
100
120
140
0
50,000
100,000
150,000
200,000
250,000
300,000
350,000
400,000
450,000
500,000
2008 2009 2010
Revenue ($US m) Amount
Processed (t)
Processed Revenue

Climate Change Impact and Adaptation Study in Mekong Delta – Part A
98 | P a g e
Around 100,000 t of sea food is landed at Phu Quoc, but from boats registered in many Provinces. Over 3300 small engine boats undertake local resource extraction, while about 1000 boats travel further, avoiding conflict areas with Cambodian armed fishermen, going south to the Ca Mau Peninsula area. About 80 percent of the fish landed on Phu Quoc are frozen and packaged for further processing in Chau Thanh and some 10 percent is turned to anchovy-based fish sauce. Shrimp, squid and crab are also fished, with an estimate that total revenue was 650 billion VND a year.
5.4.3.1 Squid resource There are 10 squid species with high price in the south west sea. The surveys of squid resources in the Kien Giang fishing areas at December/1993 of Hai Phong (Aquaculture Research Institute) the capability at 27 stations is estimated about 0.49-35.79 kg/h (according to the density of 11.76-534.56 kg/km2). Average is only 6.21 kg/h. According to the statistical book, the productivity of squid at south west sea is about 4,000-5,000 tons.
5.4.3.2 Clams Paphia textile (clam) is distributed near the Ba Lua and Hai Tac islands. Total production is 20,000 tons/year in 1996 and 15,000 in 1997 (Quynh 2010).
Sea Cucumber
There are 6 kinds of holothurian (sea cucumber) around Phu Quoc islands border. Among them, Holothurian edulis has the highest density of 40.25 /10,000 m2 with a biomass of 3,487.5 gr/10,000 m2. The total exploited annual resources for holothurian in the sea around Phu Quoc Island is 147,044 kg and around Coto Island it is 200,879 kg (Quynh 2010).
5.4.3.3 Jellyfish Jelly fish (Rhopilema hispidum) is harvested in shallow water 0-10 m in the south west sea from an area of 2,492 km2. In 2009 the resource was estimated to be about 6,100 tons at a density of 1.95 ton/ha (Quynh 2010).
5.4.3.4 Other Fisheries Coastal common pool resources, particularly the mudflats, are in the process of being rented out in some areas. This is most observable off the coast of An Bien where many of the mudflats have been claimed and fenced and rents have been collected by local authorities. The province has recently issued a decision providing for the rental of the mudflat areas (Provincial Decision No 35). Juvenile crabs are also harvested and reared to size in small ponds.
Anadara granosa (blood cockle) is harvested mainly in the tide areas with soft mud and sand in the sea bottom along the Ca Mau cape to Hon Chong in Northern Kien Giang.
5.4.4 Water resources Water requirement for rice greatly varies with cropping calendars, cropping patterns and areas. Rice cultivation consumes more water in the triple cropping than in the double cropping patterns. Intensification of high-yielding rice varieties with double and triple cropping requires heavy application of agro-chemicals and a large amount of fresh water for irrigation. Rice farming that is practiced during the dry season consumes a lot of water. Intensive abstraction of water for the rice farming in the upper Delta might also exacerbate salinity intrusion downstream, which in turn has negative consequences on agriculture and aquaculture, domestic water supplies and the environment.

Climate Change Impact and Adaptation Study in Mekong Delta – Part A
99 | P a g e
From discussions with district authorities some areas growing rice and aquaculture in An Minh and An Bien do not receive large volumes of reliable irrigation water and the areas are considered to be affected by drought. “Occasionally” there are years when rainy season starts in the “wrong month” or fails, such as in 2010, when saline water intruded severely. The province does have a feasibility plan to bring irrigation water to the district but the cost may be too high.
A problematic area is the Tien Hai Island Commune with 14 islands, all dependent on rainwater harvesting with housing located on low elevation islands.
Water in U Minh Thuong National Park is stored and filtered by the peat in the core zone, thus providing an important service to local farmers. The water levels in the Park are managed through a perimeter system of canals and dykes, with a series of gates and internal canals.
5.4.5 Natural areas, biodiversity and forests U Minh Thuong National Park (UMT NP) in Kien Giang Province was established in January 2002 from a Nature Reserve, with a total core area of 8 ha. The Park is of important cultural significance and was a base for resistance forces during the First and Second Indochina Wars. The Park is recognised as one of the three highest priority sites for wetland conservation in the Mekong Delta.
The Phu Quoc National Park (PQNP) was established in 2001 by upgrading the former Phu Quoc Natural Conservation Area, under the Decision No. 91/2002/QD-TTg of the Prime Minister dated June 8, 2001. PQNP has a high number of forest plant species. A recent biodiversity survey found 1,164 green plant species, belonging to 137 families and 531 genera, in which there are 5 species of Gymnospermae in 3 families and 4 genera, along with 23 species of Orchids including a new species for Vietnam, Podochilus tenius. Several wetland ecosystems such as mangrove and Melaleuca forest exist along with the primary and open Dipterocarp forest, several forms of secondary forest, brushland and stunt forest on the rocky side of mountains and other vegetation types (WAR 2006).
Results of a wildlife survey made by the Institute of Ecology and Biological Resources in 2005 found 206 wildlife species in Phu Quoc, in 75 families, 24 orders, and 4 classes. PQNP has 28 species of mammals 119 species of birds, 47 species of reptiles and 14 species of amphibians. Of those, 20 percent (42) of total wildlife species of the park are classed as rare, including 8 species of mammals, 10 species of birds and 24 species of reptiles (WAR 2006).
Figure 69 - U Minh Thuong National Park. Courtesy M Russell.
The karst area around Kien Luong consists of 21 small scattered limestone hills scattered across the Ha Tien coastal Plain. Their geographic isolation has led to high levels of specialisation and endemism.

Climate Change Impact and Adaptation Study in Mekong Delta – Part A
100 | P a g e
Over 322 plant species and 177 vertebrate species have been recorded in the area. Animals found are; 31 mammal species including the endangered silver langur, 9 bat species, 114 birds (6 of which are on the UN Red list), 13 amphibian species, and 32 reptile species. There are a large number of invertebrate species including 65 species of molluscs, (of which 36 are endemic) (Dang 2009).
A study of the Mangroves along the shoreline of Kien Giang found that nearly a quarter of the mangrove coastline (30 km) is experiencing active mangrove loss due to erosion and overall, one-third of the coastline is eroded or eroding. Pressure on the mangrove forests through cutting is evident along 77 km of coastline, affecting 58 percent of the mangrove area along the shoreline. Direct mangrove removal for canal, dyke and industrial construction covered 1.7 km of the coastline. Root burial associated with litter accumulation in Kien Luong district was observed to have killed an 800 m section of mangroves near Hong Quao. Extensive litter accumulation was noted to be present on a further 7 km (4 percent) of the coastline. In addition to wood harvesting, a number of other natural and anthropogenic pressures were identified from the shoreline survey that are likely to further reduce the resilience of the mangrove forest to coastal erosion (Duke et al. 2010)
Although greatly reduced, Melaleuca forests still play a very important role in local economies and confer considerable environmental benefits to the region. Kien Giang has 50,000 ha of plantation forest. An Bien and An Minh have a combined area of forest of 8000 ha, and Melaleuca forestry is common on land around the buffer zone of U Minh Tong National Park. Hon Dat Forestry Enterprise has 33,000 ha of Melaleuca forest. The Forest Enterprise manages the water levels by pumping in water during the dry season and opening bunds during the wet season. The productivity of Melaleuca plantations with sub optimal management ranges from 4 to 13 tonnes/ha. At this stage the main alternative wood products from Melaleuca forests are of low value and sell for well below the cost of production. Melaleuca sold for chip manufacture sells for 380 VND per kg (ca. 500,000 VND per m3) debarked at road/canal side.
A Coastal salt production zone exists with 2000 ha of saltpans producing salt with annual yields in the range of 3-4 t/ha.
5.5 Industry The industrial sector accounted for 37% of Kien Giang province’s GDP in 2010 (see Figure 60). The largest industrial sector in Kien Giang province is agriculture-aquaculture-food processing which in 2010 accounted for 48% of industrial value.
The heights above mean water levels (AWL) of the major industrial sector assets in Kien Giang province are not precisely known. Without a ground-truthed (adjusted for actual ground realities and actual heights) DEM (Digital Elevation Model) being available, the only way that relevant height data that could be gathered was to ask interviewees during the March and April 2011 site visits how high their plants were above water level, and check this with visual observations. So the height AWL of the industry sector assets given in the following sections is necessarily only approximate.
Kien Giang province has six industrial zones designated (including five new zones) with an area of 1610 ha and four industrial clusters with an area of 281 ha established or under development. The two significant existing industrial zones/clusters are the Tac Cau industrial zone primarily comprising 35 sea food manufacturing plants and in Kien Luong district with a cluster primarily comprising five cement manufacturing plants and one packing manufacturing plant. The Tac Cau industrial zone is based on the existing Tac Cau port seafood processing cluster and clearly has a viable economic future and should be defendable against foreseeable climate change effects for the life of the existing assets. However, to date the five new other industrial zones in Kien Giang province are currently occupied by only 6 new factories, 2 of which are waste fish processing plants.
The new Thuan Yien industrial zone is an example of a new industrial zone being established remote from the population centres that would be needed to provide the necessary workforce for any new

Climate Change Impact and Adaptation Study in Mekong Delta – Part A
101 | P a g e
factories. It would seem that the Thuan Yien industrial zone may have been chosen more for its lack of prior residents to resettle, than for its proximity to a suitable workforce.
Figure 70 - New Thuan Yien Industrial Zone near Ha Tien. Source: Frank Pool.
Two economic zones have been designated. The Ha Tien boundary economic zone on the Cambodian border has been established and was envisaged to be used for machinery and tourist products but is not currently occupied with any factories or economic activities (see photo as below). Hard fill has been spread on the site, but there had been no factories or buildings yet constructed at the time of the field mission in April 2011 in spite of the considerable border traffic and goods being imported and exported, mostly on spectacularly overloaded motorcycles from Cambodia. With no fixed assets, there is no exposure to climate change effects.
The Phu Quoc economic zone is envisaged for the tourist industry and would build on the strong existing and highly attractive tourism base in Phu Quoc. The growth in the Phu Quoc tourism sector would utilise the new 3000 m long runway passenger jet plane focused airport runway and major new trans-island roads that are currently under construction, as well as the planned 110 kV submarine power connection with the mainland.
5.5.1 Construction Materials Manufacturing The second largest sector in Kien Giang province is construction materials manufacturing, which accounted for just under 40% of industrial output in 2010, primarily from the two large and three small cement plants in Kien Luong district - that supply most of the cement used in southern Vietnam. There is also a machinery sector of around 6% of industrial value, and a apparel (clothing) manufacturing sector that in 2010 accounted for just fewer than 3% of the industrial sector value. There are ambitious plans to double the economic contribution of the industrial sector by 2015 compared to 2010, with a further 65 % increase by 2020 envisaged compared with 2015. However, it is not clear what the source of inputs for this envisaged industrial growth is, and in the absence of major new industrial processing inputs it would seem that such ambitious industrial sector growth plans are highly optimistic.
The Ha Tien #2 Cement Plant in Kien Luong town is a 68% Vietnam government and 32% private investor owned listed joint stock company established in 1961 with a $44 million (VND880 Billion) capital base. The existing 3000 tpd (tons per day) clinker output dry process plant uses a 1970’s technology planetary kiln that is one of the last in operation in the world . The plant is currently (2011) being upgraded in a $150 million (VND3065 Billion) expansion and modernisation project using German technology, including a 3-stage waste heat recovery 2 MW power generation unit to meet around 10% of plant internal electrical loads. A 3 MW waste heat power generation plant has apparently been in use at Ha Tien #2 cement plant since 2001 , but it appears that it is no longer in use. The Hà Tiên 2 cement plant has three diesel generators each of 2.5 MW capacity, that are now used for backup power as the plant is now connected to the grid.

Climate Change Impact and Adaptation Study in Mekong Delta – Part A
102 | P a g e
Once modernized, the Ha Tien #2 plant will produce 4000 tpd of clinker and sell 2500 tpd of cement (a similar cement production rate as the existing plant) and will also apparently sell clinker to the three smaller nearby cement plants as well as to Cambodia. The Ha Tien #2 cement plant is based on a 35 year remaining lifetime limestone reserve at its adjacent quarries and also uses clay from an adjacent clay pit. The plant uses 240,000 tons a year of coal imported from Quay Ninh province in the north of Vietnam. The plant’s site is connected directly to the sea though a waterway, the plant is around 1.5 m ASL and its cement and clinker production is exported by ship from the adjacent jetty. The ships supplying coal and exporting cement and clinker are apparently restricted to 1000 tons given the shallow draft of the plant’s port and for the channel connecting the port with the sea. Total capital value of Ha Tien #2 plant after modernisation = $194 million
Figure 71 - Existing Ha Tien #2 Cement Plant and Waste Heat Recovery Power Generation Facility. Source: Frank Pool.
The Holcim (until 2002 Morning Star Cement) plant in Hon Chong, Kiên Lương was established in 1998 (with a US$30 million IFC loan) and had a 4400 tons/day capacity , and had an initial capacity of 1.4 to 1.7 million tons a year of cement (depending on sources). The plant is a joint venture between the Swiss Holcim group (65%), and the Ha Tien I Cement Company (35%) The cement plant utilizes three nearby limestone mountains and is apparently a reasonably modern dry process plant. The plant used 60,000 tons of rice husks as fuel in 2009, as well as using waste plastics and waste footwear as thermal fuel. The Holcim Hon Chong cement plant has 6 diesel generators, each of 5.5MW capacity for a total of 33MW. From its inception in 1998 until 2006, the Holcim plant used its own diesel generators to meet its electricity needs. Since 2006, the Holcim plant has been connected to the national grid through its own 110 kV substation.
Funding of US$18 million has been approved for a 6.3MW waste heat recovery power generation plant with potential associated CDM benefits. The installed capacity of the Hon Chong cement manufacturing plant in 2010 was 4,500 tons of clinker per day. Est. total capital value = $100 million.
The major Kien Luong cement plants are the largest single energy and industrial sector assets in Kien Giang province. The Ha Tien #2 and Holcim cement plants will certainly continue to operate for the next 35 years as the remaining limestone reserves at their adjacent quarries is fully utilized. The plants will presumably be the subject of another mid-life upgrade in their 35 year remaining limestone reserve lifetimes, and then the opportunity could be taken to move it to higher ground or raise the elevation of key items of plant if sea level rise was seen as a major risk. Alternatively the existing plant sites could be defended with technically straightforward and cost-effective dykes and pumps as required.

Climate Change Impact and Adaptation Study in Mekong Delta – Part A
103 | P a g e
Figure 72 - Holcim Hon Chong cement plant. Source: Michael Russell.
There is also a coal fired tunnel kiln brick making plant and associated 14 m deep 50 ha clay mine (with 50 years clay supply capacity) located in Block 4, Xa Ngach, Kien Luong Town . The tunnel kiln and associate brick making equipment comes from South Korea. The plant supplies 5-10% of the brick demand in the South-West of Vietnam. The publicly listed Kien Giang Brick Tile JSC plant was established in 2002 with a capital base of 36 billion VND ($1.7 million), revenue of VND 30 Billion/year ($1.5 million), has 126 employees, is located 2.5 m ASL, already uses pumps in the wet season for its clay mine, but in any case should be able to be cost-effectively and readily be defended by a dyke and pumps if required. Capital value = $1.7 million
5.5.2 Seafood Processing The second largest capital value industries in Kien Giang province are (in descending order) wild fish processing, fish meal production, and shrimp processing - with a total of around 35 plants. Most of the Ken Giang seafood processing industry is based at Tac Cau port, located 20 km SE of Rach Gia). The Tac Cau seafood processing area has recently been designated as a formal industrial zone, with associated incentives for new investments. The Tac Cau Industrial Zone, at Vinh Phu Hoa commune, Chau Thanh district, stands out as a very positive example of a formal industrial zone being based around an existing cluster of related activities (utilising local (fish and shrimp) resources) and where Kien Giang province has a clear natural competitive advantage. The Tac Cau industrial zone is located on a waterway with the land being only a limited height above water level (AWL). However, the Tac Cau industrial zone is compact enough at 64.5 ha that it should be possible to protect it with a dyke and pump system if required. It would be useful if a more specific study of climate change risks and adaptation options was to be undertaken for the Tac Cau industrial zone. There is also a cluster of six modern and prosperous looking fish meal production plants at another site in Chau Thanh District (10 total in Kien Giang Province) located about 80 cm – 150 cm AWL, and possibly defendable with dykes and pumps if required. For the Tac Cau seafood processing and nearby fish meal plants, the site areas are small enough to defend if required.
There is also a major fermented fish sauce industry on Phu Quoc Island where there are around 150 small scale plants using small fish and in particular anchovies. The fish sauce plant that was visited was only about 1 m above sea level and located next to a wharf in the harbour of the main town of Duong Dong. However, due to the relatively low fixed infrastructure investment of the fish sauce plants (as below) , they are not assessed as being very vulnerable to climate change impacts, and in any case there is ample nearby higher elevation land that the plants could readily relocate to if required.
It is estimated that the fish (wet fish and fish meal) and shrimp processing industries employ around 5,000 people in Kien Giang province.
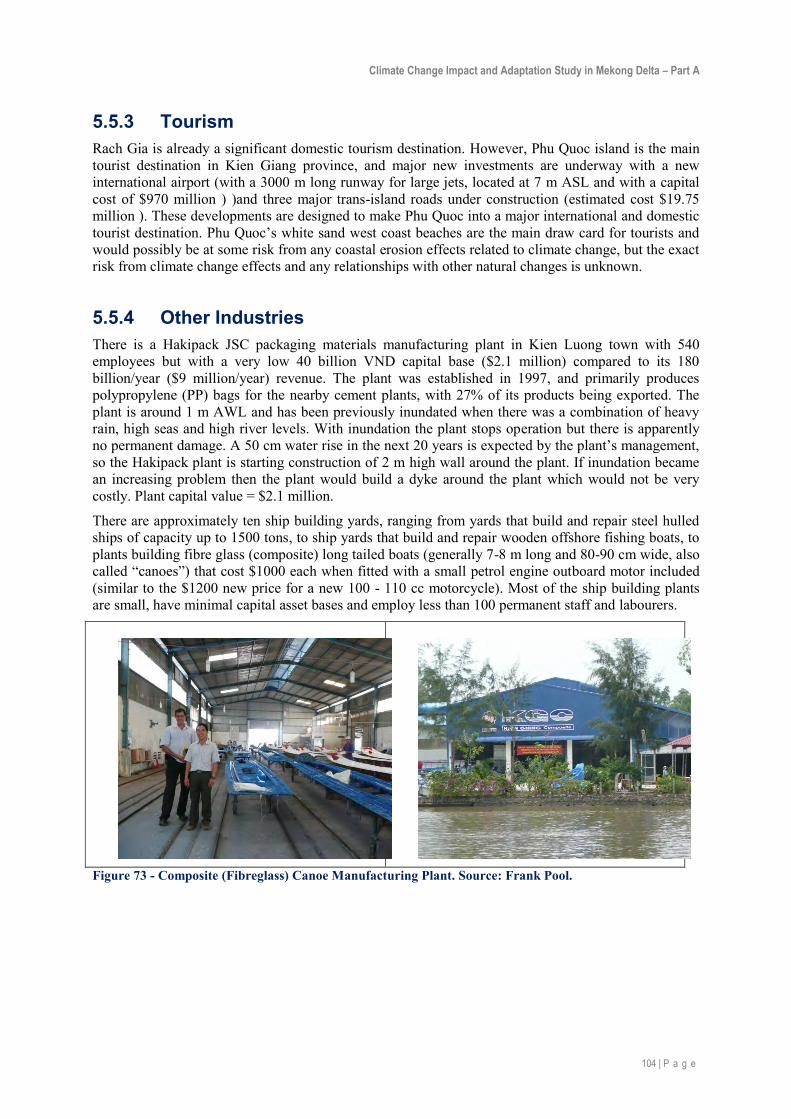
Climate Change Impact and Adaptation Study in Mekong Delta – Part A
104 | P a g e
5.5.3 Tourism Rach Gia is already a significant domestic tourism destination. However, Phu Quoc island is the main tourist destination in Kien Giang province, and major new investments are underway with a new international airport (with a 3000 m long runway for large jets, located at 7 m ASL and with a capital cost of $970 million ) )and three major trans-island roads under construction (estimated cost $19.75 million ). These developments are designed to make Phu Quoc into a major international and domestic tourist destination. Phu Quoc’s white sand west coast beaches are the main draw card for tourists and would possibly be at some risk from any coastal erosion effects related to climate change, but the exact risk from climate change effects and any relationships with other natural changes is unknown.
5.5.4 Other Industries There is a Hakipack JSC packaging materials manufacturing plant in Kien Luong town with 540 employees but with a very low 40 billion VND capital base ($2.1 million) compared to its 180 billion/year ($9 million/year) revenue. The plant was established in 1997, and primarily produces polypropylene (PP) bags for the nearby cement plants, with 27% of its products being exported. The plant is around 1 m AWL and has been previously inundated when there was a combination of heavy rain, high seas and high river levels. With inundation the plant stops operation but there is apparently no permanent damage. A 50 cm water rise in the next 20 years is expected by the plant’s management, so the Hakipack plant is starting construction of 2 m high wall around the plant. If inundation became an increasing problem then the plant would build a dyke around the plant which would not be very costly. Plant capital value = $2.1 million.
There are approximately ten ship building yards, ranging from yards that build and repair steel hulled ships of capacity up to 1500 tons, to ship yards that build and repair wooden offshore fishing boats, to plants building fibre glass (composite) long tailed boats (generally 7-8 m long and 80-90 cm wide, also called “canoes”) that cost $1000 each when fitted with a small petrol engine outboard motor included (similar to the $1200 new price for a new 100 - 110 cc motorcycle). Most of the ship building plants are small, have minimal capital asset bases and employ less than 100 permanent staff and labourers.
Figure 73 - Composite (Fibreglass) Canoe Manufacturing Plant. Source: Frank Pool.

Climate Change Impact and Adaptation Study in Mekong Delta – Part A
105 | P a g e
Figure 74 - Wooden Offshore Fishing Boat Building Yard Showing Informal Infrastructure Utilized. Source: Frank Pool.
At Hamlet 5, Long Thanh village, Giong Rieng District there is the Kien Giang Sugar JSC’s maximum 900 tpd (tons per day of sugar cane) small-medium size sugar cane processing plant established by the provincial government in 1997 and rebuilt over the 2 years to 2008. The plant processes 600 tpd of sugar cane, which is 60% sourced from Kien Giang province and 40% imported from other provinces. The site area is 5 ha and the plant occupies 3 ha. The Australian technology plant has a 2 MW Japanese steam turbine operating at a low 3500C turbine inlet temperature (using steam from an Indian boiler) to reduce costs and designed (as is the case for most sugar cane bagasse fired boilers) to essentially incinerate the bagasse waste produced and to just supply internal plant electrical loads, rather than to optimise electricity generation for export to the power grid. There would be probably at least 2MW (and probably more) of 6 months/year power export potential if a competitive power export tariff and predictable and simple grid interconnection arrangements were available.
Figure 75 - Giong Rieng District Sugar Cane Processing Plant and Steam Turbine. Source: Frank Pool.

Climate Change Impact and Adaptation Study in Mekong Delta – Part A
106 | P a g e
The sugar cane processing plant site is about 1.5 m above water level on a river that is not tidal, the river is only saline for 1 month a year. The site has never flooded, so the exposure to climate change impacts is judged to be minimal, as is its vulnerability. The plant could be protected with a dyke and pumps if required. Revenue of VND144 Billion/year (US$7M) gives the plant a 17.5 month capital payback from its revenue. Capital base = VND210 Billion (USD11 million).
A wide range of other mainly service industries operate in the province, such as furniture making and construction, but most individual businesses are small and have low fixed assets (primarily in minimal asset value buildings), with most of their capital assets being in machinery which is either old, portable or movable, and would have a liquid remaining asset value. The main climate change impact on such businesses would be on the value and availability of any replacement land compromised by climate change effects, not on any climate change effects on buildings, plant or machinery.
As is the case in Ca Mau province, a large industry subsector in Kien Giang province seems to be ice making. For reference, the largest ice making plant in Giong Rieng District provides ice to the households and restaurants for a population of around 100,000 people (the plant serves around 50% of the 200,000 population of the Kien Giang district). An estimated around 75% of the plant capital value would be in its chillers and water treatment plant (which could be relocated as required), the remaining 25% would be in low value simple cooling towers, ice making pond, lightweight buildings. The plant is 25 years old, has only four employees beyond family members, and is expected to close when the owner retires as his one son is not interested in continuing in the family business. The plant could be protected by a dyke or the factory floor level could be raised, occasional inundation would probably mainly affect the plant from lost production rather than from major damage costs, but the main current business issue facing the plant is the around 20 power cuts of around half a day each in the dry season. There are also expected to be the equivalent of 40 ice making plants in Kien Giang province making ice to service the shrimp and fish industries with ice to keep catches fresh when being transported to processing plants or to markets, A typical ice making plant would have only limited capital per plant, and a plant economic life around 20 years. For an estimated 200 Kien Giang province ice making plants this would give an estimated total capital investment of $24M
5.6 Energy Kien Giang province has a modern and extensive power distribution system. Medium (22/12.7 kV) and low voltage (380/220 V) poles mostly date from 1997 and later, and apparently have a 10 year design life, but they should last longer in practice as it seems that few poles dating back to 1997 have yet been replaced. The high voltage 110 kV (and some old 35 kV) and the medium voltage 22/12.7 kV provincial distribution system towers/poles and transformers should have a 30 year economic life. The power distribution system is generally technically reliable. The total number of poles in the province is probably around 100,000. Estimated total capital investment of $35M.
The major transmission components of the province are illustrated in Figure 76. Kien Giang province is connected by high voltage 110 kV inter province high voltage systems, and to the 220 kV national backbone power grid to the rest of Vietnam. Kien Giang province is supplied by the 220 kV Rach Gia 2 substation including 220/110 kV – 250 MVA and 125 MVA transformers, supplying all 110 kV substations in Kien Giang and some in An Giang and Hau Giang provinces as well. The 220 kV Rach Gia 2 substation is connected to Tra Nóc – Rach Gia 2 (one electric circuit), Cà Mau power plant (2 routes, three circuits) and 220 kV Thốt Nốt substation.
There is also a 220 kV Rach Gia 2 – Kien Lương 2 line that is being used as a 110 kV line until 2011 when the 220 kV Kien Lương substation is expected to be completed. The length of 220 kV lines in Kien Giang province is not detailed separately from the total length of the lines in other provinces. All 220 kV towers are steel. There are 180 km of 110 kV lines in Kien Giang province. All 110 kV towers are steel on concrete bases. There are ambitious plans for extensive new 220/110 kV high voltage lines, as well as a twin 120 km very high voltage 500 kV line from Kien Loung to Thốt Nốt for the proposed new Kien Luong coal fired power complex.

Climate Change Impact and Adaptation Study in Mekong Delta – Part A
107 | P a g e
Figure 76 - Transmission Lines in Kien Giang.
In Kien Giang province there are 3,254.2 km of 22/12.7 kV medium voltage power lines comprising 1,553 km of 3 phase lines and 1,701.2 km of single phase lines. New medium voltage lines are mostly 12.7 kV single phase lines as they provide enough electricity capacity to meet household uses. There are also 151.2 km of 15 kV medium voltage lines used on Phú Quốc Island. There is one 37 km long 35 kV line from An Bien supplying electricity to the 6.3MVA 35/22 kV Vĩnh Thuận substation. The other previous 32 km of 35 kV lines have been transferred to 22 kV. All medium voltage towers are concrete. There is a total length of low voltage lines of 5,495.8 km, all using concrete poles.

Climate Change Impact and Adaptation Study in Mekong Delta – Part A
108 | P a g e
There are around 20 power outages, each of half to full day duration, in the dry season each year when the national EVN grid runs out of generating capacity from its hydro power stations in central and northern Vietnam. Many industries therefore have back-up diesel generators.
As well as Phu Quoc Island, nine small islands have their own diesel generator powered stand-alone electricity grids funded by Kien Giang province. Since July 2004, Phu Quoc Island’s electricity supply has been provided by the new Phu Quoc diesel power plant. This plant is managed by the Kien Giang EVN, and is located 5 km from (the main Duong Dong town on Phu Quoc. The Phu Quoc power plant and associated power system details and future expansion plans are included in the separate Phu Quoc Power System Annex D. All small diesel generators in Kien Hai district are controlled by Kien Hai management unit; others in Phu Quoc district are controlled by each commune. The tariffs charged vary but they are all cross-subsidised with eh rest of Kien Giang province to keep the tariffs at a more affordable level.
5.6.1 Future Plans The major Kien Luong Power Plant is planned to be built by the private Tan Tao Group (ITACO), aiming for a total capacity of over 4000 MW, total cost of around $7 Billion, officially aiming for the first 1.440MW to be in operation by 2015. The proposed power project would be the first major private power plant development in Vietnam to be financed, constructed and operated as a BOO (Build Own Operate) project. The first Phase is variously described as 2*600MW or 2*720MW units with a cost of US$2.5 - $3 Billion, including a new Nam Du archipelago deep-sea port complex on Hon Lon Island for imported coal on 70,000 - 150,000 DWT ships to be trans-shipped onto 5,000 to 10,000 DWT ships for transport to the proposed power plant . The project is apparently mentioned in Power Master Plan IV. It is claimed that nearly $100 Million has been spent on 88 ha of reclamation to a height of 3.27 m in a 3 to 13 m depth sea site for the power plant, with 6.5 - 8 km of reinforced concrete 28-44 m sheet piles to form a breakwater being claimed, although a visit to part of the site did not reveal any sheet piles at the area visited.
When the proposed Kien Luong power plant site was being visited, the fill being used on the offshore site clearly came from a borrow pit just inland from the site and not from an inland quarry as was claimed. The composition and dumping of the fill also seemed to be remarkably haphazard for a proposed major power plant site. The total power plant design capacity is apparently 4400MW over three phases, for a total cost of US$7 Billion, coal use apparently would eventually be 10 million tons/year and would come from one or more of Australia / Indonesia / Russia . ITACO claims to have a loan with Standard Chartered Bank of $1.6-1.8 billion and claims to have the loan guaranteed by the
Figure 77 - Proposed Kien Luong Power Plant Site. Source: Frank Pool.

Climate Change Impact and Adaptation Study in Mekong Delta – Part A
109 | P a g e
Vietnamese Government. ITACO apparently aims to fund 20% ($500 Million) of the project itself, which seems remarkably ambitious as ITACO’s 2009 revenue was only $60 million and its profit was claimed to be $21 million.
The Kien Luong Power Plant project is clearly highly ambitious as it would be extremely highly leveraged and also ITACO has no experience in successfully developing large thermal power plants, nor has any such plant yet been developed under the BOO (Build Own Operate) modality in Vietnam to date. The project appears to have faced considerable implementation difficulties to date, its support from provincial authorities appears uncertain at best, and its current status is at best problematic.
A World Bank loan has been approved for a new 48 km submarine cable connection to Phu Quoc.
A new electrical spur line from the main EVN provincial substation connection at 110 kV to Ha Tien is apparently planned to be built with EVN’s own funds. The new 110 kV line to Ha Tien will decrease the losses of the current 22 kV coastal line that currently provides power to Ha Tien. The new 110 kV line will also provide the connection and extra electricity capacity for the ambitious industrial and economic zones planned for the Ha Tien area to 2020, and then it is planned to be upgraded to 220 kV as required. The new 110 kV line will also provide the power for the upcoming planned Phu Quoc undersea submarine cable connection.
The 110 kV inter-provincial and provincial feeder lines are apparently planned to be increased to 220 kV if and when loads increase sufficiently to justify such upgrades. The 110 kV submarine cable to Phu Quoc is apparently designed to be upgraded to 220 kV if the loads on Phu Quoc increase beyond the design 10MVA capacity at the current design 110 kV line (noting that Phu Quoc is currently provided with electricity from a 12MW diesel power station).
One 10MW grid connected rice husk fuelled power plant is included in tentative future plans but there has apparently been little detailed investigation or design work undertaken to date. The rice production in Kien Giang province would be sufficient to support three such power plants.
Kien Giang province is clearly a province with major additional shrimp growing potential area, in spite of official attempts to maintain a certain percentage of the province in rice production. An ongoing shift to aquaculture would lead to a consequential shift from single phase 12.7 kV to 3 phase 22 kV lines (currently in nearly equal proportions) as single phase lines provide enough electricity capacity for domestic demand but not enough for manufacturing, aquaculture and agriculture uses.
Fish processing of coastal and sea caught fish is already a major industry in Kien Giang province, although there are some questions around the sustainability of some of the seafood catches, such as shrimp. One of the largest processing plants in Tac Cau (the main seafood fishing cluster area and now being established as a formal industrial zone) was visited and it was found that its main export was uncooked pressed frozen 10 and 20 kg blocks of raw fish (surimi) that is exported to the USA, Europe, Korea and Taiwan where it is processed into fish balls and crab sticks. There is thus the potential for further processing to take place at plants in Tac Cau and for higher value finished products to be exported instead of simple relatively low value raw frozen bulk blocks of fish.

Climate Change Impact and Adaptation Study in Mekong Delta – Part A
110 | P a g e
5.7 Transport Unlike Ca Mau, transport of goods throughout Kien Giang is mostly by road except agricultural products (it has the largest rice growing area in the country) and construction materials which use the Cai Lon river south of Rach Gia and the canal from Rach Gia to Ha Tien (originally constructed in the 1930’s to carry fresh water to Ha Tien). Water transport is also a key means of access through channels into rural areas where there are few roads (there are 83,000 inland boats of all types). As in Ca Mau there is increasing salinity of surface water: only east of the SCC/NR 80 is there still guaranteed fresh water. The NRs 80 and 63 are the main routes along the coast serving all the main urban centres: the other main route is NR 61 which links eastwards to Can Tho.
There is one main inland port at Tac Cau south of Rach Gia for 500 – 1000 tons boats. Marine fish landed in the Province is taken to Tac Cau as it has an industrial zone for fish processing. Much is also sent onwards from there to Can Tho and HCMC inside polystyrene containers on refrigerated lorries. The cheaper catch is sold locally. Rach Gia itself is only used for ferries. The lack of a mainland deep water port has been noted as a key factor restricting the Province’s growth, despite its key location on the border with Cambodia.
The province has a more mixed economy than Ca Mau with tourism and cement production (in northern areas) being key main differences. The former takes several forms, from international and domestic visitors to Phu Quoc, border/historical tourism at Ha Tien; and weekend trips for domestic tourists to Rach Gia for relaxation.
Figure 79 - Fish being packaged for export and ready for local markets: Tac Cau port. Source: Ian Hamilton.
Figure 78 - The major canal systems of Northern Kien Giang. Source: Vietnam Inland Waterways

Climate Change Impact and Adaptation Study in Mekong Delta – Part A
111 | P a g e
5.7.1 Roads and Ports The domestic airports at Phu Quoc and Rach Gia play an important role in supporting the Province’s development: there are daily flights linking both to HCMC with Rach Gia often being used as a convenient weekend stopover. The Phu Quoc airport has one 2,100 x 30 m runway and is able to handle 200,000 passengers per year. At Rach Gia the runway is 1,500 x 30 m with a capacity of 80,000 passengers. The airport at Ha Tien is currently closed with no plans for it to reopen.
Ferries also cement the relationships between the big 3 centres with both fast passenger ferries and slower vehicle ferries. The crossing from Ha Tien to Phu Quoc takes one hour by fast boat or 3 hours using the vehicle ferry. The longer crossing from Rach Gia to Phu Quoc takes around 3 hours by fast boat. Water transport is also a key unofficial travel mode between smaller urban centres
The current elevation codes of roads are based on flooding records for the past 5 years and are collected every year. Actual designs of new/improved roads are based on flood records and local conditions. National Roads are designed for 1 in 100 year floods and Provincial Roads for 1 in 50 year floods. Road details for the strategic National and Provincial highways are contained in the next chapter.
5.8 Urban Settlements There are three major population centres within the 15 Districts of Kien Giang province, Error! eference source not found.. The centres are; the cities of Rach Gia (on the coast in the centre of the Province); Ha Tien (at the northern tip on the border with Cambodia); and the island of Phu Quoc, which from an urban classification point of view consists of several small towns (capital is the town of Duong Dong) and villages.
Table 36 - Current Urban Population of Kien Giang (2010).
No. Centre Urban Population
Area (km2)
Density (pp/km2)
Class
1 Rach Gia City 226,963 103.6 2,190.76 II 2 Ha Tien City 45,810 82.4 555.95 IV 3 Phu Quoc Island 93,654 589.2 158.95 IV 4 – 15 All other centres < 15,000 V
Source: Provincial Development Report 2010.
5.8.1 Urban Utilities
5.8.1.1 Urban Water Supply Kien Giang Water Supply and Sanitation Company (KGWSS) supplies Rach Gia, Ha Tien, Phu Quoc and 8 other Districts with potable water. For the whole of the province production is 60,000 m3/day. The subsidised cost to users is VND 4,850/m3 and resulting revenue is almost VND 100 billion/year.
Figure 80 - Phu Quoc water transport. Source: Ian Hamilton.

Climate Change Impact and Adaptation Study in Mekong Delta – Part A
112 | P a g e
Rach Gia City
Officially there is only 85% coverage as some large outlying rural areas are classed as urban. The production of 34,000 m3/day is from surface water with a small amount of groundwater as backup. Current capacity is between 34 – 40,000 m3/day. Groundwater can be salty at 7-800 mg/litre and can reach 1,000 mg/litre in the dry season. Iron is present in the water but no arsenic has been reported.
The surface water source experiences saline intrusion from March – May. It can extend 30 km upstream in the dry season whereas the intake is only 5 km from the sea. The problem becomes worse every year. As a solution there are 2 reservoirs to store water in the dry season. The largest is concrete lined (500,000 m3) which cost VND 20 billion to construct. It can hold a supply for 10 days (another 2 days at smaller reservoir).
Maximum use has been the full 12 days in a row. It takes one week to fill the reservoirs pumping from the canal. There are tube wells in the city as a backup in the dry season.
A smaller reservoir is next to the WTP (60,000 m3 built with ADB money). Treatment is iron removal, filter, and chlorination. Output is potable but may be contaminated later in the network.
Ha Tien City
The current plant was built through Australian ODA. Phase 1 is complete and produces 8,000 m3/day. Development has now started to double output. It serves 100% of Ha Tien households and part (commercial) of Kien Luong District and Giang Thanh. The company is aware of expansion plans for a power plant and industry in Kien Luong District. Water supply is from the reservoir served by surface water on District Road 91 east of the town. There is a WTP on the coast downstream of the reservoir. No salinity issue so far.
Phu Quoc
One plant produces 5,000 m3/day. Water supply to the main town of Duong Dong is from a large lake in the centre of the island. The rest of the island uses a mixture of ground and surface water.
5.8.2 Urban Drainage, Sewage Disposal and Solid Waste Rach Gia City
Drainage: Flooding problems are only experienced in the city at high tide and with continuous rain for 3 – 5 hours. Observation shows roadside drainage is ineffective (blocked and insufficient gradient) in new urban expansion areas to the south. A sea wall (RC) of EC plus 70 cm (2.4 m) already exists in Rach Gia. It currently runs to the Nam Nho restaurant in the southern expansion area. DoT believes that it will be unviable to raise the level of all buildings and roads above expected flood levels and logistically difficult. It prefers to rely on the current/improved dyke for future protection.
Sewage Disposal: Some 70% of urban households use septic tanks based on a long established rule when building dating back to 1990’s. They are mostly in backyards: and cleaned every 5 – 7 years by a semi-government company. Older urban areas mostly don't have such facilities.
Solid Waste: There is a landfill area. The total site area is 20 ha of which 10 ha each is for bio-digester and landfill. Dumping is layered. Each layer is sprayed with chemicals and the finished hole covered with soil.
Figure 81 - Treatment Plant & small reservoir, Rach Gia. Source: Ian Hamilton

Climate Change Impact and Adaptation Study in Mekong Delta – Part A
113 | P a g e
Ha Tien City
Solid Waste: There is a solid waste plant north of town which was built using Australian technology and funds. It started operation in 2008 and has a design capacity of 200/tons/day but currently only receives 30 – 40 tons/day. It is expected to last for 20 years. It has leachate processing and disposal. All ponds are lined and sealed.
Sewage Disposal: Septic tanks are used for most households.
Drainage: There is a natural tidal lake behind the town. Authorities are currently building a dyke around lake to a height of 1.6 m. There is no provision for sea-level rise along coast in the current draft master plan. But authorities are planning a feasibility study for a dyke.
Phu Quoc
There is a pilot sewage treatment scheme in town using Korean technology. No details were available although officials interviewed thought it was inefficient. Most use septic tanks. There is one solid waste dump site.
Other Centres
There is some annual flooding in Hon Dat, Tan Hiep, Kien Luong and An Bien. It can reach 1.25 metres and lasts 3 – 4 months (September to November). The cause is river over-topping from heavy flows upstream in the Mekong. Some flooding is experienced in low-lying areas and during high tides for short periods. Essentially all areas to the west of the NR 80 (and future SCC) flood during the wet season.
Figure 82 - Leachate ponds Ha Tien. Source: Ian Hamilton

Climate Change Impact and Adaptation Study in Mekong Delta – Part A
114 | P a g e
6. Effects on Natural Systems As discussed in the previous sections, climate change and sea level rise are expected to have significant and widespread impacts on Kien Giang and Ca Mau, affecting both natural and human systems. There is evidence that the impacts of increased sea level are already being felt in both provinces, and our projections indicate that both provinces will become increasingly vulnerable to the effects of climate change.
The most substantial impacts of climate change (with regional and localised differences) on Kien Giang and Ca Mau are expected to be:
Sea level rise, resulting in higher flood risk, salt water intrusion, increased salinity and coastal erosion;
Changes in hydrology resulting in changes in length and intensity of the rainy season, which may result in more severe floods;
Changes to the frequency and intensity of extreme weather events, such as large storms and typhoons, leading to losses of infrastructure and land resulting from inundation, wind, storm surge and shoreline erosion; and
Changes in coastal sedimentation and erosion patterns.
Climate change could also have a range of indirect effects on the natural systems, and exacerbate pre-existing human induced problems such as environmental pollution and over exploitation of potable water resources.
6.1 The Effects of Sea Level Rise The National Meteorology and Hydrology Centre (IMHEN) projects a sea level rise for Vietnam of 15 cm by 2030, 30 cm by 2050, 50 cm by 2070, and 100 cm by 2100 under high emissions scenarios. The low-end scenarios project a rise of 28 cm by 2050 and 65 cm by 2100 (MONRE 2009), although the high-end estimate of 100 cm or more cannot be ruled out.
Our assessment found that a 15 cm or 30 cm sea level rise would not result in an appreciable increase in land area that would be “permanently inundated” primarily as a result of the protection afforded by the current system of sea-dykes and flood protection infrastructure.
The current height of the sea-dyke system is around 1.2 meters, and so even at 2050 where projections are for a sea level rise of 30 cm, only the current low lying coastal wetland areas and river estuaries that are not protected by sluices will see a marked change in the area inundated. The exception is Ngoc Hien in Ca Mau province – which is already affected by inundation in periods of high seasonal tides.
The most important effects of sea level rise relate to the corresponding changes in flooding and drainage, its relative effect on salinity and importance for low lying areas in terms of enhancing coastal erosion, proneness to inundation and increases storm surge/storm tide vulnerability. These aspects are discussed in detail below.
6.2 The Effects of Flooding and Inundation The Mekong Delta divides into two distributaries from its apex at Phnom Penh in Cambodia: the Mekong (Tien) and the Bassac (Hau Giang). Further downstream these channels sub-divide into nine channels, the Nine-Headed Dragon or Cuu Long River. Kien Giang and Ca Mau are both located on the south coast, and are connected to the Bassac through an extensive system of canals.

Climate Change Impact and Adaptation Study in Mekong Delta – Part A
115 | P a g e
Studies of the last 45 years of Mekong flow data show no systematic changes in the hydrological regime of the lower Mekong. The flow of the lower Mekong is regulated by Cambodia’s Great Lake, Ton Le Sap, in the upper delta. The lake acts as flood storage in the wet season until early October and a supply reservoir in the dry season. Figure 83 illustrates the historical extent of river base flooding from the Mekong Mainstream and the areas in Kien Giang inundated as a result.
The mean annual flow volume of the Mekong River amounts to approximately 475,000 million m3. In 2005 a flood volume of 500,000 million m3 caused inundation of nearly 50% of the delta. With a storage capacity of approximately 60,000 million m3, Ton Le Sap is a crucial source of water supply to the delta in the dry season.
In a recent Mekong River Commission (MRC) study, the increased flow in the Mekong River will increase water availability in the dry season and increase the risk of flooding in the wet season. The wet season flow in the lower Mekong is projected to increase about 12%, and the percentage increase in flow for the dry season is around 15% in the Delta region (IMHEN, 2011). However upstream of the delta, dams have been built or are planned to be built in the future on the mainstream in China and in the tributaries in lower basin, and it is highly likely that these storages will influence the peak and base flow regime in the lower Mekong mainstream to some degree.
Moderate ‘annual’ floods are a common occurrence on the Delta, with most provinces experiencing small scale and mostly localised flooding on a seasonal basis. However the Delta also experiences extreme mainstream flood events which can be destructive and cause widespread damage to housing, agriculture and aquaculture. Large scale floods were recorded in 1961, 1966, 1978, 1984, 1991, 1995, 1996, (CCFSC 1999) and 2000 and 2011. The 2000 floods damaged nearly half a million ha of agricultural and 16,000 ha of aquaculture land (ADB 2007).
Figure 83 - Historical map of ‘annual flooding’ in the pattern in the lower Mekong basin. Source: Unknown.
The most recent IMHEN projections for the end of the 21st century under both A2 and B2 emissions scenarios are that:
Rainfall is projected to increase by about 3 to 10% in both Kien Giang and Ca Mau compared to the baseline;

Climate Change Impact and Adaptation Study in Mekong Delta – Part A
116 | P a g e
Rainfall will tend to increase in rainy months (by up to 25% by the end of the century) and decrease in dry months (can be from 30 to 35%).
In other words the dry seasons will get drier and rainfall in the rainy season will be more intense (i.e. larger volumes in shorter periods). This will exacerbate flooding and drought conditions.
Anecdotal evidence from local people surveyed in the study area suggests that there are two distinct ‘patterns of flooding’ experienced in the study area. Ca Mau currently experiences ‘localised flooding’, whereas Kien Giang is primarily affected by ‘river based flooding’ from the Mekong mainstream (Bassak River). Mainstream flooding is the most dangerous and destructive, and results when large water volumes water fall in the upper catchment and high tides back water up in the mainstream and larger canals, causing flooding and inundation in the surrounding floodplain as well as reducing the ability of local canals and paddy fields to drain.
Figure 84 - Flooding in Vam Ray, Hon Dat District October 2010. Courtesy M Russell.
Table 37 and Table 38 summarises the projected land area inundated during flooding for the Baseline, 2030 and 2050 time slices. With the projected increase in total annual precipitation, flood danger is expected to increase all the districts (except Phu Quoc and Kien Hai which are island districts) by 20 to 50% between now and 2030 and 2050 respectively.
Most of the Kien Giang is only just above sea level and extreme flooding events could have immense consequences for the entire province as it would disrupt agricultural production and livelihoods for an extended period. In twelve out of fourteen districts in Kien Giang, the threat of flooding is considered to be moderate to severe.
Extreme threat of flooding from an extreme event is lower in Ca Mau with only five out of nine districts where the vulnerability to flooding being considered as moderate to severe.
Districts experiencing the greatest increases in area inundated include:
An Minh – 55% increase;
Vinh Thuan – 53% increase;
Ca Mau – 51% increase; and
An Bien – 43% increase
It is also worth noting that the land area of Rach Gia district that is inundated is projected to increase by 11% by 2050.

Climate Change Impact and Adaptation Study in Mekong Delta – Part A
117 | P a g e
In the majority of the districts, flood protection is not adequate. Upgrading of flood safety is urgently needed for all the districts, especially for the major settlements and industrial areas. Flood protection upgrading is also needed along the Bassac River which is outside the study area but influences flooding in Kien Giang and to a lesser extent in Ca Mau.
Table 37 – Ca Mau district land area inundated during flooding (Baseline, 2030 and 2050).
District
Total Area
(ha)
Baseline SLR 15 cm (2030) SLR 30 cm (2050) %
Affected Area (ha)
% Affected
Area (ha)
% Affected
Area (ha)
Ca Mau 24,929 19% 4,840 52% 12,969 71% 17.579 Cai Nuoc 41,700 47% 19,572 70% 29,293 82% 34.078 Dam Doi 83,415 13% 10,617 28% 23,083 36% 30.144 Nam Can 50,789 36% 18,084 47% 23,691 58% 29.519 Ngoc Hien 73,517 22% 16,496 29% 21,457 39% 28.709 Phu Tan 46,433 36% 16,791 46% 21,177 62% 28.994 Thoi Binh 64,131 6% 4,164 19% 12,242 35% 22.322 Tran Van Thoi 70,942 42% 29,995 58% 40,952 79% 56.337 U Minh 77,462 9% 7,271 22% 17,185 42% 32.427
Table 38 – Kien Giang district land area inundated during flooding (Baseline, 2030 and 2050).
District
Total Area
(ha)
Baseline SLR 15 cm (2030) SLR 30 cm (2050) %
Affected Area (ha)
% Affected
Area (ha)
% Affected
Area (ha)
Rach Gia 10,364 70% 7,279 75% 7,724 81% 8.387 Ha Tien 9.952 64% 6,327 67% 6,693 70% 6.939 An Bien 40,029 38% 15,223 69% 27,681 81% 32.448 An Minh 59,050 9% 5,510 39% 22,884 64% 37.978 Chau Thanh 28,544 72% 20,655 82% 23,330 87% 24.691 Giang Thanh 41,284 98% 40,56 98% 40,383 99% 40.791 Giong Rieng 63,929 83% 53,155 89% 56,716 94% 60.030 Go Quao 43,951 61% 26,766 86% 37,696 92% 40.557 Hon Dat 103,863 96% 99,.862 97% 100,399 98% 102.021 Kien Hai 2,558 0% 0 0% 0 0% 0 Kien Luong 47,285 89% 41,867 89% 42.252 91% 43.200 Phu Quoc 58,891 0% 0 0% 0 0% 0 Tan Hiep 42,288 91% 38,630 92% 38.982 98% 41.449 U Minh Thuong 43,270 17% 7,169 34% 14.920 52% 22.711 Vinh Thuan 39,483 14% 5,560 45% 17.627 68% 26.676
Figure 85 to Figure 89 illustrate the increase in both the areas and depths of flooding in Ca Mau and Kien Giang during an extreme event (such as the baseline year 2000) for both A2 and B2 scenarios for 2030 and 2050.
The supplementary Atlas contains flooding and inundation maps for 2030 and 2050 for each district, illustrating the potential level of hazard at the local level.

Climate Change Impact and Adaptation Study in Mekong Delta – Part A
118 | P a g e
Figure 85 - Baseline Flooding Scenario for Kien Giang and Ca Mau provinces (IMHEN 2011)

Climate Change Impact and Adaptation Study in Mekong Delta – Part A
119 | P a g e
Figure 86 - Flooding Projections for 2030 (A2 and B2 Scenarios) for Kien Giang province (IMHEN 2011)

Climate Change Impact and Adaptation Study in Mekong Delta – Part A
120 | P a g e
Figure 87 - Flooding Projections for 2030 (A2 and B2 Scenarios) Ca Mau province (IMHEN 2011)

Climate Change Impact and Adaptation Study in Mekong Delta – Part A
121 | P a g e
Figure 88 - Flooding Projections for 2050 (A2 and B2 Scenarios) Kien Giang province (IMHEN 2011)

Climate Change Impact and Adaptation Study in Mekong Delta – Part A
122 | P a g e
Figure 89 - Flooding Projections for 2050 (A2 Scenario) for Ca Mau provinces (IMHEN 2011)

Climate Change Impact and Adaptation Study in Mekong Delta – Part A
123 | P a g e
6.3 The Effects of Drought Droughts are already a problem in the Mekong delta, and as mentioned previously with the changes in seasonality and the projection that the dry seasons will get drier, it is possible that the occurrence and duration of drought conditions will worsen.
During the survey, every district expressed their concerns that droughts were becoming more common and getting worse. The 1997–98 El Niño-related drought was one of the most widespread and worst droughts Vietnam has experienced, and resulted in increased salinity and forest fires in Kien Giang and Ca Mau, and the loss of 15,900 ha of winter crops (ADB 2007).
6.4 Effects of Salinity and Saline Intrusion Salinity and saline intrusion have been a problem in the Mekong delta for many years. In 1995, about 42% of the delta (1.7 million Ha) was affected by saline intrusion (SIWRMP, 1995), and saline intrusion now penetrates up to 60–70 km up the estuaries of the Delta. In the dry season, flow in the Mekong is insufficient to prevent saline intrusion and extensive salinisation of waterways in the lower delta. During a normal dry season, the maximum extent of salt water intrusion covers somewhere between 15,000 km2 and 20,000 km2.
Figure 90 highlights the distribution of coastal wetland systems in Kien Giang and Ca Mau prior to being drained and converted for agricultural use. The coastal mangrove and marsh systems would have been saline tidal and estuarine systems. These areas, whilst highly modified and protected from saline intrusion by a combination of sea dykes and sluice gates today, due to their inherent location and geomorphological features are predisposed to the effects of salinity and saline intrusion.
Figure 90 - Historical vegetation map illustrating the occurrence of coastal wetlands. Source: Unknown.
Table 39 and Table 40 summarise the findings from IMHEN modelling for the current and future extent of salinity in Ca Mau and Kien Giang over for both A2 and B2 scenarios for 2030 and 2050. Most notable is that all the districts in Ca Mau and the majority of districts in Kien Giang (with the exception of the island districts of Phu Quoc and Kien Hai) are already affected by salinity all year round.

Climate Change Impact and Adaptation Study in Mekong Delta – Part A
124 | P a g e
Table 39 – Ca Mau district land area affected by saline intrusion >4 ‰ (Baseline, 2030 and 2050).
District
Total Area (ha)
Current Salinity Salinity 2030 Salinity 2050 (15 cm SLR) (30 cm SLR)
% Affected
Area (ha)
% Affected
Area (ha)
% Affected
Area (ha)
Ca Mau 24,929 100% 24,929 100% 24,929 100% 24,929 Cai Nuoc 41,700 100% 41,700 100% 41,700 100% 41,700 Dam Doi 83,415 100% 83,415 100% 83,415 100% 83,415 Nam Can 50,789 100% 50,789 100% 50,789 100% 50,789 Ngoc Hien 73,517 100% 73,517 100% 73,517 100% 73,517 Phu Tan 46,433 100% 46,433 100% 46,433 100% 46,433 Thoi Binh 64,131 100% 64,131 100% 64,131 100% 64,131 Tran Van Thoi 70,942 100% 70,942 100% 70,942 100% 70,942 U Minh 77,462 100% 77,462 100% 77,462 100% 77,462
Table 40 – Kien Giang district land affected by salinity and saline intrusion (Baseline, 2030 and 2050).
District
Total Area (ha)
Current Salinity Salinity 2030 Salinity 2050 (15 cm SLR) (30 cm SLR)
% Affected
Area (ha)
% Affected
Area (ha)
% Affected
Area (ha)
Rach Gia 10,364 95% 9,846 100% 10,364 100% 10,364 Ha Tien 9,952 100% 9,952 100% 9,952 100% 9,952 An Bien 40,029 90% 36,026 100% 40,029 100% 40,029 An Minh 59,05 99% 58,460 100% 59,050 100% 59,050 Chau Thanh 28,544 100% 28,544 100% 28,544 100% 28,544 Giang Thanh 41,284 90% 37,156 100% 41,284 100% 41,284 Giong Rieng 63,929 25% 15,982 20% 12,786 20% 12,786 Go Quao 43,951 70% 30,766 80% 35,161 85% 37,358 Hon Dat 103,863 50% 51,932 20% 20,773 20% 20,773 Kien Hai 2,558 0% 0 0% 0 0% - Kien Luong 47,285 100% 47,285 75% 35,464 70% 33,100 Phu Quoc 58,891 0% 0 0% 0 0% - Tan Hiep 42,288 60% 25,373 20% 8,458 20% 8,458 U Minh Thuong 43,27 100% 43,270 100% 43,270 100% 43,270 Vinh Thuan 39,483 100% 39,483 100% 39,483 100% 39,483
Given the high level of exposure to salinity for both provinces, saline intrusion and high salinity issues are very likely to continue in the future through a combination of higher water extraction for domestic purpose and SLR, especially in conditions of drought and low river flow. Salinity is found to be highest in late April and early May with recorded values of salinity in the study area reaching as much as 29.4 g/l.
However, at the same time it should be recognised that saline intrusion into estuarine systems is closely linked to the discharge in the local rivers and canals, and increased surface flows and standing water in the landscape in some areas as a result of higher rainfall and changes in hydrology will lead to lower levels of salinity.
Salinity at the local level is mainly influenced by factors such as tidal movement, river discharge, river topography, hydraulic work and seasonal climate (and drought in particular) and all these aspects are expected to change in the future. While surface water is relatively abundant during the wet season, it drops significantly during the dry season and a number of areas will be adversely affected by salinity

Climate Change Impact and Adaptation Study in Mekong Delta – Part A
125 | P a g e
for two to three months – and some areas will see a net improvement in salinity levels as shown in Table 41.
Table 41 - Projected change in the area effected by saline intrusion >4 ‰ for 2030 and 2050 for districts in Kien Giang and Ca Mau
Ca Mau Kien Giang District % Change District % Change 2030 2050 Net 2030 2050 Net Ca Mau 0% 0% 0% Rach Gia 5% 0% 5% Cai Nuoc 0% 0% 0% Ha Tien 0% 0% 0% Dam Doi 0% 0% 0% An Bien 10% 0% 10% Nam Can 0% 0% 0% An Minh 1% 0% 1% Ngoc Hien 0% 0% 0% Chau Thanh 0% 0% 0% Phu Tan 0% 0% 0% Giang Thanh 10% 0% 10% Thoi Binh 0% 0% 0% Giong Rieng -5% 0% -5% Tran Van Thoi 0% 0% 0% Go Quao 10% 5% 15% U Minh 0% 0% 0% Hon Dat -30% 0% -30% Kien Hai N/A N/A N/A Kien Luong -25% -5% -30% Phu Quoc N/A N/A N/A Tan Hiep -40% 0% -40% U Minh Thuong 0% 0% 0% Vinh Thuan 0% 0% 0%
Figure 91 and Figure 92 show the current baseline and projected extent of salinity for both provinces for a range of dry season thresholds of 4 ppt (parts per thousand) for 15 and 30 cm sea level rise (corresponding to 2030 and 2050 timeframes).
From Table 41 above, IMHEN are projecting that for all the districts in the Ca Mau and for four districts in Kien Giang (i.e. Ha Tien, Chau Thanh, U Minh Thuong and Vinh Thuan) that there will be little appreciable change in salinity levels. This is primarily because they are already heavily salt affected. For the districts of Rach Gia, An Bien, An Minh, Giang Thanh and Go Quao IMHEN are projecting increases in salinity of between 1 and 15%, with Go Quao experiencing the greatest changes at 15%.
However, the districts of Giong Rieng, Hon Dat, Kien Luong and Tan Hiep are all expected to see a net reduction in salinity of between 5 and 40%.

Climate Change Impact and Adaptation Study in Mekong Delta – Part A
126 | P a g e
Figure 91 - Maximum Saline Intrusion baseline (in the dry season)

Climate Change Impact and Adaptation Study in Mekong Delta – Part A
127 | P a g e
Figure 92 - Saline Intrusion Maps (Current baseline, 2030 and 2050).

Climate Change Impact and Adaptation Study in Mekong Delta – Part A
128 | P a g e
6.5 Effects of Typhoons and Storm Surge A Typhoon (or tropical cyclone) is defined as a tropical depression of sufficient intensity to produce gale force winds, i.e. at least 63 km/h. This kind of event is not only dangerous because it produces destructive winds but also because it is associated with torrential rains (often leading to floods), storm surge and wild sea conditions.
Generally, sea surface temperatures need to be at least 26.5°C to initiate a tropical storm, although the typhoon can then move over colder waters. Typhoons and tropical cyclones are classified depending on the speed of their winds. An example of the classification is provided in Table 42.
Table 42 – Beaufort scale of Typhoon Classification
Beaufort Scale
knots km/h SW Pacific (FMS) NW Pacific (JMA)
0–6 <28 <52 Tropical Depression Tropical Depression 7 28-29 52-56
30-33 56-63 8–9 34–47 63-89 Tropical Cyclone (1) Tropical Storm 10 48–55 89-104 Tropical Cyclone (2) Severe Tropical Storm 11 56–63 104-119 12 64–72 119-135 Severe Tropical Cyclone (3) Strong Typhoon 13 73–85 135-159 14 86–89 159-167 Severe Tropical Cyclone (4) Very Strong Typhoon 15 90–99 167-185 16 100–106 185-198 17 107-114 198-213 Severe Tropical Cyclone (5) Intense Typhoon
115–119 213-222 >120 >222
Source: Wikipedia 2011.
6.5.1 Exposure to Typhoons Figure 93 shows the pattern of hurricane paths in the region in past history. Since the 1950s, there have been over 200 typhoons that have affected Vietnam, although not all of them have been large. In an average typhoon season, about 30 typhoons usually develop in the northwest Pacific, of which around 10 are based in the South China Sea. Of this number, on average 4–6 will make landfall on or near Vietnam, although there have been years when 10 or more have hit, such as in 1964, 1973, 1978, 1989, and 1996 (CCSFC 1999).
Kien Giang and Ca Mau are at the southerly limit for typhoons and many of the storms are at the lower end of the intensity scale. However, Typhoon Linda did cross Ca Mau in 1997 killing over 4,000. Linda was considered to be the worst storm to hit Vietnam this century, and was compounded by the storm landing at high tide in a place where there was little experience with typhoons and few means to communicate to fishermen at sea. Total damages were estimated to be $600 million (Duong Lien Chau 2000).

Climate Change Impact and Adaptation Study in Mekong Delta – Part A
129 | P a g e
Figure 93 – Regional tropical cyclone tracks from 1980 – 2005, coded by Saffir-Simpson category. The points show the locations of the storms at six-hourly intervals. Source: Wikipedia.
Typhoon Linda moved across the southern tip of the Ca Mau peninsula (see Figure 94) and caused widespread damage across the two provinces. It resulted in flooding, damage to mangrove and plantation forests, damage to housing and power infrastructure and inundation and associated damage to agricultural production.
The greatest physical effects of Linda on the mainland would have been felt on the lightly populated East coast of Ca Mau when the typhoon approached and crossed the coast. This occurred at high tide and the associated low atmospheric pressure would have led to severe storm surge conditions and the accompanying wave field had a long fetch with waves of over 3 meters directed onto the shore.
Three factors reduced the extent of the destruction of property and infrastructure and financial loss. Firstly, it was low tide when the typhoon had the maximum effect on the more populated coastal regions of western Ca Mau and Kien Giang, which reduced the effect of storm surge. Secondly, after crossing into the west sea, the typhoon tracked north along the coast. This meant that strong typhoon winds blew from the south and did not strike the coast as direct onshore winds which reduced the fetch and hence the destructive potential of the associated waves. Lastly and most importantly, in 1997 there was a much lower population and associated infrastructure to be affected.

Climate Change Impact and Adaptation Study in Mekong Delta – Part A
130 | P a g e
Figure 94 - Path of Typhoon Linda, coded by Saffir-Simpson category (See Figure 85 for categories). Source: Wikipedia 2011.
6.5.2 Typhoon Simulations An analysis of Typhoon trends showed that while the frequency in the East Sea increased slightly, the frequency of typhoon landings in Vietnam has no clear trend. However, Typhoon landings have moved toward the South and frequency of very strong storms (> level 12) has increased, (IMHEN 2010). The analysis also showed that the typhoon season ends later.
This indicates that areas that have not typically suffered from storms (such as the south eastern portion of the country and HCMC) may increasingly be vulnerable. However, cyclones are a complex phenomenon and their formation is very difficult to predict. A number of simulations for typhoons were undertaken to shed light on the potential effects of storm surge and inundation going forward to 2030 and 2050 on the understanding that these projections may never eventuate.
The observations from Typhoon Linda in 1997 were used to simulate the potential effects of typhoons and storm surge on the coastlines of Ca Mau and Kien Giang under different sea level rise scenarios. As illustrated in Figure 11, the simulations show that the water surface elevation for a large scale typhoon event could be as high as 2 m in elevation, and in combined with 4-5 m waves could result in severe damage to coastal protection dykes, and fishing villages in estuaries and canal mouths along the entire coast.
In particular, Ngoc Hien will be almost completely inundated and extremely strong currents are projected to flow through the Grand River resulting in erosion along the southern border of Nam Can. This would threaten road infrastructure particularly the proposed southern highway, transport and industrial infrastructure such as wharves and ferry terminals, urban areas of Nam Can town and rural housing on Ngoc Hien and along the Grand River.

Climate Change Impact and Adaptation Study in Mekong Delta – Part A
131 | P a g e
Figure 95 - Storm surge inundation and wave size simulation for a Typhoon (2050).
6.5.3 Storm Surge During a storm event, the combined effect of low pressure and high winds result in higher than normal water levels. Both wind set-up and wave set-up are affected by the depth of the coastal waters. Where there is a narrow shallow shelf, the wave set-up is predominant, while a broad region of shallow water would cause a dominant wind set-up.
For both the East and West coastlines, there is medium potential for wave setup to contribute to storm tide on the ocean facing coastlines that are exposed to waves from the dominant wave direction spanning from the northeast to the southwest monsoons. It is clear from both the observed effects on low lying study areas in the past, and the simulations from the modelling, that extreme weather events pose a significant threat to both provinces. Table 43 and
Table 44 highlight the current and future projections for the area affected by storm surge for each district as a result of sea level rise. As previously noted, Ngoc Hien is most likely to be adversely effected. Ngoc Hien currently experiences inundation during high tides and storm events, and this situation is exacerbated where wet season floods coincide with the spring tide, which exhibits a difference in tidal amplitude between 0.4 to 1.2 m between the East and West Seas.

Climate Change Impact and Adaptation Study in Mekong Delta – Part A
132 | P a g e
Table 43 - The effects of Storm Surge on Districts in Ca Mau.
District
Total Area (ha)
Current Storm Surge Storm Surge 2030 (15 cm SLR)
Storm Surge 2050 (30 cm SLR)
% Affected
Area (ha)
% Affected
Area (ha)
% Affected
Area (ha)
Ca Mau 24,929 0% - 0% - 0% - Cai Nuoc 41,700 0% - 0% - 0% - Dam Doi 83,415 <1% 260 <1% 390 1% 520 Nam Can 50,789 1% 270 5% 2,539 10% 5,079 Ngoc Hien 73,517 60% 44,110 90% 66,165 100% 73,517 Phu Tan 46,433 1% 390 1% 585 2% 780 Thoi Binh 64,131 0% - 0% - 0% - Tran Van Thoi 70,942 1% 380 1% 570 1% 760 U Minh 77,462 <1% 301 1% 452 1% 603
Table 44 - The effects of Storm Surge on Districts in Kien Giang.
District
Total Area (ha)
Current Storm Surge Storm Surge 2030 (15 cm SLR)
Storm Surge 2050 (30 cm SLR)
% Affected
Area (ha)
% Affected
Area (ha)
% Affected
Area (ha)
Rach Gia 10,364 1% 125 2% 188 2% 250 Ha Tien 9,952 6% 634 10% 951 13% 1,269 An Bien 40,029 1% 386 1% 579 2% 772 An Minh 59,05 1% 389 1% 583 1% 777 Chau Thanh 28,544 <1% 130 1% 195 1% 259 Giang Thanh 41,284 0% - 0% - 0% - Giong Rieng 63,929 0% - 0% - 0% - Go Quao 43,951 0% - 0% - 0% - Hon Dat 103,863 <1% 505 1% 758 1% 1,010 Kien Hai 2,558 12% 310 15% 388 18% 466 Kien Luong 47,285 1% 515 2% 773 2% 1,031 Phu Quoc 58,891 1% 506 1% 632 1% 759 Tan Hiep 42,288 0% - 0% - 0% - U Minh Thuong 43,27 0% - 0% - 0% - Vinh Thuan 39,483 0% - 0% - 0% -
Other districts likely to be adversely affected from storm surge and SLR include: Dam Doi; Nam Can; Phu Tan; Tran Van Thoi; and U Minh in Ca Mau province – and Rach Gia; Ha Tien; An Bien; An Minh; Chau Thanh; Hon Dat; and Kien Luong in Kien Giang province. It should also be noted that the island districts of Phu Quoc and Kien Hai are likely to be adversely affected, especially Kien Hai with between 6 and 13% of their land area (or approximately 300 to 460 hectares) inundated.
6.6 Coastal Sedimentation and Erosion Projected increases in sea level, changes in monsoonal conditions (in terms of wind and waves), and the probable increase in the frequency of extreme cyclone events will have a marked effect on coastal geomorphological process (especially longshore currents) and likely exacerbate observed trends in areas currently susceptible to erosion and sedimentation.

Climate Change Impact and Adaptation Study in Mekong Delta – Part A
133 | P a g e
Figure 96 - a) Wave height in typical SW monsoon conditions; and b) Wave height in Strong SW monsoon conditions

Climate Change Impact and Adaptation Study in Mekong Delta – Part A
134 | P a g e
This report has attempted to simulate and describe some of these potential changes, but it must stressed that this is very much a first pass assessment, and further research is required to fully understand the complex inter-relationships between the oceanographic and coastal systems in the study area. These are discussed below.
6.6.1 Changes in Monsoonal Conditions
Southwest monsoons bring onshore winds and waves of up to 0.5 m offshore to much of the west coast of the Ca Mau peninsular, and 0.4 m off the coast of Kien Giang as shown in Figure 96. Waves of this size tend to transport sediments onto the shore, increasing deposition. Along with the sediment that is washed onshore is fishing debris, rubbish and water hyacinth. Stronger SW monsoons will bring stronger waves of 2 - 2.5 m offshore, as shown in Figure 97. Waves of this size can cause destruction of exposed infrastructure along the coast. These waves will undermine mangroves and erode exposed earth banks.
Strong northeast to east monsoons in the dry season brings large waves to the East coast of Ca Mau, as illustrated in Figure 97 below.
Figure 97 - Southeast Monsoon Wave - Ca Mau
6.6.2 Effects on Coastal Conditions It has long been recognised that low lying coastal and deltaic ecosystems are especially vulnerable to this combination of impacts associated with climate change and sea level rise, and that the risk from climate-induced factors constitutes a dangerous level of climatic change to coastal geomorphology.
While erosion is intuitively the most common response to sea-level rise, it should be recognised that coasts are not passive systems. Both the East and West coastlines have historically changed over time in response to a combination of geomorphological and oceanographic factors. In particular there is evidence from the satellite imagery to indicate that the coastline of Mui Ca Mau for example has undergone significant geomorphological change over the last 100 years.
The predominant coastal processes operating in the region include:
Southerly littoral drift along the East coasts due to prevailing current, swell and wind wave direction.
Southerly movement of material transported
Wave refraction drives movement of sediment as sediment plumes and slug around Ca Mau

Climate Change Impact and Adaptation Study in Mekong Delta – Part A
135 | P a g e
Cape.
Transport of material finer materials and colloidal sediments along the West coast;
Onshore entrapment of sediments in coastal fringing mangroves, and movement landwards - a result of swell induced transport.
Erosion and inundation due to heavy swell and rough seas generated by typhoons and monsoonal storms that can carry increased quantities of sand and silt alongshore as well as offshore.
Overall, from our assessment of the coastal simulations, exposure, geomorphic characteristics and evidence of previous change, the sensitivity of different coastal landscapes of Kien Giang and Ca Mau to projected changes in climate are summarised in Table 45.
Table 45 - Effects of projected climate changes on coastal landscapes of Ca Mau and Kien Giang.
Location Effects on the Coastal Zone East Coast (Ca Mau)
Marked reductions in the movement of sediments from the Bassac River (and other Mekong tributaries) in the north to the east coast of Ca Mau in the south, due to lower sediment loads in the Mekong; In addition, increases in erosion due to more energetic wave conditions and intense monsoonal conditions and storms. Possible loss of mangroves and other erosion buffer leading to exposure of large areas in Ngoc Hien, Nam Can and Dam Doi, resulting in damage and loss of natural ecosystem and impacts on waterways. Lower lying areas such Ngoc Hien are likely to be subject to inundation both as result of sea level rise and superimposition of elevated surges in extreme events. Overtopping and ponding inland could lead to loss of land from permanent inundation.
West Coast (Kien Giang and Ca Mau)
Marked increases in erosion due to more energetic wave conditions and intense monsoonal conditions and storms, resulting in degradation of coastal protection works and progressive loss of coastal land. Coastal erosion is already a problem, with estimated rates of land loss of in the order of 5–10 m per year in some locations, and in some areas as much as 0.5 km. Loss of mangroves and other erosion buffer leading to exposure of large areas in Hon Dat and Kien Luong resulting in damage and loss of agricultural land and urban settlements and infrastructure. Increased overtopping of existing sea dyke system wall along settlement, decrease in buffer zone between wave action and infrastructure. Potential surface overflow over land with subsequent ponding, particular in basin profile locations.
Phu Quoc and Kien Hai Islands
Shore wave energy and the magnitude of beach profile change can be expected to increase as a consequence of changes in the frequency and intensity of monsoonal and extreme events. This will lead to possible erosion of beaches with undermining of tree line/tree felling, loss of coastal vegetation, degradation of coastal protection works and progressive loss of coastal land. Inundation, in combination with increased erosion, will potentially lead to island breaching in other lower lying locations e.g. the coastal dune and lagoon complex on the west coast of Phu Quoc. In addition, elevated water levels and coincident storm surges will likely cause flooding with 750 ha on Phu Quoc and 460 ha in Kien Hai being susceptible to inundation.

Climate Change Impact and Adaptation Study in Mekong Delta – Part A
136 | P a g e
Many of the coastal areas on the West Coast are potentially threatened by a combination of human pressures, climate change and sea-level rise, and possible increases in monsoonal conditions and extreme weather events. Future impacts on these low-lying coastal areas will almost certainly include changes in coastal morphology, through accelerated coastal erosion, sedimentation in the coastal embayment’s, and overtopping of sea dykes from the sea and storm surge.
The first line of defence from the effects of wave action on the coast is mangroves. In the past the mangrove ecosystem was up to 2 kilometres wide. Behind the mangroves, protection of crops and urban structures was achieved through the construction of earth sea dykes.
The effects of storm surge are enhanced by the human pressures on mangrove systems such as fuelwood and timber cutting that is also contributing to the loss of mangroves. Larger wave heights will penetrate through a thin line of mangroves and erode earth dykes. The conversion of mangroves into aquaculture ponds has made considerably more infrastructure potentially exposed to storm surge.
As mangroves are removed or eroded, aquaculture ponds are exposed and breached. This leads to saline intrusion into ponds, and generally abandonment. As a result the regular line of fringing wave tolerant mangroves (Avicennia spp.) is fragmented, exposing less robust species resulting in further mangrove loss. The fragmented mangrove system allows waves to penetrate to the back of the abandoned pond advancing erosion in steps of 50 to 100 meters.
Earth dykes that have been exposed by mangrove removal or erosion will be breached within a single wet season.
Figure 98 - Dyke breach at Vam Ray, Hon Dat District 2009. Courtesy GIZ.
In many areas of the coast of both provinces the band fringing mangroves is relatively thin and the sea dyke forms the major protection from storm surge. In these areas breaching of a dike has a number of results. In districts where agriculture occurs behind the sea dyke E.g. Hon Dat, U Minh, and Tran Van Thoi, larger waves that overtop a dyke, or flow through breached dykes, can destroy houses and farm infrastructure. Salt water that comes through breached dykes will inundate crops and fish ponds. In aquaculture areas, sea water will breach pond walls and wash away stock.
In areas of Hon Dat, fruit orchards were destroyed by salt water when a dyke breached in 2008. Farmers in the commune have now switched to sugar cane as a perennial crop to minimise loss due to future breaches.
Most of the small islands in Phu Quoc and Tien Hai districts (such as An Toi and Soi Anh islands) are limestone karst pinnacles, and their shorelines are well protected by the rocky shorelines, interspersed

Climate Change Impact and Adaptation Study in Mekong Delta – Part A
137 | P a g e
with short beaches. These shorelines will only be subject to substantial retreat if barriers were eroded or overtopped.
However, the geomorphology of the island of Phu Quoc is quite different, and Phu Quoc has a number of long sand beaches that are potentially exposed to ocean, and that do not have the natural protection afforded by coral reef and will be potentially more vulnerable to sea level rise and changes in erosion and sedimentation patterns. The relatively low-lying coastal lagoon on the west coast is likely to be prone to inundation risk due to sea level rise, and increasing erosion on the east coast may lead to reduction of the low lying sand areas, in particular the main tourist beach where tourist development and artificial reinforcements mean there is no room for horizontal beach adjustment.
The potential geomorphic response of different beachscapes on Phu Quoc and other low set islands to the projected impacts of climate change will differ depending on the type of profile in a given location (i.e. profile shape – in association with the substrate of which it is composed), and this should be the subject of future studies.
6.6.3 Other Effects Sediment Loss
As mentioned previously, one of the key findings from the coastal modelling is the dramatic reduction in sediment loads in the Mekong mainstream (and the Bassac River in particular), and its effects on sedimentation and deposition on the Ca Mau peninsula and the Kien Giang coastline. It is estimated that there will be a 60% reduction in sediment loads over the next 20 years, and the impacts on of this sedimentation deficit are not well understood, and should be the focus of future research.
However, some preliminary conclusions can be drawn:
A net decline in sedimentation of this magnitude will most likely lead to a destabilisation of the coastal erosion and sedimentation patterns on both the East and West coasts;
The reduction in sediment loads will most likely lead to a shift in the rates of sediment deposition and replenishment in coastal seagrass and mangrove systems;
There could be localised loss of nutrients and sediment to support agriculture, aquaculture and marine capture fisheries in coastal areas.
Kien Giang Province has 205 km of coastline and it is estimated that at least 25 percent of this coastline is badly eroded. This shoreline has more than 5,000 ha of mangrove protection forests, forming a thin green line of salt-tolerant vegetation that buffers and protects valuable farming lands from rising seas and storm damage. This tacit coastal defence is threatened by global climate change, as projected rises in sea levels take effect.
Subsidence (natural or human-induced)
Changing water regime might affect to the delicate balance of mangrove restoration and growth in the study area. This could lead to a further loss of the mangroves along the coast line, and increased coastal erosion, compounding the existing problem of the exploitation of mangrove for construction and fire wood, and shrimp cultivation in mangrove forest area.

Climate Change Impact and Adaptation Study in Mekong Delta – Part A
138 | P a g e
Figure 99 - mapping of current erosion in Kien Giang (from GIZ 2010) – and corresponding changes in deposition and erosion patterns between 2009 and 2050.
6.7 Synthesis of the Climate Change Impacts on Natural Systems
Table 46 below summarises the expert assessment of the adequacy of control measures to reduce the exposure to the important impacts of climate change on natural systems. The impact of each hazard on the infrastructure of each district is rated according to the combination of exposure to the hazard and the extent of existing measures that are in place to reduce the impacts. The assessments assumed that no further adaptation response occurs.
As illustrated in the Table below, whilst the exposure to salinity is widespread and considered to be major for just about all of the mainland districts, where control measures are largely in place the impacts are generally only moderate. This is the same for the nature and extent of coastal erosion. Whilst all of the coastal districts are exposed to coastal erosion, for most districts the impacts were assessed as intermediate and/or partly controlled. However Ngoc Hien was assessed as major and largely uncontrolled as it is the only coastal district not protected by the sea-dyke system.
The sea dyke system, with an average height above sea level of 1.2 meters currently provides adequate protection for all the coastal districts except Ngoc Hien, and excluding the island districts of Phu Quoc and Kien Hai. Obviously Ngoc Hien, Kien Hai and to a lesser extent Phu Quoc are highly vulnerable to the combined effects of sea level rise, storm surge and coastal erosion. While much of the West Coast of Phu Quoc is exposed to coastal erosion, most of the infrastructure is located in areas that are well above the current sea level or are in protected locations.
In terms of magnitude and extent, river flooding and inundation clearly represent the greatest threats to both provinces and especially to Kien Giang where twelve of the fifteen districts were assessed as having major exposure with little control mechanisms in place. In particular, the districts of Chau

Climate Change Impact and Adaptation Study in Mekong Delta – Part A
139 | P a g e
Thanh, Giang Thanh, Giong Rieng, Go Quao, Hon Dat, Kien Luong and Tan Hiep were considered to be highly vulnerable and threatened by flooding and inundation.
Table 46- Summary of the suitability of measures in place to control climate change impacts on natural systems in each district.
District
Hazard Erosion &
Sedimentation Flooding &
Drought Salinisation Storm Surge
Ca
Mau
Pro
vinc
e
Ca Mau • ••• ••• • Cai Nuoc •• •••• ••• • Dam Doi •• •• ••• •• Nam Can •• ••• ••• •• Ngoc Hien •••• •• ••• •••• Phu Tan •• ••• ••• •• Thoi Binh • •• ••• • Tran Van Thoi •• ••• ••• •• U Minh •• •• ••• ••
Kie
n G
iang
Pro
vinc
e
Rach Gia •• ••• ••• •• Ha Tien •• ••• ••• •• An Bien •• ••• ••• •• An Minh •• •• ••• •• Chau Thanh •• •••• ••• •• Giang Thanh •• •••• •• • Giong Rieng • •••• •• • Go Quao • •••• ••• • Hon Dat •• •••• ••• •• Kien Hai •• • • •••• Kien Luong •• •••• ••• •• Phu Quoc •• • • •• Tan Hiep • •••• ••• • U Minh Thuong •• ••• ••• • Vinh Thuan •• ••• ••• •
• Minor exposure and/or well controlled ••• Major exposure but largely controlled
•• Intermediate exposure and/or partly controlled
•••• Major exposure and little control measures in place
As previously noted, these climate change impacts are not new to the people of the delta, and with the exception of Ngoc Hien, most of the districts have control measures in place to deal with the level of impacts that they are currently exposed to. This is not to say that coastal and flood protection is adequate. Upgrading of both the sea dyke system and the flood control system is urgently needed for all the mainland districts, as are coastal and erosion control measures for both Phu Quoc and Kien Hai islands.

Climate Change Impact and Adaptation Study in Mekong Delta – Part A
140 | P a g e
7. Vulnerability, Risk and Hotspot Analysis The primary purpose of this section of the study is to identify and evaluate the ‘net biophysical and social vulnerability’ of Ca Mau and Kien Giang provinces. In this context and for the purposes of this Report, ‘vulnerability’ is considered to be a function of:
Exposure to climatic conditions and sensitivity to the impacts of climate change;
The frequency, magnitude and extent of climate-related risks to the community, assessed in terms of the probability of occurrence (likelihood) and magnitude of hazards (consequence); and
The ability or adaptive capacity to respond to climate-related risks (including adaptive measures, coping strategies or actions taken in reaction to the impacts or to mitigate the risks).
7.1 Vulnerability The study involved developing a vulnerability profile for each district for comparison and analysis across the study area. As previously discussed, the principle climate change and sea level rise impacts considered for this study were:
The impacts of flooding and inundation associated with and extreme weather events (and in particular typhoons);
The impacts of salinity and saline intrusion associated with changes in hydrology and sea level rise;
The impacts of storm surge associated with changes in sea level rise and extreme events;
The impacts of erosion and sedimentation associated with changes in sea level rise, extreme events, coastal and oceanographic conditions.
Future climatic conditions based on global climate scenarios and the outputs from our impact modelling were used to produce estimates of exposure and resilience to flooding, inundation, salinity and storm surge.
These were then developed and applied as a composite of ‘vulnerability indicators’ to assess the vulnerability. The indicators (as outlined in 2.2.2), were used to represent the three characteristics of vulnerability (exposure, sensitivity and adaptive capacity), in order to:
Establish specific sectoral baseline characteristics for population, poverty, agriculture and livelihoods, industry and energy and urban settlements and transportation; and
Develop future vulnerability profiles and assess the future impacts associated with our different climate change scenarios for 2030 and 2050.
The previous chapter summarised the type, combination, and level of exposure to the climate change effects for each district, and this forms the basis of our assessment of climate change impacts, now and for 2030 and 2050.
The following sections quantify these impacts for each sector, in order to gauge the relative levels of exposure and sensitivity necessary to determine climate change vulnerability and risks for each sector including: population; poverty; livelihood and agricultural systems; industry; energy; and transport infrastructure and systems.

Climate Change Impact and Adaptation Study in Mekong Delta – Part A
141 | P a g e
7.1.1 Population Vulnerability Population Vulnerability refers to the vulnerability of people and populations in the study area to the effects of climate change, and recognises that there are distinct regional differences in the demographic composition and trends (such as the migration of people towards coastal urban areas which yields a greater than average growth of the population in some districts). Population growth is a major driver for change in the delta, especially in terms of increasing the number of people and households exposed to climate change hazards, but also increase of demands on the available natural resources and its implications on sustainable livelihoods.
The relationship between population change and the associated demographic trends and climate change will affect the ability of local communities and households to build resilience to climate change. Population information in this context is be used as a proxy for human sensitivity to climate change hazard exposure.
Over the long term, population growth in the study area is likely to contribute to and exacerbate not only the vulnerability to climate change, but exacerbate the difficulties in adapting to the potentially detrimental changes in climate. In this context a district is considered to be vulnerable if it exhibits characteristics such as high population numbers, rates of growth or large family size.
In this study population vulnerability is measured by combining information on these characteristics and indicators at the commune level. This not only illustrates the spatial patterns of population vulnerability, but also provides an understanding how population growth will drive change in the composition and structure of communities over time. Table 47 and Table 48 highlight the key baseline indicators used in this study for each province.
Table 47 - Comparative overview of Ca Mau district population (number, density) and growth rate.
Population Vulnerability Baseline Indicator District
Population Population Density
(Persons/ha)
Average Family Size
Population at Working Age
Growth Rate %
Ca Mau 218,148 8.75 4.10 135,632 1.29% Cai Nuoc 137,846 3.31 4.25 94,747 1.20% Dam Doi 182,332 2.19 4.59 121,324 1.17% Nam Can 66,261 1.30 4.00 43,977 1.24% Ngoc Hien 78,420 1.07 4.08 52,396 1.58% Phu Tan 105,599 2.27 4.49 69,206 1.03% Thoi Binh 140,600 2.19 4.40 92,865 1.24% Tran Van Thoi 187,132 2.64 4.20 129,121 1.18% U Minh 102,215 1.32 4.30 66,694 1.20%
Table 48 - Comparative overview of Kien Giang district population (number, density) and growth rate.
Population Vulnerability Baseline Indicator District
Population Population Density
(Persons/ha)
Average Family Size
Population at Working Age
Growth Rate %
Rach Gia 226,963 21.90 4.59 139,015 1.12% Ha Tien 45,810 4.60 4.15 27,749 1.14% An Bien 123,077 3.07 4.35 74,490 1.15% An Minh 115,783 1.96 4.33 54,515 1.17% Chau Thanh 151,250 5.30 4.38 66,566 1.29% Giang Thanh 27,110 0.66 3.91 13,069 1.25% Giong Rieng 212,716 3.33 4.35 118,058 1.20% Go Quao 137,250 3.12 4.21 91,343 1.13%

Climate Change Impact and Adaptation Study in Mekong Delta – Part A
142 | P a g e
Population Vulnerability Baseline Indicator District
Population Population Density
(Persons/ha)
Average Family Size
Population at Working Age
Growth Rate %
Hon Dat 171,000 1.65 4.43 92,608 1.30% Kien Hai 21,272 8.32 4.08 14,112 1.35% Kien Luong 79,236 1.68 4.10 51,724 1.20% Phu Quoc 93,654 1.59 4.01 53,369 1.30% Tan Hiep 143,439 3.39 4.52 75,588 1.20% U Minh Thuong 67,698 1.56 4.22 41,071 1.34% Vinh Thuan 89,814 2.27 4.28 45,975 1.20%
The indicators and measures outlined in Table 47, together with future projections of population growth were used to estimate or rate the relative population vulnerability at the district levels as illustrated in Figure 100 and Figure 101. The comparative vulnerabilities of each district are represented geographically in Figure 102.
Figure 100 - Comparative population vulnerabilities of each district in Ca Mau.
Figure 101 - Comparative population vulnerabilities of each district in Kien Giang.

Climate Change Impact and Adaptation Study in Mekong Delta – Part A
143 | P a g e
Figure 102 - Population vulnerability rankings for current and future climate change scenarios.

Climate Change Impact and Adaptation Study in Mekong Delta – Part A
144 | P a g e
The population vulnerability map was derived primarily from the population and demographic and data collected during the district survey. For each province the districts were ranked out of 40 according to these indicators. It was found that:
The current population vulnerability for all the districts in Ca Mau and Kien Giang was low;
By 2030 two out nine districts in Ca Mau and two out of fifteen districts in Kien were assessed as being medium;
By 2050, Cau Mau City and Tran Van Thoi in Ca Mau were assessed as being highly vulnerable, and a further three districts exhibiting medium vulnerability;
By 2050 in Kien Giang, the rating for Rach Gia City and Chau Thanh is expected to increase from medium to high, primarily due to a combination of high population growth and limited land area.
The Mekong Delta historically has had a very strong pattern of migration from rural to urban areas and especially to Ho Chi Minh City. The study found that there are strong regional patterns of migration in both Kien Giang, with most districts exhibiting a net outward migration pattern to the provincial capital in the first instance, or to Can Tho or Ho Chi Minh.
Figure 94 - Ca Mau Population Migration Rates (2010).
Figure 95- Kien Giang Migration Rates
The relatively low population growth rates, in combination with the migration data collected for the year 2010 during the field survey suggest that there is considerable net outward migration from the

Climate Change Impact and Adaptation Study in Mekong Delta – Part A
145 | P a g e
districts to larger centres such as Can Tho and HCMC. Both Ca Mau City and Rach Gia are benefitting from large influxes of local, repatriating and foreign capital into residential and commercial developments in new subdivisions on the outskirts of traditional centres.
In common with other rural areas in Vietnam it can be expected that the rural-urban drift will continue due to rural under-employment and growing perceived urban attractions. In districts with rapidly increasing populations and small land areas, such as Chau Thanh and Tran Van Thoi, parcels of land to be passed on to the sons by families are becoming too small to be productive, and when the land resources available to a family are not sufficient to provide a sustainable livelihood for a family, then the sons and daughters are more likely to look for work as hired labour in regional centres, or migrate to the cities. The influx of migrants into regional centres is likely increase the vulnerability of local residents as the pressure on land and natural resources availability declines. In addition to this, the new migrants themselves will be more vulnerable to climate change due to their lack of access to land resources and lack of wealth.
The Mekong Delta has the second highest level of landlessness in the country. Most of the poor in the region are either landless or have very limited land holdings, and the rate of landlessness among the rural poor is also increasing (Vietnam Consultative Group 2010). Unfortunately we were unable to gain access to information or data on either migration or landlessness at the district level, as this information is held by the police.
7.1.2 Poverty Vulnerability As previously outlined, poverty vulnerability refers to the vulnerability of poor and near poor households and people in the study area to the effects of climate change, and recognises that the exposure of poor people varies across the region, as does their sensitivity due to a range of factors such as ethnicity, lack of access to agricultural land, education and health services, fresh drinking water, power and markets. Poor countries and people tend to be particularly vulnerable to deviations from average climatic conditions and climatic extremes (ADB 2009).
Poverty diminishes the resilience and adaptive capacity of people and households, especially where people lack savings and capital for investment to adopt better production technology and also lack awareness and knowledge of adaption options available. Like population, poverty encompasses dimensions relevant to climate change vulnerability, such as the vulnerability to impacts and future shocks – and the ability to build resilience and adapt to climate change.
This study recognizes that poverty is multi-dimensional and includes health, wealth, education and access to natural resources in addition to income. Vulnerability can be measured by combining information on these indicators with different poverty measures at the commune level. This illuminates the spatial patterns of poverty and allows for an analysis of the vulnerability of the poor and near poor communities and households to climate change impacts and hazards.
This study used indicators to assess the impact of a range of adverse shocks, such as flooding, inundation, saline intrusion and storm surge on poverty and the poor in both provinces. Table 49 and Table 50 highlight the current number of poor households in each district, and provides the baseline from which the level of impacts from flooding, inundation, salinity and storm surge on the poor for 2030 and 2050 scenarios can be estimated. These estimates assume that relative poverty levels will stay the same (i.e. without poverty reduction interventions).
This assumption recognises that while a high proportion of people have moved out of poverty in Vietnam, many ‘near poor’ remain in a precarious position, and could easily slip back into poverty due to the adverse shocks (World Bank, 2010). However it must also be acknowledged that there has been a strong reduction in overall poverty in Vietnam in the past 20 years, with the fraction of households living below the poverty line at less than 15 percent in 2006, compared to over 58 percent in 1993 (Vietnam Consultative Group 2010).

Climate Change Impact and Adaptation Study in Mekong Delta – Part A
146 | P a g e
In Vietnam, poverty is officially measured by a standard government measure; according to Decision 170/2005/QĐ-TTg, poor households in rural areas have a monthly income per person of below 200,000 VND and below 260,000 VND for urban areas. Areas with households below this standard are considered poor.
Table 49 - Comparative overview of Ca Mau district poverty indicators
Poverty Vulnerability Baseline Indicators
District
Average Annual Income per Capita
Poor Households %
Teachers per 1000
Doctors per 1000
% Ethnic
Ca Mau 50,035,000 2.4% 9.4 1.3 0.9% Cai Nuoc 15,399,600 11.9% 11.5 0.7 3.8% Dam Doi 18,156,000 17.8% 7.1 0.4 3.6% Nam Can 22,656,000 11.5% 8.6 0.5 3.2% Ngoc Hien 13,500,000 19.4% 5.9 0.3 2.9% Phu Tan 15,490,000 9.2% 10.4 0.1 1.7% Thoi Binh 10,080,000 8.4% 8.1 0.3 5.5% Tran Van Thoi 13,000,000 12.3% 10.9 0.1 4.4% U Minh 10,500,000 21.2% 7.0 0.4 4.5%
Table 50 - Comparative overview of Kien Giang district poverty indicators
Poverty Vulnerability Baseline Indicators
District Average Annual Income per Capita
Poor Households %
Teachers per 1000
Doctors per 1000
% Ethnic
Rach Gia 30,908,000 2.6% 5.8 0.4 11.2% Ha Tien 25,006,000 3.4% 6.4 0.5 15.0% An Bien 15,220,000 15.0% 15.6 0.2 11.4% An Minh 14,583,000 14.8% 7.3 0.2 2.4% Chau Thanh 15,665,000 8.5% 7.7 0.2 37.8% Giang Thanh 19,270,000 12.4% 8.0 0.2 21.8% Giong Rieng 11,426,000 9.3% 8.7 0.0 16.8% Go Quao 19,000,000 13.2% 8.5 0.3 33.4% Hon Dat 16885,000 7.1% 7.9 0.2 13.9% Kien Hai 27,640,000 0.5% 6.2 0.1 1.9% Kien Luong 20,463,100 1.5% 7.9 0.4 14.6% Phu Quoc 30,414,000 2.9% 9.7 0.1 2.8% Tan Hiep 22,204,000 6.6% 11.5 0.1 3.6% U Minh Thuong 14,400,000 15.5% 12.2 0.1 9.1% Vinh Thuan 21,325,000 8.7% 9.3 0.6 8.2%
Using the indicators and measures outlined in Table 49 and Table 50, together with future projections of population growth and expert opinion of the quality of control measures the relative poverty

Climate Change Impact and Adaptation Study in Mekong Delta – Part A
147 | P a g e
vulnerability at the district levels was rated, Figure 103 and Figure 104. The comparative vulnerabilities of each district are represented geographically in Figure 105 below.
Figure 103 – Ca Mau poverty vulnerability ratings
Figure 104 - Kien Giang poverty vulnerability ratings.
0
5
10
15
20
25
30
Phu Quoc
Kien Hai Kien Luong
Ha Tien Giang Thanh
Go Quao Vinh Thuan
Tan Hiep Rach Gia U Minh Thuong
Giong Rieng
An Bien An Minh Hon Dat Chau Thanh
2010 Current 2030 A2 2030 B2 2050 A2 2050 B2

Climate Change Impact and Adaptation Study in Mekong Delta – Part A
148 | P a g e
Figure 105 - Poverty vulnerability rankings for current and future climate change scenarios.

Climate Change Impact and Adaptation Study in Mekong Delta – Part A
149 | P a g e
Vulnerability to shocks, whether they be to climate variability or otherwise (such as health or unemployment shocks), has long been identified as one of the major challenges for the poor in Vietnam (Vietnam Consultative Group 2010). The poor tend to have less diversity of income sources, and less access to credit to fill in income gaps, and less adaptive capacity in terms of diversification of occupations. Hence they are extremely vulnerable when one or more of their income sources are strongly affected by climate.
The poverty vulnerability map was derived primarily from socio-economic data collected during the district survey. While physical vulnerabilities may be geographically mapped with some precision, it is social constructed vulnerabilities such as poverty vulnerability are often are much more difficult to assess and to identify clearly because they do not easily fit into definite geographic spaces. This study used a combination of the standard indicators for Vietnam (such as: household income levels; ethnicity; education, literacy and access to schools; and access to health services) together with access to land resources.
The districts of each province were ranked out of 40 according to these indicators and it was found that:
The current poverty vulnerability for all the districts in Ca Mau and Kien Giang was low;
By 2030 two out nine districts in Ca Mau (i.e. Dam Doi and Ngoc Hien); and five out of fifteen districts in Kien Giang were assessed as being medium (these being Giong Rieng, An Minh, Hon Dat and Chau Thanh); and
By 2050, Dam Doi and Ngoc Hien in Ca Mau and Chau Thanh in Kien Giang were assessed as being highly vulnerable.
Whilst all the indicators of poverty are important, in Kien Giang and Ca Mau the primary driver of poverty vulnerability proved to be access to land resources. As access to productive land is important for reducing rural poverty, the impacts of climate change on the productivity of land will further constrain efforts to combat rural poverty.
In almost all districts limited space is either a problem now, or will be in the near future. In the Mekong delta pressure on space will increase dramatically in future, and this in turn will place unparalleled pressure on household livelihood systems and the regional economy in general.
7.1.3 Agriculture and Livelihoods Vulnerability Many studies in recent years have focused on the idea of “sustainable livelihoods” as a useful framework in which to contextualize people’s relationship with their environment (Leach et al. 1999; Pretty and Ward 2001).
The term ‘livelihood’ refers to the way in which people make a living, and this study, rather than simply looking at agricultural production to assess vulnerability, has incorporate a range of households livelihood indicators such as: household income; household occupations; diversity of income streams; and access to natural resources (land and water).
Livelihoods and sources of employment in Kien Giang and Ca Mau are closely tied to agriculture and natural resource use. Data from the project survey show that both employment and economic indicators underline the continuing importance of agriculture and natural resource-based productive activities on the Delta.
FAO (2007) points out that agriculture, aquaculture and fisheries are all highly sensitive to climate change and climate change will have a serious impact on their production functions. When a households’ livelihoods depend on a small number of sources of income without much diversification, and when those income sources are in fields that are highly climate dependent, like agriculture and fishing, households can be said to have climate-sensitive resource dependence (Adger 1999).

Climate Change Impact and Adaptation Study in Mekong Delta – Part A
150 | P a g e
Agriculture (including aquaculture, fisheries and associated primary industry), are among the most climate-sensitive of all sectors. The interactions between the weather-sensitive agricultural sector, climate change, and the natural resource base are highly complex and interdependent with the livelihoods of rural communities in the study area.
For the purposes of this study ‘agriculture and livelihoods vulnerability’ refers to the vulnerability of agricultural farming, infrastructure and livelihood systems in the study area to the effects of climate change, and recognizes that In Vietnam the single farmer household is considered to be the ‘basic economic unit’ upon which the agricultural sector is built.
In this context, agricultural and livelihood system are considered to be vulnerable if there is a high probability of loss or damage from climate change from which there is a high probability of it not recovering quickly or fully because the effects are either irreversible or the opportunities of recouping the losses are negligible.
This study measured agricultural and livelihood vulnerability by combining data and information from the district and sectoral surveys shown in Table 51 and Table 52. The indicators incorporated: human assets (occupations, access to employment, adults at working age etc); natural assets (water, land, aquatic etc.); economic (sectoral productivity, GDP and productive assets); and financial capital (household wealth characteristics) together with water reliant livelihood strategies.
Table 51 - Impacts of flooding, salinity, storm surge and coastal erosion and sedimentation on poverty and the poor in Ca Mau.
Livelihood Vulnerability Baseline Indicators District
% Rural Population
Number of Livelihood
Streams
Average Annual GDP per
Household
Rice Crop Land per
Person (ha)
Aquaculture Land per
Person (ha) Ca Mau 33% 5 12,208,744 0.05 0.06 Cai Nuoc 74% 4 3,624,178 0.06 0.24 Dam Doi 95% 6 3,955,556 0.09 0.33 Nam Can 72% 5 5,664,000 0.10 0.34 Ngoc Hien 94% 7 3,308,824 0.04 0.37 Phu Tan 86% 6 3,527,855 0.05 0.33 Thoi Binh 92% 7 2,285,923 0.07 0.39 Tran Van Thoi 77% 7 3,095,238 0.26 0.28 U Minh 98% 8 2,329,898 0.34 0.35

Climate Change Impact and Adaptation Study in Mekong Delta – Part A
151 | P a g e
Table 52 - Impacts of flooding, salinity, storm surge and coastal erosion and sedimentation on poverty and the poor in Kien Giang.
Livelihood Vulnerability Baseline Indicators District
% Rural Population
Number of Livelihood
Streams
Average Annual GDP per
Household
Rice Crop Land per
Person (ha)
Aquaculture Land per
Person (ha) Rach Gia 0% 6 6,734,548 0.03 0.00 Ha Tien 0% 6 6,019,235 0.06 0.08 An Bien 91% 6 3,501,625 0.27 0.00 An Minh 95% 6 3,371,334 0.38 0.01 Chau Thanh 86% 7 3,579,181 0.17 0.00 Giang Thanh 100% 4 4,932,295 0.99 0.23 Giong Rieng 91% 4 2,625,849 0.26 0.00 Go Quao 93% 4 4,517,086 0.28 0.00 Hon Dat 82% 7 3,810,382 0.46 0.04 Kien Hai 100% 7 6,774,866 0.03 0.00 Kien Luong 57% 8 4,990,005 0.32 0.12 Phu Quoc 43% 7 7,587,100 0.14 0.00 Tan Hiep 86% 5 4,910,796 0.27 0.00 U Minh Thuong 100% 4 3,408,668 0.43 0.02 Vinh Thuan 85% 5 4,981,389 0.27 0.06
Measures of exposure to climate change impacts can be estimated using the application of GIS to map the projected size of the area of each district that is impacted by each hazard. This mapping can be carried out for each time period and climate scenario. However, estimates of the level of measures that are in place to protect infrastructure are also required. Accordingly expert opinion was incorporated into the vulnerability rating as a weighting factor for each time slice; baseline, 2030 and 2050. An overview of the exposure to hazards and the status of control measures to protect agricultural infrastructure is shown in Table 53.

Climate Change Impact and Adaptation Study in Mekong Delta – Part A
152 | P a g e
Table 53 - Overview of exposure to climate change impacts and comparative status of control measures for agricultural infrastructure for each district.
District
Exposure to Flood (%) Control measures
Exposure to Salinity (%)
Control measures
Exposure to Storm Surge (%) Control
measures Current 2030 2050 Current 2030 2050 Current 2030 2050
Ca
Mau
Pro
vinc
e
Ca Mau 19% 52% 71% • 100% 100% 100% ••• 0% 0% 0% • Cai Nuoc 47% 70% 82% •• 100% 100% 100% • 0% 0% 0% • Dam Doi 13% 28% 36% •• 100% 100% 100% • 0% 0% 1% ••• Nam Can 36% 47% 58% •• 100% 100% 100% •• 1% 5% 10% •••
Ngoc Hien 22% 29% 39% •• 100% 100% 100% •• 60% 90% 100% •••• Phu Tan 36% 46% 62% •• 100% 100% 100% • 1% 1% 2% •••
Thoi Binh 6% 19% 35% ••• 100% 100% 100% •• 0% 0% 0% • Tan Van Thoi 42% 58% 79% •• 100% 100% 100% • 1% 1% 1% •••
U Minh 9% 22% 42% •• 100% 100% 100% •• 0% 1% 1% •••
Kie
n G
iang
Pro
vinc
e
Rach Gia 70% 75% 81% •• 95% 100% 100% •• 1% 2% 2% • Ha Tien 64% 67% 70% ••• 100% 100% 100% ••• 6% 10% 13% ••• An Bien 38% 69% 81% ••• 90% 100% 100% •••• 1% 1% 2% ••• An Minh 9% 39% 64% ••• 99% 100% 100% •••• 1% 1% 1% •••
Chau Thanh 72% 82% 87% •• 100% 100% 100% ••• 0% 1% 1% •• Giang Thanh 98% 98% 99% ••• 90% 100% 100% •••• 0% 0% 0% •• Giong Rieng 83% 89% 94% ••• 25% 20% 20% •• 0% 0% 0% •
Go Quao 61% 86% 92% ••• 70% 80% 85% ••• 0% 0% 0% • Hon Dat 96% 97% 98% •••• 50% 20% 20% ••• 0% 1% 1% •• Kien Hai 0% 0% 0% • 0% 0% 0% • 12% 15% 18% •
Kien Luong 89% 89% 91% ••• 100% 75% 70% ••• 1% 2% 2% ••• Phu Quoc 0% 0% 0% • 0% 0% 0% • 1% 1% 1% •• Tan Hiep 91% 92% 98% •• 60% 20% 20% •• 0% 0% 0% •
U Minh Thuong 17% 34% 52% ••• 100% 100% 100% ••• 0% 0% 0% • Vinh Thuan 14% 45% 68% ••• 100% 100% 100% ••• 0% 0% 0% •
• Adequate, now and in the near future (around 10 years) •• Adequate, but adaptation needed in view
of climate change (long term) •••
Improvements are desirable in view of economic development (medium term)
•••• Rehabilitation or upgrading urgently needed

Climate Change Impact and Adaptation Study in Mekong Delta – Part A
153 | P a g e
The overall distribution of agricultural and livelihood vulnerability for Kien Giang and Ca Mau province was therefore assessed as a function of; the above key indicators; the existing and projected climate exposure and hazard for sea level rise, inundation and salinity; and the existence of control measures. The assessment is based on the assumption that the current demonstrable vulnerability in the agricultural sector is the best available basis for assessing the future climatic risks for that sector.
The districts in the study area were ranked according to their relative exposure to flooding, inundation, salinity and storm surge. Figure 106 and Figure 107 illustrate the current and future vulnerability ratings for 2030 and 2050 under A2 and B2 emission scenarios for Ca Mau and Kien Giang respectively.
Figure 106 - Ca Mau Agricultural and Livelihood Vulnerability Ratings
Figure 107 - Kien Giang Agricultural and Livelihood Vulnerability Ratings
-
5
10
15
20
25
30
35
40
Ngoc Hien Nam Can Phu Tan Cai Nuoc Thoi Binh Ca Mau U Minh Dam Doi Tran Van Thoi
2010 Current 2030 A2 2030 B2 2050 A2 2050 B2
-
5
10
15
20
25
30
35
40
Kien Hai PhuQuoc
Ha Tien GiangThanh
U MinhThuong
VinhThuan
TanHiep
ChauThanh
KienLuong
GiongRieng
GoQuao
An Bien AnMinh
RachGia
Hon Dat
2010 Current 2030 A2 2030 B2 2050 A2 2050 B2

Climate Change Impact and Adaptation Study in Mekong Delta – Part A
154 | P a g e
The comparative vulnerabilities of each district are represented geographically in Figure 108 below.
Figure 108 - Agriculture and livelihood vulnerability rankings for current and future climate change scenarios

Climate Change Impact and Adaptation Study in Mekong Delta – Part A
155 | P a g e
This allowed us to build district profiles that show the cross-sectoral interrelationships and gain an understanding how population growth and regional development will drive change in the composition and structure of rural communities, agriculture and industry over time.
Climate and climate variability are therefore important elements of the complex web of factors influencing people’s livelihoods and agricultural systems, and inherently linked and interdependent.
The level of exposure to climate hazards such as flooding, inundation and salinity, together with a heavy dependence on natural resources for their livelihoods make rural communities in both Kien Giang and Ca Mau vulnerable.
However the overall agricultural and livelihood vulnerability for all districts in Kien Giang and Ca Mau were currently assessed as being low to medium – primarily because of the level of control, adaptation and resilience exhibited in all districts except Ngoc Hien;
Further to this, it is expected that this situation will change by 2030, and by 2050 the rating for all mainland districts is expected to increase from medium to high, primarily due to the increase in the level of exposure to flooding and inundation, and the heavy reliance on water based livelihood and agricultural systems.
Rural households in both Kien Giang and Ca Mau to tend rely heavily on climate-sensitive resources such as agricultural land and climate-sensitive activities such as rice farming and aquaculture. Climate change impacts such as flooding and inundation, salinity and storm surge reduce the availability of these local natural resources, limiting the options for rural households that depend on natural resources for consumption or income generation.
The most vulnerable districts are those with a large number of households that are highly dependent on water-reliant farming systems (such as the rice-based system), and are most exposed to river based flooding and inundation. The coastal districts, whilst being adversely affected by salinity and storm surge were assessed as less vulnerable, primarily dyke to the higher level of control and or protection afforded by the sea dyke and sluice gate system.
7.1.3.1 Effects on Agricultural and Livelihood Systems Agriculture is the most important sector for both Kien Giang and Ca Mau, as it underpins not only regional economy, but any loss of production in agricultural sector will effect household livelihoods, income, food security, poverty growth and sustainability in other sectors.
Agriculture plays a critical role in both Kien Giang and Ca Mau in terms of income generation, employment, economic growth and food security. Agricultural production, processing, and related services are by far the important source of income in most districts (approaching 30% of GDP). However, the agricultural sector is highly climate sensitive and potential adverse changes in temperature, precipitation and the frequency of extreme events (for example, droughts, floods, forest fires) as a result of climate change are likely to increase the vulnerability of poor rural communities.
Projected changes in the incidence, frequency, intensity, and duration of climate extremes (for example, heat waves, rainfall events, flooding, and drought), as well as more gradual changes in the average climate will notably threaten their livelihoods and will place a strain on institutions, agricultural production and regional growth. This risk is further exacerbated by the relatively low productivity associated with a lack of capacity to adapt to the present climate in many districts, and this will have long term implications for the viability of the agricultural sector in both provinces.
There are two major household farming systems in the study area, these being:
Irrigated paddy rice-based farming; and
Rice-shrimp farming.
There are also a number of other new and emerging aquaculture based livelihood systems ranging from commercial scale shrimp farming through to mangrove forest aquaculture and penned fisheries system.

Climate Change Impact and Adaptation Study in Mekong Delta – Part A
156 | P a g e
This study focused on the two major systems, as 65% of rural households in Kien Giang and 73% of households in Ca Mau are involved in either of these two systems.
Rice-based Systems
The traditional irrigated paddy rice production is the major livelihood system in the northern and central parts of the region. Other short term crops such as vegetables and annual fruit are increasingly being alternated with the rice crop. Subsidiary vegetables, coconuts, bananas and Melaleuca or Eucalypt tree crops plantings are common together with supplementary freshwater aquaculture and livestock production for home consumption or sale.
The rice-based system is dominant system in inland areas where fresh water is readily available for irrigation, and where salinity is not a significant problem. Typically rice is cropped into the early part of the flood season until the flood level attains the top of the dyke. The inundated fields are then utilised for fishery activities during the peak flooding season. Areas with dykes higher than the mean peak flood level are considered to have year-round flood protection, which allows triple rice cropping to take place.
The wet season crop is established as soon as possible to avoid possible crop damages from flooding more water is required to irrigate the rice during early periods of the crop. Therefore, rice cultivation consumes more water in the triple cropping than in the double cropping patterns.
Due to the importance of rice production to both the region and to national food security, there has been considerable research into the potential impacts of climate change on rice production, particularly with regards to salinity. Some important results are shown in Table 54.
Table 54 - Summary of effects on salinity on rice crops
Description of stress Result Salinity stress at planting time Delayed maturity dates from 5 – 10 days Sustained salinity of over 4 ppt at planting – with no flushing
Mortality of most seedlings
Sustained salinity of over 4 ppt at planting - flushed with fresh before death
20% reduction in yield.
Salinity levels of 3.5 ppt at flowering time 40-60% reduction in yield. (Source: Preston and Clayton 2008)
In considering other aspects of climate change, a number of crop simulation studies have been carried out. A study by IMHEN, simulated crop production with projected climate conditions in 2020, 2050 and 2100. The results shown in Figure 109 suggest that the yield of the sub-region will decrease and that the extent of the reduction varies with season (IMHEN 2009).
Figure 109 - Modelled changes in rice production in 2020, 2050 and 2100. Source: IMHEN 2009.

Climate Change Impact and Adaptation Study in Mekong Delta – Part A
157 | P a g e
In a study by the World Bank, Mekong River Delta Rice yields are projected to decline by 6.3 to 12 percent; yields of other crops are projected to decline by 3.4 to 26.5 percent. The largest yield reduction can take place under any of the three climate scenarios tested, depending on crop type (World Bank 2010).
However, these studies do not incorporate CO2 fertilization and a recent modelling study by CSIRO showed that in the Mekong River Delta while there is slight direct impact of temperature increase on the yield of irrigated rice, this is offset by CO2 concentration in the atmosphere and a net increase in rice yield is projected. The study also found that there is no impact of climate change on the yield of dry season rice if the increased irrigation requirements (11 percent) are met (Mainuddin 2011). The dry season river flows are projected to increase, indicating that these requirements will be met in some saline free areas.
The results of the extreme rainfall modelling indicate that extreme events will increase in intensity which will increase the impacts of localised flooding on rice crops. However it is likely that the impacts will be minimal as the system incorporates localised water management.
Rice-Shrimp Aquaculture Systems
The rice-shrimp farming system is the dominant farming system in those areas in the Delta that are seasonally affected by saline intrusion and salinity. Under this system shrimp and /or fish are produced in the paddy field during the dry-season fallow period, and rice is still cultivated during the wet season when there is an abundance of fresh water. Most of the rice-shrimp farms are typically small scale (100-300 m2) and run by individual families, and occur in the coastal saline-intrusion belt of Giang Thanh, Kien Luong, Hon Dat, An Bien, An Minh, U Minh and Tran Van Thoi Districts.
Over the last three decades, many areas that were previously used for natural aquaculture or mixed cropping / rice paddy land have been converted to commercial shrimp farms, with more than 400,000 hectares in the region currently being devoted to intensive shrimp aquaculture. This is an intensive, brackish water aquaculture system that requires high levels of investment and technological knowhow. However it also offers the potential for very high returns.
There are a number of potential climate impacts specific to the rice shrimp farming system. One impact is a reduced cropping window. Lower than average rainfall at the beginning of the rainy season leads to higher salinity in canals in May and early June, while heavy rainfall late in the season results in low salinity. As flushing of the paddy requires 40 mm to fall in a 10 day period there is the potential for delays in planting the rice crop (because of need to flush out salts) and reduced yields due to end of season salinity damage (Preston and Clayton 2008).
Extreme hot temperature for several days (perceived by farmers as a recent climate change that has impacted on their shrimp farming production) has led to increase in surface heat and large diurnal temperature fluctuation. In the same vein a study conducted by World Fish Centre (2009), found that the hot temperature increased harmful algal blooms that released toxins in the water, reduced dissolved oxygen, spread of pathogens, and potentially threatened fish health and growth rates.
Flooding as a result of canal / river water level rise may cause damage to farm infrastructure including pond dykes, sluice gate and other facilities and can contribute to the spread of disease. In addition, storms with heavy rain and wind can cause rapid changes, in water quality and pond salinity, especially during the transition between wet and dry season – and this has implications for management of the water system in the transitional zones between rice-based and shrimp based aquaculture systems.
The projected increase in the intensity of extreme rainfall events will have a twofold effect as it will increase the amount of localised flooding thus increasing the likelihood of infrastructure damage and it will increase the dilution of pond water.
Disease is a constant threat in shrimp production, with viral diseases and MPP the main problems. Studies have shown that two viruses, White Spot Syndrome Virus WSSV and Monodon Baculovirus (MBV) were found in wild shrimp (Hao et al. 1999). WSSV was found at harvest in most samples from farms especially in ones collected during the rainy season. Mass mortality was associated with presence of WSSV at high prevalence and intensity. (Preston and Clayton 2008).

Climate Change Impact and Adaptation Study in Mekong Delta – Part A
158 | P a g e
Early April 2011 saw large scale baby shrimp mortality across the Delta. Tra Vinh lost 85 million of the 812 million larvae stocked with an estimated loss of 4.2 billion VND. Soc Trang lost 2,000 ha of the estimated 16,000 that were stocked. Bac Lieu lost 1090 ha of 10,000 ha stocked. All methods of shrimp farming were affected; extensive, intensive and semi intensive (Vietnam News April 23, 2011). Deaths were blamed on high diurnal temperature differences and/or unseasonable heavy rainfall events, both of which may increase in frequency in future climate scenarios. As disease treatment is not effective, the current focus of disease control is prevention which focuses on maintaining seed quality; shrimp feed concentrate quality and water quality. A disease monitoring system has been in operation over last two years. Disease management involves rapid reporting of problems with salinity levels and disease incidence. Growing mangroves intermingled with ponds was found to reduce the occurrence of diseases.
An economic study of potential impacts of climate change on shrimp farming was carried out by The World Bank, Figure 110. The model indicates that the cost of water pumping in semi-intensive/intensive systems will increase significantly. The total cost of adaptation is estimated at an average of $130 million per year from 2010–50, which is equivalent to 2.4 percent of total costs. Water exchange in extensive systems is usually driven by tidal exchange rather than pumping of water thus reducing the expected increase in costs for this system. The direct impact of climate change on net income from both extensive and (semi-) intensive shrimp farming is projected to be negative, more strongly so for extensive farming. Without adaptation, the net income from (semi-) intensive shrimp production may fall by 130 million VND per ha in 2020. This reduction may increase to 950 million VND/ha in 2050. Again, adaptation to climate change is critical for the future success of the industry. Since the industry is both capital intensive and growing rapidly, adaptation costs are likely to be borne by operators (World Bank 2010).
Figure 110 - Modelled reduction in net income from shrimp production due to climate change, World Bank (2010).
7.1.3.2 Effects on Irrigation Systems In the past, flood water maintained in back swamp areas supplemented freshwater flow in the main canals during the early dry season. For the last three decades, the development of canal systems and the expansion and intensification of the rice culture have reduced the flood-plain water storage, particularly in the Plain of Reeds and the Long Xuyen Quadrangle, while increasing the abstraction of the discharge in the upstream areas.
The results of modelling work by ACIAR (Nhan et al. 2007) to estimate the irrigation requirements of the different rice crops are shown in Figure 111. The high evaporation rate in the dry season means that nearly all of the water required must be supplied from the canal system. In another modelling study, IMHEN used the IQQM model (Integrated Quantity and Quality Model) to predict the water use of

Climate Change Impact and Adaptation Study in Mekong Delta – Part A
159 | P a g e
agriculture in the Mekong Delta. The results for the region of the Delta that is west of the Hau River are shown in Figure 18. Modelled monthly flow in the Hau River for the driest three months of dry years for the A2 climate change scenario are also shown. The figure shows that projected demand approaches the value of the entire flows of the Hau River, which is far more than the volume that flows through the western Delta canals. The climate models predict that future increases in demand will be offset by increased flows.
Figure 111 - Current and projected monthly water use and projected average flow for the Hau River in the 3 driest months, data from Nhan et al. (2007) and IMHEN (2010).
In another study, calculations of irrigation water requirement for the whole Mekong Delta were 1000 - 2300 Gl per month in the 1990-1991 period, with a projected increase demand of 2300 – 2800 Gl per month by 2010 (Nhan et al. 2009).
Table 55 - Estimated water requirements and water productivity of rice production in the Mekong Delta (kilograms of rice for every m3 of water input)
Parameters Dry Season Wet Season 2nd Wet Season Total water requirements (m3 ha-1) 8080 7520 6500 Rain water available (m3 ha-1) 160 4000 7000 Irrigation requirements (m3 ha-1) 7920 3520 -500 Average yields of rice (t ha-1) 6 4.3 4 Water productivity kg m-3 water 0.8 1.2 - Source: Based on average rainfall and cropping season data collected in 2003 and 2004 from Can Tho and Vinh Long. (From Nhan et al. 2009)
For aquaculture, semi-intensive and intensive farming systems consume a large volume of water through water exchange in order to dilute metabolites within ponds or cages. Consequently, the farming practices discharge a large quantity of effluents, which might result in algal blooms in surface water bodies in surrounding and downstream areas, in turn constraining fish culture, domestic water supplies and environment protection (Nhan et al. 2009).
The projected intensive water demands in the upper and mid Delta have implications for dry season water availability and related salinity intrusion in the coastal zone. A clear trade-off occurs between the expansion of dry season rice production upstream and downstream impacts of salinity.
7.1.4 Industry and Energy Vulnerability As previously mentioned, Kien Giang and Ca Mau are essentially rural, with agriculture being the dominant industry. Primary production accounts for 41% of GDP in Kien Giang and agriculture, aquaculture, fisheries and forestry are the largest primary sectors.

Climate Change Impact and Adaptation Study in Mekong Delta – Part A
160 | P a g e
Over the last 25 years, the economies of Ca Mau and Kien Giang have changed dramatically, with the rapid increase in industrial production and a rapid uptake of new economic activities such as commercial aquaculture and seafood production, primarily due the Government’s economic restructuring initiatives in the area. Industry, construction and service sectors have grown very quickly and together now account for 59% of GDP in the study area.
However much of the industry is either involved in processing primary products such as rice, aquatic products, and sugar or provides agricultural support services such as fertiliser production and machinery servicing. The rapid expansion of the industrial sector in the Kien Giang and Ca Mau has been due to growth in infrastructure, mining, oil production, construction and opening of trade policies.
Today, in coastal economies of Ca Mau and Kien Giang’s multi-sectoral activities are strongly interwoven with the backward and forward linkages in numerous value chains, and the economies of both provinces encompass a range of maritime and terrestrial industries, including the following main sectors:
Agriculture (rice);
Fisheries (catch and aquaculture);
Sea transport and deep-sea ports;
Natural gas exploitation and power generation; and
Tourism.
As highlighted in the previous section, agriculture (including aquaculture, fisheries and associated primary industry), are among the most climate-sensitive of all sectors, and climate change will have flow on effect and secondary impact on primary industry in the study area.
For the purposes of this study ‘industry and energy vulnerability’ refers to the vulnerability of industrial and energy infrastructure and services to the effects of climate change, and recognises that industry and energy generation are important drivers for the economic development, growth and sectoral transition in the delta necessary to build resilience and adaptive capacity into the future.
In this context, industry and energy infrastructure and services are considered to be vulnerable if there is a high probability of loss or damage from climate change from which there is a high probability of it not recovering quickly or fully because the effects are either irreversible or the opportunities of recouping the losses are negligible.
This study measured industry and energy vulnerability by combining data and information from the district and sectoral surveys as shown in Table 56 and Table 57. The indicators covered aspects of: human assets (% of population working in Industry, households reliant on industry); natural assets (diversity of industrial development, power generation capacity); economic (sectoral productivity Average Annual GDP per household contribution from Industry); and financial capital (investment levels, household connections, levels of service etc.).
Measures of exposure to climate change impacts can be estimated using the application of GIS to map the projected length of energy infrastructure of each district that is impacted by each hazard. This mapping can be carried out for each time period and climate scenario. However, estimates of the level of measures that are in place to protect existing infrastructure are also required. Accordingly expert opinion was incorporated into the vulnerability rating as a weighting factor for each time slice; baseline, 2030 and 2050. Knowledge of the nature, location and extent of industrial zones, energy generation and power transmission infrastructure was cross correlated with maps and data from the government agencies and GIS database. The hazard maps from the modelling exercises were used to assess the risk to industry and energy due to saline intrusion as a result of SLR, flooding and inundation, and inundation from storm surge.

Climate Change Impact and Adaptation Study in Mekong Delta – Part A
161 | P a g e
Table 56 - Comparative overview of status of major industry and energy Infrastructure in Ca Mau.
Energy & Industry Vulnerability Baseline Indicators District
% Population Working in
Industry
GDP per Household
contributed by Industry
% off-Farm Income
Number of Factories
Number of Different Industries
Ca Mau 0.77 11,529,938 94% 1,439 2 Cai Nuoc 0.11 398,660 11% 14 1 Dam Doi 0.27 435,111 11% 1 3 Nam Can 0.55 175,584 3% 2 2 Ngoc Hien 0.34 363,971 11% 0 2 Phu Tan 0.14 1,572,365 45% 545 2 Thoi Binh 0.18 786,358 34% 0 2 Tran Van Thoi 0.28 175,0976 57% 1 3 U Minh 0.25 256,289 11% 2 3
Table 57 - Comparative overview of status of major industry and energy Infrastructure in Kien Giang.
Energy & Industry Vulnerability Baseline Indicators District
% Population Working in
Industry
GDP per Household
contributed by Industry
% off-Farm Income
Number of Factories
Number of Different Industries
Rach Gia 0.86 3,024354 86% 1,000 4 Ha Tien 0.74 2,617,841 78% 1 4 An Bien 0.26 2,590,969 72% 1 4 An Minh 0.33 1,368,219 28% 10 4 Chau Thanh 0.21 1,849,385 70% 6 5 Giang Thanh 0.17 687,500 15% 0 2 Giong Rieng 0.24 1,322,965 0% 1 2 Go Quao 0.09 3,077,822 0% 10 3 Hon Dat 0.27 1,497,001 30% 792 5 Kien Hai 0.16 3846,660 0% 0 4 Kien Luong 0.48 2,455,398 50% 10 5 Phu Quoc 0.61 2,845,897 83% 535 3 Tan Hiep 0.11 1,741,494 35% 0 4 U Minh Thuong 0.16 0 36% 0 3 Vinh Thuan 0.16 0 22% 0 4
An overview of the exposure to hazards and the status of control measures to protect industry and energy infrastructure is shown in Table 58and Table 59. The Tables provide a comparative overview of status of major industry and energy infrastructure in Kien Giang and Ca Mau, in terms of the levels of exposure and controls in place. The level of control for flooding and inundation for 14 out of 24 districts was assessed as inadequate, and improvements were desirable in view of economic development (medium term). Upgrading of flood control facilities are needed in Ca Mau, U Minh, Rah Gia, Chau Thanh, Kien Luong, Phu Tan, Tran Van Thoi, Ha Tien, An Minh, Hon Dat, and An Bien districts. Similarly, with regard to exposure to storm surge, upgrading of coastal protection structures are needed in Ngoc Hien, Tran Van Thoi, Ha Tien, Kien Hai, Kien Luong and Phu Quoc.
In addition to this that whilst salinity is a widespread problem in the study area, it was assessed that for the industry and energy sectors that the current levels of control were adequate, now and in the near future (around 10 years), but adaptation would be needed in view of climate change (long term). A summary of the vulnerability of specific industry assets is shown in Appendix 2 while the vulnerability of specific energy assets is shown in Appendix 2.

Climate Change Impact and Adaptation Study in Mekong Delta – Part A
162 | P a g e
Table 58 - Overview of exposure to climate change impacts and comparative status of control measures for major industry infrastructure.
District Exposure to Flood (%) Control
Measures
Exposure to Salinity (%) Control Measures
Exposure to Storm Surge (%) Control Measures
Current 2030 2050 Current 2030 2050 Current 2030 2050
Ca
Mau
Pro
vinc
e
Ca Mau 19% 52% 71% ••• 100% 100% 100% •• 0% 0% 0% • Cai Nuoc 47% 70% 82% •• 100% 100% 100% • 0% 0% 0% • Dam Doi 13% 28% 36% •• 100% 100% 100% • 0% 0% 1% • Nam Can 36% 47% 58% • 100% 100% 100% • 1% 5% 10% •• Ngoc Hien 22% 29% 39% • 100% 100% 100% • 60% 90% 100% •••• Phu Tan 36% 46% 62% ••• 100% 100% 100% • 1% 1% 2% •• Thoi Binh 6% 19% 35% •• 100% 100% 100% • 0% 0% 0% • Tran Van Thoi 42% 58% 79% ••• 100% 100% 100% • 1% 1% 1% •••• U Minh 9% 22% 42% •••• 100% 100% 100% • 0% 1% 1% •
Kie
n G
iang
Pro
vinc
e
Rach Gia 70% 75% 81% ••• 95% 100% 100% •• 1% 2% 2% •• Ha Tien 64% 67% 70% ••• 100% 100% 100% •• 6% 10% 13% •••• An Bien 38% 69% 81% ••• 90% 100% 100% •• 1% 1% 2% ••• An Minh 9% 39% 64% •• 99% 100% 100% • 1% 1% 1% •• Chau Thanh 72% 82% 87% ••• 100% 100% 100% •• 0% 1% 1% ••• Giang Thanh 98% 98% 99% •• 90% 100% 100% •• 0% 0% 0% • Giong Rieng 83% 89% 94% •• 25% 20% 20% • 0% 0% 0% • Go Quao 61% 86% 92% •• 70% 80% 85% •• 0% 0% 0% • Hon Dat 96% 97% 98% ••• 50% 20% 20% •• 0% 1% 1% •• Kien Hai 0% 0% 0% • 0% 0% 0% • 12% 15% 18% •••• Kien Luong 89% 89% 91% •• 100% 75% 70% •• 1% 2% 2% •••• Phu Quoc 0% 0% 0% • 0% 0% 0% • 1% 1% 1% •••• Tan Hiep 91% 92% 98% •• 60% 20% 20% •• 0% 0% 0% • U Minh Thuong 17% 34% 52% • 100% 100% 100% •• 0% 0% 0% • Vinh Thuan 14% 45% 68% • 100% 100% 100% •• 0% 0% 0% •
• Adequate, now and in the near future (around 10 years) •• Adequate, but adaptation needed in
view of climate change (long term) ••• Improvements are desirable
in view of economic development (medium term)
•••• Rehabilitation or
upgrading urgently needed

Climate Change Impact and Adaptation Study in Mekong Delta – Part A
163 | P a g e
Table 59 - Overview of exposure to climate change impacts and comparative status of control measures for major energy infrastructure.
District
Exposure to Flood (%) Control Measures
Exposure to Salinity (%) Control Measures
Exposure to Storm Surge (%) Control Measures Current 2030 2050 Current 2030 2050 Current 2030 2050
Ca
Mau
Pro
vinc
e
Ca Mau 19% 52% 71% ••• 100% 100% 100% • 0% 0% 0% • Cai Nuoc 47% 70% 82% •• 100% 100% 100% • 0% 0% 0% • Dam Doi 13% 28% 36% •• 100% 100% 100% • 0% 0% 1% •• Nam Can 36% 47% 58% •• 100% 100% 100% • 1% 5% 10% •• Ngoc Hien 22% 29% 39% •• 100% 100% 100% • 60% 90% 100% •••• Phu Tan 36% 46% 62% • 100% 100% 100% • 1% 1% 2% •• Thoi Binh 6% 19% 35% • 100% 100% 100% • 0% 0% 0% • Tran Van Thoi 42% 58% 79% • 100% 100% 100% • 1% 1% 1% •• U Minh 9% 22% 42% •••• 100% 100% 100% • 0% 1% 1% ••
Kie
n G
iang
Pro
vinc
e
Rach Gia 70% 75% 81% ••• 95% 100% 100% • 1% 2% 2% •• Ha Tien 64% 67% 70% •• 100% 100% 100% • 6% 10% 13% ••• An Bien 38% 69% 81% •• 90% 100% 100% • 1% 1% 2% •• An Minh 9% 39% 64% • 99% 100% 100% • 1% 1% 1% •• Chau Thanh 72% 82% 87% ••• 100% 100% 100% • 0% 1% 1% •• Giang Thanh 98% 98% 99% •• 90% 100% 100% • 0% 0% 0% • Giong Rieng 83% 89% 94% •• 25% 20% 20% • 0% 0% 0% • Go Quao 61% 86% 92% • 70% 80% 85% • 0% 0% 0% • Hon Dat 96% 97% 98% •• 50% 20% 20% • 0% 1% 1% •• Kien Hai 0% 0% 0% • 0% 0% 0% • 12% 15% 18% ••• Kien Luong 89% 89% 91% ••• 100% 75% 70% • 1% 2% 2% ••• Phu Quoc 0% 0% 0% • 0% 0% 0% • 1% 1% 1% •• Tan Hiep 91% 92% 98% •• 60% 20% 20% • 0% 0% 0% • U Minh Thuong 17% 34% 52% • 100% 100% 100% • 0% 0% 0% • Vinh Thuan 14% 45% 68% • 100% 100% 100% • 0% 0% 0% •
• Adequate, now and in the near future (around 10 years) •• Adequate, but adaptation needed in
view of climate change (long term) ••• Improvements are desirable
in view of economic development (medium term)
•••• Rehabilitation or
upgrading urgently needed

Climate Change Impact and Adaptation Study in Mekong Delta – Part A
164 | P a g e
Figure 112 – Energy and Industry vulnerability rankings for current and future climate change scenarios

Climate Change Impact and Adaptation Study in Mekong Delta – Part A
165 | P a g e
Vulnerability in the energy and industry sector was derived from the indicators shown in Table 56 and Table 57 together with knowledge of the nature, location and extent of industrial zones, energy generation and power transmission infrastructure.
This allowed us to build district profiles that show the cross-sectoral interrelationships and gain an understanding how population growth and regional development will drive change in the composition and structure of the industry and energy sector in the study area over time. The district profile information is shown geographically in Figure 112.
The Figure shows that in 2010, industry and energy vulnerability for all districts in both Kien Giang and Ca Mau was considered to be low to medium. However, this is expected to increase by 2030, and by 2050 the rating for six districts in Ca Mau (Ca Mau City, Tran Van Thoi, Phu Tan, Thoi Binh, Ngoc Hien and Dam Doi), and four districts in Kien Giang (Tan Hiep, An Minh, An Bien, Kien Luong, Giong Rieng, Chau Tanh, Hon Dat and Rach Gia city) are expected to increase to medium and high, primarily due to the exposure of surface water resources to sea level rise, and the combined effects of flooding, saline intrusion and storm surge.
The most vulnerable districts are those with a large number of households that are highly dependent on local industry for employment or income, and are most exposed to SLR, flooding, inundation and extreme events and their effects on industrial areas, factories, and power generation and supply infrastructure and services. The coastal districts, whilst being adversely affected by salinity and storm surge were assessed as less vulnerable, primarily due to the higher level of control and or protection afforded by the sea dyke and sluice gate system.
Extreme weather such as a typhoon could cause extensive damage to power systems, and as typhoons often occur at the end of the wet season (when physical access to transmission and distribution system assets is problematic) it could be some months before power supplies are fully restored. This in turn could have secondary implications for aquaculture and fisheries processing and all other forms of industry, in particular from whether the industry would need to shut down or it would need to run expensive diesel generators for weeks on end. Key industrial outputs such as ice would therefore be unavailable or far more costly to produce.
7.1.4.1 Effects on Secondary Industry As previously highlighted, processing of agricultural and seafood products make up the largest industrial sector in both provinces, and includes seafood processing and rice processing.
All the seafood processing plants are located on water ways, and are typically located only 0.5 to 1.5 m above water level. Some plants are already experience flooding in spring tides in the wet season, are considered to be highly vulnerable to sea level rise (SLR) effects. Some industrial zones, which have a high enough density of existing factories, could almost certainly be cost-effectively protected. A good example of this promising potential for the defence of a whole industrial zone is the Tac Cau Port (near Rach Gia in Kien Giang Province) seafood processing area (recently designated as a formal industrial zone) where there are around 20 seafood processing plants in one cluster. Other clusters, such as the five fish meal plants next to each other in Binh Anh Commune near Tac Cau, are low lying (only about 0.8 to 1.5 m above water level), would be difficult to defend against any large sea level rise, and have a capital investment value of only around 2 months revenue, so these plants would probably be more cost-effective to relocate if there was significant sea level rise.
In addition to this, many of the new industrial zones are also are very low, with elevations of around 0.5 to 1.5 m above water level. Inevitable these sites will either need to be raised or abandoned. A number of new industrial zones are being developed in very low lying areas, for example the new industrial zone near Ha Tien in Kien Giang province that is currently being developed in a swamp next to the main Ha Tien to Rach Gia canal.
The lack of provision for future climate effects, and in particular to sea level rise, is not just confined to new industrial zones. The site of the proposed new $7 billion Kien Luong power plant complex is

Climate Change Impact and Adaptation Study in Mekong Delta – Part A
166 | P a g e
likewise to be located on an area of reclaimed land offshore from the mangrove sea boundary, and it would appear that no provision has been made for SLR at this stage.
7.1.4.2 Effects on Large Industry and Power Generation The Ca Mau gas-power-fertiliser-gas processing complex with its associated gas distribution centre and upcoming gas processing plant is the largest industrial complex in the study area. The plant is located in Ca Mau on the mainstream river. The plant is approximately 2.8 m above water level, and hence is not particularly at risk to sea level rise in its remaining 20 year life (which is also the life of the existing and upcoming Block B gas fields), and is defensible through the construction of flood protection structured . However, the existing power station cooling towers already use saline river water in the dry season, so sea level rise or decreased dry season rainfall leading to greater cooling tower salinity is expected to only lead to a minor increase in existing cooling tower corrosion rates. Increases in air temperatures will have a very minor impact in overall power plant efficiency, and will be partly balanced by improved cooling tower effectiveness and hence fan power loads from the expected reduced dry season humidity. In addition to this the gas pipelines may face corrosion, but this is not expected to be a major issue over their remaining 20 year design life.
There are also are the large cement and the smaller brick making plants in Kien Giang province. It was assessed that neither of the industries were under threat.
Individual plants may experience some production loss due to localised flooding in the future as the intensity of extreme events increases.
7.1.4.3 Effects on the Power Transmission System The power transmission system in the study comprises of: the 500 kV very high voltage power line connection to the national grid; the 110 kV high voltage provincial distribution system; and the 240 V household distribution system.
The 110 kV high voltage system uses steel towers that are mounted on concrete foundations that are 1.0 to 1.5 m above ground level and as a result are considered to be moderately vulnerable to climate change effects, including inundation, salinity, high winds and typhoons.
At the district level 22/12.7 kV and 400/220V levels, all power lines use single concrete poles and pole mounted transformers, so they are not particularly vulnerable to flooding, inundation, and SLR although they may be slightly vulnerable to increased corrosion as a result of salinity.
7.1.5 Urban Settlements and Transport Vulnerability Urban settlements and transportation vulnerability refers to the vulnerability of urban settlements and transportation to the effects of climate change, and recognises the need to protect people and property, and the importance of the transport system to support and promote regional development and economic growth in the Mekong Delta.
In this context, urban settlement and transportation infrastructure are considered to be vulnerable if there is a high probability of loss or damage from climate change from which there is a high probability of it not recovering quickly or fully because the effects are either irreversible or the opportunities of recouping the losses are negligible.
This study measured urban settlement and transportation vulnerability by combining data and information from the district and sectoral surveys, as shown in Table 60 and Table 61. The indicators covered: human assets (% of urban population); natural assets (% urban area); economic (value of goods shipped); and financial capital (urban infrastructure and levels of service) together with the nature, location and extent of the transport network and infrastructure.

Climate Change Impact and Adaptation Study in Mekong Delta – Part A
167 | P a g e
Table 60 – Ca Mau - Urban Settlement and Transport Vulnerability Baseline Indicators.
Urban Settlements & Transport Vulnerability Baseline Indicators
District Urban Area
(ha) % Urban Water
Supply Sewer/Septic
Tank Major Roads
(km) Ca Mau 1330.37 67% 100% 70% 42.35
Cai Nuoc 672.16 26% 96% 30% 59.96 Dam Doi 930.06 5% 95% 45% 26.39 Nam Can 526.44 28% 99% 99% 11.77
Ngoc Hien N/A 6% 90% 40% 0.08 Phu Tan N/A 14% 100% 5% 20.36
Thoi Binh 543.6 8% 95% 10% 66.31 Tran Van Thoi 835.51 23% 89% 10% 64.52
U Minh 825.85 2% 95% 50% 115.05
Table 61 – Kien Giang - Urban Settlement and Transport Vulnerability Baseline Indicators.
Urban Settlements & Transport Vulnerability Baseline Indicators
District Urban Area
(ha) % Urban Water
Supply Sewer/Septic
Tank Major Roads
(km) Rach Gia 1368.75 100% 85% 70% 47.17 Ha Tien 237.56 100% 100% 100% 46.32 An Bien 771.72 9% 67% 24% 148.56 An Minh 866.15 5% 38% 8% 167.30
Chau Thanh 931.64 14% 99% 90% 139.16 Giang Thanh 1423 0% 10% 8% 55.52 Giong Rieng 1341.69 9% 32% 40% 187.79
Go Quao 1419.1 7% 30% 40% 121.21 Hon Dat 1366.58 18% 100% 40% 243.72 Kien Hai 99.04 0% 5% 46% 0.00
Kien Luong 1022.68 43% 40% 40% 89.32 Phu Quoc 813.79 57% 65% 99% 0.00 Tan Hiep 935.29 14% 40% 40% 159.80
U Minh Thuong 2354.99 0% 80% 6% 99.87 Vinh Thuan 616.44 15% 96% 87% 72.06
Measures of exposure to climate change impacts can be estimated using the application of GIS to map the projected length of transport infrastructure of each district that is impacted by each hazard. This mapping can be carried out for each time period and climate scenario. However, estimates of the level of measures that are in place to protect existing urban infrastructure are also required. Accordingly expert opinion was incorporated into the vulnerability rating as a weighting factor for each time slice; baseline, 2030 and 2050. Table 62 and Table 63outline the exposure of each district to climate hazards and rate the status of control measures to protect the Urban and transport infrastructure respectively.

Climate Change Impact and Adaptation Study in Mekong Delta – Part A
168 | P a g e
Table 62 - Overview of exposure to climate change impacts and comparative status of control measures for urban infrastructure.
District
Exposure to Flood (%) Control Measures
Exposure to Salinity (%) Control Measures
Exposure to Storm Surge (%) Control Measures Current 2030 2050 Current 2030 2050 Current 2030 2050
Ca
Mau
Pro
vinc
e
Ca Mau 19% 52% 71% •••• 100% 100% 100% • 0% 0% 0% • Cai Nuoc 47% 70% 82% •• 100% 100% 100% •• 0% 0% 0% • Dam Doi 13% 28% 36% •• 100% 100% 100% •• 0% 0% 1% ••• Nam Can 36% 47% 58% •••• 100% 100% 100% •• 1% 5% 10% ••• Ngoc Hien 22% 29% 39% •• 100% 100% 100% •• 60% 90% 100% •••• Phu Tan 36% 46% 62% •• 100% 100% 100% •• 1% 1% 2% ••• Thoi Binh 6% 19% 35% •• 100% 100% 100% •• 0% 0% 0% • Tran Van Thoi 42% 58% 79% •• 100% 100% 100% •• 1% 1% 1% •••• U Minh 9% 22% 42% •• 100% 100% 100% •• 0% 1% 1% •••
Kie
n G
iang
Pro
vinc
e
Rach Gia 70% 75% 81% •••• 95% 100% 100% •• 1% 2% 2% •••• Ha Tien 64% 67% 70% ••• 100% 100% 100% • 6% 10% 13% •••• An Bien 38% 69% 81% •• 90% 100% 100% •• 1% 1% 2% ••• An Minh 9% 39% 64% •• 99% 100% 100% •• 1% 1% 1% ••• Chau Thanh 72% 82% 87% •• 100% 100% 100% • 0% 1% 1% •• Giang Thanh 98% 98% 99% •• 90% 100% 100% •• 0% 0% 0% • Giong Rieng 83% 89% 94% •• 25% 20% 20% • 0% 0% 0% • Go Quao 61% 86% 92% •• 70% 80% 85% •• 0% 0% 0% • Hon Dat 96% 97% 98% •• 50% 20% 20% •• 0% 1% 1% ••• Kien Hai 0% 0% 0% • 0% 0% 0% • 12% 15% 18% •••• Kien Luong 89% 89% 91% •• 100% 75% 70% •• 1% 2% 2% ••• Phu Quoc 0% 0% 0% • 0% 0% 0% • 1% 1% 1% •••• Tan Hiep 91% 92% 98% •• 60% 20% 20% •• 0% 0% 0% • U Minh Thuong 17% 34% 52% •• 100% 100% 100% •• 0% 0% 0% • Vinh Thuan 14% 45% 68% •• 100% 100% 100% •• 0% 0% 0% •
• Adequate, now and in the near future (around 10 years) •• Adequate, but adaptation needed in
view of climate change (long term) ••• Improvements are desirable
in view of economic development (medium term)
•••• Rehabilitation or
upgrading urgently needed

Climate Change Impact and Adaptation Study in Mekong Delta – Part A
169 | P a g e
Table 63 - Overview of exposure to climate change impacts and comparative status of control measures for transport infrastructure.
District
Exposure to Flood (%) Control Measures
Exposure to Salinity (%) Control Measures
Exposure to Storm Surge (%) Control Measures Current 2030 2050 Current 2030 2050 Current 2030 2050
Ca
Mau
Pro
vinc
e
Ca Mau 19% 52% 71% •• 100% 100% 100% • 0% 0% 0% • Cai Nuoc 47% 70% 82% • 100% 100% 100% • 0% 0% 0% • Dam Doi 13% 28% 36% • 100% 100% 100% • 0% 0% 1% •• Nam Can 36% 47% 58% • 100% 100% 100% • 1% 5% 10% • Ngoc Hien 22% 29% 39% • 100% 100% 100% • 60% 90% 100% •••• Phu Tan 36% 46% 62% • 100% 100% 100% • 1% 1% 2% •• Thoi Binh 6% 19% 35% • 100% 100% 100% • 0% 0% 0% • Tran Van Thoi 42% 58% 79% • 100% 100% 100% • 1% 1% 1% •• U Minh 9% 22% 42% • 100% 100% 100% • 0% 1% 1% ••
Kie
n G
iang
Pro
vinc
e
Rach Gia 70% 75% 81% •• 95% 100% 100% • 1% 2% 2% •••• Ha Tien 64% 67% 70% •• 100% 100% 100% • 6% 10% 13% •••• An Bien 38% 69% 81% • 90% 100% 100% • 1% 1% 2% •• An Minh 9% 39% 64% • 99% 100% 100% • 1% 1% 1% •• Chau Thanh 72% 82% 87% •• 100% 100% 100% • 0% 1% 1% •• Giang Thanh 98% 98% 99% •• 90% 100% 100% • 0% 0% 0% • Giong Rieng 83% 89% 94% •• 25% 20% 20% • 0% 0% 0% • Go Quao 61% 86% 92% •• 70% 80% 85% • 0% 0% 0% • Hon Dat 96% 97% 98% •• 50% 20% 20% • 0% 1% 1% •• Kien Hai 0% 0% 0% • 0% 0% 0% • 12% 15% 18% ••• Kien Luong 89% 89% 91% •• 100% 75% 70% • 1% 2% 2% • Phu Quoc 0% 0% 0% •• 0% 0% 0% • 1% 1% 1% ••• Tan Hiep 91% 92% 98% •• 60% 20% 20% • 0% 0% 0% • U Minh Thuong 17% 34% 52% •• 100% 100% 100% • 0% 0% 0% • Vinh Thuan 14% 45% 68% •• 100% 100% 100% • 0% 0% 0% •
• Adequate, now and in the near future (around 10 years) •• Adequate, but adaptation needed in
view of climate change (long term) ••• Improvements are desirable
in view of economic development (medium term)
•••• Rehabilitation or
upgrading urgently needed

Climate Change Impact and Adaptation Study in Mekong Delta – Part A
170 | P a g e
Knowledge of the location urban areas and transport infrastructure was cross correlated with maps and data from the government agencies and GIS database. The hazard maps from the modelling exercises were used to assess the risk to urban areas and transport infrastructure due to saline intrusion as a result of SLR, flooding and inundation, and inundation from storm surge. An overview of the exposure to hazards and the status of control measures to protect urban areas are shown in Table 62and the status of control measures to protect transport infrastructure are shown in Table 63.
The overall urban settlement and transportation vulnerability for all districts in Kien Giang and Ca Mau were assessed as being low to medium – primarily because of the level of control, adaptation and resilience exhibited in all districts. However the coastal cities of Rach Gia and Ha Tien, the island districts and the poorly protected villages on Ngoc Hien all require improvements to the control measures that are currently in place.
Further to this, it is expected that this situation will change by 2030, and by 2050 the rating for all mainland districts is expected to increase, primarily due to the increase in the level of exposure to flooding and inundation, and the heavy reliance on water based livelihood and agricultural systems.
Using the indicators and measures provided above it is possible to estimate or rate the relative vulnerability of if all these indices at the district level. To do this the relative vulnerability of each district to climate change was ranked in relation to their ‘comparative exposure’, and then secondly by rating their ‘respective sensitivity’ (low to very high) to current and future hazards projections generated from our hydrological modelling and coastal modelling work, and thirdly by applying weighting factor that incorporates the extent of existing control measures.
The overall vulnerability for urban settlements and transportation Kien Giang and Ca Mau province was assessed as a function of the above key indicators and the existing and projected climate exposure and hazard for sea level rise, inundation and salinity. The assessment is based on the assumption that the current demonstrable vulnerability in the agricultural sector is the best available basis for assessing the future climatic risks for that sector. Figure 113 illustrates the current and future vulnerability ratings for 2030 and 2050 under A2 and B2 emission scenarios for Ca Mau and Kien Giang.
The most vulnerable districts are those with high levels of urban infrastructure, buildings and urban households, which are highly exposed to flooding, inundation and storm surge. The coastal districts, whilst being adversely affected by salinity were assessed as less vulnerable, primarily dyke to the higher level of control and or protection afforded by the sea dyke and sluice gate system.
7.1.5.1 Effects on Urban Settlements and Households Whist this study has highlighted the strong vulnerability of rural populations in the study area to climate change, our assessment clearly shows that the cities of Rach Gia and Ca Mau, and the other large towns of Ha Tien and Kien Luong face major vulnerabilities themselves, with the potential to effect large numbers of people and households.
Although urban areas are often assumed to be less vulnerable to impacts due to higher rates of development, there are number of satellite semi-urban areas in both Kien Giang with large populations of poor, often migrant or unregistered populations that work in the major urban centres (such as Tran Van Troi, Cai Nguoc and Chau Thanh, and who are just as vulnerable, if not more so, than rural farming populations outside of urban areas.
Furthermore, in terms of overall numbers of affected peoples, the population density of urban areas means that while the overall percentage of affected people may be lower in urban than rural areas, the total affected numbers will likely be higher in urban areas.
The built environment of cities can mean more exposure to climate hazards; especially the number of houses located in areas with poor drainage that are subject to flooding on a regular basis. In both Rach Gia and to a lesser extent in Ca Mau, a great deal of building has taken place on what used to be wetlands. This affects the ability of surrounding lands to drain, particularly below 1 meter.

Climate Change Impact and Adaptation Study in Mekong Delta – Part A
171 | P a g e
Figure 113 – Urban Settlements and Transport vulnerability rankings for current and future climate change scenario.

Climate Change Impact and Adaptation Study in Mekong Delta – Part A
172 | P a g e
The built environment of cities can mean more exposure to climate hazards; especially the number of houses located in areas with poor drainage that are subject to flooding on a regular basis. In both Rach Gia and to a lesser extent in Ca Mau, a great deal of building has taken place on what used to be wetlands. This affects the ability of surrounding lands to drain, particularly below 1 meter.
In Rach Gia City a SLR of just 30 cm in 2050 could lead to a flooding of up to 76 % of the land area, with the potential to affect more than 50,000 households. The situation in Ca Mau whilst not as severe is still concerning with up to 67% of the city land area potentially being inundated and 40,000 households effected.
7.1.5.2 Effects on Buildings Whilst the predominant effect of climate change on urban areas in Kien Giang and Ca Mau will be on building structures by storm events other factors affecting buildings are; coastal erosion, local flooding and inundation, storm surge flooding, sea level rise and wind damage associated with typhoons. Building materials are also affected by increased corrosion as a result of increased temperatures and humidity and structural fatigue resulting from the intensity of storm events, both of these impacts lead to reduced asset life. Any such alterations to asset life will increase maintenance requirements and renewal of assets. Residential buildings located along canals are especially prone to flooding and storm damage due to their exposed location.
Currently, the majority of buildings in Ca Mau and Kien Giang are not designed to withstand high intensity typhoons or cyclones. This together with the lack of cyclone shelters, and the fact that most other urban facilities such as the airport terminals, ferry terminals, ports and harbour facilities not being cyclone rated is an area of primary concern.
7.1.5.3 Effects on Urban Drainage Given the shallow gradients and the low-lying terrain just above normal tidal/river levels, designing an effective drainage system for such urban areas is extremely complex. The problem may have been compounded by limited topographical information at the time of construction meaning that actual drain placing may not always have been ideal. In addition to struggling to satisfy minimum slopes the system also needed to be designed with smooth falls to avoid drops in velocity to enable sediment to be carried through the system.
These difficulties are further compounded in practice by drain blockages of rubbish and other obstructions. In the smaller urban areas with less complex drainage systems these obstacles are usually flushed out during heavy rainfall. In the larger areas, especially Ca Mau City, uncontrolled dumping of solid waste is a major concern (despite the presence of a formal collection service) and remains a potential health hazard. Generally, there is also little maintenance of drains, whether through regular cleaning or replacing broken covers.
The projected increase in the intensity of extreme rainfall events is most likely to be felt in the urban sector as urban drainage systems have trouble coping with the current level of high rainfall event. Very large multiday events with long return periods (i.e. 1 in 100 yr floods) will overwhelm the current drainage system especially with the compromised flow volumes due to rubbish. Extensive localised flooding in urban areas will also have a knock on effect on the waste management and water supply systems.
7.1.5.4 Effects on Urban Solid Waste Management Only one urban area (Ha Tien City) in the two Provinces has a controlled solid waste dump site. In all other areas waste is dumped in officially recognised or informal/”temporary” sites. At the moment volumes involved are quite low but there are still serious and growing issues of objectionable odours, fly-breeding, dust, fire or harbourage of vectors (such as rats). There is also no provision for dealing

Climate Change Impact and Adaptation Study in Mekong Delta – Part A
173 | P a g e
with leachate at these sites which may also leak onto nearby roads from rubbish disposal trucks. A typical standard for restricting habitable buildings in the vicinity of controlled landfill sites is one kilometre.
7.1.5.5 Effects on Urban Water Supply The freshwater resources in both Kien Giang and Ca Mau are particularly sensitive as major cities and larger urban settlements are almost entirely reliant on surface water resources. The presence of large, well-run water companies (CMWSSUW and KGWSS) in both provinces service the majority of the urban households. Over the last 5-10 years there has been a significant move away from individual or small scale groundwater wells for drinking water to treated domestic water treatment plants from which the quality of water can be assured. The vast majority of households in the main urban centres now obtain their water from these two companies.
The combination of increased temperatures, decreased surface flows are likely to cause water shortages into the future. These issues may be compounded by sea level rise (inducing saline intrusion). During low river discharge the increase of salinity intrusion in coastal areas is making existing water supply sources as well as agriculture vulnerable in both provinces.
These direct and indirect effects of climate change are likely to have consequences both on water quality and quantity. The consequences could directly impact on public health, but also indirectly on other parts of the delta system. For instance, inadequate infrastructure for piped water supply could influence the ability of small scale ice factories supplying the agricultural and seafood processing plants in both provinces.
7.1.5.6 Effects on Transport As previously discussed, the road transport system in Kien Gian and Ca Mau are not well developed, with both provinces relying heavily on waterway transportation of goods and people by canal and sea. The canal and sea transport has historically been the prime factor for economic development, and is currently considered to be the major transportation corridor for shipping goods to national and international markets, as well as supplying goods to the interior rural areas within both provinces now and into the future.
Therefore, ports and navigation channels have been well developed in the delta at the expense of road infrastructure. Currently Kien Giang and Ca Mau are services by main highway connections to Can Tho and Ho Chi Minh. The provincial and rural road networks are not very well developed, however it is expanding rapidly. In much of Ca Mau and parts of Kien Giang the road network consists of narrow usually sealed roads which follow the routes of inland waterways. They are mostly used by motorbikes and the occasional car and light truck, the narrow and weight limited bridges being constraints for heavy vehicles. The two travel necessities for a rural family are a motorbike and a long tailed boat.
In Ca Mau current flooding problems tend to be short-term as mentioned above, but of increasing frequency and intensity. This does not currently pose a constraint to transportation systems. In Kien Giang, however, flooding from the Mekong can affect coastal areas for several months up to a metre in height. The September 2000 floods provided recent evidence of the impact of such an event. At such times inland waterways are key replacement options for any flooded District roads, the more strategic roads being located at higher elevations and also often more inland.
Roads are predominantly affected by the ongoing impacts from increased rainfall, increased temperatures and increased ground movement which cause the road pavement and surface to deteriorate. The road surface is especially vulnerable to erosion from large storm surge events and typhoons.
However, it is expected that the most damage to road assets will result as a result of the increase flooding and inundation with sea level rise. Any significant damage to road assets will hinder access to transportation nodes and hubs, and between urban settlements.

Climate Change Impact and Adaptation Study in Mekong Delta – Part A
174 | P a g e
7.1.5.7 Effects on Ports & Harbours Port facilities are predominantly vulnerable to increases in extreme events such as cyclones and storm surges. Some of the port facilities such as piers, barges, boats and sea wall protection are particularly vulnerable to wave and wind damage associated with storm events. Increased air temperature, sea surface temperature and humidity will accelerate the degradation of port assets through increased corrosion. Port assets will also suffer from increased fatigued structures due to increased storm intensity. This will further reduce asset lives and increase potential failure during extreme storm events.
Sea level rise changes the corrosive zones on assets exposing components of the assets to corrosion which were not designed for this level of corrosive impact. Sea level rise also prevents existing port facilities from functioning effectively as it reduces their freeboard making them more vulnerable to overtopping from waves and storm surges.
The loss of key port facilities such as pier structures, barges and ferry boats will inhibit access to the Islands. This may hinder shipping freight supplies arriving at the island resulting in significant social and economic implications for the island.

Climate Change Impact and Adaptation Study in Mekong Delta – Part A
175 | P a g e
7.2 Risks In general, the projected changes in climate for Kien Giang and Ca Mau will lead to a range of physical impacts that will potentially threaten the population and people, including the impacts on livelihood and agricultural systems; urban and rural settlements; and industrial, energy and transport infrastructure. These impacts will make the people and communities vulnerable to climate change across all sectors as outlined above.
However, the vulnerability assessment does not take into account the level of risk that is associated with each potential impact. Risk can be assessed by sector and at a finer scale risk can be assessed for each district. The extent of the risks posed by the modelled projected climate change impacts on each sector are described in Table 64 below.
Table 64 - Risks posed to each district from the three climate change impacts for baseline, 2030 and 2050.
Inundation Salinity Storm Surge District 2010 2030 2050 2010 2030 2050 2010 2030 2050 Ca Mau 3 8 9 10 10 10 0 0 0 Cai Nuoc 8 9 9 10 10 10 0 0 0 Dam Doi 3 8 8 10 10 10 4 4 4 Nam Can 8 8 8 10 10 10 4 4 6 Ngoc Hien 3 8 8 10 10 10 8 10 10 Phu Tan 8 8 8 10 10 10 4 4 4 Thoi Binh 3 3 8 10 10 10 0 0 0 Tran Van Thoi 8 8 9 10 10 10 4 4 4 U Minh 3 3 8 10 10 10 4 4 4 Rach Gia 9 9 9 10 10 10 4 4 4 Ha Tien 8 8 9 10 10 10 4 6 6 An Bien 8 8 9 10 10 10 4 4 4 An Minh 3 8 8 10 10 10 4 4 4 Chau Thanh 9 9 9 10 10 10 4 4 4 Giang Thanh 9 9 9 10 10 10 0 0 0 Giong Rieng 9 9 9 5 5 5 0 0 0 Go Quao 8 9 9 5 10 10 0 0 0 Hon Dat 9 9 9 10 5 5 4 4 4 Kien Hai 0 0 0 0 0 0 6 6 6 Kien Luong 9 9 9 10 10 10 4 4 4 Phu Quoc 0 0 0 0 0 0 4 4 4 Tan Hiep 9 9 9 10 5 5 0 0 0 U Minh Thuong 3 8 8 10 10 10 0 0 0 Vinh Thuan 3 8 8 10 10 10 0 0 0
>20 Extreme; require urgent attention. 5 - 12 Medium; existing controls sufficient in the short
term, will require attention in the medium term.
12 - 20 High; requiring attention in the near term. <5 Low; existing controls will be sufficient.
The island districts of Phu Quoc and Kien Giang have little risk from inundation or salinity. While five districts in Ca Mau and two mainland district in Kien Giang are currently at low risk from inundation, all mainland districts are projected to be at moderate risk from inundation by 2050. All mainland districts are currently at moderate risk from salinity and are projected to remain at moderate risk out to 2050. Ngoc Hien and Kien Hai are currently at moderate risk from storm surge but are projected to remain at moderate risk out to 2050. Nam Can and Ha Tien are projected to be at moderate risk from storm surge by 2050.

Climate Change Impact and Adaptation Study in Mekong Delta – Part A
176 | P a g e
7.2.1 Population; Hotspots Figure 114and Figure 115 show the vulnerability profiles of the districts that registered high vulnerability ratings (>18) in the poverty sector.
Figure 114 - Vulnerability profiles of districts in Ca Mau with a high vulnerability in the population sector.
The most vulnerable districts in Ca Mau with regard to population are Ca Mau city and Tran Van Thoi.
Ca Mau: has high existing population density which combined with a high in migration rate results in high vulnerability for this sector. However, the low number of rural households keeps the present vulnerability low, but exposure and sensitivity to inundation will increase into the future, and is likely to be significant by 2050. The high population, the large area of the urban area and the concentration of transport hubs increases vulnerability in this sector. In all sectors except poverty, vulnerability increases in the future due to population growth and inward migration which emphasizes the current susceptibility to impacts.
Tran Van Thoi: With high population and inward migration is a coastal town subject to storm surge and with 46% of the areas currently subject to inundation the initial high exposure increases to 80% in the future, as inundation and storm surge affect larger areas. Combine this with a lower average income, more poor households and less access to health than the other urbanised districts results in a high exposure and sensitivity.
Figure 115 - Vulnerability profiles of districts in Kien Giang with a high vulnerability in the population sector, Rach Gia and Chau Thanh.

Climate Change Impact and Adaptation Study in Mekong Delta – Part A
177 | P a g e
The most vulnerable districts in Kien Giang with regard to population are Rach Gia city and Chau Thanh.
Rach Gia: was assessed as being highly vulnerable due to an existing high population, and high population density combined with a high rate of inward migration. This is compounded by a high level of exposure to flooding, inundation, salinity and storm surge, and results in high vulnerability.
Chau Thanh: has a large rural population, high population density and high growth rate combine, and is already highly exposed to flooding, inundation, salinity and storm surge – and this will increase in the future as a greater area is subject to impacts. High numbers of poor and ethnic households, a low income and limited availability of agricultural land lead to high vulnerability that increases in the future as population increases and a greater area is subject to impacts especially up to 2030.
7.2.2 Poverty; Hotspots Figure 116 shows the vulnerability profiles of the districts that registered high vulnerability ratings (>18) in the poverty sector.
Figure 116 - Vulnerability Profiles for districts with high vulnerability in the poverty sector; In Ca Mau - Dam Doi and Ngoc Hien, and in Kien Giang - Chau Thanh.
The most vulnerable districts in Ca Mau with regard to poverty are Dam Doi and Ngoc Hien.
Dam Doi: A high number of poor household is only slightly ameliorated by a moderate access to health and education. Low population growth reduces the effect of increases in inundation by 2050.
Ngoc Hien: A very low income and high number of poor household and limited access to health and education lead to increasing vulnerability as exposure to inundation and storm surge increases. The very high population growth increases the effect.
In Kien Giang the most vulnerable district from a poverty perspective was assessed as Chau Thanh
Chau Thanh: High numbers of poor and ethnic households, a low income and limited availability of agricultural land lead to high vulnerability that increases in the future as population increases and a greater area is subject to impacts especially up to 2030.

Climate Change Impact and Adaptation Study in Mekong Delta – Part A
178 | P a g e
7.2.3 Agriculture and Livelihoods; Hotspots Figure 117 shows the vulnerability profiles of the districts in Ca Mau that registered high vulnerability ratings (>18) in the agriculture and livelihood sector.
The most vulnerable districts in Ca Mau are U Minh, Dam Doi and Tran Van Thoi.
U Minh: A high rural population with low incomes is offset by a high number of possible income sources and available land. Exposure to inundation salinity and storm surge leads to high vulnerability in the future.
Dam Doi: A high number of income streams reduce the current vulnerability, but the high population decreases the availability of land for primary production thus increasing vulnerability.
Tran Van Thoi: A high number of rural households and a moderate income increase vulnerability as the area impacted by inundation increases to 80% in the future.
Eight districts in Kien Giang registered high vulnerability ratings (>18) in the agriculture and livelihood sector. Figure 118 shows the vulnerability profiles of six of the districts, while the vulnerability profiles of two further districts, Chau Thanh and Rach Gia were shown in Figure 115 on page 176.
Figure 117 - Vulnerablity Profiles for districs in Ca Mau with high vulnerability in the agriculture and livelihood sector; U Minh, Dam Doi, and Tran Van Thoi.

Climate Change Impact and Adaptation Study in Mekong Delta – Part A
179 | P a g e
In Kien Giang the most vulnerable districts from an agricultural and livelihood perspective were assessed as: Hon Dat; Chau Thanh; Kien Luong; Giong Rieng; Go Quao; An Bien; An Minh and Rach Gia. All of these districts, with the exception of Rach Gia, are highly dependent on water-reliant farming systems and are highly exposed to river based flooding and inundation.
Hon Dat: Low population density and good access to agricultural land leads to low initial vulnerability. A high growth rate of the mostly rural population and an increase in exposure to inundation and storm surge increases vulnerability in the future.
Chau Thanh: High vulnerability due to a high rural population and low annual income is ameliorated by a high number of other income streams. However vulnerability increases in the future as a greater area of agricultural land is subject to impacts.
Giong Rieng: A very large rural population and low annual income is exposed to inundation and salinity leading to high vulnerability as both population and the area exposed to inundation increase
Go Quao: A high reliance on agriculture is ameliorated by moderate GDP and household access to land. Vulnerability increases in the future due to a gradual increase in the area affected by inundation and salinity.
An Bien: A high rural population with low incomes is offset by available land per head of population. Exposure to all three hazards leads to high vulnerability in the future.
An Minh: A high rural population with low incomes is offset by good availability of land per head of population.
Rach Gia: A low number of rural households keep the present vulnerability low, but increasing exposure to inundation and saline intrusion increases vulnerability in the future.
Figure 118- Vulnerablity Profiles for six districs in Kien Giang with high vulnerability in the agriculture and livelihood sector; Hon Dat; Kien Luong; Giong Rieng; Go Quao; An Bien; and An Minh.

Climate Change Impact and Adaptation Study in Mekong Delta – Part A
180 | P a g e
7.2.4 Industry and Energy Impacts, Hotspots
Figure 119 shows the districts in Ca Mau that registered high vulnerability ratings (>18) in the industry and energy sector.
Dam Doi: While industry has a low contribution to the district economy the high population means that a large number of households are reliant on a few industries Combined with a poor electrical connection rate but a large amount of electrical infrastructure potentially effected by inundation, salinity and storm surge this vulnerability increases in the future.
Tran Van Thoi: A large contribution to GDP from industry and a lot of energy infrastructure leads to high vulnerability which increases with inundation and storm surge.
Ca Mau: The aggregation of industry and electricity infrastructure in the city and the reliance of house hold incomes on industry mean that Ca Mau city is vulnerable in this sector, especially to extreme events. The extent increases in the future particularly due to flooding.
Figure 120 shows the districts in Kien Giang that registered high vulnerability ratings (>18) in the industry and energy sector. The most vulnerable districts in Ca Mau are:
Chau Thanh: A high contribution to GDP from industry and the presence of energy infrastructure leads to a high vulnerability. Vulnerability increases in the future as a greater area is subject to impacts.
Figure 119 - Vulnerablity Profiles for districs in Ca Mau with high vulnerability in the industry and energy sector; Dam Doi, Tran Van Thoi and Ca Mau.
Figure 120 - Vulnerablity Profiles for districs in Kien Giang with high vulnerability in the industry and energy sector; Chau Thanh, Hon Dat and Rach Gia, (note the different scale for Rach Gia.

Climate Change Impact and Adaptation Study in Mekong Delta – Part A
181 | P a g e
Hon Dat: The large population means that a large number of households are reliant on industry which increases vulnerability in the future as population and exposure of the extensive power infrastructure increases.
Rach Gia: The aggregation of industry and electricity infrastructure in the city and the reliance of house hold incomes on industry mean that Rach Gia city is vulnerable. The combined effect of the three impacts increases the vulnerability over time.
7.2.5 Urban Settlements and Transport; Hotspots Figure 121shows the districts in Ca Mau that registered high vulnerability ratings (>18) in the urban settlements and transport sector.
The most vulnerable districts in Ca Mau are:
Ca Mau: The High population, the large proportion of urban area and the concentration of transport hubs increases vulnerability in this sector.
Cai Nuoc: A moderate urban population and poor sewage connections leads to high vulnerability that increases with extensive flooding in the future.
Tran Van Thoi: A high urban population in two towns, one of which is on the coast, leads to high vulnerability. Limited amount of infrastructure and current protection of the urban centre from inundation and storm surge means that while vulnerability is now low it will increases as inundation and storm surge affect larger areas and protection measures become unable to cope.
Four districts in Kien Giang registered high vulnerability ratings (>18) in the urban settlements and transport sector. Figure 122 shows the vulnerability profiles of three of the districts, the vulnerability profile of Rach Gia was shown in Figure 120 on page 180.
Figure 121- Vulnerablity Profiles for districs in Ca Mau with high vulnerability in the urban settlements and transport sector; Ca Mau, Cai Nuoc and Tran Van Thoi.

Climate Change Impact and Adaptation Study in Mekong Delta – Part A
182 | P a g e
In Kien Giang the most vulnerable districts in terms of urban settlements and transportation were assessed as being:
Rach Gia: where the high population, combined with relatively the large concentration of urban and transportation infrastructure makes it both highly exposed and sensitive to a range of climate change impacts, especially flooding and inundation.
Chau Thanh: Despite a relatively small urban area, the large densely settled population and the presence of transport infrastructure increases vulnerability in this sector. In all sectors, vulnerability increases in the future due to high population growth which emphasises the current susceptibility to all three impacts.
Kien Luong: Moderate urbanisation and poor access to water and sanitation leads to increased vulnerability in the future.
Ha Tien: The high level urbanisation makes the district highly vulnerable. The urban area is increasingly exposed to all three impacts in the future.
7.2.6 Summary of District and Sectoral Hotspots Comparison of the rankings for the different districts clearly shows that current overall vulnerability to climate change for the majority of districts is low to medium. However, into the future many districts were assessed as being medium to high. Table 65 highlights the most vulnerable districts hotspots in 2050 for each sector. While Table 66 outlines the climate change impacts that pose the greatest risk to the identified hotspots. It should be noted that the vulnerability ratings for all the mainland districts would have been much higher in the absence of the sea-dyke, flood control system and salinity sluice gates.
The tables indicate that in Ca Mau province, Tran Van Thoi is at risk from flooding and salinity and is vulnerable across all sectors except poverty; while Ca Mau city is vulnerable to flooding and salinity in three sectors due to its large urban population reliant on urban services and industry. Flooding and salinity pose a risk to Dam Doi in the agricultural and industry sectors due to its reliance on aquaculture processing and to the urban settlements in Cai Nuoc.
Ngoc Hien is vulnerable in the poverty sector and is at risk from salinity and storm surge. The high reliance of U Minh on rice makes it particularly vulnerable to salinity in the agricultural sector.
In Rach Gia Province Chau Thanh district is vulnerable to flooding and salinity across all sectors and should be a priority area for adaptation measures. Rach Gia city is vulnerable to flooding and salinity across four sectors. Kien Luong is at risk from flooding and salinity in both; the agriculture and livelihood, and the urban settlements and transport sectors. In the agriculture and livelihood sector three other districts; Hon Dat, An Bien and Ha Tien are at risk from flooding and salinity, while Giong Rieng is at risk from flooding and An Minh is at risk from salinity.
Figure 122- Vulnerablity Profiles for districs in Ca Mau with high vulnerability in the urban settlements and transport sector; Kien Giang, Chau Thanh, Kien Luong and Ha Tien.

Climate Change Impact and Adaptation Study in Mekong Delta – Part A
183 | P a g e
Table 65 – Districts identified as sectoral vulnerability hotspots in 2050.
Sector
Population Poverty Agriculture & Livelihoods
Industry & Energy
Urban Settlements & Transport
Ca Mau Province
Ca Mau Ngoc Hien U Minh Dam Doi Cai Nuoc Tran Van Thoi Dam Doi Dam Doi Tran Van Thoi Tran Van Thoi Tran Van Thoi Ca Mau Ca Mau
Kien Giang Province
Rach Gia Chau Thanh Hon Dat Chau Thanh Chau Thanh Chau Thanh Rach Gia Hon Dat Kien Luong Chau Thanh Rach Gia Ha Tien Kien Luong Rach Gia Giong Rieng Go Quao An Bien An Minh
Table 66 – Major threats to identified hotspot districts, Red indicate major exposure with little control measures in place.
Ca Mau Kien Giang
District Threats District Threats Tran Van Thoi Flooding
Salinity Chau Thanh Flooding
Salinity Ca Mau Flooding
Salinity Rach Gia Flooding
Salinity Dam Doi Flooding
Salinity Kien Luong Flooding
Salinity Cai Nuoc Flooding
Salinity Go Quao Flooding
Salinity Ngoc Hien Storm Surge
Salinity Hon Dat Flooding
Salinity U Minh Salinity An Bien Flooding
Salinity Ha Tien Flooding
Salinity Giong Rieng Flooding An Minh Salinity

Climate Change Impact and Adaptation Study in Mekong Delta – Part A
184 | P a g e
7.3 Synthesis of Regional Vulnerabilities Comparing the relative sectoral vulnerabilities of the districts in the study area produces a broad picture regarding the problems and sustainability of the major socio-economic sectors in Kien Giang with climate change. It also identifies the ways in which sectoral vulnerability to climate change varies across the study area.
The vulnerability rankings for each of the district are based on a standard set of indicators so that the vulnerability can be compared not only between districts, but also across sectors. A regional vulnerability was calculated for each time period as the average value of the five sectors. The geographical distribution of the regional vulnerability for baseline, 2030 and 2050 is shown in Figure 123.
Figure 123 – Regional vulnerability rankings for current and future climate change scenario

Climate Change Impact and Adaptation Study in Mekong Delta – Part A
185 | P a g e
Table 67 and Table 68 provide a summary overview of the main sectoral vulnerability ratings to climate change for Ca Mau and Kien Giang provinces. The table also presents the regional vulnerability for 2050.
Table 67 - Ca Mau Vulnerability Ratings Summary
District
Population Poverty Agriculture & Livelihoods Industry & Energy Settlements & Transport
Overall Vulnerability
2010 2030 2050 2010 2030 2050 2010 2030 2050 2010 2030 2050 2010 2030 2050 2050
Ca Mau 6 13 26 1 2 4 3 8 18 5 14 31 3 7 29 High Cai Nuoc 5 9 18 4 6 10 4 9 12 3 5 10 2 6 21 Medium Dam Doi 5 9 19 4 14 20 2 9 21 3 11 26 2 6 7 High Nam Can 2 3 7 2 2 4 2 6 14 2 4 9 2 7 16 Low Ngoc Hien 4 3 7 6 17 29 4 5 12 2 9 25 3 10 19 High
Phu Tan 4 6 11 3 6 6 3 4 12 3 6 19 2 9 17 Medium Thoi Binh 3 6 13 3 7 9 2 7 16 2 5 13 2 5 8 Medium Tran Van Thoi 6 13 28 6 9 12 4 17 36 4 14 30 5 10 25 High
U Minh 3 5 9 5 10 16 2 9 21 2 5 11 2 5 6 Medium Low Vulnerability High Vulnerability Medium Vulnerability Very High Vulnerability

Climate Change Impact and Adaptation Study in Mekong Delta – Part A
186 | P a g e
Table 68 - Kien Giang Vulnerability Ratings Summary
Population Poverty Agriculture & Livelihoods Industry & Energy Settlements & Transport Overall
Vulnerability
District 2010 2030 2050 2010 2030 2050 2010 2030 2050 2010 2030 2050 2010 2030 2050 2050
Rach Gia 8 16 29 2 10 10 5 10 25 5 15 33 6 16 37 High Ha Tien 3 7 12 2 2 2 4 5 7 3 5 11 3 14 30 Medium An Bien 5 9 11 5 13 14 6 10 24 3 7 14 5 6 10 Medium An Minh 4 6 12 4 12 14 5 11 24 1 6 13 5 3 6 Medium Chau Thanh 8 14 30 5 14 18 4 11 20 3 8 20 4 10 19 High Giang Thanh 1 1 2 3 3 3 3 4 14 1 2 5 2 3 4 Low Giong Rieng 5 9 13 5 13 13 5 7 22 3 9 19 5 5 9 Medium Go Quao 4 8 10 3 7 8 5 9 22 2 4 8 4 3 5 Low Hon Dat 7 7 12 3 12 14 2 13 36 3 10 27 5 9 18 High Kien Hai 1 2 3 0 1 1 2 2 3 1 2 4 1 1 2 Low Kien Luong 2 3 8 1 1 2 2 7 21 4 7 16 4 11 28 Medium Phu Quoc 1 1 2 0 1 1 1 3 5 2 2 7 3 7 8 Low Tan Hiep 5 7 10 2 7 9 4 6 18 2 4 11 5 5 11 Medium U Minh Thuong 2 2 4 4 12 13 5 7 15 1 2 4 2 2 4 Low
Vinh Thuan 3 5 8 2 6 9 4 7 17 1 4 8 2 5 10 Low Low Vulnerability High Vulnerability Medium Vulnerability Very High Vulnerability

Climate Change Impact and Adaptation Study in Mekong Delta – Part A
187 | P a g e
8. Institutional Capacity This chapter outlines the national and provincial future plans and projections for the priority sectors of the region. Future plans and projections are developed from national decrees that are issued by the central government. Provincial PPCs oversee departments that submit policies and plans based on the national decrees and on targets set by Ministries. District PPCs are also tasked with developing plans for their district.
The national sector experts assessed the climate change capacity of government agencies through an examination of the provision of climate change adaptation both on the ground and in the provincial plans. Further insight into the planning capacity in urban, transport, industry and energy planning at the district level was captured through survey questions. The results of the survey questions
With regards to, the.
This section outlines the current institutional structure at the four levels of government, national, provincial, district and commune. Where available the extent of existing target programs and directives is outlined for each sector. Then the capacity to develop and incorporate comprehensive climate change adaptation options into planning is assessed at each level.
8.1 National Institutions In Vietnam at the national level, several ministries are involved in the management of the Mekong Delta, these being:
Ministry of Agriculture and Rural Development (MARD): which is in charge of land tenure, land use and rural infrastructure development;
Ministry of Natural Resources and Environment (MONRE): which oversees international conventions and other development regulations and agreements (such as the Convention on Biological Diversity, Ramsar conventions etc.); and
Ministry of Planning and Investment (MPI) in charge of preparation of National 5-years socio-economic development plans as well as the overall national planning and coordination.
A lot of physical, socioeconomic and ecological data is available in Vietnam, yet it is scattered at different Ministries and Institutions. Gaining access to data remains a difficult task and seems to depend on good networking and coincidence rather than active and institutionalised knowledge sharing. As a result coordination of research and climate change adaptation activities is very limited leading to less coherent approaches.
The national institutions that are involved in the management of the different sectors are outlined below.
8.1.1 Agriculture and Natural Resource Management Organizations involved in natural resources management at the national level include; the Ministry of Agriculture and Rural Development (MARD), the Ministry of Natural Resources and Environment (MoNRE), the Ministry of Science and Technology (MoST). As well as being responsible for fisheries, the Ministry of Fisheries (MoFI) is also involved in the management of mangroves.
In the water resources management sector, the Department of Water Resource Management (DWRM) within MONRE was set up in 2003 to carry out state management of water resources. And the National Water Resources Council (NWRC) was set up to advise the government on integrated water resource

Climate Change Impact and Adaptation Study in Mekong Delta – Part A
188 | P a g e
issues. The NWRC has representatives from; MoNRE; MARD; Ministry of Fisheries (MoFI); MoST; Ministry of Planning and Investment (MPI); Ministry of Finance (MoF); Ministry of National Defence (MoND); Ministry of Construction (MoC), Ministry of Transportation (MoT); Ministry of Industry and Trade (MoIT); and Ministry of Health.
MARD is responsible for the management of water-related sectors such as agriculture, forestry, aquaculture, salt production, irrigation systems, rural water supply, dike management and disaster management. However, The Directorate of Water Resources, the Directorate of Fisheries and Aquaculture and the National Centre for Rural Water Supply and Environmental Sanitation are also involved in water resources management.
The overview of the number of government bodies responsible for different parts of the agricultural and natural resource sectors illustrates one of the primary issues that inhibit effective management of these sectors. There is considerable overlap of responsibilities among government agencies and all of the ministries, in particular the most directly active ministries, MARD and MoNRE, lack both horizontal and vertical coordination and cooperation. This means that there is a lack of ability to develop coordinated strategies and policies. In addition, most ministries lack capacity to develop strong policy and secondary legislation. Other significant issues that hinder effective natural resource management include;
Ineffective inspection and enforcement and conflict resolution activities.
Low level of awareness, skills and technology for integrated natural resources management.
Budgets for natural resources development and management are limited and have not met the demand of the sector.
Data and information is still scatted, monitoring networks are insufficient and data quality is not high.
Significant capacity development and strong mechanisms for enforcing coordination of effective policies and strategies across ministries and provincial departments is required to overcome these deficiencies.
The Fisheries Information Centre (FICEN) is the division in charge of fisheries statistics and forecasting. A fisheries database D-Fish was set up with the assistance of DANIDA. However FICEN is in its early days in using D-Fish and there is an opportunity for further investment in training now. It is clear that investment in the division should be prioritized.
8.1.2 Infrastructure Planning Most strategic planning is undertaken at national levels by the Ministry of Planning and Investment (MPI) through the National 5-years socio-economic development plans. The 'Draft Socio-Economic Development Strategy For The 2011-2020 Period' (Prime Minister 2011) indicates a determination to rapidly develop urban areas and is heavily involved in promoting improvements and strategic additions to the existing road system. Transport specific planning is shared between national and provincial levels with national level roads and water transport routes that link provinces and large urban centres managed at the national level by the Ministry of Transport.
A recent Multimodal Transport Regulatory Review by the Ministry of Transport examined the relative current position of all transport modes and made recommendations for the future (Ministry of Transport, 2006). The report appreciated the positive aspects of water transport, especially in the light of potential climate change impacts, in that "inland waterway transport appears to be less heavily constrained by infrastructure shortcomings in its ability to respond to the changing needs of freight customers. More so than with road transport, its intrinsic characteristics are suited to low-value, less time-sensitive, bulkier commodities". A key output was a recommendation to ensure that the funding and organisation for inland waterway operation and management was improved. The danger is that the

Climate Change Impact and Adaptation Study in Mekong Delta – Part A
189 | P a g e
balance between road and water transport changes dramatically so that new roads become congested with heavy loads and unmaintained waterways become too inefficient/less navigable to use.
8.2 National Plans and Projections
8.2.1 The National Target Program Unfortunately, unlike most other countries in the region, Vietnam has not yet completed or submitted a national adaptation program of action (NAPA). However, the Government has developed a National Target Program (NTP) in order to respond to climate change (Decision No. 158/QD-TTg 2006-2008). The goals of the NTP are as follows:
Identify the extent of climate change on Vietnam and its expected impacts;
Identify adaptation measures and policies;
Promote scientific and technological activities related to climate change;
Strengthen capacity building to respond to climate change
Raise public awareness;
Promote international cooperation;
Mainstream climate change into socioeconomic development strategies and all levels of planning; and
Develop specific climate change response action plans and pilot projects (Nguyen Mong Cuong 2009)
The NTP Planning Process
The NTP planning process is in many ways similar to a NAPA process, although it is not as focused on adaptation options as it might be. Specific adaptation options mentioned in NTP documentation indicate that the government intends to focus on:
New technologies in agriculture;
New planning for river basins and water management;
Integrated coastal zone management plans;
Infrastructure adapted to sea level rises;
Storm early warning systems;
Research on the function of ecosystems like mangroves; and
Sea dike reinforcement
Guidelines have been provided to provinces and cities to assist them to develop their own action plans. Unfortunately, the adaptation plans for both provinces have not been completed, and the planning instruments available, such as the socio-economic development plans do not clearly identify adaptation options other than the sea dike rehabilitation program.
The MONRE officials involved in issuing guide-lines for these action plans stated that a province would definitely need assistance to develop adaptation plans at the provincial and district levels. The government planned to set aside 150 billion VND for 64 provinces and cities in the country to design their plans in 2009 and 2010, but to date, in fact, only 60 billion VND has been spent for four provinces.

Climate Change Impact and Adaptation Study in Mekong Delta – Part A
190 | P a g e
NTP Adaptation Measures
The main adaptation measures mentioned in the NTP are also primarily 'structural' adaptation measures (sea dikes, reinforced infrastructure, more durable buildings) with some other measures, like resettlement, storm warning systems, and mangrove planting (MONRE 2008). Little attention has been paid to social vulnerability or 'non-structural' adaptation measures like community mobilization plans, social safety nets, insurance schemes, livelihood diversification, increasing institutional capacity, or the role of local action and social capital in building resilience and adaptive capacity outside of government programs. This is largely because to Vietnam, as with other countries in the region, "adaptation is understood as primarily a technical means with which to reduce and minimize the impact of climate change rather than as a complex set of responses to existing climatic and non-climatic factors that contribute to people's vulnerability" (Resurrection et al. 2008).
The NTP emphasizes gender equality as one of the guiding principles. However, women's involvement in the consultations for the NTP's development was limited, and concrete gender targets have not been formulated. The number of women officials in the Ministry of Natural Resources and Environment and the provincial Departments of Natural Resources and Environment is limited, and the overall system of governance is not well equipped for consultation with women and men at different levels in a policy formulation process such as this.
8.2.2 Sectoral Plans
8.2.2.1 Agriculture In 2009, the Vietnamese government issued the National Food Security Strategy and Agricultural Land Planning; Towards 2020. In this, the Mekong River Delta is cast as maintaining a core role in national food security (and rice exports) with some 1.8 million hectares of land to be reserved for rice production in the region. The Ministry of Agriculture and Rural Development will spatially allocate the target of 1.8 m ha across Provinces based on current land use.
In addition, ambitious targets have been set under the Social and Economic Development Plan (SEDP) and the Social Economic Development Strategy for the continued expansion of aquaculture and fruit production within the Mekong River Delta. MARD has set a growth target for the agriculture sector of 3.5 percent per year for the period of 2011-2015. And the agricultural production growth rate is targeted to increase to four percent per year in 2016-2020. The Mekong River Delta is also expected to play a core role in future agro-industrial development.
One of the primary methods of reaching the increased production targets is in the improvement of the production systems. MARD estimates that post harvest losses in the Delta could be up to 21 percent of the rice production value The MARD -Steering Committee for the Southwest Region has a plan to reduce post harvest losses by mechanising up to 80 percent of the harvesting segment and improving drying and storage infrastructure by 2020 (Vietnam News July 2, 2011).
In setting up another method to improve production, the Plant Cultivation Department of MARD has launched a program to have rice grown on large scale farms of 100 - 2,000 ha throughout the Delta.
The Japan International Cooperation Agency (JICA) has signed a proposal "The Project for Climate Change Adaptation for Sustainable Agriculture and Rural Development in the Coastal Mekong Delta in Vietnam', that plans to formulate a climate change adaptation master plan.
Aquaculture
Government Resolution 09/NQ/CP dated 15/10/2000 promotes the economic structural shift from "ineffective agriculture to aquaculture."

Climate Change Impact and Adaptation Study in Mekong Delta – Part A
191 | P a g e
Fisheries
A recent study by the Research Institute for Marine Fisheries (RIMF) estimated that the potential net economic benefits from improved fisheries management are 56 percent greater than the current level while the catch could be achieved with approximately 46 percent of the current level of fishing effort.
The government plans to rationalise and upgrade fisheries infrastructure under The Master Plan On Socio-Economic Development Of Vietnam's Sea And Coastal Areas In The Gulf Of Thailand Up To 2020. From 2011 to 2020, the plan intends to continue investment in comprehensively developing and modernising infrastructure facilities in the region.
As well as ambitious plans to develop transport infrastructure to create the Southern Coastal Corridor and to improve urban and industrial infrastructure, the document contains some key statements related to fishery infrastructure in the region:
To build Phu Quoc island into a general marine economic zone and a strong marine economic centre for the region and entire country;
To rationally develop the regional seaport system.
In addition, Decree 79/2003/ND-CP contains the legal framework for participation of local people in fisheries management and decision-making in Vietnam, and this has been complemented by a capture fishery co-management task force charged with the planning and implementation of certain pilot projects.
In October 2011 MARD announced a plan to upgrade the seafood processing industry, including increasing cold storage capacity to 1.1 million tonnes. It also plans to equip fishing boats and seafood purchase vessels with storage facilities and to develop seafood processing research and training facilities (Vietnam News, 8 October 2011).
Water Resources
There are two major strategies related to water resources: a Water Resources Development Strategy to 2020 issued by MARD, and the National Targeted Program (2008) to respond to climate change issued by MONRE.
The Government has adopted a policy on irrigation management transfer (IMT) which promotes participatory irrigation management. A decree has been adopted which transfers the responsibilities for managing the tertiary and quaternary irrigation canals and facilities to Water User Organisations (WUOs). However the implementation of this policy in the Mekong River Delta has progressed slowly.
The Southern Institute for Water Resource Planning has released plans for improvement to the water resource infrastructure of the Ca Mau Peninsular (which includes southern Kien Giang). The proposal divides the region into three zones; saline water, brackish water and freshwater. The plan also involves improvements to the canal system in southern Kien Giang and the construction of a large number of new sluice gates along the coast and estuaries. The construction of a sea dyke along the coast of Ngoc Hien is also proposed.
The newly signed World Bank Mekong Delta Water Resources Management For Rural Development Project will be implemented by MARD and will target the western part of the Mekong River Delta, including: An Giang, Ca Mau, Hau Giang, Soc Trang, Bac Lieu, and Kien Giang provinces and the Municipality of Can Tho. The two components of the project mentioned in the project appraisal document that will be important in improving the management of water resource for both Ca Mau and Kien Giang are:
Component 1: Water Management Planning and Efficient Utilization, and
Component 2: Improvement and Rehabilitation of Water Resources Infrastructure

Climate Change Impact and Adaptation Study in Mekong Delta – Part A
192 | P a g e
Natural Resources
Vietnam's Action Plan for Bio-diversity Protection adopted by the Prime Minister on 22 December 1995 in Decision No. 845/TTg (Agenda 21) is the legal guideline for the country's activities concerning biodiversity protection at all levels and sectors. The long-term objective of the Action Plan is to protect the diversity, variety and characteristics of Vietnam's nature within the framework of sustainable development. The action plan has a number of components that will contribute to the mainstreaming of climate change adaptation into natural area planning;
Improve policies and legislation related to bio-diversity conservation.
Develop regional bio-diversity action plans.
Consolidate, expand and decentralise management systems for national parks and natural protected areas.
Provide training on bio-diversity protection for management officials of forests and natural protected areas, scientists as well as other concerned people.
Conduct scientific research and technological applications to sustainable exploitation and use of bio-diversity values, especially in agriculture, forestry, fishery and healthcare.
Encourage communities to establish and realize common regulations on bio-diversity protection in local areas" (Prime Minister 1995).
Under Agenda 21 the government plans to establish a Multi-stakeholder Council to instruct sustainable development which will be chaired by the Minister of Planning and Investment and each province will formulate its own Agenda 21.
Decision No: 742/QD-TTg May 26, 2010 Approving The Plan On The System Of Vietnam's Marine Conservation Zones Through 2020 outlines a plan to build a system of marine conservation zones aiming to protect ecosystems and marine species of economic and scientific value; contribute to developing the marine economy and improving the livelihood of fishing communities in coastal localities.
The National government has adopted a National Action Plan for Protection and Development of Vietnam's Mangrove Forests Till 2015. The overall objective of this action plan is to promote the protection, rehabilitation and wise use of Vietnam's mangrove ecosystem towards sustainable development so that the protection function, values and its biodiversity could meet the need of socio-economic development and environmental protection in river estuaries and coastal areas.
8.2.2.2 Energy The Power Master Plan IV mentions the major Kien Luong Power Plant planned to be built by the private Tan Tao Group (ITACO) that is officially aiming for the first 1.440MW to be in operation by 2015. The first Phase includes a new Nam Du archipelago deep-sea port complex on Hon Lon Island for imported coal on large ships to be trans-shipped onto smaller ships for transport to the proposed power plant (tantaocity.com 2011). The Power Plant project is clearly highly ambitious as it would be extremely highly leveraged and also ITACO has no experience in successfully developing large thermal power plants, nor has any such plant yet been developed under the BOO (Build Own Operate) modality in Vietnam to date. The project appears to have faced considerable implementation difficulties to date, its support from provincial authorities appears uncertain at best, and its current status is at best problematic (english.vietnamnet.vn 2011).
A World Bank loan has been approved for a new 48 km submarine cable connection to Phu Quoc.
A new electrical spur line from the main EVN provincial substation connection at 11 0kV to Ha Tien is planned to be built with EVN's own funds. The new 110 kV line will also provide the connection and extra electricity capacity for the ambitious industrial and economic zones planned for the Ha Tien area to 2020.

Climate Change Impact and Adaptation Study in Mekong Delta – Part A
193 | P a g e
There are strong plans that are approved (and now at the detailed design stage and waiting for its geological survey to be approved) for a new 400 km long gas pipeline (246 km offshore and 152 km onshore) from the new Block B offshore gas field, a new gas processing plant, new LPG and condensate export pipelines to the coast and to an offshore ship loading platform, and a new gas pipeline to Can Tho - in particular for the planned O Mon power plant complex.
8.2.2.3 Urban and industry infrastructure Planning The Government's intentions towards the socio-economic development of both Ca Mau and Kien Giang are contained in a Prime Ministerial decision, (Prime Minister, 2009) which approves "the master plan on socioeconomic development of Vietnam's sea and coastal areas in the Gulf of Thailand up to 2020". It is intended:
"From now up to 2010: to form the Thailand gulf coastal economic corridor and Phu Quoc special administrative-economic zone; to build basic infrastructure facilities in the region: to promote investment in key works, creating conditions for rapid development in the subsequent periods."
"From 2011 to 2020: to continue investment in comprehensively developing and modernising infrastructure facilities in the region; to complete the building of the region's important works and put them into operation according to the master plan; to develop Phu Quoc administrative-economic zone according to the master plan."
From the urban planning and transportation aspect the following are some of the key statements in the document:
develop and modernise the infrastructure system, especially transport infrastructure To build the Thailand gulf coastal economic corridor as the backbone of the entire region's development; develop the regional seaport system: build a number of coastal urban centres into strong marine economic centres, seaward centres and growth cores in each area to promote sea-island economy, upgrade and expand routes linking Vietnam's sea and coastal areas with the inland, To build Ha Tien - Kien Luong and Nam Can - Dat Mui tourist clusters
To renovate and upgrade Ca Mau and Rach Gia airports to reach an annual capacity of 300,000 passengers. To build Duong To international airport (Phu Quoc) 2 million passengers/year in the initial stage;
To invest in upgrading the sea dyke system together with building a new road along the coastline from Nam Can to Rach Gia
build complete and step by step modernise wastewater drainage and treatment systems;
To plan suitable locations and sizes of garbage treatment sites for cities, towns, townships and industrial parks.
There are plans to boost tourism with a new extension of Vietnam's highway 1 to the southern tip of Vietnam. The road is already under construction, with implications to add new energy demands and for service industries alongside the new road and in any new settlements. However, the new road will go through a national park and mangrove forests.
Urban Planning
There is clearly a determination to rapidly develop the 3 key urban areas of Ca Mau to form a production/processing triangle. Much of this thrust comes from the National level. The key outstanding feature of the plans for the 3 centres is the huge amount of industrial land which has been allocated. Clearly, as the national policy for the Province is to move from a Primary producer to one which focuses on Industry and Services (based mostly on adding value to primary products) then the latter two sectors must generate most of the future local GDP and employ much larger numbers of workers than at present.

Climate Change Impact and Adaptation Study in Mekong Delta – Part A
194 | P a g e
It has been decided (Prime Ministers decision No. 1873/QD-TTg dated 11th October 2011) at the national level that solid waste treatment facilities are required to be constructed throughout the Mekong river delta key economic region. This decision is also based on the national strategy on integrated management of solid waste through 2025, with 2050 vision.
An expansion programme is planned for Phu Quoc Island Water supply later this year (for 2-3 years) to increase production to 16,500 m3/day through a loan from the World Bank (70%) and rest from central government.
Roads
The main planned strategic elements are the extension of National Highway 1 to Ca Mau Cape (by end 2013 under state budget) and the Southern Coastal Corridor (SCC) up to the Cambodia border. In addition, a new route is being considered from Song Doc to link with Highway 1 at Cai Nuoc, between Ca Mau City and Nam Can. Together these routes would more closely integrate the 3 main urban areas in the Province (Ca Mau City, Nam Can, Song Doc) and link them all to national routes both north and east. The main road proposal affecting Kien Giang is the ADB sponsored Southern Coastal Corridor (SCC) (work expected to start in 2012) which will basically follow the route of National Road (NR) 80
Construction of roads is both complicated, due to difficult ground conditions, and expensive, as all materials have to be transported into the Province (mostly using the canal network). Road construction is further complicated by the need to meet current elevation codes. The Highway 1 Extension was designed to 1.8 metres AMSL 4 years ago (total cost 3,932 billion VND at 2008 prices) but the codes are now 2.3 and 2.1 metres respectively for National and Provincial highways. Apart from requiring additional materials and design considerations this requirement has consequences for service provision along roads and also for property and other road connections.
Inland Waterways
It is planned that most of the waterways will also be upgraded in future to classes II or III. Upgrades can include: bank protection, dredging, improved navigation devices and lifting of bridges and power cables.
Since there are no deep water ports on the Kien Giang provincial mainland it is intended to develop the island of Nam Du as a general transit deep water port where large cargoes can be broken down or assembled for local markets. The island of Phu Quoc does have a deep water port at An Thoi in the south and is planning a new one at Bai Dat Do. The existing small port of Hon Chong (south of Kien Luong) is proposed to be upgraded in two phases. The proposed power plant at Kien Luong Town is also expected to have a port facility to directly import coal.
8.2.3 Disaster management Water management issues related to flood control are organised by Flood and storm control steering committees. There is a National programme of building flood proof residential clusters in the Delta. Provinces within the Delta have already relocated more than 130,000 households in low lying areas into flood proof residential clusters under phase 1. In the Long Xuyen Quadrangle, the program also involves consolidating old dykes and building new ones. Sluice gates and pumping stations are upgraded and canals are dredged.
The master plan on socio-economic development of Vietnam's sea and coastal areas in the Gulf of Thailand up to 2020 plans to invest in upgrading the sea dyke system together with building a new road along the coastline from Nam Can to Rach Gia to meet the requirement for natural disaster management at a high safety level in combination with social-economic development, security and defence.

Climate Change Impact and Adaptation Study in Mekong Delta – Part A
195 | P a g e
Current Flood and Storm Response
Guidance for improving disaster risk management at the national and provincial levels is provided by the new National Strategy for Natural Disaster Prevention, Control and Mitigation until 2020 (Prime Minister, 2007). The current approach to natural disasters has been largely reactive with little attention given to the role of affected communities in the planning, implementation and management of disaster risk reduction measures.
After the devastating floods of 2000 and 2001, the member countries of the MRC entered into discussions to take drastic steps towards the reduction of damage to infrastructure, economies and loss of lives and livelihoods. The MRC's Joint Committee and Council endorsed the implementation of a dedicated Flood Management and Mitigation Programme (FMMP). Since 2004, the implementation of the FMMP has proceeded in line with the MRC's Strategic Plan 2006-2010. In Vietnam the overall coordinator for dealing with such events is the Central Committee for Flood and Storm Control (CCFSC). The CCFSC is chaired by the Minister of Agriculture and Rural Development (MARD). Other members of the CCFSC include relevant line ministries, the Department of Dyke Management, Floods and Storm Control (DDMFSC), the Disaster Management Centre, the Hydro-meteorological Service, and the Viet Nam Red Cross (VNRC). The CCFSC is responsible for gathering data, monitoring flood and storm events, issuing official warnings and coordinating disaster response and mitigation measures. The authorities in all localities and each sector ministry also have committees for flood and storm control.
The Second National Strategy is principally designed to address short-term climate extremes rather than to respond to future climate change. The strategy focuses on emergency response and reconstruction, rather than risk prevention and adaptation. There is also a marked lack of integration between disaster risk reduction policies and wider policies for rural development and little cross sectoral integration or coordination. There is limited Government ownership yet of an adaptive approach to future climate related risks, and limited financing available for climate change adaptation.
At the provincial level, Flood and Storm Response Plan do exist but don't appear to be functioning at the maximum level. The development of flood infrastructure is limited to urban areas or stretches of canals improved by private individuals in haphazard manner and of varying quality. The opening of sluice gates can be under either District or Provincial control and there is no coordination or dissemination of opening and closing times.
Typhoon Linda
Typhoon Linda, which tore through southern Vietnam during the night of November 2, 1997, has been labelled as the worst typhoon to strike that area in 100 years. The typhoon swept away tens of thousands of homes in the Mekong Delta. 435 people were killed, 833 were injured, and 3,660 were unaccounted for. Nearly 80,000 houses are reported as destroyed and almost 140,000 as badly damaged. Infrastructure (roads, schools and hospitals) also suffered heavily and nearly 500,000 hectares of rice-fields were damaged. The hardest hit provinces were Kien Giang, Ca Mau, Bac Lieu, Soc Trang, Tra Vinh, Ben Tre and Vung Tau.
Vietnam has developed an effective early warning system for storms which incorporates use of the media, television and radio and local officials who then alert inhabitants in towns and villages. However, the speed and intensity with which Typhoon Linda developed meant that little warning could be given to the thousands of fishermen who were at sea as the storm approached. Very few of the small boats that made up the fishing fleets have radios and even less carry life preservers. Following the typhoon's passing, helicopters and navy cutters were used in a massive search and rescue operation with the result that around 5,000 fishermen were rescued (tiempo 2011).
On land, entire communities were flattened, tens of thousands of people were left homeless and roads, dikes and bridges were damaged and washed away (tiempo 2011). The extensive system of sea walls and dikes where not sufficiently high in many areas due to resource constraints. On the Cau Mau Peninsula, previous destruction of the mangrove forests which provide natural protection against storm-induced flooding aggravated the impact of Typhoon Linda.

Climate Change Impact and Adaptation Study in Mekong Delta – Part A
196 | P a g e
The Vietnam Red Cross (VNRC) used US$ 4.8 million to assist 150,000 victims with emergency food and shelter for three months. After the cyclone, the Federation immediately released US$142,000 from an emergency fund to purchase some of the most urgently needed emergency supplies - rice, corrugated iron sheeting, mosquito nets, medicines and clothing -- in Ho Chi Minh City (HCMC) and locally in Ca Mau. Two days after the typhoon, the Ca Mau provincial VNRC chapter was actively distributing relief and rehabilitation supplies to the victims of Typhoon Linda in Ca Mau City and south by river boat across the Mekong Delta. And relief goods (roofing sheets, blankets and mosquito nets) were distributed from the Red Cross storage facility in Bac Lieu. The VNRC Branch staff and volunteers across the affected provinces assisted in the evacuation of coastal communities. After the storm passed, Red Cross youth groups were dispatched to the shoreline to help the families of lost fishermen (ANRC 1997).
8.3 Provincial Departments At the provincial level the Peoples Party Committees (PPCs) have considerable autonomy, and represent the central government and control the activities within their areas. In both Kien Giang and Ca Mau, the PPC have formed 'climate change committees' who are responsible for overseeing and coordinating climate change adaptation activities in their respective provinces.
8.3.1.1 Agriculture and Livelihoods Provincial departments carry out the management of natural resources under the guidance of the respective PPCs. Three Departments DARD, DONRE and DOST are the major players in the agricultural and environment sector, with the DARDs being responsible for planning and implementation of agriculture and rural development measures. DARD plays the important role of development of adaptation measures for farmers.
The Provincial DARDs allocate the provincial agricultural targets in draft land use plans. These draft plans and their implementation project proposals need approval by the Ministry of Agriculture and Rural Development or its Province Department, depending on investment levels involved. The Ministry of Investment and Planning will be involved if large-scale investments in infrastructure are necessary
The planning and research capacity at the province level is of mixed quality and all three Departments lack both horizontal and vertical coordination and cooperation. At the senior level in the departments there is an awareness of climate change and the need for environmental conservation. For example the proclamation of the Biosphere reserve and the active role DoST has played in gaining protection for the Phu My grassland is a good example of inter department cooperation and shows good departmental awareness of conservation issues. On the other hand there are many examples of financial/development considerations being allowed to overcome conservation planning. A commercial company was allowed to destroy mangroves along a section of the coastline in the biosphere reserve to construct an 88 ha base for an unfinanced (and probably financially unfeasible) power plant, and DARD allowed the clearing of a large area of mangroves in nearby Ha Tien for aquaculture. Many senior staff are also aware of the issue of a lack of institutional coordination and cooperation. The departments are applying for funding to address the issues of the lack of planning capacity and technical ability to deal with climate change adaptation. They also acknowledge that there is a lack of mechanisms for incorporating new information into the current planning process.
Provincial Irrigation Divisions and/or Irrigation and Drainage Management Companies (IDMC) under the DARDs are responsible for the operation and maintenance of irrigation and flood control systems within their respective provinces. While the Irrigation Divisions, IDMCs and the DARDs have basic technical and administrative capacity to operate the water management infrastructure at the provincial or lower level, their capacity and the current institutional setting need to be upgraded to enable them to

Climate Change Impact and Adaptation Study in Mekong Delta – Part A
197 | P a g e
effectively address expected climate change impacts and the diversified needs of the different water users.
Provincial Fisheries Departments under the PPC are the local fisheries administration authorities with professional management from the Ministry of Fisheries.
On the ground there is a Provincial Agriculture and Fisheries Extension Centre (Kien Giang) and an Aquaculture Extension Centre (Ca Mau) with skilled extension officers who are able to attend training workshops. The lack of staff (around 20 staff per Province) at this level however means that there is limited capacity to transfer knowledge to the community.
8.3.2 Urban Settlements and Transport Urban Planning is carried out at a provincial level; however the most important consideration for future Physical Planning is Regional Policy in that key provincial development decisions are conceptualised at and delegated from the national level. Consultants are used extensively for strategic urban and transport planning exercises although all local authorities interviewed agreed that there were extensive consultations prior to plan preparation. This allowed authorities to be knowledgeable about plans. However, there seemed to be less certainty when plans or alignments were being amended and had not been finalised.
Authorities in Ca Mau are aware that the urban infrastructure requires upgrading. A national urban upgrade scheme approved by the Prime Minister two years ago has developed into a range of urban infrastructure projects (to start next year) which will improve living standards in low-income neighbourhoods. It will ensure that more than 5,000 local households in the city's nine wards will benefit directly from the project. An additional 25,000 households will be affected indirectly. It is intended that Ca Mau will reach Class 1 urban status by 2020.
The current concept for Kien Giang to 2025 is to have developed a multi-centre Province with each centre having its own distinct attraction and characteristics. There is also development underway to transform Kien Luong into a major urban area associated with a planned new thermal power plant and industrial area focusing on food processing. This is certainly a Province in a hurry to develop.
Urban Water supply
In Ca Mau, CMWSSUW has developed plans to supply the urban needs of the 3 centres up to 2020 and beyond. However, there is concern that in next 10 years much of the available groundwater will have been exhausted and/or quality will be unacceptable. The CMWSSUW may then have to turn to surface water. The company is examining the potential of a canal from Can Tho located about 7 - 8 km away from Ca Mau which carries fresh water.
In Rach Gia City, the KGWSS Company will expand capacity of its current plant to 50,000 m3/day through rebuilding in situ. It plans to construct (2014-15) a new plant south of Rach Gia with extraction from the Kai San channel, which is also a surface water system with salinity issues. It will have a capacity of 20,000 m3/day and would have a similar reservoir system as the current plant.
In Ha Tien City, the KGWSS company will invest in a new plant with 20,000 m3/day capacity with 12-15,000 m3/day for the proposed power plant and the rest for households, especially for the Kien Luong urban expansion (which currently in the south has surface water feeding a reservoir) whereas in Kien Luong town water is from the Ha Tien 2 cement factory).
Urban Drainage and Sewage Disposal
In the 1990's two varying systems were examined for Ca Mau City: to use the surrounding lake network to dispose of sewage; or to construct a pumping system. The latter was chosen and the project is to be funded by Italian aid (€13.6 million concessional credit). A program of building embankments along rivers and installing gates to prevent flooding from high tides is also included in the Italian

Climate Change Impact and Adaptation Study in Mekong Delta – Part A
198 | P a g e
program. Together with a higher building elevation code (1.85 metres) it is intended to improve the flooding situation over time.
In Nam Can, The proposed Eastern sea dyke (under DARD) will connect to Nam Can at Ring Road No. 2 and divide the town in half (north-east protected, south-east unprotected) but there are plans for a local embankment to the south to protect the remaining area. There are also tentative plans to build embankments along selected canals to minimise flood risks in future.
In Song Doc, The urban plan shows a general extension of the town (including the administrative centre) to the east away from the mouth of the Ong Duc River. A comprehensive plan should be able to provide for more efficient drainage and sewage disposal in this new area. There is a future plan to regularise and renew the older part of town over time with a more formal layout and better facilities.
In Rach Gia City, Three plants are planned by 2025 under a World Bank project with combined sewage and drainage. Along riverbanks it is planned to relocate those without sewage disposal facilities (1000 HH) by 2012. Small industries it is planned to move them to the industrial zone in Tac Cau town where treatment is provided.
Ha Tien City/Kien Luong Town have a plan for sewage treatment plant and funding has been requested from ADB. In the Kien Luong urban expansion area there is a plan for a combined drainage and sewage system.
Transport
DoT is responsible for roads and bridges, however as dykes are primarily designed to protect agricultural areas from floods or saline water they fall under DARDs responsibility. Discussions are ongoing between DARD and DoT as to who should operate dykes with roads. It is the opinion of the DoT in Ca Mau that in future roads should not be built on dykes so that each operation and maintenance is kept separate. In Kien Giang, DoT and DARD are discussing the design and operational arrangements of a sea dyke which is planned to run along most of the coast.
There are plans to boost tourism with a new extension of Vietnam's highway 1 to the southern tip of Vietnam. The road is already under construction, with implications to add new energy demands and for service industries alongside the new road and in any new settlements. However, the new road will go through the national park and mangrove forests.
At the provincial level map making is by AutoCAD. Officially no GIS programmes such as MapInfo or ArcGIS are utilised. It would seem that there are no difficulties for individual Provincial agencies to obtain map themes from other departments (e.g. cadastral maps). However, there is much scope for using database software and GIS to update and share details of current structures and networks and also proposed development plans.
8.3.3 Industry and energy sector. One 10 MW grid connected rice husk fuelled power plant is included in tentative future plans for Kien Hiang but there has apparently been little detailed investigation or design work undertaken to date. The rice production in Kien Giang province would be sufficient to support three such power plants. There are plans for Ca Mau provincial electrification to be extended to an additional 15,000 households by 2015 to give 99% electrification coverage, which would probably be close to the ultimate practical electrification limit in Ca Mau province. Two 10MW grid connected rice husk/straw fuelled power plants are included in future Ca Mau provincial development plans to be developed in three northern rice growing areas. With most rice now being husked outside Ca Mau province, and rice production down 40% from its peak, it would seem more likely that rice husk power plants would be built in the neighbouring provinces near to the existing rice husking plants.
Unfortunately there seems to be little overall coordination of how much total industrial area is actually being planned and/or developed in various areas. Ideally there would be a regional strategy which provided an overall framework within which Provinces could determine together the amount of

Climate Change Impact and Adaptation Study in Mekong Delta – Part A
199 | P a g e
industrial space that was appropriate given its investment potential based on factors such as the comparative advantage of the area (i.e. what does it produce better than others); its population and workforce (i.e. is the area currently attracting or losing skilled/unskilled workers/population); and accessibility (i.e. are markets conveniently located and is the transport system adequate).
However, the Minister of MONRE has been reported as saying (Vietnam News, 2011) that "Localities have developed industrial clusters without strict calculations or close co-operation within regions or provinces. Such projects spent a lot for land for agricultural cultivation and did not base this on real economic development".
A number of new industrial zones in both provinces are being developed in very low lying areas only around 0.5 to 1.5 m above water level, for example the new industrial zone near Ha Tien in Kien Giang province that is currently being developed in a wetland next to the main Ha Tien to Rach Gia canal. An optimal climate-proofed strategy for industrial zone development does not to have been developed. Many industrial sites will eventually either need to be raised or defended or abandoned.
New industrial zones are also being established remote from the population centres that would be needed to provide the necessary workforce for any new factories. The new Thuan Yien industrial zone appears to have been chosen more for its lack of prior residents to resettle, rather than for its proximity to a suitable workforce. There was little consideration of the sites vulnerability or ability to be defended against any future climate change effects.
Vietnam appears to have an excessive number of individual ship building plants, and the isolated plant at Nam Can is not part of any ship building cluster. The ownership of the Nam Can ship building plant has recently been transferred to Vinalines whose core business is operating and not building ships, so it's long term future viability must realistically be seen as uncertain.
For the Ca Mau gas-power-fertiliser complex there was apparently no consideration of climate change impacts in the current five year power plant rehabilitation project. A feasibility study for the fertiliser plant was apparently finalised in 2006. As the site has never had inundation issues, and did not suffer any impact from the major typhoon Linda in 1997, it was concluded that the site did not need to consider any special flooding impact or any site protection considerations. The plant's management unit, both at an overall level and for its individual components, climate change was clearly seen to be an environmental issue to be dealt with by the environmental team, and not a business investment strategic issue. No information could be found from the relevant environmental management staff as to site heights above water level, nor any need to consider the practicalities of defending the site against any water level rise or other climate change effects. According to the site plans on the wall at the EPC contractor's site office the site is only 2.38 m AWL.
The lack of consideration of future climate effects, and in particular to extreme weather events as well as sea level rise is not just confined to new industrial zones. The site of the proposed new $7 billion Kien Luong power plant complex does not seem to be designed for a worst case maximum sea level rise and/or any increased extreme weather events scenarios over the 40 - 60 year lifetime of such a massive new coal fired power plant complex. The proposed power plant which is incorporated into the Power Master Plan IV, is planned to be built by the private Tan Tao Group (ITACO) and would be the first major private power plant development in Vietnam to be financed, constructed and operated as a BOO (Build Own Operate) project. The first Phase includes a new deep-sea port complex on Hon Lon Island for imported coal on large ships to be trans-shipped onto smaller ships for transport to the proposed power plant. It is claimed that nearly $100 Million has been spent on 88 ha of reclamation to a height of 3.27 m in a 3 to 13 m depth sea site for the power plant, with 6.5 - 8 km of reinforced concrete 28-44 m sheet piles to form a breakwater being claimed, although a visit to part of the site did not reveal any sheet piles at the area visited.
When the proposed Kien Luong power plant site was being visited, the fill being used on the offshore site clearly came from a borrow pit just inland from the site and not from an inland quarry as was claimed. The composition and dumping of the fill also seemed to be remarkably haphazard for a proposed major power plant site. The Kien Luong Power Plant project is clearly highly ambitious as it would be extremely highly leveraged and also ITACO has no experience in successfully developing

Climate Change Impact and Adaptation Study in Mekong Delta – Part A
200 | P a g e
large thermal power plants, nor has any such plant yet been developed under the BOO (Build Own Operate) modality in Vietnam to date. The project appears to have faced considerable implementation difficulties to date, its support from provincial authorities appears uncertain at best, and its current status is at best problematic.
8.4 District Level
8.4.1 Agriculture and Livelihood In the environmental sector Departments are represented at the local district level by Forest Protection Boards and staff and National Park Management Boards and staff. At the local level park and forest rangers are the on the ground representatives. There are two major issues faced by staff at the local level. Lack of funding and low wages leads to a poor quality of service and there are no mechanisms for the transfer of knowledge from the scientific community to field officers. As a result farmers tend to use alternative sources of information for farm management decisions.
In Ca Mau the DARD Department of Promotion has 167 staff, spread out in the 9 Districts with each office having about 3 staff. At Commune level, each of the 98 Communes has one Department staff member.
Both U Minh Thuong and Phu Quoc National Park have attracted international aid to build planning and management capacity but still appear to have a low capacity to deal with predicted climate change issues. U Minh Thuong National Park has attracted funding and has developed links with the National Forest University in order to manage water levels in the park with an aim to reduce the risk of fire and to maintain biodiversity. This will be a critical component of managing water and mitigating impacts of climate change for the surrounding regions in the future.
Phu Quoc National park also has the issue of directives from the National government overriding local planning decisions. There is also a poor level of awareness of the value of the marine protection areas component of the Biosphere reserve with much of the focus on coral bleaching and marine mammals but little emphasis on the importance of the seagrass and mangrove ecosystems or of the value of fish and other marine organisms.
DARD has taken over many responsibilities for forested areas, including protected areas, from DONRE, which has been left with biodiversity management as its major function. Mangrove forests in Kien Giang are categorized as protection forest. Under Decision 51, the Kien Giang provincial People's committee assigns direct management of these forests to Forest Protection Management Boards. The Management Boards then act as forest owners, implementing all protection, plantation, and management activities and entering into protection contracts with local people.
Main reasons for the failure of mangrove replanting efforts
1. The planning and management of land use and mangrove forest use is ineffective and a lack of coordination between relevant sectors.
2. Lack of technical models of afforestation in the coastal areas.
3. Lack of suitable investment, especially for afforestation in erosive areas. Means for preventing waves, wind and promoting silt accretion are required before planting forests in these areas.
4. Limited staff capacity, insufficient personnel, insufficient FPM station, limited patrol, lack of close coordination with local authorities and people in FPM, especially improving the people's awareness (KGPPC/DARD 2011).

Climate Change Impact and Adaptation Study in Mekong Delta – Part A
201 | P a g e
8.4.2 Urban Settlements and Transport Most Districts interviewed were aware of plans for urban expansion and road improvements but had limited inputs in much of the details. For example, for the proposed route of the Southern Coastal Corridor all Districts were of the opinion that the details of any resettlement would be the responsibility of the Provincial authorities.
Urban water supply is the responsibility of one company in all but one of the Districts (Ca Mau) and for 11 out of 15 Districts (Kien Giang). Local authorities were thus understandably not confident about the details of the schemes operating in their urban areas.
Districts are responsible for some roads but road construction is merely the provision or upgrading of roads to communes and there is very little strategic planning being carried out.
Apart from the diesel generators on the island districts, energy infrastructure is controlled at the province level.
8.5 Survey Results With regards to the planning of urban, transport, industry and energy planning, the Capacity at the district level was captured at the district level through the survey questions.
It must be noted that the answers are presented as given by District authorities and are not checked for accuracy.
Table 69 shows the answers to the questions regarding the levels of consideration, concern, awareness and preparedness of the district to the impacts of climate change.
Most districts claim to be Very Concerned about potential impact of climate change on operations and that local people are somewhat aware of the potential impact of climate change. Most district claim to be somewhat prepared for climate change and to have directly considered potential impact of climate change on infrastructure or operations. 14 districts state that planning takes into account future climate changes. The survey results indicate that district officials consider that there is at least awareness of climate change issues and that some consideration of climate change issues has been incorporated into plans. However, the usual practice is to use consultants for preparing plans so the incorporation of climate change issues does not necessarily mean that the capacity exists at the local institutional level.

Climate Change Impact and Adaptation Study in Mekong Delta – Part A
202 | P a g e
Table 69 - Results of district survey regarding climate change preparedness and awareness.
District
District directly considered
potential impact of climate change on
infrastructure or operations
Level of concern about
potential impact of climate change on operations
Does planning take into
account future climate
changes?
Awareness of local people
about the potential impact
of climate change
Preparedness of District for
climate change
Rach Gia Somewhat Very Yes Somewhat Somewhat Ha Tien Somewhat Very Yes Somewhat Somewhat An Bien Somewhat Very Yes Somewhat Somewhat An Minh Somewhat Somewhat Yes Somewhat Somewhat Chau Thanh Somewhat Very Yes Somewhat Somewhat Giang Thanh Somewhat Very No Somewhat Somewhat Giong Rieng Somewhat Very Yes Somewhat Somewhat Go Quao Somewhat Very Somewhat Somewhat Hon Dat Yes Somewhat Yes Somewhat Kien Hai Somewhat Very Somewhat Somewhat Kien Luong Yes Somewhat Yes Somewhat Somewhat Phu Quoc No Very Yes Somewhat Somewhat Tan Hiep Somewhat Very No Somewhat Somewhat U Minh Thuong Somewhat Very Yes Somewhat Somewhat Vinh Thuan No Very Yes Somewhat Somewhat Ca Mau Somewhat Very Yes Not at all Cai Nuoc No Very Somewhat Somewhat Dam Doi Somewhat Very Yes Somewhat Not at all Nam Can Yes Very Somewhat Somewhat Ngoc Hien Somewhat Very No Somewhat Somewhat Phu Tan Somewhat Very Somewhat Very Thoi Binh No Very Yes Somewhat Somewhat Tran Van Thoi Somewhat Very Somewhat Somewhat U Minh Somewhat Very Yes Somewhat Somewhat
The results of the survey questions that relate to the perceived barriers to incorporating climate change adaptation into the planning process are shown in Table 70. Most districts claimed a lack of funding for climate change planning and adaptation measure investments and poor public understanding and a lack of public support as the main barriers to taking action to address potential climate change impacts. Very few districts claim uncertainty about climate change outcomes, a lack of coordination among government agencies or the practice of making decisions based on past conditions as barriers to taking action.
Rather than providing insights into the barriers and preparedness / consideration of climate change impacts at the district level, the survey results indicate a lack of understanding of the requirements for up to date climate change projections and a lack of capacity to generate non structural adaptation options that also contribute to socio economic improvement.

Climate Change Impact and Adaptation Study in Mekong Delta – Part A
203 | P a g e
Table 70 - Perceived barriers to incorporating climate change in district planning decisions.
Barrier District
Uncertainty about
climate change
outcomes
Lack of information
about potential climate change impacts
Poor public understanding
and lack of public
support
Lack of funding
for climate change
planning
Lack of funding for adaptation measure
investments
Lack of coordination
among government
agencies
Practice of making
decisions based on
past conditions
Rach Gia Yes Yes Ha Tien Yes Yes Yes An Bien Yes Yes Yes Yes An Minh Yes Yes Yes Yes Chau Thanh
Yes Yes Yes
Giang Thanh
Yes Yes Yes Yes
Giong Rieng
Yes Yes Yes Yes
Go Quao Yes Yes Hon Dat Yes Yes Yes Kien Hai Yes Yes Yes Yes Yes Yes Kien Luong
Yes Yes Yes Yes
Phu Quoc Yes Yes Yes Yes Yes Yes Tan Hiep Yes Yes Yes Yes Yes U Minh Thuong
Yes Yes Yes
Vinh Thuan
Yes Yes Yes Yes
Ca Mau Yes Yes Yes Yes Yes Cai Nuoc Dam Doi Yes Yes Yes Yes Nam Can Yes Yes Yes Ngoc Hien Yes Yes Yes Yes Phu Tan Yes Yes Thoi Binh Yes Tran Van Thoi
Yes Yes Yes Yes
U Minh Yes Yes Yes
8.6 Local Level In the agriculture sector, the main drivers of the exchange of information and the dissemination of new techniques are the local extension officers who have limited capacity to attend workshops and often play multiple roles in overseeing forestry, aquaculture and agriculture. Of key importance at the local level are the commune and Village heads, The Women's Union, the Youth Movement and local Farmers Unions. The agricultural success of individual villages and communes is often highly reliant on the strength of these groups.
The extent of the incorporation of climate change into the district planning process is outlined in the survey results outlined in Tables 69 and 70. No districts have yet prepared a climate change assessment or identified adaptation options and only one district Nam Cam has estimated likely climate change effects. Despite this lack of information regarding potential impacts of climate change, 3 districts have developed a climate change action plan and five have implemented adaptation option methods. While very few districts claim to have specific climate change in policy or plans many

Climate Change Impact and Adaptation Study in Mekong Delta – Part A
204 | P a g e
(particularly in Kien Giang) claim to have explicitly considered climate change in their 5 or 10 year master plans.
While many districts have started or plan to start awareness raising campaigns and improved forecasting, very few have developed controls and restrictions on development or considered retreat strategies.
8.7 Summary of institutional capacity in the area of climate change adaptation
The most important consideration for future Physical Planning is that Regional Policy as key provincial development decisions are conceptualised at and delegated from the national level.
The overview of the number of government bodies responsible for planning and management in the key sectors (agricultural and natural resources, industry, energy, urban Settlements and transport) illustrates one of the primary issues that inhibit effective management of these sectors, namely the considerable overlap of responsibilities among government agencies. This is compounded by a lack of inter agency communication and an institutional environment that actively suppresses cooperation and knowledge sharing.
This means that there is a lack of ability to develop coordinated strategies and policies. In addition, most ministries lack capacity to develop strong policy and secondary legislation. Other significant issues that hinder effective natural resource management include;
Ineffective inspection and enforcement and conflict resolution activities.
Low level of awareness, skills and technology for climate change adaptation.
Data and information is still scatted, monitoring networks are insufficient and data quality is not high.
In the agriculture and natural resource sector, there is considerable overlap of responsibilities among government agencies and all of the ministries, in particular the most directly active ministries, MARD and MoNRE, lack both horizontal and vertical coordination and cooperation. And budgets for natural resources development and management are limited and have not met the demand of the sector.
In the industry sector there is a lack of consideration of future climate effects, and in particular to extreme weather events as well as sea level rise for planned industrial and energy infrastructure. For the sector as a whole, there seems to be little overall coordination of how much total industrial area is actually being planned and/or developed in various areas. Ideally there would be a regional strategy which provided an overall framework within which Provinces could determine together the amount of industrial space that was appropriate given its investment potential.
In the urban sector, national Guidelines have been provided to provinces and cities to assist them to develop their own action plans. Unfortunately, the adaptation plans for both provinces have not been completed, and the planning instruments available, such as the socio-economic development plans do not clearly identify adaptation options other than the sea dike rehabilitation program.
Consultants are used extensively for developing strategic planning exercises and although all local authorities interviewed agreed that there were extensive consultations prior to plan preparation there seemed to be less certainty when plans or alignments were being amended and had not been finalised.
The survey results indicate that at the district level there is a lack of understanding of the requirements for up to date climate change projections and a lack of capacity to generate non structural adaptation options that also contribute to socio economic improvement.
No districts have yet prepared a climate change assessment or identified adaptation options and only one district Nam Cam has estimated likely climate change effects. Despite this lack of information

Climate Change Impact and Adaptation Study in Mekong Delta – Part A
205 | P a g e
regarding potential impacts of climate change, three districts have developed a climate change action plan and five have implemented adaptation option methods.
At the national level, the main adaptation measures mentioned in the NTP are also primarily 'structural' adaptation measures (sea dikes, reinforced infrastructure, more durable buildings) with some other measures, like resettlement, storm warning systems, and mangrove planting (MONRE 2008). Little attention has been paid to social vulnerability or 'non-structural' adaptation measures like community mobilization plans, social safety nets, insurance schemes, livelihood diversification, increasing institutional capacity, or the role of local action and social capital in building resilience and adaptive capacity outside of government programs.
The NTP emphasizes gender equality as one of the guiding principles. However, women's involvement in the consultations for the NTP's development was limited. Of key importance at the local level are the commune and Village heads, The Women's Union, the Youth Movement and local Farmers Unions. There is a lack of involvement of these key groups in the climate change adaptation process.
There are a number of projects (both past and present) which will assist in increasing resilience to the impacts of climate change in the Mekong Delta. These projects outlined in Appendix 7, collectively involve the strengthening of institutions, policy and regulations, and practices. Many follow on from, or are acting in synergy with, projects for the NTP.
8.7.1 Measures of Capacity The important measures of capacity are concerned with a set of cross-cutting, functional capacities, which are sector neutral and common to all organisations, institutions and systems. In the past few years research and on the ground development experience have shown that 'horizontal' investments in these cross-cutting capacities yield long-lasting and far-reaching development results. The cross-cutting capacity measures are:
1. The capacity to engage with stakeholders and create consensus around a policy, a bill or a plan;
2. the capacity to articulate the mandate of a new institution or to vision the trajectory of an organisation or even a society;
3. the capacity to develop a strategy, translate it into a plan and prepare a budget;
4. the capacity to implement a programme or a policy and
5. the capacity to monitor its implementation and evaluate results
These cross-cutting, functional capacities are not just merely management capacities; they hinge on, and are closely connected with,
6. effective and good leadership capacity;
7. the existence of effective and well functioning institutions and institutional arrangements, including a structured system of incentives;
8. an environment conducive to knowledge sharing and knowledge acquisition; as well as
9. Transparent and independent accountability systems.

Climate Change Impact and Adaptation Study in Mekong Delta – Part A
206 | P a g e
Table 71– Qualitative Assessment of institutional capacity for nine key measures.
Capacity component Assessment Engage with stakeholders and create consensus
Key provincial development decisions are conceptualised at and delegated from the national level Awareness programs are often in place but poor understanding by the public is stated as barrier. Women and farmers unions are poorly represented in planning stages
Vision a trajectory Prime minister proclamations generally contain appropriate visionary components
Develop a strategy and translate into a plan and budget
Strategies are poorly developed and plans lack concrete steps
Implement a programme or policy
Lack of processes and checks in programme implementation
Monitor and evaluate results Very weekly developed Effective and good leadership There is a distinct lack of tendency for individuals to take on decision making
roles Effective and well functioning institutions
Many institutions do not function well
Environment conducive to knowledge sharing
Institutional environment actively suppresses knowledge sharing
Transparent and independent accountability systems
Complete absence of transparency accountability system
The lack of institutional capacity is acknowledged by the central government and the capacity level can be summarised by a statement by the Prime Minister in 1995, which still holds today.
“The system of state environmental management agencies has been established from central to local levels, however, their capacity remains limited, especially at provincial level, which cannot thoroughly address local sustainable development issues. The coordination between state agencies and research institutions has not been very smooth, and information has not been quickly updated to meet the need for the adjustment of polices and plans within the environmental sector itself as well as the need of other socio-economic sectors. There is still a considerable shortage of secondary laws and regulations and other necessary legal documents. More importantly, there is a lack of economic measures and tools to encourage environmental protection as well as to deal with environmental violations in the market economy. Action strategies and plans on environmental protection were developed separately from those of socio-economic development and there was a poor participation from stakeholders, counterparts as well as communities, leading to limited viability” (Prime Minister 1995).
Capacity at the national, provincial and district level capacity was assessed through an analysis of existing planning components and the project survey. The results indicate that there is a considerable lack of institutional capacity at all levels of government. Capacity at the local level was not specifically assessed and would be an important component in the process of choosing sites for pilot projects. It is recommended that a formal assessment of adaptive capacity be carried out as a first step in designing an institutional climate change adaptation capacity building program.

Climate Change Impact and Adaptation Study in Mekong Delta – Part A
207 | P a g e
9. Key Findings & Recommendations
9.1 Climate Change Projections The future climate change projections for the Mekong Delta include:
9.1.1 Climate parameters Increased seasonal air temperature ranging from 0.7°C warmer by 2030 to 1.4°C warmer by
2050 for Ca Mau, and 0.5°C to 0.9°C warmer for Kien Giang by 2050; By the end of 21st century, the annual temperature would increase by about 1.5 to
2.0°C in Ca Mau and Kien Giang. The increase of Ca Mau is higher than in Kien Giang
The maximum temperature increases by less than the minimum temperature. By the end of 21st century, the maximum temperature can be higher than current record about from 2 to 2.5°C compared with an increase of 3.5 to 4.0°C for the minimum temperature.
By the end of 21st century, rainfall is expected to increase by about 3 to 4% in both Kien Giang and Ca Mau compared to the baseline.
Rainfall tends to increase in rainy months (by up to 25% by the end of the century) and decrease in dry months (can be from 30 to 35%). By the end of the 21st century, rainfall would increase in both Kien Giang and Ca Mau with an increase of 5-10% compared with the baseline period.
Extreme rainfall events will increase in intensity by around 10% by 2050. An average sea level rise of 15 centimetres in 2030 and 28-32 centimetres by 2050; and
By the end of the 21st century, the sea level from Ca Mau to Kien Giang would rise up to 72 cm (low scenario), 82 cm (medium scenario) and 105 cm (high scenario) compared with 1980-1999;
Relative humidity decreases in the dry months, increase in rainy months. However, the annual relative humidity tends to decrease slightly over both 2 provinces.
Average wind speed increases in winter, spring and autumn months, but decreases in the summer months. Annual average wind speed increases in most areas of Ca Mau and does not have a clear trend in Kien Giang.
9.1.2 Sea Level Rise & Inundation Sea level rise will represent significant challenges for the Mekong Delta, especially the low lying areas in Kien Giang and Ca Mau. Kien Giang and Ca Mau have elevations between 0 – 2 metres above sea level. Any change in the mean sea level, combined with the effects of storm surge associated with large storms or cyclones are likely to have dramatic consequences, especially for Ngoc Hien, Kien Hai and Phu Quoc Island.
9.2 Vulnerability to Climate Change Currently the Study Area has high exposure and low to moderate sensitivity to the potential impacts of climate change; however the magnitude of exposure, sensitivity, vulnerability and risk associated with

Climate Change Impact and Adaptation Study in Mekong Delta – Part A
208 | P a g e
these changes will change into the future, with a number of areas being assessed as highly vulnerable by 2050 as illustrated below.
9.2.1 Sea Level Rise & Storm Surge Sea level rise is expected to exacerbate coastal inundation, storm surge, erosion and other hazards potentially threatening infrastructure, settlements and facilities on the coastlines of both provinces, and the islands of Kien Hai and Phu Quoc. Ngoc Hien on the southern tip of the peninsular is especially vulnerable to inundation associated with storm surges during both dry season and wet season monsoons, and this will very likely threaten the long term development and viability of communities in that district. In addition, Rach Gia City, Ha Tien, Kien Luong and Ca Mau on the west coast are also threatened in terms of inundation from storm surge but to a lesser degree.
9.2.2 Increased Damage to Coastal Areas Increases in sea level, and the associated reduction in sediment transport and deposition patterns will lead to general and wide scale deterioration in coastal conditions, including lower levels of sedimentation on the east coast and an increase in coastal erosion on the west coast. Coastal Mangrove forests, already under threat from wide scale clearing will be exposed to increased erosion and reduced sediment supply. In addition to this it is likely that there will be a deterioration of beaches on Phu Quoc and other low set islands in the Kien Hai Island group.
These could become a greater problem should climate changes result in ‘unexpected’ changes in oceanic circulation patterns, local currents, wind direction and wave dynamics.
9.2.3 Risks to Population and People The provinces of Kien Giang and Ca Mau are home to approximately 2.94 million people, and have some of the highest population densities in the country. There is also a strong correlation between ethnicity and poverty on the study region.
Whilst poverty is important in terms of resilience and adaptive capacity, the relatively low levels of poverty in the region would indicate that it is not a principal driver of vulnerability.
The most important climate change hazards that potentially threaten the regional economy are: seal level rise, flooding and inundation, salinity, coastal erosion, and storm surge.
The main pressures driving socio-economic vulnerability in the region are demographic trends, population growth that puts pressure on land and water use, limited space (available land) and poorly planned industrial development.
The most severe socio-economic vulnerabilities relate to the combined effects of flooding, inundation and saline intrusion on agricultural lands and aquaculture lands - and the resulting impacts on livelihoods and GDP through loss of productivity from the major industry; processing of these products.
9.2.3.1 Vulnerability analysis The vulnerability analysis projected that by 2030 three districts, Rach Gia city, Chau Thanh and Ca Mau city will have higher comparative vulnerability in the population sector. By 2050 more districts become vulnerable as; more people migrate towards the largest urban centres; the area of districts that are impacted by climate change hazards increases, and the control measures currently in place fail. The most vulnerable districts with regard to population in 2050 are projected to be; Ca Mau city and Tran Van Thoi in Ca Mau and Rach Gia city and Chau Thanh in Kien Giang. Chau Thanh and Tran Van Thoi are located on the edge of the major urban centres and have attracted the less advantaged migrants
Climate Change Impact and Adaptation Study in Mekong Delta – Part A
209 | P a g e
that are unable to afford urban housing. These two districts have high numbers of poor and ethnic households and less access to health and education.
In the population sector the vulnerability analysis projected that by 2030 two districts in Ca Mau; Dam Doi and Ngoc Hien and five out of fifteen districts in Kien Giang; Giong Rieng, An Minh, Hon Dat and Chau Thanh will have higher comparative vulnerability. By 2050 more districts become vulnerable as; population increases; the area of districts that are impacted by climate change hazards increases, and the control measures currently in place fail. The most vulnerable districts with regard to poverty in 2050 are projected to be; Doi and Ngoc Hien in Ca Mau and Chau Thanh in Kien Giang. The most vulnerable districts are those with; high numbers of poor and ethnic households; a low income, and limited availability of agricultural land which is often compounded by limited access to health and education
Whilst all the indicators of poverty are important, in Kien Giang and Ca Mau the primary driver of poverty vulnerability proved to be access to land resources. As access to productive land is important for reducing rural poverty, the impacts of climate change on the productivity of land will further constrain efforts to combat rural poverty. In almost all districts limited space is either a problem now, or will be in the near future. In the Mekong delta pressure on space will increase dramatically in future, and this in turn will place unparalleled pressure on household livelihood systems and the regional economy in general.
The adaptive capacity of Government authorities in both provinces in relation to climate change issues is relatively low, and despite a long history of disaster management response planning, regional sector and socioeconomic development planning includes scant reference to climate change adaptation measures. Therefore, effective climate change adaptation measures are required to enhance the physical and economic climate resilience of the region, and in particular to protect poor and rural households.
9.2.4 Risks to Agriculture and Livelihoods Primary industry is the major contributor to the economies of both provinces, and any increase in the negative impacts on the agricultural systems from flooding, inundation, salinity and coastal erosion and sedimentation will impact not only on the livelihoods of local people, but also on the regional and national economies.
Agricultural activities are particularly susceptible to climate change impacts, and given the high percentage of people in the region working in agriculture this implies a higher level of socio-economic vulnerability than the national average. Both of the dominant agricultural farming and aquaculture systems in the study area appear to be the vulnerable to the harmful effects of climate change, especially the rice-based system.
9.2.4.1 Specific threats Increased temperature may result in decreased rice yields due to heat stress and decreased flowering potential. However, crop models incorporating CO2 fertilization predict increased yield provided irrigation requirements are met. The yields of sugar cane and maize are predicted to increase. Other fruit and vegetable crops may have decreased yields due to impacts on flowering/fruiting and/or changes in growth rates. For aquaculture, shrimp mortality may increase due to high water temperature, increase in disease levels and increased mortality in larvae production systems.
Higher wet season rainfall and in particular higher intensity extreme events may reduce rice yields through inundation damage, or localised flooding damaging farm infrastructure. Aquaculture may experience a reduction in salinity leading to decreased growth rates and disease or localised flooding damaging pond infrastructure. And fisheries may see a reduction in estuarine or near shore salinity leading to dramatic changes in fish ecology and reduction in catch. Lower dry season rainfall may result in increased salinity in canals leading to reduced growth rates for aquaculture and reduced rice yields. A decreased capacity for irrigation will affect not only rice but other crops.

Climate Change Impact and Adaptation Study in Mekong Delta – Part A
210 | P a g e
A potential climate impact specific to the rice shrimp farming system is a reduced cropping window through delays in planting the rice crop (because of need for rain to flush out salts) and reduced yields due to end of season salinity damage. Irregular seasonal changes can cause poor water quality and shrimp stress and disease.
9.2.4.2 Vulnerability analysis The vulnerability analysis projected that by 2030 two districts, Han Dat and Tran Van Thoi will have higher comparative vulnerability in this sector. By 2050 as the area of districts that are impacted by climate change hazards increases (predominantly inundation) and the control measures currently in place fail more districts become vulnerable. The most vulnerable districts in Ca Mau are U Minh, Dam Doi and Tran Van Thoi.
Eight districts in Kien Giang registered high vulnerability ratings (>18) in 2050: Hon Dat; Chau Thanh; Kien Luong; Giong Rieng; Go Quao; An Bien; An Minh and Rach Gia. All of these districts, with the exception of Rach Gia have high are highly dependent on water-reliant farming systems, and are highly exposed to river based flooding and inundation, while coastal districts Hon Dat; Chau Thanh; Kien Luong; An Bien; An Minh and Rach Gia are increasingly exposed to salinity and storm surge.
The vulnerability of secondary industry and the services sectors to climate change on appear to be a lot lower than that for the primary industry sector. Climate change impacts to natural systems will have the most significant negative consequences for natural resource dependant poor people, and will play a major role in compounding existing socio-cultural and environmental challenges in the Delta, such as poverty, livelihoods and welfare.
The pressure on land use and consequently on water demand will be higher and higher for agriculture development, especially rice crops and aquaculture. At the same time, fast expansion of industrial zones and urbanization will put more pressure to land availability.
9.2.5 Risks to Urban Settlements & Transport The urban settlement patterns on the Mekong Delta are fairly unique, and comprise of two the provincial centres of Rach Gia and Ca Mau and the 41 other provincial towns and district centres, primarily connected by an extensive and complex system of waterways and roads.
The main drivers of vulnerability in relation to human settlements in the region are population growth and urbanisation, and the associated pressure on land and water use, limited space (available land) and migration. Almost all of the urban settlements, buildings and infrastructure on deltaic floodplain in Ca Mau and Kien Giang are sited along the coast, or along canals and river banks and are already exposed to flooding and inundation. This situation is likely to worsen into the future as a result of sea level rise, and will represent a significant challenge for regional sustainability and development into the future. The most important urban settlement vulnerabilities relate to the effects of flooding and inundation - and the resulting impacts on households and urban infrastructure and services, especially water supply and sanitation.
Water transport is of crucial importance in both provinces as demonstrated by the disproportionately high volume of goods shipped out of the both provinces. Water transportation (rivers/canals) provides the natural comparative advantage of the Province as Inland waterways provide a cheap, all-weather and easily accessible network for all the population. However, significant investments in road network have been made in the last 10 in Ca Mau and Kien Giang in an integrated system of national, provincial and district level roads that service the main population centres. The region is also serviced by 3 domestic airports and there is a major border crossing to Cambodia near Ha Tien.
The most important vulnerabilities for the transport sector relate to the combined effects of river based flooding and coastal inundation associated with sea level rise.

Climate Change Impact and Adaptation Study in Mekong Delta – Part A
211 | P a g e
9.2.5.1 Specific Threats Inundation threatens the inhabited Low lying urban areas. Roads, particularly the lower district and commune level roads that are overtopped will suffer surface damage and erosion and bridges will be exposed to structural. While waterway Navigation will still be viable, navigation may be compromised due to overtopping and damage to canal banks and structures, particularly transport interchanges.
Urban and transport infrastructure is vulnerable to high water levels due to extreme rainfall events, higher tides due to sea level rise and river flooding. At high water levels the drainage network of pipes and culverts is unable to drain the runoff. This is also a problem with sewage disposal as septic tanks and direct outlet unable to drain due to high water levels. 8 districts in Ca Mau and 11 in Kien Giang rely on rainfall for recharging of water sources. Flood waters or saline water limit extraction times from surface water sources and can pollute uncapped groundwater wells. In Ca Mau City, new surface water sources from the east are being considered because of concerns about the quality and quantity of available groundwater: in Kien Giang the issue is finding/adapting surface water sources to ensure they have minimal and manageable salinity issues.
Extreme rainfall events or river flooding will increase leachate run-off from Solid Waste Landfills.
High temperatures will impact on vulnerable persons particularly in urban areas due to the heat island effect. They will also affect the surface and expansion joints on roads and bridges.
Saline intrusion will have limited impacts, but will increase rusting of transport infrastructure such as bridges, jetties and control structures.
Storm surge during strong monsoon conditions also threaten housing and transport infrastructure in the coastal urban centres of Ha Tien, Rach Gia, and Son Doc (Tran Van Thoi) and Cai Doi Vam (Phu Tan).
Typhoons will cause the most widespread and intense damages with a large amount of people and infrastructure at risk. All of the smaller fishing villages along the entire coastline are also vulnerable to storm surge.
9.2.5.2 Vulnerability analysis The vulnerability analysis projected that by 2030 two districts, Rach Gia and Ha Tien will have higher comparative vulnerability in this sector. By 2050 more districts are projected to become vulnerable as; the area of districts that are impacted by climate change hazards increases (predominantly inundation and salinity); the number of urban inhabitants increases; the exposure of surface water resources to sea level rise increases; the complexity and extent of transport interchange infrastructure increases, and the control measures currently in place fail. All of Ca Mau is exposed to salinity in the dry season. The most vulnerable districts in Ca Mau are those where inundation is projected to impact an urban centre and a large proportion of roads. The most vulnerable districts (and the % of roads inundated) are; U Minh (51%), Cai Nuoc (85%) and Tran Van Thoi (85%).
By 2050, Four districts in Kien Giang are projected to register high vulnerability ratings (>18) in the urban settlements and transport sector. The most vulnerable districts are those where; inundation and/or storm surge is projected to impact at least one urban centre and a large proportion of roads. The most vulnerable districts (and the % of roads inundated) are; Rach Gia (65%), Chau Thanh (85%), Kien Luong (87%) and Ha Tien (63%).
Overall the socio economic resilience and adaptive capacity in the urban areas is considered to be relatively high, primarily due to higher levels of income, wealth and support services and infrastructure in comparison with rural populations.
Whilst roads are usually considered to be highly vulnerable to SLR and only modest inundations may cause significant damages to a network, the actual designs of newly built or upgraded roads are based on flood records and local conditions - and National Roads are designed for 1 in 100 year floods and Provincial Roads for 1 in 50 year floods offering a high level of resilience.

Climate Change Impact and Adaptation Study in Mekong Delta – Part A
212 | P a g e
Transportation by water is generally less impacted by climate change and can be considered an all-weather solution. It will therefore be important to ensure that the full inland waterway network remains intact and well maintained for transportation as well as for drainage/irrigation purposes. Interchanges between inland waterways and key protected roads should be developed in key locations and the government should assist by constructing all-weather, long lasting jetties/wharves. This will assist in the movement of people and goods in future.
The increasing impacts into the future as a result of sea level rise, flooding and storm surge will represent a significant challenge for regional sustainability and development into the future. However the newly revised elevation levels and building codes which minimise the use of ground floors for habitation should go a long way to alleviating these issues. The move towards increased industrialisation will put more demands on both the land and water based transportation systems to ensure there is an efficient system to support processing and marketing of produce.
9.2.6 Risks to Industry and Energy The majority of industrial activities in the region relate to the processing of agricultural foods (primarily seafood food, ice making and rice processing). These factories are generally small scale, labour intensive and low value (in terms of capital investment). Capital intensive industry are limited in both provinces, however there are some substantial cement and boat building factories in the region, especially the Ha Tien area.
Approximately 95% of Ca Mau and Kien Giang households are connected to Vietnam's national grid with a modern electricity distribution system. Whilst there are some locally installed generating capacity on Phu Quoc and offshore islands the mainland of both provinces are connected to the national grid via high voltage 110 kV and 500 kV transmission lines. In Ca Mau there is natural gas power station, using gas supplied from an offshore field via a 325 km pipeline. In addition a large ammonia urea plant is under construction as part of this complex. There are plans to install a thermal generation plant in Ha Tien.
The most important vulnerabilities for the power sector relate to the combined effects of flooding and inundation and salinity on both the power generation and distribution systems. The power generation facilities in Ca Mau activities are particularly susceptible to the impacts associated with sea level rise, as they are all located on or adjacent to the coastal waterway system.
9.2.6.1 Specific threats Increased temperatures are not expected to have a large impact on this sector.
Industrial and energy infrastructure is vulnerable to high water levels due to; extreme rainfall events; higher tides due to sea level rise, and river flooding. At high water levels electricity substations may go offline with knock on effects to other industries and plant can be damaged. Many industrial industries are built along waterways or in low lying areas and are exposed to inundation e.g. industrial zones, Cement production and brick making plants.
Saline intrusion will have limited impacts, but will increase of salt corrosion of infrastructure and the power distribution system.
Typhoons will cause the most widespread and intense damages with a large amount of infrastructure at risk. The 110 kV transmission backbone and the 22/ 12.7 kV and 220V local distribution systems are vulnerable to typhoons as are the offshore island diesel generators. Typhoon damage to substations and power lines will impact other industries, particularly the Ca Mau Gas Fired power fertiliser complex and the Kien Luong Cement production and brick making plants. There will also be implications for all other forms of industry and key industrial outputs such as ice would therefore be unavailable or far more costly to produce.

Climate Change Impact and Adaptation Study in Mekong Delta – Part A
213 | P a g e
9.2.6.2 Vulnerability analysis The vulnerability analysis projected that by 2030 only one district, Rach Gia will have higher comparative vulnerability in this sector. By 2050 more districts are projected to become vulnerable as; the area of districts that are impacted by climate change hazards increases (predominantly inundation and salinity); the number of people reliant on industry increases; the complexity and extent of power generation and supply increases, and the control measures currently in place fail. The most vulnerable districts are those with a large number of households that are highly dependent on local industry for employment or income, and are most exposed to SLR, flooding, inundation and extreme events.
The most vulnerable districts are those where inundation is projected to impact industrial centres and a large proportion of power lines. All of Ca Mau is exposed to salinity, so the more vulnerable districts in Ca Mau (and the % of medium voltage power lines inundated) are; Ca Mau City (67%), Tran Van Thoi (85%), Phu Tan (66%), Thoi Binh(33%), Ngoc Hien (35%) and Dam Doi (45%).
By 2050, Four districts in Kien Giang are projected to register high vulnerability ratings (>18) in the industry and energy sector. The most vulnerable districts are those where; inundation and/or storm surge is projected to impact at least one industrial centre and a large proportion of power lines. The most vulnerable districts (and the % of medium voltage power lines inundated) are; Tan Hiep (99%), An Minh (No medium voltage power lines but industries exposed to all three hazards), An Bien (84%), Kien Luong (98%), Giong Rieng (94%), Chau Tanh (91%), Hon Dat (100%) and Rach Gia city (94%).
Overall the resilience and adaptive capacity of both the low intensity and capital intensive industries in the region are considered to be medium to high. Resilience and adaptive capacity are directly linked with income, profitability and the ability to invest in protection measures. The high profitability of some of these enterprises, combined with low capital investment requirement and short asset lifecycles creates the circumstances whereby they not only have time to adapt, but also have ample funding. In addition to this the majority of established factories and the new industrial zones are defensible at relatively low cost.
However the costs of losses to production from flooding and inundation in any one year could potentially be very significant. Especially since the economy of both provinces is so reliant on agricultural activities whether directly (the actual rice or shrimp farming) or indirectly with up- or downstream activities such as feed supply, equipment, transport, processing and packaging industries. The risk of secondary impacts is also high. For example Ca Mau is the largest aquaculture processing province in Vietnam and accounts for approximately 70% of Vietnam's aquaculture production and exports. Future adaptation planning will need to focus on facilitating the growth of aquaculture in both provinces, and transitioning industrial production to be less reliant on agricultural production. However, there is ample opportunity to climate proof the current factories and enterprises to build resilience and enhance adaptive capacity
Overall the resilience and adaptive capacity of both the power generation and transmission systems in the region are considered to be low to medium. The Ca Mau gas power/fertiliser complex is not particularly at risk of sea level rise in its remaining 20 year source life. Likewise the medium voltage (22/12.7 kV) and low voltage (380/220 V) electricity distribution system is relatively new and has a 12 / 15 year (salt water / fresh water) design economic life, and the high voltage systems (110 kV) have a 30 year economic life so should not too adversely affected through to 2030, and can be replaced by a more climate resilient system by 2050.
9.2.7 Uncertainties & Unexpected Events Significant uncertainties remain in the science underlying our climate change projections and our assessment of climate change risks. It is possible that the Mekong will also face a number of unforeseen changes in the physical climate system (such as major changes in ocean circulations) or ecological impacts that may not be anticipated. Whilst further research would improve understanding the ability to project societal and ecosystem impacts, and provide the Mekong Delta communities with additional useful information about options for adaptation it should not occur at the expense of action

Climate Change Impact and Adaptation Study in Mekong Delta – Part A
214 | P a g e
on-ground now. The need to start now cannot be stress strongly enough, and given that the majority of successful adaptation options are consistent with best development practice, there is no need not wait for full information before acting.
9.3 Future Challenges This report provides background information on climate change impacts, vulnerability and
risks within Kien Giang and Ca Mau provinces, and is intended to serve as a starting point for developing a range of projects suitable for implementation in Phase B of the project. However there are a range of other issues that were beyond the scope of the study that require further consideration, including:
How can the results of current future studies of this nature (and especially the meteorological and climate modelling), be disseminated more effectively so that the information can be more readily available to others? This is an extremely important point for the Government of Vietnam to address.
With a plethora of climate change studies being carried out by many different organizations in Vietnam, and especially on the Mekong Delta, how can future adaptation projects be coordinated so that work is not duplicated?
Internal migration from rural areas to provincial centres or to the large cities, and the question of how climate change impact on this is a highly sensitive issue, which only the Government of Vietnam can address.
How can existing networks and organizations be better used to improve cooperation on adaptation activities and enhance resilience.
9.4 Suggested Adaptation Themes This study has attempted to identify a range of sectoral adaptation themes for the target sectors: agriculture, industry, energy and transportation together with areas where ‘non-structural’ adaptation options suitable for addressing social and natural system vulnerability, such as increasing institutional capacity or the role of local action and social capital in building resilience in human settlements, livelihoods and natural systems could be adopted.
It must be noted that Part B of the project will focus on developing these idea further and on devising pilot projects and scaling up procedures.
Adaptation Planning Workshops
Participatory adaptation planning workshops were conducted in both provinces to identify and categorize locations and adaptation themes suitable for different provinces and districts. Participants in the work-shops included members from vulnerable districts and provincial officials. The results of the CVRA climate scenarios were played out to let district representatives and officials have a chance to assess the range of hazards, impacts, vulnerabilities and risks, as well as to identify different adaptation issues that need to be addressed at the local level.
In the provincial adaptation planning workshops various areas where adaptation measures could be concentrated to improve sectoral resilience and sustainability were proposed. During the workshops, participants were organized into resource-based sector working groups. These working groups were tasked with evaluating climate impacts to their respective resource districts and areas based on the findings from the vulnerability and risk assessment – and then asked to identify areas where adaptation measures might be needed for 2030 and 2050 planning timeframes.
The results of the vulnerability assessment, together with the outputs of the regional workshops were used to develop a list of theme areas where it was considered that adaptation options should best be concentrated. For each theme area the priority locations are were also identified. Table 72 summarises

Climate Change Impact and Adaptation Study in Mekong Delta – Part A
215 | P a g e
the areas for adaptation capacity strengthening and the priority locations that are recommended for consideration for Part B of this Project.

Climate Change Impact and Adaptation Study in Mekong Delta – Part A
216 | P a g e
Table 72 - Recommended Adaptation themes.
Priority sector Recommended Adaptation Themes Priority Locations
Livelihoods & Poverty
Strengthening Rural Livelihoods in Kien Giang and Ca Mau (including fishing, irrigated agriculture and aquaculture systems, and transition areas).
Provincial - but focusing on: U Minh; Dam Doi; Tran Van Thoi (in Ca Mau) and Hon Dat; Rach Gia; Chau Thanh; Kien Luong; Giong Rieng; Go Quao; An Bien; and An Minh (in Kien Giang).
Agriculture & Aquaculture
Climate Change Adaptation Options for Agriculture and Aquaculture Livelihoods Enhancement and Poverty Alleviation to Promote Community Resilience to Reduce Vulnerability in Kien Giang and Ca Mau
Ca Mau: U Minh; Dam Doi; Tran Van Thoi, and Ngoc Hien. Kien Giang: Hon Dat; Rach Gia; Chau Thanh; Kien Luong; Giong Rieng; Go Quao; An Bien; and An Minh
Water Resource Management
Strengthening of Integrated Water Resource Planning, Protection and Management for the Ca Mau peninsula (including agricultural land use zonation and improvement programs for agriculture and aquaculture).
Regional
Coastal Zone Management
Strengthening of Integrated Coastal Zone Planning, Protection and Management for Kien Giang and Ca Mau provinces (including sea dyke and mangrove restoration).
East and West coastlines and offshore islands of Phu Quoc and Tien Hai
Assessment of Climate Change Impacts on the Marine and Coastal Ecosystems and Wild Fisheries’
Regional
Development and Implementation of a Coastal Erosion and Sedimentation Monitoring Program
Regional
Urban & Regional Planning
Strengthening Institutional and Human Resource Management Capacity in Kien Giang and Ca Mau for Climate Change Adaptation Planning and Implementation (for the development of adaptation plans and programs at the provincial and district level in support of the NTP).
Provincial
Assessment of Climate Change Adaptation Options for Protection of Urban Settlements in Kien Giang and Ca Mau (including the development of flood control and drainage works to protect key infrastructure assets, buildings and lives).
Cai Nuoc, Tran Van Thoi, Ca Mau. Chau Thanh, Kien Luong, Ha Tien and Rach Gia
Transport Planning
Review of the Transport Network and Infrastructure (roads and waterways) in Kien Giang and Ca Mau (complementary to the Mekong Delta Plan).
Regional
Industry & Energy
Mainstreaming of Climate Adaptation Provisions into Industrial Development Zones and Development Control (including an awareness and education program for industry).
Provincial – but focusing on Dam Doi, Tran Van Thoi, Ca Mau, Chau Thanh, Hon Dat and Rach Gia
Emergency Management
Strengthening of Emergency Preparedness and Response Capacity for Extreme Events in Ngoc Hien, Phu Quoc and Tien Hai Districts (including coastal hazard mapping for the Phu Quoc and Kien Hai Island Groups and development control, relocation and resettlement provisions for Ngoc Hien).
Ngoc Hien, Phu Quoc and Tien Hai Districts

Climate Change Impact and Adaptation Study in Mekong Delta – Part A
217 | P a g e
10. References ADB (2007). Resettlement Planning Document. Resettlement Plan (Kien Giang) Draft Project
Number: 36353. GMS Southern Coastal Corridor Project. January 2007. Prepared by the Socialist Republic of Viet Nam. Ministry of Transport.
ADB, 2009. The Economics of Climate Change in Southeast Asia: A Regional Review. Asian Development Bank, Manila.
Adger, W. N. (1999). Social Vulnerability to Climate Change and Extremes in Coastal Vietnam. World Development Vol. 27, No. 2, 1999
Adger, W. N., Brooks, N., Kelly M., Bentham G., Agnew, M. and Eriksen, S. (2004). New Indicators of Vulnerability and Adaptive Capacity. Tyndall Centre for Climate Change Research Technical Report; 7. Tyndall Centre for Climate Change Research, Norwich, UK.
ANRC 1997, Situation Report Typhoon Linda Vietnam The American National Red Cross. http://reliefweb.int/node/34408 (accessed November 2011).
Carew-Reid, J. (2007): Rapid Assessment of the Extent and Impact of Sea Level Rise in Viet Nam. International Centre for Environmental Management (ICEM), Brisbane, Australia.
CCFSC (2001). Second National Strategy and Action Plan for Disaster Mitigation and Management in Viet Nam – 2001 to 2020. Central Committee for Flood and Storm Control (CCFSC), Ministry of Agriculture and Rural Development, Hanoi
CM2 DEIA 2006 - Revised report on DEIA for Ca Mau Power Plant Project (Part of DEIA for Ca Mau 2 Power Plant), CPMB– RDCPSE-Final report, June 2006
Cutter, S.L., Barnes, L., Berry, M., Burton, C., Evans, E., Tate E. and Webb, J. (2008) ‘A place-based model for understanding community resilience to natural disasters’, Global Environmental Change 18, 598–606.
Dang, N.X. (2009). Rapid assessment of flora and terrestrial animals in Key Areas of the Kien Giang Biosphere Reserve. GTZ Conservation and Development of the Kien Giang Biosphere Reserve Project, Ha Noi.
Duke, N., Wilson, N., Mackenzie, J., Nguyen, H. and Puller, D. (2010). Assessment of Mangrove Forests, Shoreline Condition and Feasibility for REDD in Kien Giang Province, Vietnam. GTZ Conservation and Development of the Kien Giang Biosphere Reserve Project, Ha Noi.
FAO (2007). The State of World Fisheries and Aquaculture, 2006. Food and Agriculture Organization, Rome.
Haa, T. T. P., van Dijkb, H. and Bosmac, R. (2010). Livelihood opportunities and fishery management in Ca Mau, a coastal province of Vietnam. Proceedings of; Colorado Conference on Earth System Governance, 17-20 May 2011. Colorado State University.
Hao, N.V., Thuy, D.T., Loan, L.T.T., Phi, T.T., Phuoc, L.H., Duong, H.H.T., Corsin, F. and Chanratchakool, P. (1999). Presence of viral pathogens in wild shrimp species Ca Mau. Asian Fisheries Science, 12.

Climate Change Impact and Adaptation Study in Mekong Delta – Part A
218 | P a g e
IMHEN (2010a): Impacts of climate change on water resources and adaptation measures. Vietnam Institute of Meteorology, Hydrology and Environment (IMHEN) and Danish International Development Agency (DANIDA).
IMHEN (2010b): Sea level rise - scenarios and possible risk reduction in Vietnam. Vietnam Institute of Meteorology, Hydrology and Environment (IMHEN) and Danish International Development Agency (DANIDA).
IPCC (2007): Climate Change 2007: Synthesis Report. Contribution of Working Groups I, II and III to the Fourth Assessment Report of the Intergovernmental Panel on Climate Change. [Core Writing Team, Pachauri, R.K and Reisinger, A. (eds.)], IPCC, Geneva, Switzerland, 104 pp.
KGPPC/DARD (2011), Project of Restoration and Development of Coastal Protection Forests in Kien Giang Province Period 2011 – 2020, Kien Giang People’s Committee Department of Agriculture And Rural Development, Rach Gia.
Kharin, V. V., Zwiers, F. W., Zhang, X., & Hegerl, G. C. (2007). Changes in Temperature and Precipitation Extremes in the IPCC Ensemble of Global Coupled Model Simulations. Journal of Climate, 20(8), 1419-1444.
Leach, M., Mearns, R. and Scoones, I. (1999). Environmental Entitlements: Dynamics and Institutions in Community-Based Natural Resource Management. World Development. 29 (no. 2 225-247).
Li, Y. and Ye, W. (2011). Applicability of ensemble pattern scaling method on precipitation intensity indices at regional scale, Hydrology and Earth System Sciences Discussion, 8, 5227–5261.
Mainuddin, M. (2011). Agricultural productivity and food security in the lower Mekong Basin: impacts of climate change and options for adaptation Presentation at the 1st Meeting of Climate Change Adaptation Demonstration Projects, 21-22 July 2011, Ho Chi Minh City, Vietnam.
MONRE (2009a). Climate change, sea level rise scenarios for Vietnam. Vietnam Ministry of Natural Resources and Environment (MONRE).
MONRE (2009b). Guideline on Formulation of Action Plans to the Ministries and Localities to Respond to Climate Change. (Attached to the Official letter No. 3815/BTNMT-KTTVBDKH dated October 13th 2009 by MONRE). Hanoi, 2009
MONRE (2010): Vietnam's Second Communication to the United Nations Framework Convention on Climate Change. Vietnam Ministry of Natural Resources and Environment (MONRE), Ha Noi.
MONRE (2011): Climate change, sea level rise scenarios for Vietnam. Vietnam Ministry of Natural Resources and Environment (MONRE).
Moss, B. 2008 Water pollution by agriculture. Phil. Trans. R. Soc. B 363, 659–666.
MRC (2010). State of the Basin Report 2010, Mekong River Commission, Vientiane, Lao PDR.
Murphy, J. M., Sexton, D. M. H., Barnett, D. N., Jones, G. S., Webb, M. J., Collins, M., (2004). Quantification of modelling uncertainties in a large ensemble of climate change simulations. Nature, 430(7001), 768-772.

Climate Change Impact and Adaptation Study in Mekong Delta – Part A
219 | P a g e
Nhan, D. K., Nguyen Van Be, N.V. and Nguyen Hieu Trung, N.H. (2007). Water Use and Competition in the Mekong Delta, in Be, T. T., Sinh, B. T. and Miller, F., Challenges to Sustainable Development in the Mekong Delta: Regional and National Policy Issues and research Needs. The Sustainable Mekong Research Network, Bangkok, Thailand.
O'Brien, K. L. and Leichenko, R. M. 2000. Double Exposure: Assessing the Impacts of Climate Change Within the Context of Economic Globalization. Global Environmental Change 10, 221-232.
Preston, N & Clayton, H (2008). Rice-shrimp farming in the Mekong Delta: biophysical and socioeconomic issues. ACIAR, Canberra.
Pretty, J. and Ward, H. (2001). Social Capital and the Environment. World Development. 29 (no. 2). World Dev. 32, 209–227
Prime Minister (2011). PM Highlights Development Strategy for 2011- 2020. Prime Minister Nguyen Tan Dung article about major contents of the draft socio-economic development strategy for the 2011-2020 period and the country’s key tasks in 2011. dztimes.net. 2011.
Quynh, D.N. (Ed) (2010). Research on the Natural Condition and Environment for the Southwest Sea, Facilitate to the Economic development and National Security. Institute of Mechanism, Ha Noi.
Smit B. and Wandel J. (2006) ‘Adaptation, Adaptive Capacity and Vulnerability’. Global Environmental Change 16(3), 282–292.
Tiempo. (2011). Typhoon Linda hits Vietnam http://www.tiempocyberclimate.org/portal/archive/issue26/t26art5.htm (accessed November 2011).
Turner, B. L. Roger E. Kasperson, R.E., Matsone, P.A., McCarthy, J.J., Corell, W.R., Christensen, L., Eckley, N., Kasperson, J.X., Amy Luers, A., Martello, M.L., Colin Polsky, C., Pulsipher, A. and Schiller, A. (2003). A framework for vulnerability analysis in sustainability science. Proc. Natl. Acad. Sci. USA, vol. 100 no. 14.
UNDP (2009) Gender and Climate Change Impacts in Viet Nam. UNDP, Ha Noi.
VASEP 2011(b). Sea Food Export Reached US$ 5 billion. Volume 1, Issue 8. VASEP, Ha Noi.
Vietnam Consultative Group (2010), Vietnam Development Report 2011; Natural Resources Management, Technical report, Vietnam Consultative Group Meeting, Hanoi.
WAR, (2006). Eco-tourism development strategy of Phu Quoc National Park. Wildlife At Risk, Ha Noi.
Wikipedia 2011. Tropical Storm Linda (1997) http://en.wikipedia.org/wiki/Tropical_Storm_Linda_%281997%29 (accessed Nov 2011)
World Bank (2007). Environmental Impact Assessment (EIA) Mekong Transport Infrastructure Development Project (MTIDP), Volume III – EIA for Waterway Network Improvement Projects. World Bank/Ministry of Transport. Hanoi, March 2007
World Bank (2009). World Development Report 2010. Development and Climate Change. Background Note. Assessing Extreme Climate Hazards And Options For Risk

Climate Change Impact and Adaptation Study in Mekong Delta – Part A
220 | P a g e
Mitigation And Adaptation In The Developing World by Nicola Ranger, Robert Muir-Wood, and Satya Priya, Risk Management Solution (RMS), London, UK 2RMS India (RMSI), Noida, India. February 2009.
World Bank (2010). The Economics of Adaptation to Climate Change, Vietnam. The World Bank, Washington.
Yohe, G. and Tol, R.S.J. (2002). Indicators for social and economic coping capacity – moving towards a working definition of adaptive capacity, Global Environmental Change, 12, 25-40.

Climate Change Impact and Adaptation Study in Mekong Delta – Part A
221 | P a g e
11. Appendices
Appendix 1. Suggested Vulnerability Indicators as recommended by International Experts.
Indicator Description
Economic Indicators Population density Population density influences the number of people actually affected by climate
change but a higher density generally implies that resources can be pooled for mitigating any adverse shocks. In other words, in areas with high population density the population is more likely to be less vulnerable to external shocks.
Urban population In general urban populations seem to be more resilient to external shocks than those living in rural areas as they are more dependent on agriculture. Urbanization also implies resources to invest in adaptation options can be pooled and can be more efficiently used given the high concentration of people in an urban area.
Population at working age (% of total)
Gives an idea of how dynamic and mobile the workforce may be
Medical services (No. population / Doctors)
Climate change increases the likelihood of waterborne diseases and the availability of more and better medical services mitigates the population’s vulnerability.
Education. (Number of people / teachers)
Gives an idea of the level of education. A higher education level improves the ability to cope or to adapt
Agricultural activity Agricultural activities are susceptible to climate change impacts and vulnerable. The higher the percentage of people working in agriculture the higher its socio-economic vulnerability.
Poverty Poverty is a function of GDP and equality of its distribution. The higher the incidence of poverty the less likely people can afford to invest in adaptation measures.
GDP The higher the GDP per capita the higher the likelihood of investing in adaptation options and as a result the lower its socio-economic vulnerability
Agriculture and Livelihoods No. of Rural Households
Rural households are generally directly dependant on natural resources and tend to have lower incomes. Both factors that increase exposure to impacts
No. of Livelihood Streams
A larger diversity of incomes increases the ability to cope with impacts or to adopt new strategies.
No. of Employment Streams Employing > 10,000 or producing >250 Billion VND
Industries that have a large resource base are better able to cope with or adapt to climate change impacts. A larger variety of industries increases the likelihood that some income will still be generated despite impacts
Average Annual GDP per Household
The higher the GDP per capita the higher the likelihood of investing in adaptation options and as a result the lower its vulnerability to single impacts
Rice Crop Land per Person (ha)
A larger area of land increases income, and it increases the chance that part of a crop may not be affected
Aquaculture Land per A larger area of land increases income thereby decreasing vulnerability and

Climate Change Impact and Adaptation Study in Mekong Delta – Part A
222 | P a g e
Indicator Description Person (ha) increases the scope for applying more sustainable aquaculture practices and
diversity. Urban and Transport Indicators Population density (Persons/km2)
Provides an idea of whether District has dispersed population or not. Lower density can be associated with limited service provision and remoteness. However, averages for Districts do not indicate locations of high or low densities.
Urban Population (No.)
Indicates the number of people that will be affected by impacts on Urban areas.
Urban Households (No.)
Indicates the number of household that will be affected by impacts on Urban areas.
Urban Area (ha) Gives an idea of the size of the areas that may be exposed to impacts Population Annual average growth rate (%)
Gives an idea of how popular the District is (includes migration) and potential economic strength
Urban settlements which flood (No.)
Gives an idea of the current scale of the problem
Households affected by flood/salinity
Gives an idea of the current scale of the problem
Poor Households (Numbers/ %)
Allows an insight into vulnerability through lack of income to deal with Climate issues (rebuild higher, move). Figures provide for locations of extreme poverty.
Water Supply A high level of piped water indicates an urban supply company and higher levels of safety/quality than individual/unsupervised sources. Adequate supply allows individuals to cope with impacts
Waste treatment Access to safe waste treatment decreases vulnerability and improves the ability to bounce back from impacts
Roads (Km) Could be used to relate to vulnerability of persons in the event of disasters (e.g. typhoon). Could also be used to assess the physical vulnerability of roads in the District.
Length of navigable waterways (Km)
Covers the main transport mode for many people/goods. As well as the location of much of the small industries and rural housing
Industry and Energy Indicators Labour source unemployment
A higher number reduces the ability to cope with impacts
Labour source by activity (Number / %)
Should give an indication of urban/rural activities. If we associate vulnerability more with rural locations/activities then gives some indication.
Households reliant on Industry (No.)
Indicates the reliance on industry. A low input to household income means there is no alternative income if agriculture is affected.
Average Annual GDP per Household contributed by Industry
Indicates the contribution of industry to the local economy. A higher contribution indicates a move towards a more resilient economic structure
Households Connected to the National Grid (No.)
Contributes to the ability to recover from impacts. E.g. pumping water, restarting industry etc.
Length of Indicates the amount of energy infrastructure that is potentially exposed to

Climate Change Impact and Adaptation Study in Mekong Delta – Part A
223 | P a g e
Indicator Description High/Medium Voltage Power Lines (Km)
impacts
No. of Power Plants/High Voltage Substations
Indicates the amount of structures that are potentially exposed to impacts
Off-farm Income (%) A larger diversity of incomes increases the ability to cope with impacts or to adopt new strategies.
Number of Factories Indicates the amount of industry infrastructure that is potentially exposed to impacts
Number of Different Industries
A larger variety of industries increases the likelihood that income will still be generated.

Climate Change Impact and Adaptation Study in Mekong Delta – Part A
224 | P a g e
Appendix 2. Summary Climate Vulnerability Assessment – Industry Assets Industry Exposure to climate hazards Adaptive capacity
Elements Distribution Sensitive to? Why? How Sensitive
?
Current 2030 2050
How assets could be
adapted
Adaptive capacity
Shrimp, fish & fish meal processing
1-3 main sites per province
Flooding, typhoons
Plants built on waterways and at low elevation. Shrimp ponds and fishing boats damaged in typhoons
Minor None – adjusted to current climate
10% - 25%
25-50%
Raise sites, build berms, move
High, as low asset values vs revenues
Cement production & brick making
5 cement & 1 brick making plant in Kien Luong Dist., KG province
Flooding, typhoons
2 largest cement plants built on/near sea access. All sites low lying.
Minor None 10% - 25%
All Raise sites, build berms
High
Ice making plants
Most districts Flooding, typhoons
Flooding of plant sites, power cuts from typhoons
Minor All All All Cope, raise sites, move
High
Tourism Mainly Rach Gia & Phu Quoc
High water levels
River or marine flooding Moderate None 0% – 10%
10-25%
Cope, raise sites, move
Medium
General industry & handicrafts
All urban centres & some districts
High water levels
Business interruption while water levels high
Minor 50% 75% 75% Cope, raise sites, move
Medium
Sugar cane processing
One per province
High water levels
Climate risk is mainly to sugar cane growing. Bigger risk from low sugar cane growing profitability
Minor All All All Cope, raise sites, move
Low

Climate Change Impact and Adaptation Study in Mekong Delta – Part A
225 | P a g e
Appendix 3. Summary Climate Vulnerability Assessment – Energy Assets Energy systems Exposure to climate hazards
Elements Distribution Sensitive to (in priority order)?
Why? How sensitive?
Current 2030 2050 How assets could be adapted
Adaptive Capacity
Ca Mau gas-power-fertiliser complex
One Typhoons, increased salinity, flooding
Substation offline with flooding. Typhoon causing physical damage to substations & export power lines. Increased salt corrosion.
Minor All All Gas supply only to 2033. 2050 is beyond complex life
Increase diesel stored on site. Upgrade substations/lines Use better paints & galvanized bolts etc
High
220kv and 500 KV lines and main substations – inter connectors to national grid
One per Province
Typhoons, flooding, increased salinity
Typhoon physical damage to substations and power lines. Substations offline in flooding. Salt corrosion.
Minor All All All Towers on higher concrete bases. Raise substations or add berms and pumps.
High
110 kV high voltage transmission backbone
110/22kV substation in most districts
Typhoons, increased salinity, flooding
Typhoon-physical damage to substation & power lines. Substations offline in flooding. Salt corrosion.
Moderate All All All Towers on higher concrete bases. Raise substations or add berms and pumps
High
22/12.7 kV medium voltage distribution lines & pole transformers
Every district Typhoons, increased salinity, flooding
Typhoon-physical damage to power lines. Salt and inundation reduce pole life.
High All Beyond current system life
Beyond current system life
Poles in stronger gravel bases. Use salt resistant concrete.
High
400/220V three/single phase low voltage distribution to nearly all households
E very district Typhoons, increased salinity, flooding
Typhoon-physical damage to substation & power lines. Substations offline in flooding. Salt corrosion.
Very high All Beyond current system life
Beyond current system life
Poles in stronger gravel bases. Use salt resistant concrete.
High
Offshore island diesel generators and backup diesel generators in industrial plants
Many districts Typhoons, flooding
Typhoons knock out island power distribution systems. Typhoons knock out grid so backup plants have to operate - high diesel cost.
Moderate All Beyond current system life
Beyond current system life
Add diesel storage. Strengthen distribution lines. Remove branches and trees near lines.
High
Submarine cable to Phu Quoc - 110 kV AC
From Ha Tien in Kien Giang
Typhoons Typhoons knock out 110kV land interconnection lines
Moderate 25% 25% 25% Strengthen 110kV land connections
High
Cement Waste Heat Recovery power generation
Ha Tien #2 and Holcim plants
Flooding Business interruption Minor All All Beyond limestone resource life
Raise plant site or add berms & pumps
High
Sugar cane bagasse power generation
One plant in ea province
Typhoons, flooding
Sugar cane crops damaged Minor All All All Move sugar cane growing area to higher ground. Move plant.
High
Liquid fuels - diesel, petrol, LPG, jet fuel, etc
Distribution points in all districts
Typhoons Damage to wholesale/retail distribution facilities / jetties
Minor All All All Strengthen jetties and buildings. Raise store floor level
High
Solid fuels – coal, rice husks, wastes ,for cement, wood, charcoal
All districts Typhoons, high water levels
Damage to distribution points and jetties. Flooding of rice husk stores.
Minor All All All Strengthen jetties and buildings. Raise store floor level.
High
Rice husk export power generation
Potential in each province
Flooding, drought, salinity
Drought-crop failure, salinity means rice cannot be grown
Minor All All All Move plant to higher ground or import rice husks
High
Solar PV households – island power grids
Offshore islands /some remote areas
Typhoons Damage to panels from falling trees & flying debris
Minor All All All Remove nearby branches/trees. Strengthen buildings, esp. roofs.
High

Climate Change Impact and Adaptation Study in Mekong Delta – Part A
226 | P a g e
Energy systems Exposure to climate hazards Elements Distribution Sensitive to (in
priority order)? Why? How
sensitive? Current 2030 2050 How assets could be
adapted Adaptive Capacity
Biodigesters Concentrated livestock raising areas
Typhoons, flooding
Flooding of digesters Minor All All All Raise height of feedstock entry point
Moderate

Climate Change Impact and Adaptation Study in Mekong Delta – Part A
227 | P a g e
Appendix 4. Extreme precipitation event analysis based on GCM daily data
GCM outputs are still the most reliable source of information for future climate scenario projections. With more and more detailed GCM data becoming publicly available, including daily time series, it is now possible to pursue more advanced methods for daily extreme precipitation event analysis, which can be based on the finer temporal results. GCMs have relatively poor performance on simulating precipitation at a regional or local scale compared to the historical observed data. This has seriously limited the direct use of GCM precipitation time series in extreme precipitation event analysis. Dynamic downscaling improves the accuracy at finer scales but only to a limited extent. A major drawback of this method is its high computational demand for only one or two simulation outputs. This makes it very difficult for uncertainty analysis for different emission scenarios and different GCMs. A statistical downscaling technique provides a computationally efficient and hence cost-effective solution that can lead to improved accuracy of GCM results. The results can be used not only in the generation of precipitation time series, but also for the analysis of the possible changes to extreme precipitation events under different climate change scenarios. To date, scientific research has not produced a satisfactory method at a fine spatial scale that readily can be implemented for simulating daily precipitation, particularly for extreme analysis.
Among the wide range of climate variables, precipitation extremes have attracted much research attention because of the potential disasters these may cause to human society and natural systems. Extreme precipitation events are projected to increase with climate change, even in areas where the total precipitation is projected to decrease (Meehl et al., 2007), since global warming will noticeably enhance the hydrological cycle at both global and local scales. In order to adequately assess the climate change impact on extreme precipitation events, the characteristics of GCM-simulated precipitation and its relationship with global warming need to be evaluated (Perkins et al., 2007; Alexandra and Arblaster, 2008). The evaluation of observed and modelled trends has shown that the confidence in GCM projected extremes of precipitation is much less than that of temperature (e.g. Kharin et al., 2007; Kiktev et al., 2007). In general, the magnitude of changes in precipitation extremes simulated by GCMs was found to have a linear relationship with the strength of GHG emissions or in proportion with the global warming trend (Alexander and Arblaster, 2009, Tebaldi et al., 2006), which is in alignment with the linear response theory of pattern scaling.
On the other hand, given the current state of scientific understanding and the limitations of GCMs in simulating the complex climate system, a large ensemble of GCM simulations is more appropriate in climate change projections than using individual GCM simulation outputs, particularly if such projections will be used for impact assessments, because only large ensembles of GCM simulations, sampling the widest possible range of modelling uncertainties, can provide a reliable specification of the spread of possible regional changes (Murphy et al., 2004; Sorteberg and Kvamstø, 2006; Murphy et al., 2007; Räisänen, 2007).
Simulations of extreme precipitation in GCMs cannot be expected to accurately reproduce observed absolute quantities or rates of change. The relatively coarse resolution of GCMs prevents the simulation of phenomena that manifest their intensity mainly at synoptic (i.e., regional) scales (Dai, 2006; Tebaldi et al., 2006). GCM-simulated extreme precipitation intensities are systemically much lower than the observed data (Dai, 2006; Kharin et al., 2007).
In lieu of the above, we present the following method for analysing the climate change impact on extreme precipitation using daily GCM outputs at their original spatial resolution (Li and Ye, 2011). The steps of this method are listed below:
1. Build a General Extreme Value (GEV) distribution for one GCM baseline period (1981-2000 or 1980-1999) for daily data and calculate its extreme precipitation intensity values for 11 selected return periods (5 ,10, 20,30,50,100,150,200,300 year periods);

Climate Change Impact and Adaptation Study in Mekong Delta – Part A
228 | P a g e
2. Build GEV distribution for the above GCM based on its future daily data. There are two 20-year period 2046-2055 and 2081-2100 for 3 SRES scenarios A2, A1B and B1 available from the IPCC AR4 data archive.
3. Calculate the extreme precipitation intensity values for the 11 selected return periods as baseline period;
4. Calculate the difference in percentage of the extreme precipitation intensity values between baseline and each future period;
5. Calculate the annual global average mean temperature change between the future periods and the baseline for the above GCM;
6. Normalise the extreme precipitation changes by the linear least square regression method using the following equation:
m
yy
m
yyijy
ij
T
VTV
1
2
1'
)(
where 'ijV is the normalised change value for the grid cell(i) and return period (j); yijV is the change
percentage for yT for global mean temperature change for the future period y; m =6, the number of future sample periods used.
With the use of bi-linear interpolation, a finer-scale change pattern of extreme precipitation is obtained at the required spatial resolution.
By applying the change pattern generated from daily GCM data, it is possible to undertake an extreme precipitation event analysis for any region.
7. Build GEV distribution from historical gridded daily data of the Waikato region and calculate the extreme precipitation values for the selected return period ( 10, 20, 50, 100, and 200 years) ;
8. Extract the change pattern values from global change patterns generated in step 6 above; 9. Obtain the global average mean temperature change for the selected study time slices (2020, 2050,
and 2100) and GHG emission scenarios (A1FI, A1B and B1) in mid climate sensitivity using the SimCLIM software.
10. Calculate the extreme precipitation values by manipulating the change patterns with global mean temperature using the following equation:
11. )100/1( 101 GMTPPP
Where, P1 and P0 are the future and baseline extreme precipitations, respectively; P is the change percentage generated from GCM data; and ∆GMT (the scalar) is the change of global mean temperature increase in a future time slice.
In summary, this method is an extension of the pattern scaling method to extreme event analysis. Research using the method for New Zealand and Australia extreme rainfall analysis has generated improved results that conform to other scientific research findings (Li and Ye, 2011).
List of General Circulation Models used for this analysis.

Climate Change Impact and Adaptation Study in Mekong Delta – Part A
229 | P a g e
No. Originating Group(s), Country Model SimCLIM name
Horizontal grid spacing(km)
1 Bjerknes Centre for Climate Research, Norway
BCCR BCCRBCM2 ~175
2 Canadian Climate Centre, Canada CCCMA T47 CCCMA-31 ~250
3 Meteo-France, France CNRM CNRM-CM3 ~175
4 CSIRO, Australia CSIRO-MK3.5 CSIRO-35 ~175
5 Geophysical Fluid Dynamics Lab, USA GFDL 2.0 GFDLCM20 ~200
6 Geophysical Fluid Dynamics Lab, USA GFDL 2.1 GFDLCM21 ~200
7 Institute Pierre Simon Laplace, France IPSL IPSL-CM40 ~275
8 Centre for Climate Research, Japan MIROC-M MIROCMED ~250
9 Meteorological Institute of the University of Bonn, Meteorological Research Institute of KMA, Germany/Korea
MIUB-ECHO-G ECHO---G ~400
10 Max Planck Institute for meteorology DKRZ, Germany
MPI-ECHAM5 MPIECH-5 ~175
11 Meteorological Research Institute, Japan
MRI MRI-232A ~250
12 National Center for Atmospheric Research, USA
NCAR-CCSM CCSM—30 ~125
References Alexander, L. V., & Arblaster, J. M. (2009). Assessing trends in observed and modelled
climate extremes over Australia in relation to future projections. International Journal of Climatology, 29(3), 417-435. 10.1002/joc.1730.
Dai, A. (2006). Precipitation Characteristics in Eighteen Coupled Climate Models. Journal of Climate, 19(18), 4605-4630. doi:10.1175/JCLI3884.1.
Kharin, V. V., Zwiers, F. W., Zhang, X., & Hegerl, G. C. (2007). Changes in Temperature and Precipitation Extremes in the IPCC Ensemble of Global Coupled Model Simulations. Journal of Climate, 20(8), 1419-1444. doi:10.1175/JCLI4066.1.
Kiktev, D., Caesar, J., Alexander, L. V., Shiogama, H., & Collier, M. (2007). Comparison of observed and multimodeled trends in annual extremes of temperature and precipitation. Geophys. Res. Lett., 34(10), L10702. 10.1029/2007gl029539.
Li, Y., Urich, P. B. (2011).Singapore Precipitation Analysis and Projected Climate Change. Report Commissioned by PUB, Singapore and CH2M Hill, USA.
Li, Y. and Ye, W.( 2011). Applicability of ensemble pattern scaling method on precipitation intensity indices at regional scale, Hydrology and Earth System Sciences Discussion, 8, 5227–5261, doi:10.5194/hessd-8-5227-2011.
Meehl GA, S. T., Collins WD, Friedlingstein P, Gaye AT, Gregory JM, Kitoh A, Knutti R, Murphy JM, Noda A, Raper SCB, Watterson IG, Weaver AJ and Zhao Z-C (2007). Global climate projections. In Climate Change 2007: The physical science basis. Contribution of Working Group I to the Fourth Assessment Report of the Intergovernmental Panel on Climate Change In S. Solomon, D. Qin, M. Manning, Z. Chen, M. Marquis, K. B. Averyt, T. M. && M. (Eds.) (Eds.): Cambridge, UK and New York, NY: Cambridge University Press.
Murphy, J. M., Booth, B. B. B., Collins, M., Harris, G. R., Sexton, D. M. H., & Webb, M. J. (2007). A methodology for probabilistic predictions of regional climate change from

Climate Change Impact and Adaptation Study in Mekong Delta – Part A
230 | P a g e
perturbed physics ensembles. Philosophical Transactions of the Royal Society A: Mathematical, Physical and Engineering Sciences, 365(1857), 1993-2028. 10.1098/rsta.2007.2077
Murphy, J. M., Sexton, D. M. H., Barnett, D. N., Jones, G. S., Webb, M. J., Collins, M., (2004). Quantification of modelling uncertainties in a large ensemble of climate change simulations. Nature, 430(7001), 768-772.
Perkins, S. E., Pitman, A. J., Holbrook, N. J., & McAneney, J. (2007). Evaluation of the AR4 Climate Models Simulated Daily Maximum Temperature, Minimum Temperature, and Precipitation over Australia Using Probability Density Functions. Journal of Climate, 20(17), 4356-4376.
Räisänen, J. (2007). How reliable are climate models? Tellus A, 59(1), 2-29. 10.1111/j.1600-0870.2006.00211.x.
Sorteberg, A., & Kvamstø, N. G. (2006). The effect of internal variability on anthropogenic climate projections. Tellus A, 58(5), 565-574. 10.1111/j.1600-0870.2006.00202.x.
Tebaldi, C., Hayhoe, K., Arblaster, J., & Meehl, G. (2006). Going to the Extremes. Climatic Change, 79(3), 185-211. 10.1007/s10584-006-9051-4.

Climate Change Impact and Adaptation Study in Mekong Delta – Part A
231 | P a g e
Appendix 5. Details of Meetings with Province Officials Agriculture and Natural Environments
Ca Mau DARD
Mr. Tran Quoc Nam (Deputy Director of DARD)
Water, Climate, Offshore Management Department
Mr. Nguyen Huu Cam: (Head of Water resources)
Mr Dang Quoc Nam (Specialist)
Irrigation Management Department
Mr. Nguyen Thanh Tung (Deputy Head of Irrigation Management Department)
Rural water supply and hygienic sanitation centre
Mr. Ly Minh Khoi (Director of Rural water supply and hygienic sanitation centre)
02 other staff of Rural water supply and hygienic sanitation centre
Aquaculture Department
Mr. Nguyen Van Trung (Deputy Director of Aquaculture Department)
Mr. Quoc and Mr. Tan from Aquaculture Department.
Agriculture and Aquaculture Promotion Department
Mr. Tran Van Thuc (Director of Agriculture and Aquaculture Promotion Department)
02 other staff of Agriculture and Aquaculture promotion department
Agriculture Department
Mr. Tran Thanh Hoang (Deputy Head of Agriculture Division)
Mr. Quach Minh Quoc (Head of Livestock Division)
Forestry Department
Mr. Dac (Head of Forestry Department)
Mr. Thuan (Deputy Head of Planning Division)
Mr. Hiep (Deputy Head of Technical Division)
Mr. Loc (Head of Planning Division)
Extension Department
Mr Ngueyen Tran Thuc (Deputy Head of Promotion)
Kien Giang
DARD
Mr Tinh (Head of DARD)
Mr Tan (Head of Construction activities)

Climate Change Impact and Adaptation Study in Mekong Delta – Part A
232 | P a g e
Irrigation Management Department
Mr Trung (Irrigation)
Forestry Department
Thanh (Forestry Section)
Extension Department
Mr Hung (Vice Director of Extension Centre)
Staff in Planning and financing
Staff in Agriculture and weather forecasting
Staff in Livestock sector TA and planning
DONRE
Mrs Vo Thi Van (Vice Director DONRE, Director Kien Giang Env Protection Fund)
Mr Tai (Water resources, meteorology and climate change)
Mr Tran Hoang Thanh (Deputy Director, KG Env Protection Agency)
Centre of Environment and Natural Resources
Cuong (Director of Centre of Environment and Natural Resources)
Mr Hung (Head of Informatics)
Mr Nghia (Islands and Marine Resources)
Urban Settlements and Transport
Date Location Agency Contacts 10/3/11 Hanoi Urban Development Agency,
Ministry of Construction Ms. Tran Thi Lan Anh & Ms. Le Hong Thuy, Urban Development Division.
14/3/11 Ca Mau Provincial People’s Committee (PPC)
Members of PPC
15/3/11
18/3/11
Ca Mau Provincial Department of Transport (DoT)
Mr. Tran Van Duyen
16/3/11 Ca Mau Provincial Department of Construction (DoC)
Mr. Nguyen Huu Do – Vice Director. Mr. Minh – Head of Urban Development Management Division (UDMS). Ms. Thu Trang – Vice head of UDMS.
20/3/11 Ca Mau Provincial Department of Infrastructure (DoI)
Mr. Kai
21/3/11 Nam Can District
Division of Infrastructure & Economy
Mr. Hai – Vice Head
22/3/11 Tran Van Thoi District
Division of Infrastructure & Economy
Mr. Nghiep – Vice head. – in charge of Infrastructure and Urban planning. Mr. Hai – staff – in charge of Infrastructure and Power

Climate Change Impact and Adaptation Study in Mekong Delta – Part A
233 | P a g e
Date Location Agency Contacts 23/3/11 Ca Mau Ca Mau Water Supply,
Sewerage & Urban Works One-Member Ltd
Mr. Nguyen Chi Thanh, Director. Mr. Tan, Vice director of the new water supply factory
28/3/11 Rach Gia PPC Members of PPC
28/3/11 Rach Gia GIZ, office of Management of Natural Resources
Dr. Sharon Brown. Dr. Michael Russell.
29/3/11 Rach Gia City
PDC Meeting Members of PDC
29/3/11 Rach Gia Provincial DoC for Kien Giang Mr. KTS Ha Van Thanh Khuong, Mr Tu (Infrastructure), Mr. Tinh (Deputy Director )
30/3/11 Rach Gia Provincial DoT for Kien Giang Mr. Duyen – Vice Head, Planning. Mr. Phuc – Staff, Technical Div.
31/3/11 Rach Gia Kien Giang Water Supply and Sanitation Company
Mr. Binh – 1st Vice Director: Mr. Tam – 2nd Vice Director. Mr. Chau – Head of Commercial Dept: Mr. Toan – Head of Quality Control.
5/4/11 Rach Gia Division of Infrastructure & Economy
Mr. Bui Van Day – Head
6/4/11 Hon Dat District
Division of Infrastructure & Economy
Mr Duong – Vice Head
7/4/11 Kien Luong District
Division of Infrastructure & Economy
Mr. Bang – Vice Head
7/4/11 Ha Tien District
Division of Infrastructure & Economy
Mr. Ngoc – Head
9/4/11 Phu Quoc District
PDC Meeting Members of PDC
9/4/11 Phu Quoc District
Division of Infrastructure & Economy
Mr Dung – Vice Head
13/4/11 Rach Gia Provincial DoC for Kien Giang Mr. KTS Ha Van Thanh Khuong, Eng. Phep Do Van
15/4/11 Rach Gia Wrap-up meeting for both Provinces
Members of PPC from Ca Mau and Kien Giang
1/7/11 Hanoi Urban Development Agency, Ministry of Construction
Ms. Tran Thi Lan Anh, Urban Development Division.
Socio-Economic
Not given

Climate Change Impact and Adaptation Study in Mekong Delta – Part A
234 | P a g e
Industry and Energy

Climate Change Impact and Adaptation Study in Mekong Delta – Part A
235 | P a g e

Climate Change Impact and Adaptation Study in Mekong Delta – Part A
236 | P a g e

Climate Change Impact and Adaptation Study in Mekong Delta – Part A
237 | P a g e
Appendix 6. Details of Workshop Participants Final Workshop - Invitees
Organisation Name Position
ADB Pradeep Tharakan Climate Change Specialist
ADB Ross Butler Social Development Specialist
AusAID Kate Elliott First Secretary
AusAID Nguyen Tu Uyen Senior Program Manager
World Bank
GIZ Jorgen Hess (??)
GIZ CCCEP Sharon Brown CCCEP research coordinator
GIZ Kien Giang Chu Van Cuong
KFW
JICA
CSIRO Alex Smajgl
USAID
SMV
DANIDA
Korean Axim Bank
Care (on behalf of CC Network)
IFAD
IFC
Met Office Lynsey McColl
UNDP
GOV
IMHEN Assoc. Prof. Dr. Tran Thuc Director General
DMHCC Le Cong Thanh Director General
Inter. Coop. Department Mr. Tan Vice Director General
NTP Office
PPC Kien Giang Lam Hoang Sa Deputy President
DONRE Kien Giang Thai Thanh Luom Director
DoARD KG Tran Thu Hang Vice Director
DOT KG Phan Van Tuu Vice Director
DOIT KG Hoang Trung Vice Director
MARD
PPC Ca Mau Pham Thanh Tuoi President
DONRE CM Mr. Tat Director
DoARD CM To Quoc Nam Director
DOPI CM Tran Van Tam Vice Director
DOIT CM Le Minh Thao Vice Director
DOST CM Tran Phu Cuong Director
CPO Lai Tien Vinh
MOC Tran Thi Lan Anh
MOC Do Tu Lan
Project Team
SKM Peter Mackay Team Leader
CENRE Duong Hong Son Deputy Team Leader
SKM Sonya Sampson Project Manager
CENRE Duc Cuong Hoang Climate Change Prediction Modeller
SKM Michael Russell CCAS - Agriculture, Water & Natural Resources

Climate Change Impact and Adaptation Study in Mekong Delta – Part A
238 | P a g e
CENRE Minh Tuyen Hoang CCAS - Agriculture, Water & Natural Resources
CENRE Ngo Thi Van Anh CCAS - Economic and Financial Issues
CENRE Dinh Thai Hung CCAS - Transport and Urban Planning Specialist
CENRE Tran Thi Dieu Hang CCAS - Energy & Industry Sectors
CENRE Hoang Van Dai GIS Expert
IMHEN Dr Luong Huu Dung IMHEN Researcher / Modeller
ICOE Dr Nguyen Huu Nhan Vice Director / Hydrological Modeller

Climate Change Impact and Adaptation Study in Mekong Delta – Part A
239 | P a g e
Appendix 7. Other Adaptation Projects in the Delta There are a number of projects (both past and present) which will assist in increasing resilience to the impacts of climate change in the Mekong Delta. These projects collectively involve the strengthening of institutions, policy and regulations, and practices. Many follow on from, or are acting in synergy with, projects for the NTP. The main studies of relevance to this study include: Vietnam’s official climate change scenario (MoNRE 2009): Climate change estimates were
developed for three different emissions scenarios low (B1), medium (B2), and high (A2 and A1Fi), the medium emission scenario (B2) was retained by MoNRE for the purpose of impact assessment and adaptation planning. The official scenario includes projected changes in temperature, rainfall, and sea level over the period 2020 to 2100.
DANIDA Sea level rise scenarios and possible disaster risk reduction in Vietnam (DANIDA/IMHEN 2010): Evaluated nationally economic damage under SLR scenarios of 50 cm, 75 cm and 100 cm. Focused on some potential impacts of SLR on six coastal districts of Thua Thien Hue province, and proposed a number of measures to adapt to SLR that could be used by other provinces in similar social and economic situations The hydrodynamic processes of the East Sea of Vietnam have been reproduced for two episodes: September 2005 and November 2006 when the sea were forced by two storm events Used ROMS Vietnam. The project relies on the results of the flow calculation by MRCS, combined with SLR and salinity scenarios by IMHEN to further calculate and analyze the impacts on Cuu Long Delta. Used MRC’s DSF outputs for River Flow (a wide range of upstream dam/landuse scenarios), downscaling from; PRECIS, (Hadley and SEA START) and MAGICC/SCENGEN (local met stations). The study used GIS landuse (current and planned changes) and modelled Water use/irrigation requirements for a range of different combinations of scenarios that incorporated upstream, climate, and landuse changes.
EACC Economics of Adaptation to Climate Change study (World Bank 2010): Used MoNRE data and projected changes in temperature and rainfall for each of Vietnam’s seven climatic zones. The study estimated the overall impact of climate change on land use and production by comparing estimates of yields and production under (a) no climate change, and (b) with climate change but no adaptation. For agriculture, the study incorporated these results into a macroeconomic model to assess the consequences of changes in agricultural output on agricultural prices, trade, GDP, economic activity in other sectors, and household consumption. Estimate the production of crops, timber, and so on under the new climate conditions after the adaptation measures have been implemented.
MONRE’s Viet Nam Administration of Sea’s and Islands (VASI), (IUCN& IMHEN 2012): Working together with scientists, local governments, and local communities, the project will develop and apply methodological and analytical frameworks for climate change and disaster risk reduction (DRR) vulnerability assessments. The Southeast Asia System for Analysis, Research, and Training (SEA-START) regional centre in Bangkok will support this process by downscaling climate change models.
AIACC Assessment of Impacts and Adaptations to Climate Change (UN 2006): Assessed the vulnerabilities of rice farmers of the lower Mekong to climate risks, proposed adaptive strategies to cope with and reduce climate risks. The assessment was conducted through household interviews and focus group meetings in the selected study sites.
WWF Assessing the Implications of Climate Change at the Provincial Level: Ca Mau, Vietnam (WWF/SIWRP 2008): The WWF/SIWRP team used a sophisticated hydrological model of the lower delta area to simulate water levels and salinity based on projected changes in climate over the next 10 and 25 years. Eleven scenarios were developed based on the changes in climate expected to cause the most significant impacts in the province: sea level rise; extreme events; and storm surges. The scenarios were then analysed with regard to future economic development, using the current provincial development plan as a baseline.

Climate Change Impact and Adaptation Study in Mekong Delta – Part A
240 | P a g e
Impacts of Climate Change on Agriculture and Policy Options for Adaptation The Case of Vietnam (IFPRI 2010): Estimated the impacts of climate change on agricultural and water systems in Vietnam based on crop simulation, hydrological simulation, and river basin models. They used a yield function approach that models technology advances and policy interventions to improve rice productivity and mitigate the impact of climate change, using a multilevel mixed effects model. To estimate the response of farmers to a changing climate, the study estimate a yield function and examined how farmers could increase yields through intensified input use and improved public provisions. The common factors typically used in empirical production analysis include irrigation, research investment, extension services, access to capital and credit, agro-climatic conditions, and rural infrastructure.
Current ongoing projects include:
Climate Change affecting Land Use in the Mekong Delta: Adaptation of Rice-based Cropping Systems (CLUES): The purpose of this project is to increase the adaptive capacity of rice production systems in the Mekong Delta Region Detailed maps of flooding and salinity intrusion under different CC scenarios Improvement of salinity and submergence resilience of locally-adapted rice varieties and elite lines.
CSIRO Exploring Mekong Region Futures project; Sea-level rise and future livelihoods in Vietnam’s Mekong Delta: An integrated assessment of the possible futures for the food-water-energy security nexus will assist the development plans in Vietnam’s Mekong Delta and the national food security plan. The project began in 2009 with a series of stakeholder meetings and design workshops. In early 2011, the first alternative futures were explored and revised later in the year based on other workshop outcomes. Expert panel results, field study data and simulation results will be provided during workshops in 2011 and 2012.
IUCN: Building Coastal Resilience in Viet Nam, Cambodia and Thailand: Working together with scientists, local governments, and local communities, the project will develop and apply methodological and analytical frameworks for climate change and disaster risk reduction (DRR) vulnerability assessments. The Southeast Asia System for Analysis, Research, and Training (SEA-START) regional centre in Bangkok will support this process by downscaling climate change models.
JICA; Climate Change Adaptation for Sustainable Agriculture and Rural Development in the Coastal Mekong Delta in Vietnam: Project for Climate Change Adaptation for Sustainable Agriculture and Rural Development in the Coastal Mekong Delta in Vietnam Climate change impact prediction (mid to long term, 2020-2050) and assessment is conducted Climate change adaptation Master Plan is formulated Establish a development plan which is oriented to climate change adaptation in the sector of agriculture and rural development Vulnerability to climate change is to be measured by various indicators simulated by the climate change scenario. Degrees of changes in particular environmental parameters are to be digitized as environmental change prohibits the implementation of existing development plans, 1) a new countermeasure is to be incorporated in the master plan which is to control the environmental change itself; and 2) objective and activities of the existing plans are to be modified given the changed environmental condition climate-change adaptation strategies in each issue are to be prioritized. “issues” may include “saline intrusion,” “sea-level rise,” “water shortage,” “flood,” and “shoreline erosion.” Formulation of Draft Master Plan and Selection of the Prioritized Projects Support of Environmental and Social Consideration Study is needed to examine anticipated environmental impacts by the proposed projects and to propose countermeasures against those impacts. Vulnerability Assessment of Climate Change in Agriculture and Rural Development
Mekong Delta Water Resources Management For Rural Development Project World Bank 2012: Infrastructure Investment-Sluice gates(secondary & tertiary), dredging (primary and secondary), and embankment reinforcement-establishment of about 75 WUOs, initial training and on-farm support Upgrade transport routes, MARD to consider pertinent economic, environmental, and

Climate Change Impact and Adaptation Study in Mekong Delta – Part A
241 | P a g e
social aspects and to explore alternative strategies to new large scale works. Increasing Water Productivity - promote on-farm water use efficiency through pilot schemes. Updating the Mekong Delta Master Plan. Rural Water Supply and Sanitation. - aiming to extend reliable services to about 60,000 households-designing for and installation of the Surveillance, Control and Data Analysis SCADA system.

Climate Change Impact and Adaptation Study in Mekong Delta – Part A
242 | P a g e
Appendix 8. TA and Consultant TORs I. INTRODUCTION
1. The Government of Viet Nam has requested the Asian Development Bank (ADB) for technical assistance (TA) to undertake a study on climate change impact and adaptation in the Mekong Delta1. The TA supports the Government’s National Target Plan (NTP) for responding to climate change, as well as Viet Nam’s commitments under the United Nations Framework Convention on Climate Change. It complements the Government’s national socioeconomic development plan and Comprehensive Poverty Reduction and Growth Strategy2. A TA fact finding mission visited Viet Nam and reached agreement with the Government on TA impact, outcome, outputs, activities, cost, implementation and financing arrangements, and terms of reference. The design and monitoring framework is in Appendix 1.
II. ISSUES 2. Viet Nam is one of the countries likely to be most affected by global climate change3. Within Viet Nam, the Mekong Delta region, in the south of the country, has been identified as particularly susceptible to the impacts of extreme climate events and climate variability. The Mekong Delta region is home to one-fifth of the national population and has population densities that are among the highest in the country. There are a large proportion of poor and near-poor households, and the population remains predominantly rural. Agriculture and fisheries are the major sources of income for the large majority of the people. The area is known as the “rice bowl” of Viet Nam. Approximately 10,000 square kilometres (km2) of the delta are under rice cultivation, and the region contributes 46% of the total national food production.
3. The Mekong Delta region has experienced severe effects of climate events. Major floods in 2000 destroyed more than 400,000 hectares (ha) of rice paddies, 85,000 ha of farmland and 16,000 ha of shrimp and fish ponds. With global climate change, the extent and frequency of extreme events are expected to intensify. Increased extent and duration of flooding, changes in wet season and dry season precipitation, inundation from a rising sea level, and changes in salinity intrusion will be significant threats to the regions agricultural and fisheries productivity, as well as to remaining natural coastal ecosystems. Effects on livelihoods and food security for the region’s population are likely to be significant. Poor households are likely to be the most vulnerable to the effects of climate change.
4. Approximately 12,300 km2, or 31%, of the total land area of the Mekong Delta, including 9,800 km2 of land used for agriculture and aquaculture, could be affected by a 1.0-meter rise in sea level that could occur by 2100. About 4.8 million people could be affected by such a change in sea level, including more than 1.5 million poor individuals. Energy and road infrastructure in the region is also susceptible to effects of climate change that include flooding, salinity, temperature changes, and availability of water resources.
5. A number of ongoing assistance efforts relating to climate change are provided by various development partners, including the World Bank’s Economics of Adaptation to Climate Change Project; initiatives by United Nations Development Programme in relation to mainstreaming climate change issues in socioeconomic development planning; and initiatives by the Danish and Dutch governments to develop climate change adaptation plans for a series of coastal provinces. Despite the importance of the region to national socioeconomic development and its vulnerability to climate change, no comprehensive study of the potential effects of climate change has been undertaken to date. The capacity of government authorities in the region in relation to climate change issues is low, and, despite a long history of disaster management response planning, regional sector and socioeconomic development planning includes scant reference to climate change adaptation measures. Therefore, effective climate change adaptation measures need urgently to be developed and integrated into the 1 The TA first appeared in the business opportunities section of ADB’s website on 13 July 2009.
2 Government of Viet Nam. 2002. Comprehensive Poverty Reduction and Growth Strategy. Ha Noi.
3 ADB. 2009. The Economics of Climate Change in Southeast Asia. Manila.

Climate Change Impact and Adaptation Study in Mekong Delta – Part A
243 | P a g e
region’s development planning to enhance the physical and economic climate-resilience of the region, and in particular to protect poor and rural households.
III. THE TECHNICAL ASSISTANCE A. Impact and Outcome 6. The expected impact is that poor and rural people in the Mekong Delta region will have developed physical and economic resilience to future climate change and variability. The TA will contribute to the Government’s socioeconomic development goals of poverty reduction and continued economic growth as contained in the national socioeconomic development plan and the Comprehensive Poverty Reduction and Growth Strategy. It will also contribute to fulfilling the goals of the NTP in relation to addressing climate change issues within a context of poverty alleviation and sustainable development.
7. The expected outcome is that sector and provincial authorities in the Mekong Delta region will have developed the capacity to increase climate-resilience of programs, plans, policies, and/or projects to guide future development planning. This outcome will result in increased climate change resilience in the region and contribute to poverty reduction through (i) climateproofed socioeconomic development planning at provincial level (e.g., urban land use planning to avoid flooding of sensitive areas, adjusting agricultural patterns to adapt to changing drought or salinity conditions, providing such protective infrastructure as dikes, or enhancing natural protective ecosystems); (ii) adoption of regional adaptation measures to protect agricultural production and thus the livelihoods of poor, near poor, and rural households through structural and nonstructural measures; and (iii) development of climate-resilient infrastructure in the transport and energy sectors that will aid in protecting the livelihoods of vulnerable groups, as well as in supporting overall economic development.
B. Methodology and Key Activities 1. Overview
8. The TA will be implemented in two parts. Part A is climate change prediction and impact assessment, while part B is climate change adaptation and planning. Part A will include output 1: identification of future climate conditions in the Mekong Delta region; and output 2: assessment of the effects of future climate scenarios on natural, social, and economic systems in the Mekong Delta region. Part B will include output 3: identification of appropriate climate change adaptation measures for target provinces and targeted regional sectors; and output 4: development of pilot projects for scaling up and replication of TA outcomes and support to collaborative mechanisms for information sharing and coordinated action on climate change. Both parts of the TA will incorporate institutional strengthening activities for Government decision makers and technical staff, as well as awareness raising activities for the community (output 5). A fundamental principle of the TA will be to implement a participatory approach involving national and provincial government representatives.
9. Target provinces selected for the TA are Ca Mau and Kien Giang. Kien Giang was chosen because it has a conventional coastal and insular environment with a westerly aspect that is less exposed to mainstream hydrological influences. Existing community development and natural resources projects in this province will provide data sources and useful connections to local stakeholders. Ca Mau was selected as it is a large coastal province with a diverse mixture of land use types, remnant natural ecosystems, important infrastructure development in the energy and transport sectors, and pockets of high poverty rates and ethnic minority groups.
10. Regional sectors targeted for the TA are agriculture, energy, and transport. The agriculture sector was selected due to the region’s importance to national food production and the population’s high reliance on agricultural activities for its livelihoods. Agriculture is identified as a key sector for climate change adaptation in the region, and it is the subject of the Government’s action plan for adaptation to climate change in agriculture and rural development. Energy and transport were selected as target sectors due to (i) the vulnerability of energy and transport infrastructure to climate change, (ii)

Climate Change Impact and Adaptation Study in Mekong Delta – Part A
244 | P a g e
the importance of energy and transport infrastructure to economic development and enhancing livelihoods among socially vulnerable groups, and (iii) the presence of important national energy and transport infrastructure in the Mekong Delta region.
2. Part A: Climate Change Prediction and Impact Assessment 11. Output 1 will be achieved by modeling future climate change scenarios in 2030 and 2050. Modeling activities will be undertaken initially at the regional level, with more detailed modeling carried out for the regional target sectors and provinces. Modeling and data collection will build on work already carried out by the Ministry of Natural Resources and Environment (MONRE) and donors. Global circulation models, regional downscaled models, and local and international climate data will be employed as appropriate. Modeling will investigate threats related to rising sea level, storm surge, change in temperature patterns, change in rainfall patterns (including drought frequency), and salinity patterns.
12. Output 2 will be achieved by first carrying out an impact risk assessment at Mekong Delta regional level using an approach based on GIS (geographic information system) to identify the effects of future climate change scenarios on natural systems (e.g., biodiversity, water resources and quality, soils.), social systems (e.g., population, poverty, gender, public health, urban settlements), economic systems (e.g., industry, gross domestic product, agricultural production), hydro-meteorological characteristics (e.g., flooding, sea levels and tides, salinity, river flows), and important development sectors (including, but not limited to, the identified target sectors). Regional hotspots of climate change sensitivity, including vulnerable infrastructure items in the target sectors, will be identified for use in the latter phases of the study and for developing pilot projects under output 4. Integrated assessment modeling will then be carried out for target provinces and sectors to provide a more detailed assessment of climate change effects. The results of the integrated assessment modeling will provide important inputs to the cost-benefit analysis of adaptation options for target sectors and provinces.
13. Activities for output 5 will be commenced under part A. An analysis of existing climate change capacity within the Government will be carried out as the baseline to develop a tailored capacity building program for provincial and sector authorities (including a monitoring and evaluation framework). Implementation of the developed program will then begin. Key participants in the activities will be from national line ministries in the target sectors, such as the Ministry of Planning and Investment, MONRE, Ministry of Transport, Ministry of Industry and Trade, Ministry of Agriculture and Rural Development, and Viet Nam Electricity. Also participating will be the ministries’ provincial counterparts, such as the departments of Planning and Investment, Natural Resources and Environment (DONRE), Transport, Industry and Trade, and Agriculture and Rural Development. A community awareness-raising program will be implemented within the two target provinces.
3. Part B: Climate Change Adaptation and Planning 14. Output 3 will be achieved by identifying a long list of climate change adaptation options for integration into future development planning for target sectors and provinces. This process will use a “no-regrets” approach4 to identifying options and subjecting those options to economic, environmental, and social evaluation. The options should consider existing government policies, including the national strategy for natural disaster prevention. A prioritized list of feasible and practical adaptation options (both structural and nonstructural) will be developed for integration into the development planning framework, and their corresponding budget costs for implementation will be financed. Cost–benefit analyses of selected adaptation measures in target sectors and provinces will be conducted, together with economic modeling of the adaptation measures’ impacts. Authorities will also be assisted in identifying financing options for eventual implementation of the adaptation actions.
4 "No-regrets" adaptation interventions, meaning actions that generate net social benefits under all future scenarios of climate change and impacts.

Climate Change Impact and Adaptation Study in Mekong Delta – Part A
245 | P a g e
15. Output 4 will be achieved by designing climate change adaptation pilot projects to allow eventual upscaling and replication of study outcomes in other provinces or sectors within the Mekong Delta region. This output will also facilitate the Government’s participation in existing regional climate change advisory and information sharing bodies, thus allowing lessons learned from the study to be disseminated both internationally and nationally5.
16. Institutional strengthening activities under output 5 will be completed under part B with the objective of building the skills of technical staff and raising awareness among senior decision makers.
C. Implementation Arrangements 17. The Department of Meteo-Hydrology and Climate Change within MONRE will be the executing agency. The provincial people’s committees of Ca Mau and Kien Giang will be implementing agencies for the activities at provincial level. There will be established within each province a steering committee (chaired by the vice-chairperson of the provincial people’s committee and with the deputy director of DONRE as vice-chair) and a project management unit (headed by the deputy director of DONRE and composed of technical staff from the relevant departments).
18. Regional activities at sectoral level will be carried out by a regional sector technical working group chaired by the Department of Meteo-Hydrology and Climate Change. The working group will be responsible for (i) guiding study activities related to regional sector analyses; (ii) providing technical inputs; (iii) sharing information, collaborating on study progress and outcomes, and liaising with senior decision makers and technical staff within relevant ministries and agencies; (iv) reviewing study outputs and contributing to evaluation and prioritization of regional sector adaptation options; and (v) disseminating study findings and recommendations to senior decision makers and technical staff. The working group will involve representatives of the Ministry of Planning and Investment, Ministry of Transport, Ministry of Industry and Trade, Viet Nam Electricity, and Ministry of Agriculture and Rural Development. The national level NTP Committee, the Climate Change Working Group of the International Support Group for the Environment, and the Natural Disaster Mitigation Partnership will be briefed on study progress and findings.
19. Two consulting firms will be engaged for the TA. For Part A, a team of 6 international (totaling 19.5 person-months) and 7 national (totaling 25.5 person-months) consultants will be required. For Part B, a team of 3 international (totaling 13.5 person-months) and 3 national (totaling 20.5 person-months) consultants will be required. The consultants for Part A and Part B will be engaged in accordance with its Guidelines on the Use of Consultants (2007, as amended from time to time). Outline terms of reference for the consultant team are provided in Appendix 3. Any procurement activities under the TA financed by ADB will be implemented according to its Procurement Guidelines (2007, as amended from time to time). All training materials developed by the consultants and office equipment purchased under the TA will be transferred to the Government upon completion of the TA and thereafter will remain the property of the Government.
20. The TA will be implemented over 16 months, from January 2010 to April 2011. Part A consultants will start their work in January 2010, prepare an inception report within 1 month, and prepare a midterm report within 6 months. On this basis, part B consultants will be mobilized in June 2010 and prepare an inception report within 1 month and a final report by March 2011. The time frame for completion has been selected to correspond to the Government’s socioeconomic development planning cycle and completion of the first phase of activities under the NTP. Tripartite meetings of the Government, ADB, and the consultants, as well as stakeholder workshops, will be held to discuss the inception, midterm, and final reports. ADB will field a review mission every 6 months during TA implementation to supervise the work of consultant. Close coordination will be maintained between ADB’s Viet Nam Resident Mission and the office of AusAID in Ha Noi to ensure timely information sharing and effective TA implementation.
5 Examples of forums include the Greater Mekong Subregion Working Group on Environment, the Mekong River Commission Climate Change Adaptation Initiative, Delta Research and Global Observation Network (DRAGON) institute
at Can Tho University, and the Mekong Delta Forum supported by World Wide Fund for Nature.

Climate Change Impact and Adaptation Study in Mekong Delta – Part A
246 | P a g e
OUTLINE TERMS OF REFERENCE FOR CONSULTANTS A. Part A (Climate Change Prediction and Impact Assessment)
1. Part A will require 19.5 person-months of international consultants and 25.5 person months of national consultants.
2. Study Team Leader and Climate Change Integrated Assessment Modeling Specialist (international, 4.5 person-months). The consultant will:
(i) Maintain overall responsibility for budget, scheduling, and quality of study outputs.
(ii) Organize high-level stakeholder meetings, as required, and provide regular progress reports to government representatives and ADB project officers.
(iii) Present results for Part A at inception, midterm, and final study workshops.
(iv) Coordinate technical activities associated with integrated assessment modelling in target sectors and provinces.
3. Climate Change Prediction Modeler (international, 3.0 person-months). The consultant will:
(i) Collect baseline data on climate and hydro-meteorological conditions in study
area, including the final report of Addressing Climate Change1 and existing adaptation measures.
(ii) Liaise with external specialists and government representatives to finalize detailed methodology for climate change modeling, including baseline data requirements, choice of models, modeling periods, modeling scenarios etc.
(iii) Carry out climate change modeling for agreed time slices and model scenarios.
(iv) Prepare a climate change modeling outcomes working paper documenting the methodology employed and results of the modeling activities.
4. Climate Change Assessment (Energy and Industry Sectors) Specialist (international, 3.0 person-months). The consultant will:
(i) Collect baseline data on energy and industry issues relevant to study.
(ii) Liaise with national and provincial government representatives and external stakeholders (e.g., NGOs, project consultants) to identify key issues, including forecasts for future industrial development; trends in types of industrial development; and proposed development of the energy infrastructure.
(iii) Using results of climate change prediction modeling, undertake impact and vulnerability assessment of climate change impacts on result of energy and industrial sectors inputs to integrated assessment modeling.
(iv) Prepare an energy and industry sector climate change assessment working paper, documenting methodology employed and results of activities carried out.
5. Climate Change Assessment (Transport and Urban Planning Sectors) Specialist (international, 3.0 person-months). The consultant will:
(i) Collect baseline data on urban planning and transport issues relevant to study.
(ii) Identify urban planning and transport issues in study area, including planning for future urban developments; projected land use changes; changes in transport modes and volumes; and proposed development of water, rail, and road transport networks.
1 ADB. 2008. Technical Assistance for Addressing Climate Change in the Asia and Pacific Region. Manila.

Climate Change Impact and Adaptation Study in Mekong Delta – Part A
247 | P a g e
(iii) Using results of climate change prediction modeling, undertake impact and vulnerability assessment of climate change impacts on urban planning and transport issues including inputs to integrated assessment modeling.
(iv) Prepare an urban planning and transport sector climate change assessment working paper, documenting the methodology employed and results of activities.
6. Climate Change Assessment (Agriculture, Water and other Natural Resources) Specialist (international, 3.0 person-months). The consultant will:
(i) Collect baseline data on agricultural, water resources, and natural systems issues relevant to study.
(ii) Identify key issues, including forecasts for agricultural productivity and yields, changes in agricultural production trends, planned development of irrigation or related infrastructure, projections for water supply and demand, proposed water resources infrastructure development, and planning for protected areas and sensitive ecosystems (including coastal mangrove areas).
(iii) Using results of the climate change prediction modeling, undertake impact and vulnerability assessment of climate change impacts on agriculture, water resources, and natural systems issues (including inputs to integrated assessment modeling for target sectors and provinces).
(iv) Prepare a climate change assessment working paper, documenting the methodology employed and results of the activities carried out.
7. Climate Change Assessment (Economic and Financial) Specialist (international, 3.0 person-months). The consultant will:
(i) Collect relevant baseline data on socioeconomic issues, including population and demographic trends; and poverty, public health, and gender issues.
(ii) Identify key socioeconomic issues in study area, including population projections, population distribution projections, trends within socially vulnerable groups (including gender issues), trends within the public health sector, and estimates of climate migrant movements to and from the study area.
(iii) Develop methodologies for climate change cost estimation and economic analysis of adaptation options and undertake impact and vulnerability assessment of climate change impacts on socioeconomic issues.
(iv) Prepare a socioeconomic and financial climate change assessment working paper, documenting the methodology employed and results of the activities.
8. Deputy Team Leader (national, 4.5 person-months)2. The consultant will:
(i) Coordinate national Part A study team members and ensure team members are aware of technical, budgetary, and scheduling obligations of study.
(ii) Assist Institutional Strengthening Specialists to undertake capacity assessment and develop capacity building program.
(iii) Work with government representatives to identify regional climate change forums for provision of TA support and define resources to be provided to such forums.
(iv) Provide inputs to management of project management system, quality assurance system, and reporting systems.
9. Climate Change Prediction Modeler (national, 3.5 person-months). The consultant will:
(i) Assist international Climate Change Modeler to collect baseline data.
2 The Deputy Team Leader will be based within the Department of Meteo-Hydrology and Climate Change at the Ministry of Natural Resources and Environment.

Climate Change Impact and Adaptation Study in Mekong Delta – Part A
248 | P a g e
(ii) Liaise with government representatives and local specialists to assist international Climate Change Modeler to finalize detailed methodology for climate change modeling activities.
(iii) Assist international Climate Change Modeler to carry out climate change modeling according to agreed methodology.
10. Climate Change Assessment (Energy and Industry Sectors) Specialist (national, 3.5 person-months). The consultant will:
(i) Liaise with national and provincial government representatives to assist the international specialist to collect baseline data.
(ii) Liaise with national and provincial government representatives to assist the international specialist to identify key issues.
(iii) Assist the international specialist to carry out impact and vulnerability assessment of issues in the energy and industrial sectors, including geographic information system (GIS) mapping outputs.
11. Climate Change Assessment (Transport and Urban Planning Sectors) Specialist (national, 3.5 person-months). The consultant will:
(i) Liaise with national and provincial government representatives to assist the international specialist to collect baseline data as well as to identify urban planning and transport issues.
(ii) Assist the international specialist to carry out impact and vulnerability assessment of urban planning and transport issues, including GIS mapping outputs.
(iii) Assist the international specialist to prepare an urban planning and transport sector climate change assessment working paper.
12. Climate Change Assessment (Agriculture, Water and other Natural Resources) Specialist (national, 3.5 person-months). The consultant will:
(i) Liaise with national and provincial government representatives to assist the international specialist to collect baseline data as well as to identify key issues.
(ii) Assist the international specialist to carry out impact and vulnerability assessment of agriculture, water resources, and natural systems issues, including GIS mapping outputs.
(iii) Assist the international specialist to prepare a working paper on agriculture, water resources and natural systems climate change assessment.
13. Climate Change Assessment (Economic and Financial issues) Specialist (national 3.5 person-months). The consultant will:
(i) Liaise with national and provincial government representatives to assist the international specialist to collect baseline data, finalize methodologies for climate change cost estimation and economic analysis of adaptation options, and identify key socioeconomic issues.
(ii) Assist the international specialist to carry out impact and vulnerability assessment of socioeconomic issues, including GIS mapping outputs, and to estimate the future costs of climate change in the study area using results of climate change modeling.
(iii) Assist the international specialist to prepare a socioeconomic climate change assessment working paper.
14. GIS Expert (national, 3.5 person-months). The consultant will:
(i) Determine requirements of GIS database for study.
(ii) Develop agreed GIS database structure to meet Part A requirements and in a format that can be transferred to the Part B team.

Climate Change Impact and Adaptation Study in Mekong Delta – Part A
249 | P a g e
(iii) Liaise with national and provincial government representatives to source required data to input to GIS database.
B. Part B (Climate Change Adaptation and Planning) 15. Part B will require 13.5 person-months of international consultants and 20.5 person months of national consultants.
16. Study Team Leader and Climate Change Adaptation Adviser (international, 4.5 person-months). The consultant will:
(i) Provide strategic and technical advice to study team members and coordinate study technical activities for Part B.
(ii) Maintain established study project management system, quality assurance system, and reporting systems.
(iii) Prepare documentation and costing for future climate change adaptation pilot projects.
(iv) Develop long list of adaptation options for target sectors and provinces. Advise on feasibility and effectiveness of identified options.
(v) Carry out economic evaluation of adaptation options and integrate results into an overall social, economic, and environmental assessment of adaptation options.
(vi) Develop recommendations for a short list of adaptation options, and develop priority ranking for them.
17. Climate Change Adaptation Specialist (international, 4.5 person-months). The consultant will:
(i) Develop extensive list of potential adaptation options for target sectors and provinces and evaluate options within a socioeconomic and natural resource context.
(ii) Undertake preliminary economic assessment of identified adaptation options and carry out detailed cost-benefit analysis of selected options in target sectors and provinces using results of climate change integrated assessment modeling.
(iii) Develop recommendations on adaptation options for target sectors and provinces from a socioeconomic point of view.
(iv) Provide input to developing adaptation pilot projects for future implementation.
(v) Prepare recommendations on establishment of emergency response units and procedures in consideration of existing risk management policies, including the National Strategy for Natural Disaster Prevention, Response and Mitigation, overseen by the National Committee for Flood and Storm Control.
18. Climate Change Institutional Strengthening Specialist (international, 4.5 person-months).
The consultant will:
(i) Conduct interviews and consultations with decision makers and technical staff in relevant national line ministries and target provinces to develop understanding of existing capacity regarding development planning and technical issues related to climate change.
(ii) Prioritize capacity building needs of decision makers and technical staff in relevant national line ministries and target provinces to enable them to fulfill their assigned roles under the TA and build long-term capacity.
(iii) Develop capacity building program for decision makers and technical staff in relevant national line ministries and target provinces
(iv) Develop and implement a community awareness raising campaign in Ca Mau and Kien Giang provinces in relation to climate change risks and adaptation measures, including use, as

Climate Change Impact and Adaptation Study in Mekong Delta – Part A
250 | P a g e
appropriate, of public meetings; focus groups with community leaders; and newspaper, television, and radio.
20. Deputy Team Leader (national, 4.5 person-months)3. The consultant will:
(i) Coordinate national Part B study team members and ensure team members are aware of technical, budgetary, and scheduling obligations of study.
(ii) Attend high-level stakeholder meetings as required.
(iii) Work with government representatives to provide agreed support to regional climate change forums.
(iv) Provide inputs to management of project management system, quality assurance system, and reporting systems.
21. Climate Change Adaptation Specialists (national, 8 person-months). The consultant will:
(i) Liaise with representatives of government ministries, institutes, and agencies in relation to climate change modeling data requirements and methodology.
(ii) Liaise with external specialists, government representatives to develop an extensive list of potential adaptation options for target sectors and provinces and evaluate options within a socioeconomic and natural resource context.
(iii) Undertake preliminary economic assessment of identified adaptation options and carry out detailed cost-benefit analysis of selected adaptation options.
(iv) Assist in developing nationally and locally appropriate recommendations on adaptation options for target sectors and provinces.
(v) Provide inputs to developing adaptation pilot projects for future implementation.
22. Climate Change Institutional Strengthening Specialists (national, 8.0 person-months). The consultant will:
(i) Assist the international specialist to conduct interviews and consultations with decision makers and technical staff in relevant national line ministries and target provinces to develop understanding of existing capacity regarding development planning and technical issues related to climate change.
(ii) Assist the international specialist to develop and cost a capacity building program for decision makers and technical staff in relevant national line ministries and target provinces.
(iii) Work with the international specialist to begin implementing the capacity building program and report the results using the developed M&E framework.
(iv) Assist the international specialist to develop and implement a community awareness raising campaign in Ca Mau and Kien Giang provinces in relation to climate change risks and adaptation measures.
3 The Deputy Team Leader will be based within the Department of Meteo-Hydrology and Climate Change at the Ministry of Natural Resources and Environment.