Embed Size (px)
Citation preview


2
OutlineUse of WMA in the USAWMA Benefits/ChallengesNCHRP 9-47A- WMA vs. HMA
Projects Evaluated Energy Usage, EmissionsMix DesignEngineering PropertiesShort Term Field Performance
Summary of Findings
3
Warm Mix AsphaltA process or additive designed to
reduce asphalt mix production temperatures by 30 to 70°F and maintain mix workability (non-sanctioned definition)
A key part of the asphalt industry’s strategy for Sustainable Pavements
Categories: foaming, chemical and organic additives

WMA Technologies Available in U.S.
In 2005: 3In 2014: +30
6

5
Estimated WMA ProductionNAPA Surveys

6
Economics of WMAWater-Injection systems cost $30k to $80k.
Assuming $50k cost, 120,000 tons/yr., 5-year depreciation, then foamed WMA cost about 8 /tonȼ
If only 1/3 of production is WMA, then cost is 25 /tonȼ
Popular WMA additives are reported to increase cost by $2 - $3.5/ton of mix
Some costs may be offset by energy savings and other benefits
7
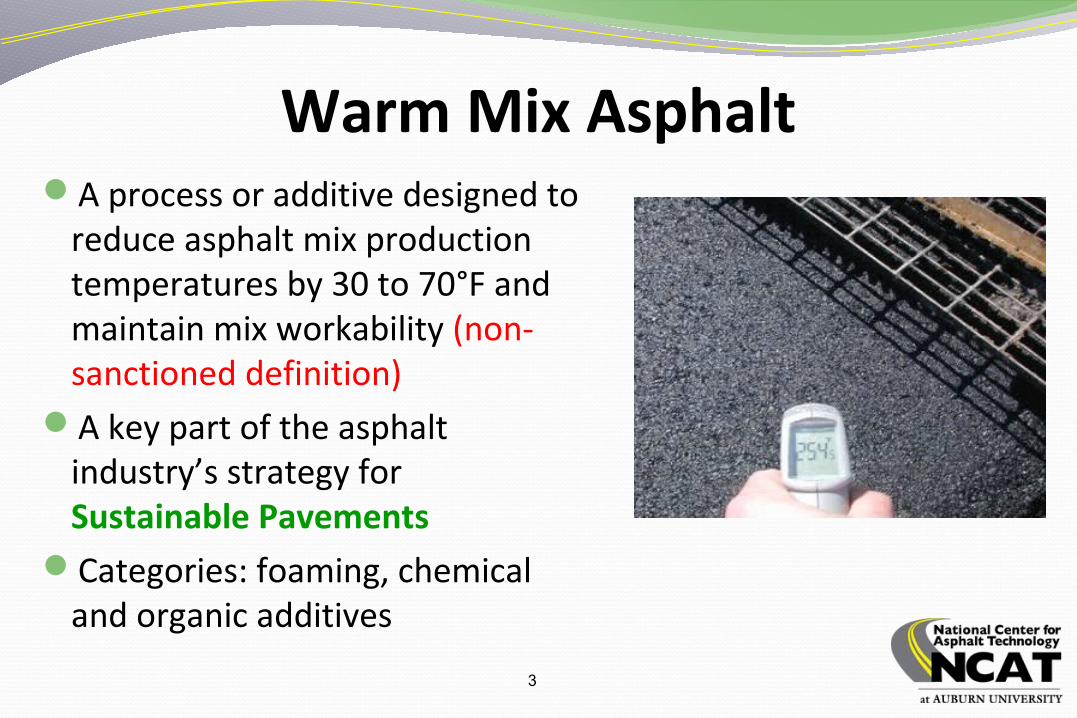
WMA Usage
NAPA Surveys

8
WMA Benefits/ChallengesBenefitsReduced energy consumptionReduced emissionsExtended haul distanceExtended construction seasonBetter work environment
ChallengesPerformance vs. HMAStandardize Mix Design

9
WMA vs. HMANCHRP 9-47A

Location Route WMA Technologies Date Const.
St. Louis, MO Hall Street Evotherm ET, Sasobit, Aspha-min May-2006
Iron Mtn., MI M95 Sasobit Sep-2006
Silverthorne, CO I-70 Advera, Sasobit, Evotherm DAT Aug-2007
Franklin, TN SR45 Astec DBG, Advera, Evotherm DAT, Sasobit Oct-2007
Graham, TX US 380 Astec DBG Jun-2008
George, WA I-90 Sasobit Jun-2008
Walla Walla, WA US-12 Maxam Aquablack Apr-2010
Centreville, VA I-66 Astec DBG Jun-2010
Rapid River, MI CR-513 Evotherm 3G, and Advera Jun-2010
Baker, MT Route 322 Evotherm DAT Aug-2010
Munster, IN Calumet Ave. Evotherm, Gencor foam, Heritage wax Sep-2010
Jeff. Co., FL, SR 30 Terex foaming system Oct-2010
Queens, NY Little Neck Pkwy Cecabase, SonneWarmix, BituTech PER Oct-2010
Case Grande, AZ SR 84 Sasobit Dec-2011
NCHRP 9-47A Projects

WMA &HMA Production Temperatures

12
Energy Savings with WMA
Fuel savings for WMA is proportional to the temperature reduction.
Most contractors report burner fuel usage decrease of about 10 to 15%.
Decreasing mix production temperature by 52°F resulted in an average fuel savings of 21 % (NCHRP 9-47A)

13
Emissions and Worker Exposure with WMA (NCHRP 9-47A)
Stack emissions largely result of combusted fuel, reduced fuel should result in reduced CO2 emissions
A 52°F reduction in temperature (21% reduction in fuel) in in a 20% reduction in CO2 emissions
Worker exposures to respirable fumes during paving were significantly reduced
Reduction in application temperature resulted in an average 36% reduction in TOM (total organic matter)

WMA Mix DesignAppendix to AASHTO R35:Perform design with WMA additive or lab foaming deviceMixing temp. based on coating, 95% coated,
min.Compactability: SGC N92 at comp. temp. and 30°C below the comp. temp., Ratio N92 ≤ 1.25
Moisture susceptibility-AASHTO T 283, TSR ≥ 0.80
Rutting evaluation; Flow Number: AASHTO TP79, criterion depends on traffic
None of the NCHRP 9-47A field projects were designed with the Appendix to AASHTO R35

15
WMA Mix Design (NCAT Recommendation NCHRP 9-47 A)
Complete volumetric mix design without the WMA technology/additive ( drop in approach) for selecting optimum asphalt contentCheck coating, compactability, moisture resistance and
rutting resistance ( if required) using laboratory produced WMA

16
In Place DensitiesTSRFN
Engineering Properties HMA vs. WMA

In Place Densities (=)
After ~2 YearsAfter Construction
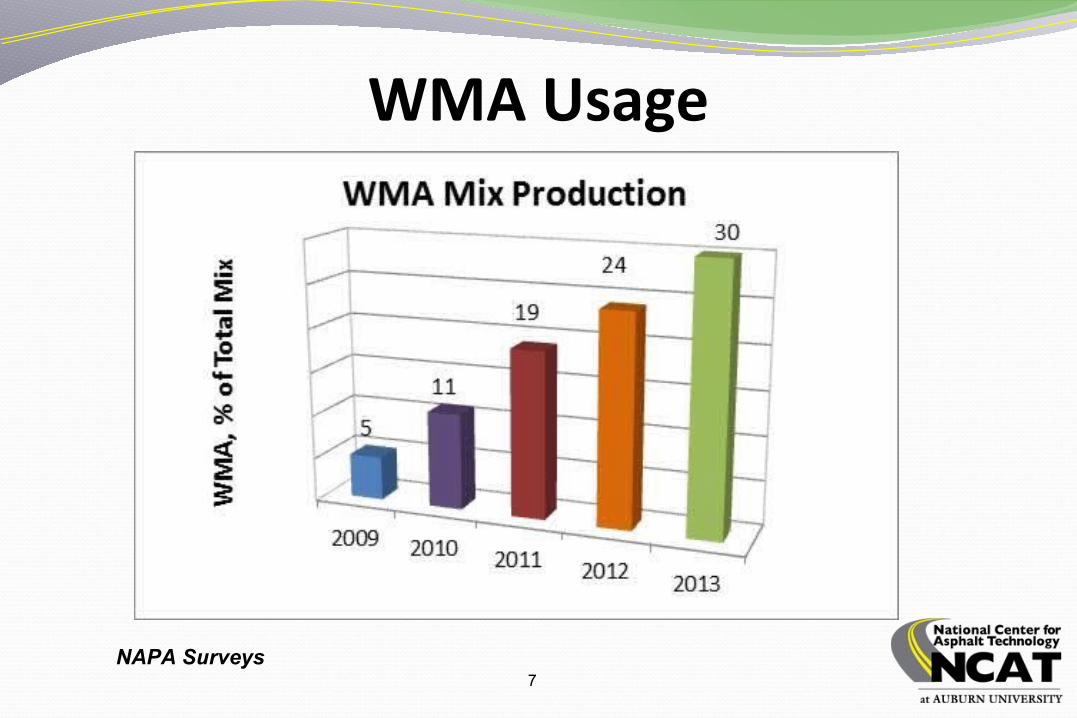
TSR-AASHTO M323 (= or ↓)

FN Test Results- WMA vs. HMA
Statistical Comparison9 cases FN WMA lower than HMA5 cases no statistical differences

20
FN Criteria HMA&WMAIncluded in AASHTO TP 79-13
Traffic Level, Million ESALs
Minimum FN (HMA) Minimum FN (WMA)
<3 NA NA
3 to<10 50 30
10 to <30 190 105
≥30 740 415

HMA Flow Number Results
Traffic, MESALs
Min. Flow No.
<3 NA
3 to <10 50
10 to <30 190
> 30 740
Project Route Mix Heating FN
Baker, MT Route 322 Reheated 98
Rapid River, MI CR-513 Reheated 199
Casa Grande, AZ SR 84 No 61
Jefferson Co., FL SR 30No 414
Reheated 231
Queens, NY Little Neck Pkwy No 291
Munster, IN Calumet Ave. No 561
Walla Walla, WA US-12No 332
Reheated 426
Centreville, VA I-66 Reheated 1855
HMA Fn Criteria

WMA Flow Number Results
Traffic, MESALs
Min. Flow No.
<3 NA
3 to <10 30
10 to <30 105
> 30 415
Project Route Mix Heating WMA Additive FN
Baker, MT Route 322 RH Evotherm DAT 58
Rapid River, MI CR-513RH Advera 60RH Evotherm 3G 65
Casa Grande, AZ SR 84 No Sasobit 46
Jefferson Co., FL SR 30RH Terex Foam 127
No Terex Foam 157
Queens, NYLittle Neck Pkwy
No Cecabase 115
No SonneWarmix 123
No BituTech PER 128
Munster, IN Calumet Ave.
No Evotherm 3G 177
No Gencor Foam 217
No Heritage Wax 314
Walla Walla, WA US-12No Maxam Aquablack 200RH Maxam Aquablack 227
Centreville, VA I-66 RH Astec DBG 439
NCHRP 9-43 Mix Design Criteria

23
Field Performance of WMA vs. HMA

24
Field Performance Evaluation Procedure
Three 200-foot sections per mix Three 6” dia. cores from in right wheelpath, and
four 6” dia cores from in between wheelpathsCores used to determine the in-place density
indirect tensile strengths, specific gravity, gradation, asphalt content, and the true binder grade for each mix.

Field Performance-New ProjectsProject Mix Rutting (mm) Cracking (m)
Walla Walla, WAHMA 5 1
Maxam Aquablack 0 0
Centreville, VAHMA 3 1
Astec DBG 3 1
Rapid River, MI HMA 0 0
Evotherm 3G 0 0Advera 0 0
Baker, MT HMA 1 0
Evotherm DAT 0 0
Munster, IN
HMA 0 4Gencor Foam 0 36Evotherm 3G 0 0Heritage Wax 0 0
Jeff. Co., FL, HMA 3 0
Terex Foam 3 0
Queens, NY
HMA - 9Cecabase <1 20
SonneWarmix - 5BituTech PER - 5
Casagrande, AZHMA 3 NA
Sasobit 0 NA

26
Summary Laboratory PerformanceStatistically equivalent as-constructed densities for WMA
mixes compared to the corresponding HMATSR -82% of mixes passed 0.8 minimum criterion; 6 mixes
failed: 4 WMA and 2 HMA. Since all of the field projects performed well; adjusting the TSR criterion on plant mix samples should be considered
FN results for WMA mixes lower than HMA ( 2/3 of the comparisons)
FN criteria recommended in NCHRP Report 673 for HMA and NCHRP Report 691 for WMA seem appropriate for evaluating plant produced mixes.

27
Summary Short Term Field Performance
WMA and HMA had no significant difference in ruttingNo observed moisture damage in any HMA or in WMA
sectionNo apparent differences in density between HMA and WMAWMA and HMA cracking after to years- none or low severity
and extendNo significant differences in surface texture between HMA
and WMA

NCHRP Project 9-47A
NCHRP Report 779