Embed Size (px)
Citation preview

Red Light Running Cameras (ongoing
Safety study)
Fatemeh Baratian Ghorghi
PhD Student at:
Auburn University, Department of Civil Engineering

INTRODUCTION
Evaluate the effectiveness of RLC systems in Opelika
1. Operational Impact
2. Safety Impact

OPERATIONAL IMPACT
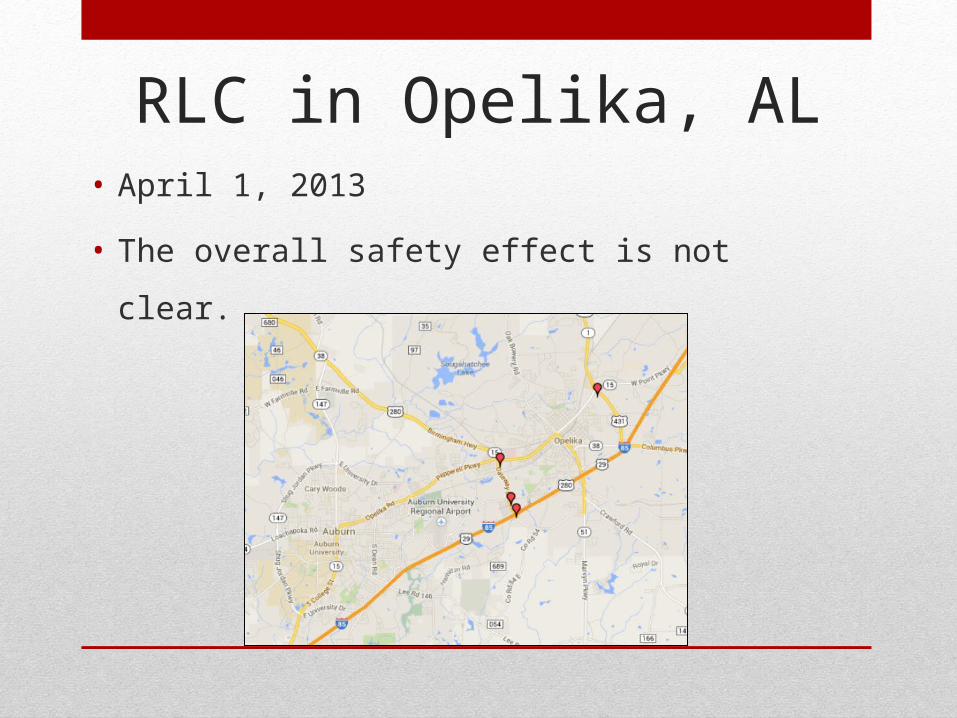
RLC in Opelika, AL• April 1, 2013
• The overall safety effect is not clear.

Field Data Collection

Running Behavior

SAFETY
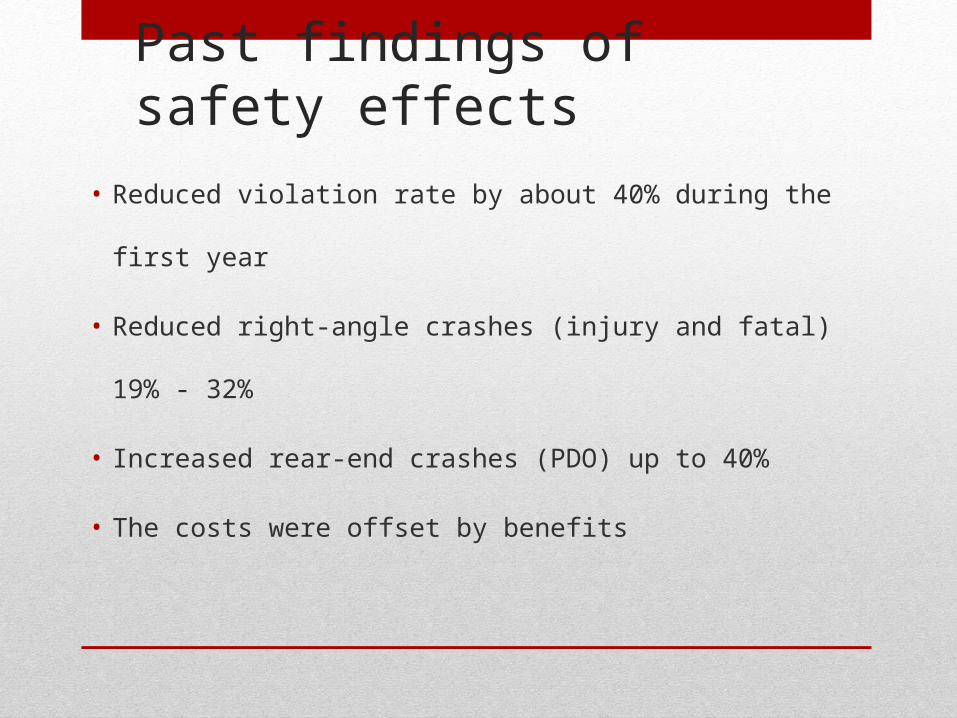
Past findings of safety effects
• Reduced violation rate by about 40% during the first year
• Reduced right-angle crashes (injury and fatal) 19% - 32%
• Increased rear-end crashes (PDO) up to 40%
• The costs were offset by benefits
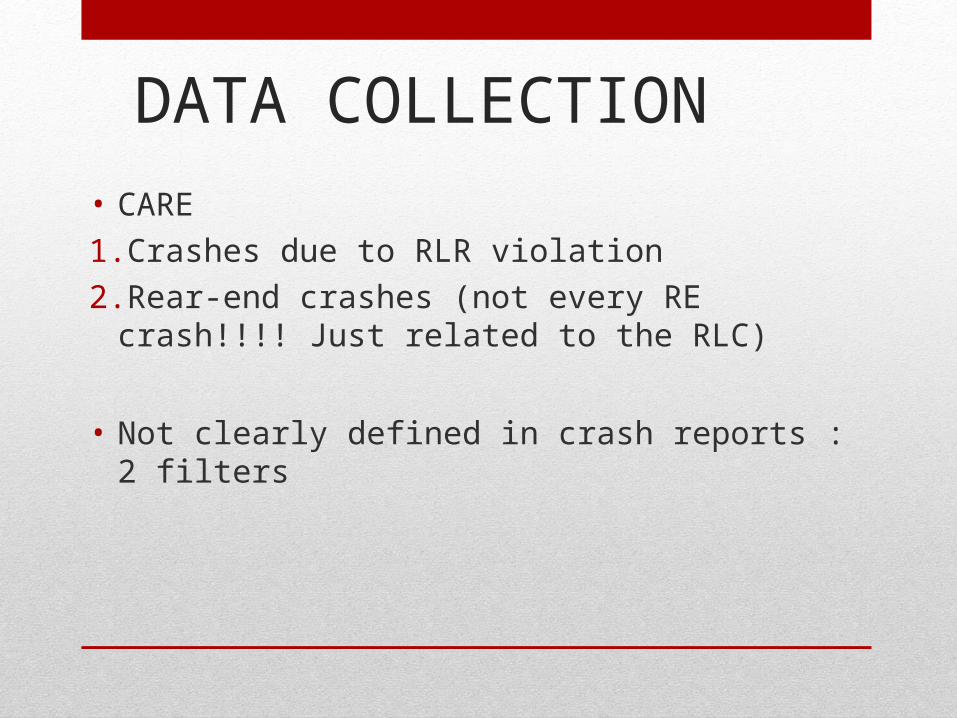
DATA COLLECTION
• CARE
1. Crashes due to RLR violation
2. Rear-end crashes (not every RE crash!!!! Just related to the RLC)
• Not clearly defined in crash reports : 2 filters

DATA COLLECTION
Before: April 2010 –April 2013 After: April 2013 –April 2014 (Only April 2013- July
2014 is available now)

DATA COLLECTION• RLR Crashes
• RE Crashes

DATA COLLECTION237- 59- 1505 -948

Reviewing hardcopies (152)
• RLR Crashes- all true crash
• RE crashes- 8% true crash
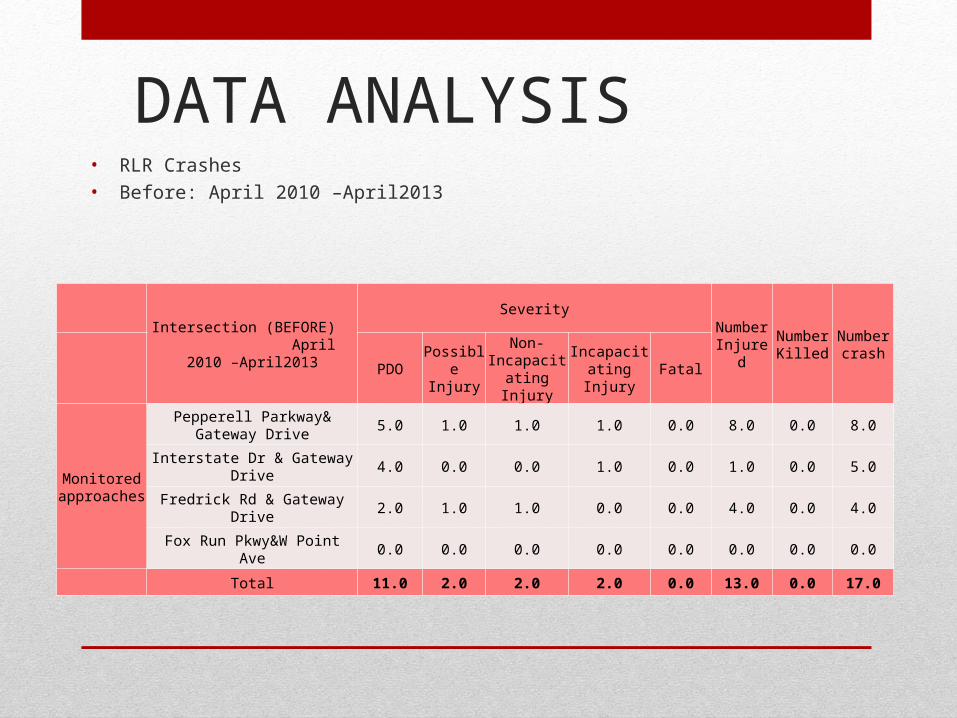
DATA ANALYSIS• RLR Crashes
• Before: April 2010 –April2013
Intersection (BEFORE) April 2010 –April2013
SeverityNumber Injured
Number Killed
Number crash
PDOPossible Injury
Non-Incapacitatin
g Injury
Incapacitating Injury
Fatal
Monitored approaches
Pepperell Parkway& Gateway Drive
5.0 1.0 1.0 1.0 0.0 8.0 0.0 8.0
Interstate Dr & Gateway Drive 4.0 0.0 0.0 1.0 0.0 1.0 0.0 5.0
Fredrick Rd & Gateway Drive 2.0 1.0 1.0 0.0 0.0 4.0 0.0 4.0
Fox Run Pkwy&W Point Ave 0.0 0.0 0.0 0.0 0.0 0.0 0.0 0.0
Total 11.0 2.0 2.0 2.0 0.0 13.0 0.0 17.0

DATA ANALYSIS• RLR Crashes
• After: April 2013- April 2014
Intersection (BEFORE) April 2010 –April2013
SeverityNumber Injured
Number Killed
Number crash
PDOPossible Injury
Non-Incapacitatin
g Injury
Incapacitating Injury
Fatal
Monitored approaches
Pepperell Parkway& Gateway Drive
1.0 0.0 0.0 0.0 0.0 0.0 0.0 1.0
Interstate Dr & Gateway Drive 1.0 2.0 1.0 0.0 0.0 5.0 0.0 4.0
Fredrick Rd & Gateway Drive 0.0 0.0 0.0 0.0 0.0 0.0 0.0 0.0
Fox Run Pkwy&W Point Ave 0.0 0.0 0.0 0.0 0.0 0.0 0.0 0.0
Total 2.0 2.0 1.0 0.0 0.0 5.0 0.0 5.0

DATA ANALYSIS

DATA ANALYSIS

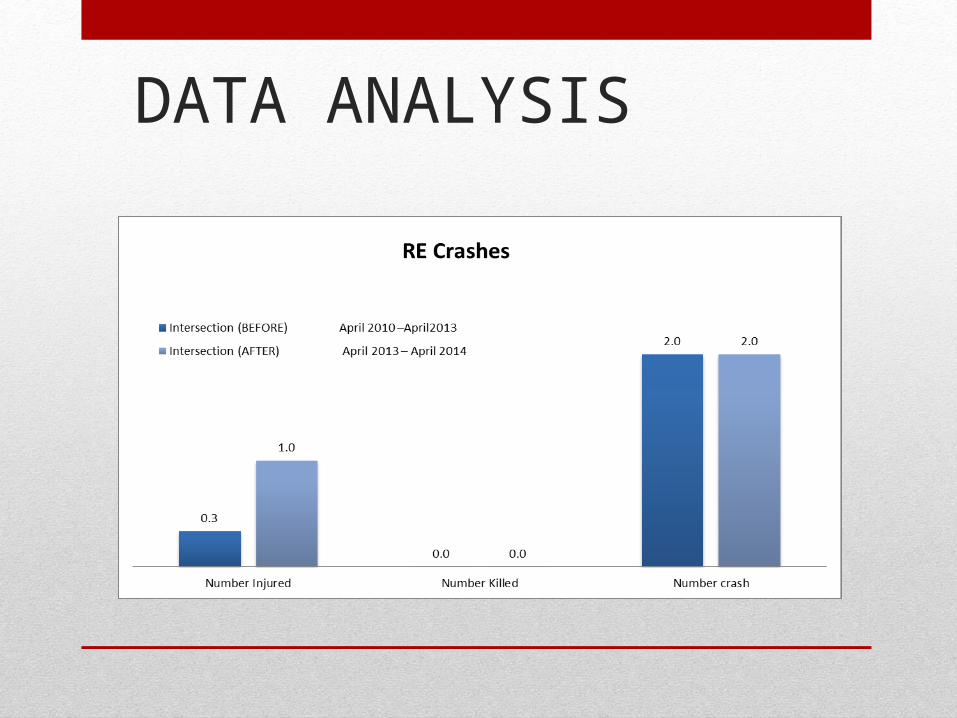
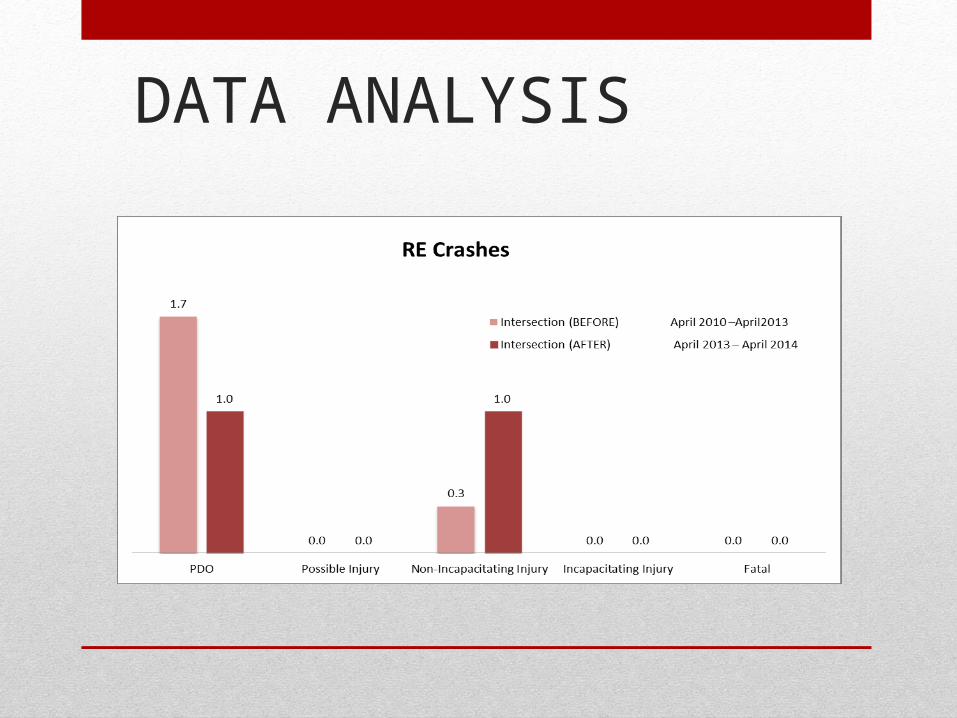
DATA ANALYSIS• RE Crashes
• Before: April 2010 –April2013
Intersection
SeverityNumber Injured
Number Killed
Number crash
PDOPossible Injury
Non-Incapacitating Injury
Incapacitating Injury
Fatal
Monitored approaches
Pepperell Parkway& Gateway Drive
1.0 0.0 1.0 0.0 0.0 1.0 0.0 2.0
Interstate Dr & Gateway Drive 1.0 0.0 0.0 0.0 0.0 0.0 0.0 1.0
Fredrick Rd & Gateway Drive 2.0 0.0 0.0 0.0 0.0 0.0 0.0 2.0
Fox Run Pkwy&W Point Ave 1.0 0.0 0.0 0.0 0.0 0.0 0.0 1.0
Total 5.0 0.0 1.0 0.0 0.0 1.0 0.0 6.0
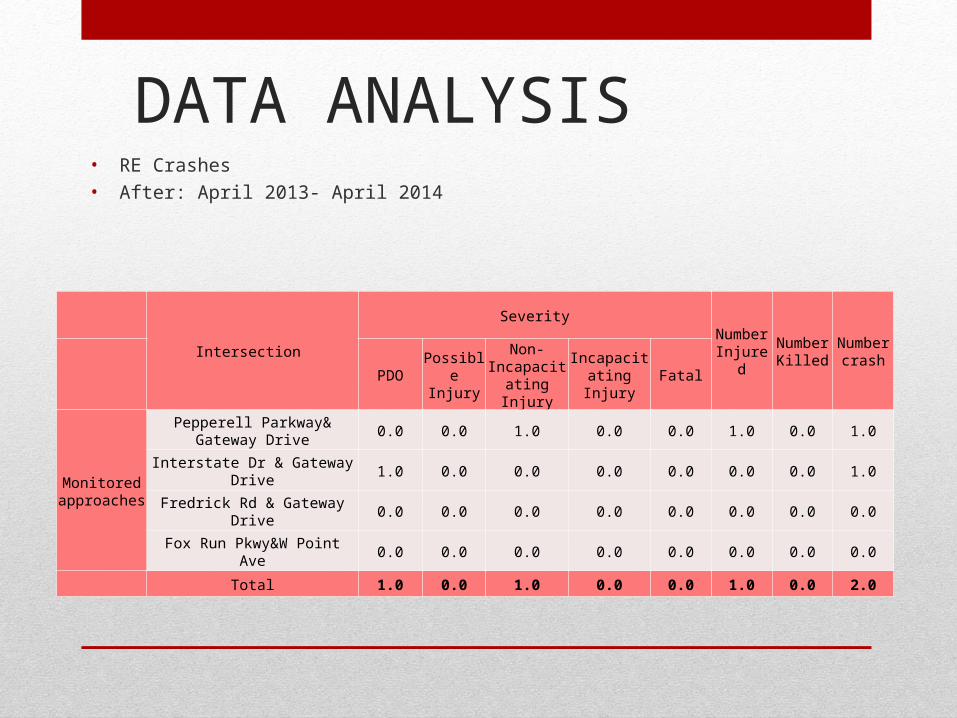
DATA ANALYSIS• RE Crashes
• After: April 2013- April 2014
Intersection
SeverityNumber Injured
Number Killed
Number crash
PDOPossible Injury
Non-Incapacitatin
g Injury
Incapacitating Injury
Fatal
Monitored approaches
Pepperell Parkway& Gateway Drive
0.0 0.0 1.0 0.0 0.0 1.0 0.0 1.0
Interstate Dr & Gateway Drive 1.0 0.0 0.0 0.0 0.0 0.0 0.0 1.0
Fredrick Rd & Gateway Drive 0.0 0.0 0.0 0.0 0.0 0.0 0.0 0.0
Fox Run Pkwy&W Point Ave 0.0 0.0 0.0 0.0 0.0 0.0 0.0 0.0
Total 1.0 0.0 1.0 0.0 0.0 1.0 0.0 2.0
DATA ANALYSIS
DATA ANALYSIS
DATA ANALYSIS
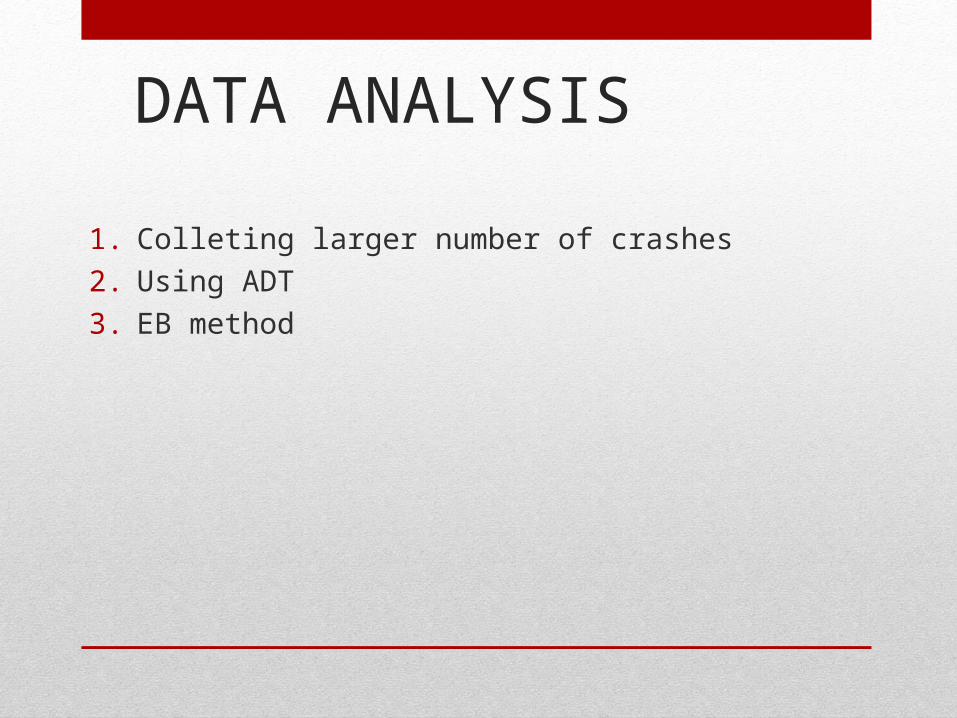
1. Colleting larger number of crashes
2. Using ADT
3. EB method

DATA COLLECTIONUsing ADT: http://algis.dot.state.al.us/atd/default.aspx
2014
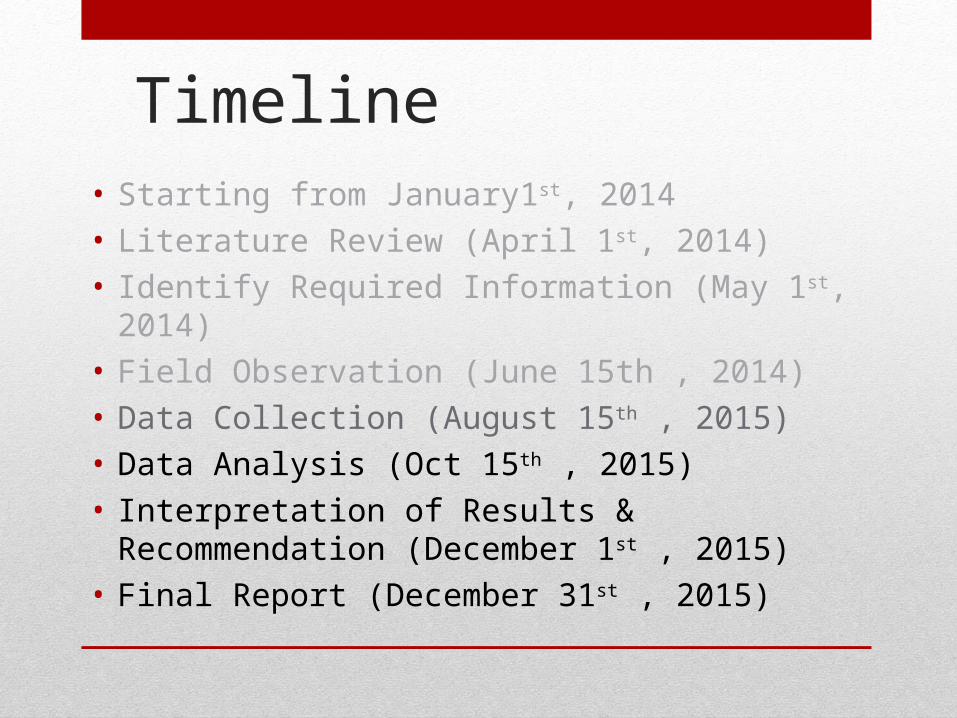
Timeline
• Starting from January1st, 2014
• Literature Review (April 1st, 2014)
• Identify Required Information (May 1st, 2014)
• Field Observation (June 15th , 2014)
• Data Collection (August 15th , 2015)
• Data Analysis (Oct 15th , 2015)
• Interpretation of Results & Recommendation (December 1st , 2015)
• Final Report (December 31st , 2015)
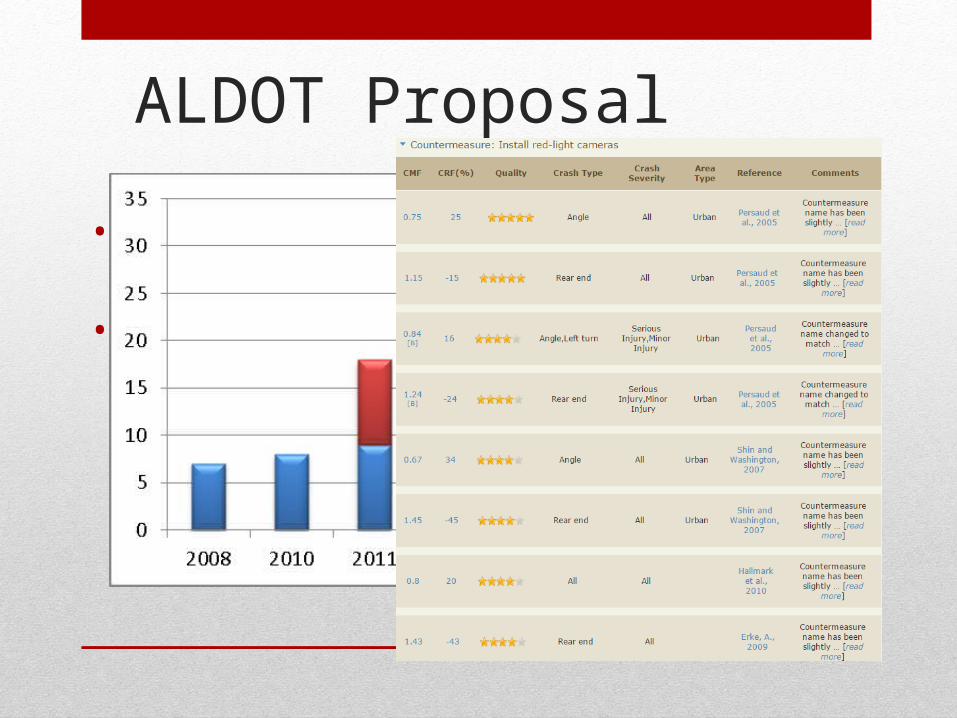
ALDOT Proposal
• Widespread use of cameras necessitates further study.
• Safety Evaluation of about 40 intersections in Alabama1. Change in number of crashes?
2. Change in number of violations? Access to the number of citations

Thank You!