Embed Size (px)
Citation preview

Aspen Plus
Getting Started Modeling Processes with Electrolytes
Version Number: V7.1
January 2009
Copyright (c) 1981-2009 by Aspen Technology, Inc. All rights reserved.
Aspen Plus, aspenONE, the aspen leaf logo and Plantelligence and Enterprise Optimization are trademarks or registered trademarks of Aspen Technology, Inc., Burlington, MA.
All other brand and product names are trademarks or registered trademarks of their respective companies.
This document is intended as a guide to using AspenTech's software. This documentation contains AspenTech proprietary and confidential information and may not be disclosed, used, or copied without the prior consent of AspenTech or as set forth in the applicable license agreement. Users are solely responsible for the proper use of the software and the application of the results obtained.
Although AspenTech has tested the software and reviewed the documentation, the sole warranty for the software may be found in the applicable license agreement between AspenTech and the user. ASPENTECH MAKES NO WARRANTY OR REPRESENTATION, EITHER EXPRESSED OR IMPLIED, WITH RESPECT TO THIS DOCUMENTATION, ITS QUALITY, PERFORMANCE, MERCHANTABILITY, OR FITNESS FOR A PARTICULAR PURPOSE.
Aspen Technology, Inc. 200 Wheeler Road Burlington, MA 01803-5501 USA Phone: (1) (781) 221-6400 Toll Free: (1) (888) 996-7100 URL: http://www.aspentech.com

Contents iii
Contents
Who Should Read this Guide ...................................................................................1
Introducing Aspen Plus ...........................................................................................2 Why Use Electrolyte Simulation? ...................................................................... 2 What is an Aspen Plus Electrolyte Model?........................................................... 3 Sessions in this Book ...................................................................................... 3 Using Backup Files ......................................................................................... 4 Related Documentation................................................................................... 4 Technical Support .......................................................................................... 5
1 Modeling Electrolyte Chemistry ............................................................................6 Electrolyte Chemistry Flowsheet ....................................................................... 6 Starting Aspen Plus ........................................................................................ 7
To Start Aspen Plus .............................................................................. 7 To Select the Template Option ............................................................... 7 To Specify the Application Type and Run Type for the New Run................... 8
Drawing the Graphical Simulation Flowsheet ...................................................... 8 Specifying Title, Stream Properties, and Global Options ......................................10
To Specify Flows on a Mole Basis for this Simulation .................................10 Reviewing Report Options.....................................................................11
Specifying Components..................................................................................11 To Rename H2O to Water .....................................................................12
The Electrolyte Wizard ...................................................................................12 To Remove Salts from the Solution Chemistry .........................................14
Examining Generated Chemistry......................................................................16 To Examine the Generated Chemistry .....................................................16 To View a Particular Reaction ................................................................16 To View the Equilibrium Constants for the Salt Reactions...........................18
Selecting Electrolyte Property Models ...............................................................18 Entering Stream Data ....................................................................................20 Specifying the Flash Block ..............................................................................21 Specifying Additional Stream Properties ...........................................................21
To Specify Additional Properties.............................................................22 Running the Simulation..................................................................................22 Examining Simulation Results .........................................................................23 Running Electrolytes in EO..............................................................................24 Viewing EO Electrolyte Results ........................................................................26 Exiting Aspen Plus.........................................................................................28
2 Modeling a Sour Water Stripper .........................................................................29 Sour Water Stripper Flowsheet........................................................................30

iv Contents
Starting Aspen Plus .......................................................................................31 To Start Aspen Plus .............................................................................31 To Select the Template Option ..............................................................31 To Specify the Application Type and Run Type for the New Run..................31
Drawing the Graphical Simulation Flowsheet .....................................................32 Specifying Title, Stream Properties, and Global Options ......................................33
To Review the Report Options Specified in the Selected Template ...............34 To Move to the Next Required Input Sheet..............................................34
Specifying Components..................................................................................34 The Electrolyte Wizard ...................................................................................35
To Remove NH2COO- Formation from the Solution Chemistry....................36 To Remove the Salts from the Solution Chemistry....................................36
Examining Generated Chemistry......................................................................38 To Examine the Generated Chemistry.....................................................38 To View the Generated Chemistry..........................................................39
Entering Stream Data ....................................................................................41 Specifying the RadFrac Block ..........................................................................43
To Review the Types of Specifications that You Can Make for RadFrac.........43 To Specify that this Column Operates Isobarically at 15 psia .....................44 To Define the First Design Specification ..................................................44 To Define Another Design Specification...................................................45 To Define the First Manipulated Variable .................................................46 To Define the Second Manipulated Variable .............................................46 To Change the Report ..........................................................................47
Running the Simulation..................................................................................48 Examining Simulation Results .........................................................................48
To View RadFrac Results ......................................................................48 To View Design Spec Results.................................................................49 To View Vary Results ...........................................................................50 To View Composition Profiles.................................................................50 To View these Results ..........................................................................51
Converting to True Components ......................................................................52 To Tell Aspen Plus to Use the True Component Approach ..........................52 To Revise the RadFrac Design Specification to Apply to the Apparent Composition of NH3.............................................................................53
Running the True Component Simulation ..........................................................54 To View Selected Results of the True Component Simulation .....................54
Exiting Aspen Plus.........................................................................................55
3 Connecting to the Aspen Plus Simulation Engine................................................56

Who Should Read this Guide 1
Who Should Read this Guide
This guide is suitable for Aspen Plus users who want to start modeling electrolytes. Users should be familiar with the procedures covered in Aspen Plus Getting Started Building and Running a Process Model before starting these examples.

2 Introducing Aspen Plus
Introducing Aspen Plus
You can easily model all types of electrolyte systems with Aspen Plus, including systems with strong electrolytes, weak electrolytes, salt precipitation, and even mixed solvents.
The two sessions in this book - Modeling Electrolyte Chemistry and Modeling a Sour Water Stripper- introduce you to simulating electrolyte systems with Aspen Plus by guiding you through two simulations.
Getting Started Modeling Processes with Electrolytes assumes that you have an installed copy of the Aspen Plus software.
Why Use Electrolyte Simulation? A rigorous treatment of electrolytes is needed to model many industrial systems. With the Aspen Plus electrolyte capabilities, you can model:
Sour water solutions. Water containing dissolved H2S, NH3, CO2, HCN, sometimes with additional solvents
Aqueous amines for gas sweetening. Water containing DGA, MEA, DEA, or MDEA for the removal of H2S and CO2
Aqueous acids or bases. HCl, HBr, H2SO4, H3PO4, HNO3, HF, NaOH, KOH, and others, in aqueous solution, sometimes with additional solvents
Salt solutions. NaCl, KCl, Na2SO4, CaSO4, CaCO3 in solution, sometimes with participation

Introducing Aspen Plus 3
What is an Aspen Plus Electrolyte Model? In Aspen Plus, an electrolyte system is defined as one in which some of the molecular species dissociate partially or completely into ions in a liquid solvent, and/or some of the molecular species precipitate as salts. These dissociation and precipitation reactions occur fast enough that the reactions can be considered to be at chemical equilibrium. The liquid phase equilibrium reactions that describe this behavior are referred to as the solution chemistry. In Aspen Plus, solution chemistry is often referred to simply as Chemistry.
Solution chemistry has a major impact on the simulation of electrolyte systems. For nonelectrolyte systems, chemical reactions generally occur only in reactors. In Aspen Plus, all unit operation models can handle electrolyte reactions.
Solution chemistry also impacts physical property calculations and phase equilibrium calculations. The presence of ions in the liquid phase causes highly nonideal thermodynamic behavior. Aspen Plus provides specialized thermodynamic models and built-in data to represent the nonideal behavior of liquid phase components in order to get accurate results.
Sessions in this Book The two sessions in the book illustrate the following concepts:
• Types of electrolyte components
o Solvents
o Solutes
o Ions
o Salts
• Types of reactions in electrolyte solution chemistry
o Complete dissociation
o Partial dissociation (equilibrium reaction)
o Salt precipitation (equilibrium reaction)
• Automatic Chemistry generation
• Recommended physical property methods for electrolytes
• Methods for calculating and reporting electrolyte systems
o True component approach
o Apparent component approach
• Use of stream properties (Property Sets) for electrolytes

4 Introducing Aspen Plus
Follow the steps in this chapter
To learn how to
1 Modeling Electrolyte Chemistry
Define electrolyte components.
Use automatic chemistry generation.
Examine Chemistry data. View electrolyte databank parameters.
Use the true component modeling approach.
2 Modeling a Sour Water Stripper
Modify the generated Chemistry.
Use the apparent component approach for electrolytes.
Convert from apparent component approach to true component approach.
Using Backup Files We recommend that you perform all sessions sequentially, because Chapter 2 assumes you are familiar with the concepts presented in Chapter 1.
Aspen Plus provides backup files containing all problem specifications and results for each tutorial session. You can use the backup files to check your results.
Related Documentation Title Content
Aspen Plus Getting Started Building and Running a Process Model
Tutorials covering basic use of Aspen Plus. A prerequisite for the other Getting Started guides
Aspen Plus Getting Started Modeling Processes with Solids
Tutorials covering the Aspen Plus features designed to handle solids
Aspen Plus Getting Started Modeling Petroleum Processes
Tutorials covering the Aspen Plus features designed to handle petroleum
Aspen Plus Getting Started Using Equation-Oriented Modeling
Tutorials covering the use of equation-oriented models in Aspen Plus
Aspen Plus Getting Started Customizing Unit Operation Models
Tutorials covering the development of custom unit operation models in Aspen Plus
Aspen Engineering Suite Installation Manual
Instructions for installing Aspen Plus and other Aspen Engineering Suite products
Aspen Plus Help Procedures for using Aspen Plus

Introducing Aspen Plus 5
Technical Support AspenTech customers with a valid license and software maintenance agreement can register to access the online AspenTech Support Center at:
http://support.aspentech.com
This Web support site allows you to:
• Access current product documentation
• Search for tech tips, solutions and frequently asked questions (FAQs)
• Search for and download application examples
• Search for and download service packs and product updates
• Submit and track technical issues
• Send suggestions
• Report product defects
• Review lists of known deficiencies and defects
Registered users can also subscribe to our Technical Support e-Bulletins. These e-Bulletins are used to alert users to important technical support information such as:
• Technical advisories
• Product updates and releases
Customer support is also available by phone, fax, and email. The most up-to-date contact information is available at the AspenTech Support Center at http://support.aspentech.com.

6 1 Modeling Electrolyte Chemistry
1 Modeling Electrolyte Chemistry
In this simulation mix and flash two feed streams containing aqueous electrolytes.
You will:
• Define electrolyte components.
• Use the Electrolytes Expert System.
• Examine Chemistry data.
• View electrolytes databank parameters.
• Use the true components modeling approach.
• Allow about 45 minutes to do this simulation.
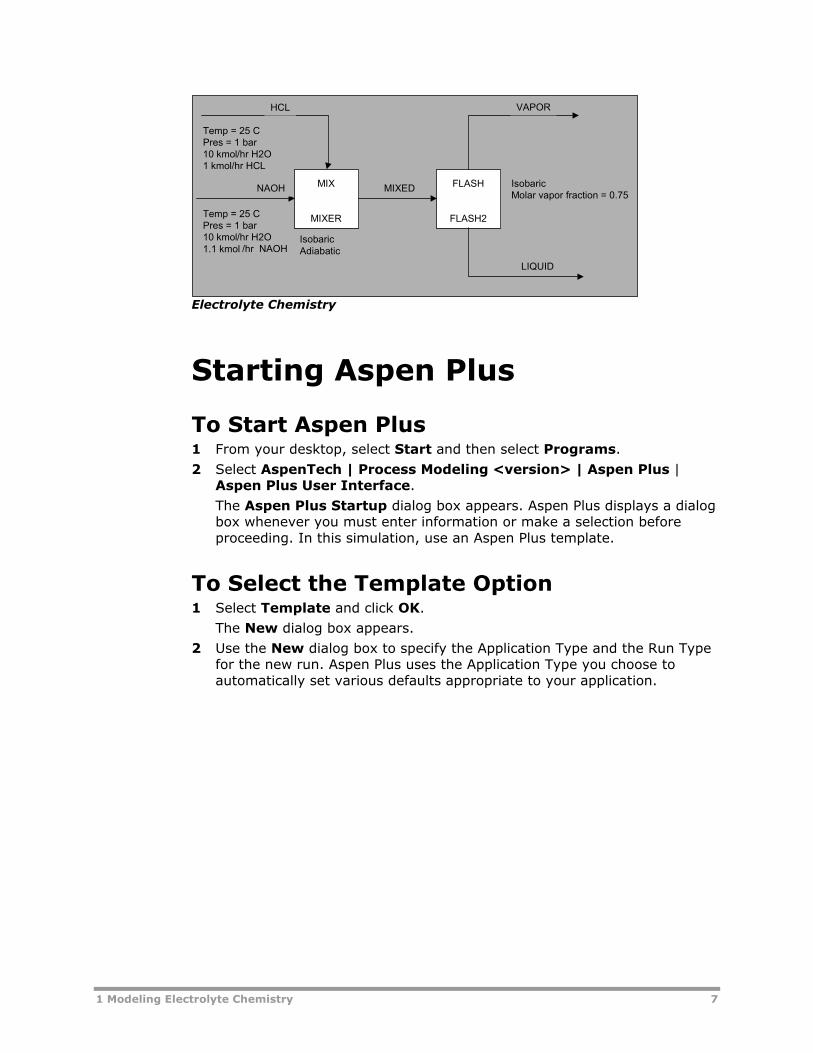
Electrolyte Chemistry Flowsheet The process flow diagram and operating conditions for this simulation are shown in the process diagram below: Electrolyte Chemistry. Two feed streams, one containing water and HCl, the other water and NaOH, are fed to a mixer. The mixer outlet is flashed to evaporate water and cause NaCl to precipitate. Use the MIXER model for the mixer and the FLASH2 model for the flash.
1 Modeling Electrolyte Chemistry 7
MIX
MIXER
FLASH
FLASH2
HCL
NAOH
LIQUID
VAPOR
MIXED
IsobaricAdiabatic
IsobaricMolar vapor fraction = 0.75
Temp = 25 CPres = 1 bar10 kmol/hr H2O1 kmol/hr HCL
Temp = 25 CPres = 1 bar10 kmol/hr H2O1.1 kmol /hr NAOH
Electrolyte Chemistry
Starting Aspen Plus
To Start Aspen Plus 1 From your desktop, select Start and then select Programs.
2 Select AspenTech | Process Modeling <version> | Aspen Plus | Aspen Plus User Interface.
The Aspen Plus Startup dialog box appears. Aspen Plus displays a dialog box whenever you must enter information or make a selection before proceeding. In this simulation, use an Aspen Plus template.
To Select the Template Option 1 Select Template and click OK.
The New dialog box appears.
2 Use the New dialog box to specify the Application Type and the Run Type for the new run. Aspen Plus uses the Application Type you choose to automatically set various defaults appropriate to your application.

8 1 Modeling Electrolyte Chemistry
To Specify the Application Type and Run Type for the New Run 1 Select the Electrolytes with Metric Units template.
The default Run Type, Flowsheet, is appropriate for this simulation.
2 Click OK to apply these options.
It takes a few seconds for Aspen Plus to apply these options.
Note: If the Connect to Engine dialog box appears, see "Connecting to the Aspen Plus Simulation Engine" on page 56.
The Aspen Plus window is now active.
Drawing the Graphical Simulation Flowsheet In this simulation you will begin to build the process flowsheet. Since you will enter your own block and stream IDs, turn off the default options to automatically assign block IDs and stream IDs.
1 From the Aspen Plus menu bar, select Tools and then select Options.
The Options dialog box appears.
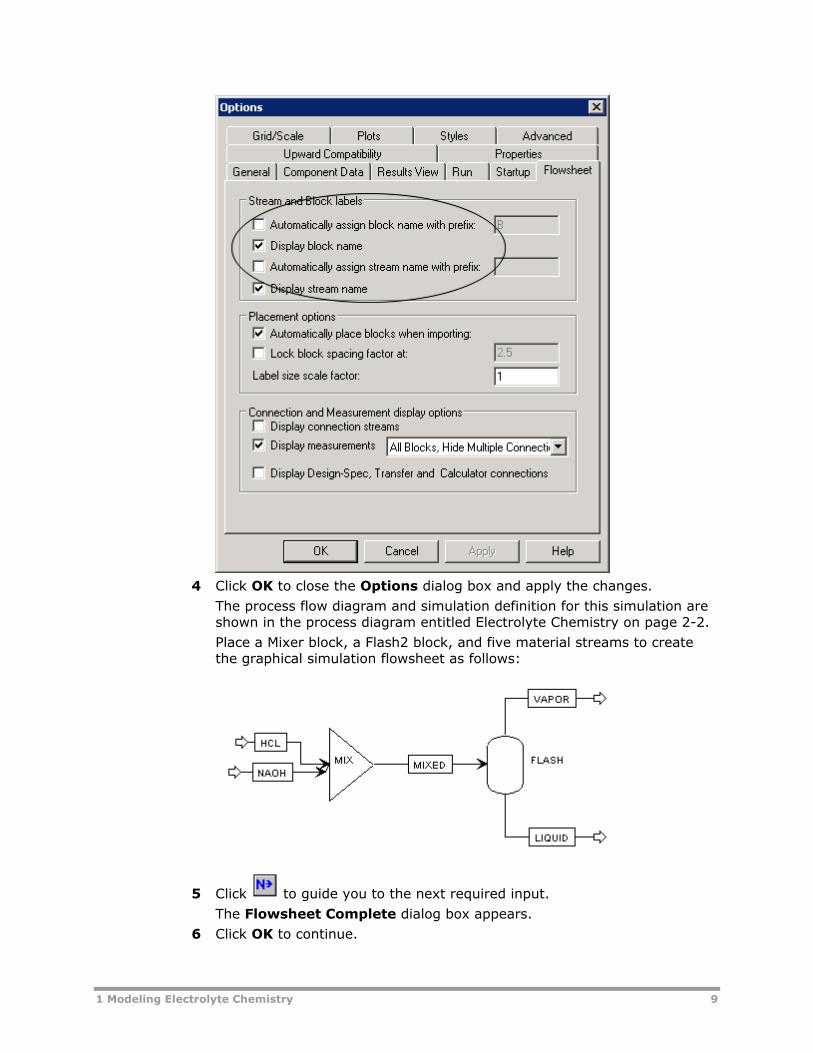
2 Select the Flowsheet tab.
3 Clear the Automatically assign block name with prefix and the Automatically assign stream name with prefix options.
1 Modeling Electrolyte Chemistry 9
4 Click OK to close the Options dialog box and apply the changes.
The process flow diagram and simulation definition for this simulation are shown in the process diagram entitled Electrolyte Chemistry on page 2-2.
Place a Mixer block, a Flash2 block, and five material streams to create the graphical simulation flowsheet as follows:
5 Click to guide you to the next required input.
The Flowsheet Complete dialog box appears.
6 Click OK to continue.
10 1 Modeling Electrolyte Chemistry
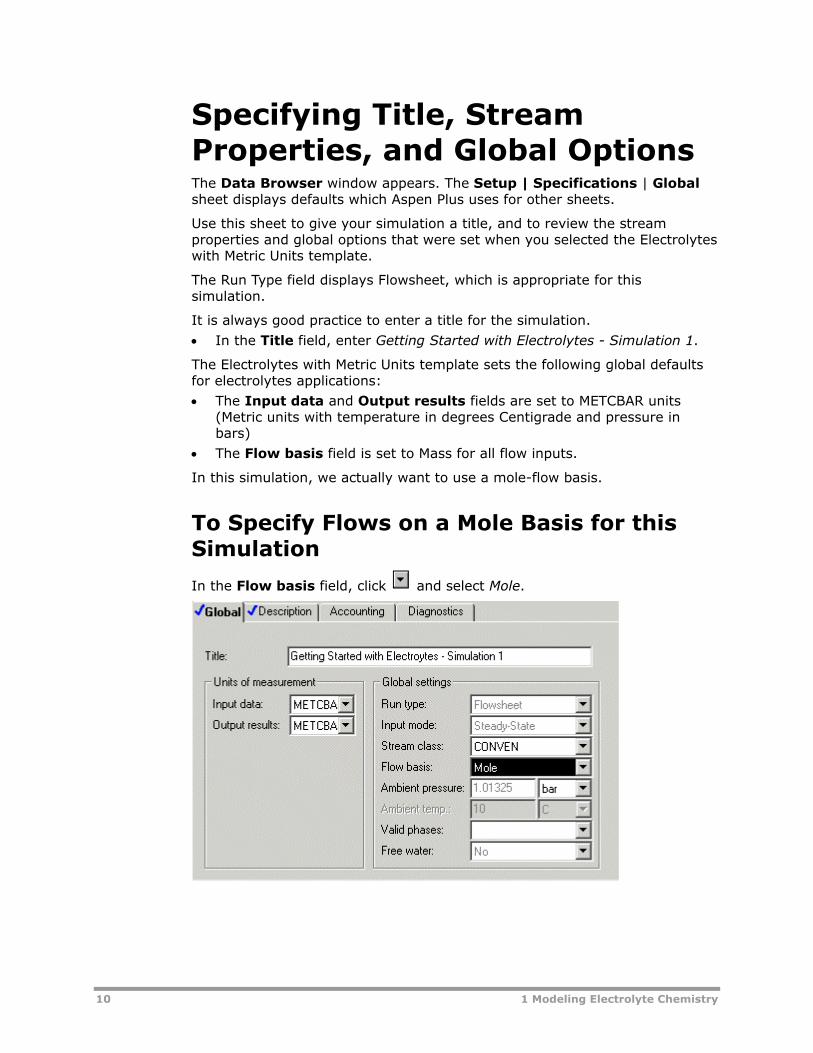
Specifying Title, Stream Properties, and Global Options The Data Browser window appears. The Setup | Specifications | Global sheet displays defaults which Aspen Plus uses for other sheets.
Use this sheet to give your simulation a title, and to review the stream properties and global options that were set when you selected the Electrolytes with Metric Units template.
The Run Type field displays Flowsheet, which is appropriate for this simulation.
It is always good practice to enter a title for the simulation.
• In the Title field, enter Getting Started with Electrolytes - Simulation 1.
The Electrolytes with Metric Units template sets the following global defaults for electrolytes applications:
• The Input data and Output results fields are set to METCBAR units (Metric units with temperature in degrees Centigrade and pressure in bars)
• The Flow basis field is set to Mass for all flow inputs.
In this simulation, we actually want to use a mole-flow basis.
To Specify Flows on a Mole Basis for this Simulation
In the Flow basis field, click and select Mole.
1 Modeling Electrolyte Chemistry 11
Reviewing Report Options To review the report options specified in the selected template:
1 From the Data Browser menu tree, select the Setup | Report Options form.
2 Click the Stream tab.
Based on the Electrolytes with Metric Units template, Aspen Plus displays the following defaults for calculating and reporting stream properties: o Flow Basis of Mole and Mass: Aspen Plus will report the component
flow rates on a mole and mass flow basis. Aspen Plus will not report composition on a fraction basis or a standard liquid volume flow basis.
o ELEC_M Stream Format: Aspen Plus formats the Stream Summary sheet for electrolytes using Metric units.
You will return to this sheet and specify stream properties later in this simulation.
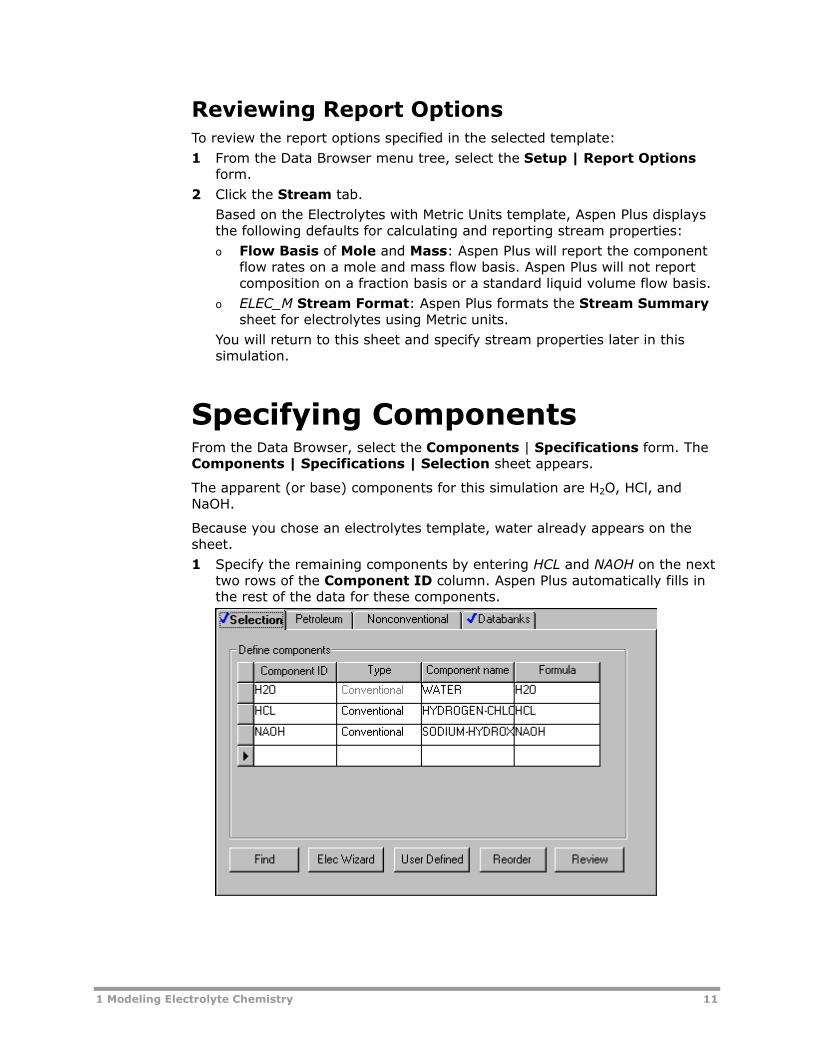
Specifying Components From the Data Browser, select the Components | Specifications form. The Components | Specifications | Selection sheet appears.
The apparent (or base) components for this simulation are H2O, HCl, and NaOH.
Because you chose an electrolytes template, water already appears on the sheet.
1 Specify the remaining components by entering HCL and NAOH on the next two rows of the Component ID column. Aspen Plus automatically fills in the rest of the data for these components.
12 1 Modeling Electrolyte Chemistry
To Rename H2O to Water 1 In the first Component ID field, select the text H2O and replace it with
WATER. Press Enter.
2 When the Aspen Plus dialog box appears, click Rename.
The Electrolyte Wizard Use the Electrolyte Wizard to define the ionic species and salts that can be generated from the base components entered on the Components | Specifications | Selection sheet, and to generate the reactions that occur among these components in the liquid phase.
1 Click Elec Wizard.
The Electrolyte Wizard dialog box appears.
Use this wizard for defining automatic chemistry generation.
After the list of steps, the Reaction Databank section shows the wizard's source of reaction data, either the legacy databank or one or more databases from the Aspen Properties Enterprise Database.
2 From the Electrolytes Wizard dialog box, click .
The Base Components and Reactions Generation Option dialog box appears. In this dialog box, there is a set of options for Hydrogen ion type. The default is Hydronium ion H3O+, but Hydrogen ion H+ is also available. Aspen Plus can treat acidic species as either H+ or H3O+. However, use of H3O+ is strongly recommended, because the presence of H3O+ in the solution chemistry is better able to represent the phase and chemical equilibrium of almost all electrolyte systems.
3 Click to move all components in the Available components column to the Selected components column.

1 Modeling Electrolyte Chemistry 13
4 Click to continue.
The Generated Species and Reactions dialog box appears:
Aspen Plus generates all possible ionic and salt species and reactions for the H2O-NAOH-HCL system.
In the Reactions section in the Generated Species and Reactions dialog box, different style arrows denote the following reaction types:
<===> Denotes ionic equilibrium or salt precipitation
---> Denotes complete dissociation
In this example, three types of reactions are generated: ionic equilibrium, complete dissociation, and salt precipitation.

14 1 Modeling Electrolyte Chemistry
The dissociation of water and the dissociation of HCl are equilibrium reactions. NaCl precipitation/dissolution is also an equilibrium reaction. In contrast, NAOH dissociates completely and irreversibly into Na+ and OH–.
To Remove Salts from the Solution Chemistry
In this simulation, the NaOH and the NaOH*W salts are not relevant. Remove these unnecessary species and their reactions.
5 From the Salts list, select NaOH(S) and NaOH*W(S).
6 Click Remove.
Now that you have removed these salts from the system, Aspen Plus automatically removes all reactions involving NaOH(S) and NaOH*W(S) from the Reactions list.
Note: Any time you know that a reaction can be neglected because of expected process conditions, remove it from the solution chemistry to decrease the execution time required for your simulation.
7 On the Generated Species and Reactions dialog box click to accept the remaining generated species and reactions.
The Simulation Approach dialog box appears, allowing you to choose between the true component approach and the apparent component approach.
8 Select the True component approach option.
When you use the true component approach, Aspen Plus solves the equations describing solution chemistry simultaneously with the unit operation equations. The unit operations deal directly with the ions and salts formed by solution chemistry. In addition, the true component approach defines how Aspen Plus reports the simulation results. Results
1 Modeling Electrolyte Chemistry 15
are reported in terms of the ions, salts, and molecular components that are actually present, not in terms of the original base components.
For example, the generated chemistry for this system specifies that NaOH fully dissociates into NA+ and OH–. If you choose the true component approach, Aspen Plus will report NaOH flow in terms of NA+ flow and OH– flow, not in terms of the NaOH base component flow. You can request that composition and flows also be reported in terms of the apparent (base) components. You will do this later in this simulation.
9 Click to move to the next dialog box.
The Summary dialog box appears, providing Aspen Plus electrolytes expert system information.
10 Click Finish to close the dialog box.
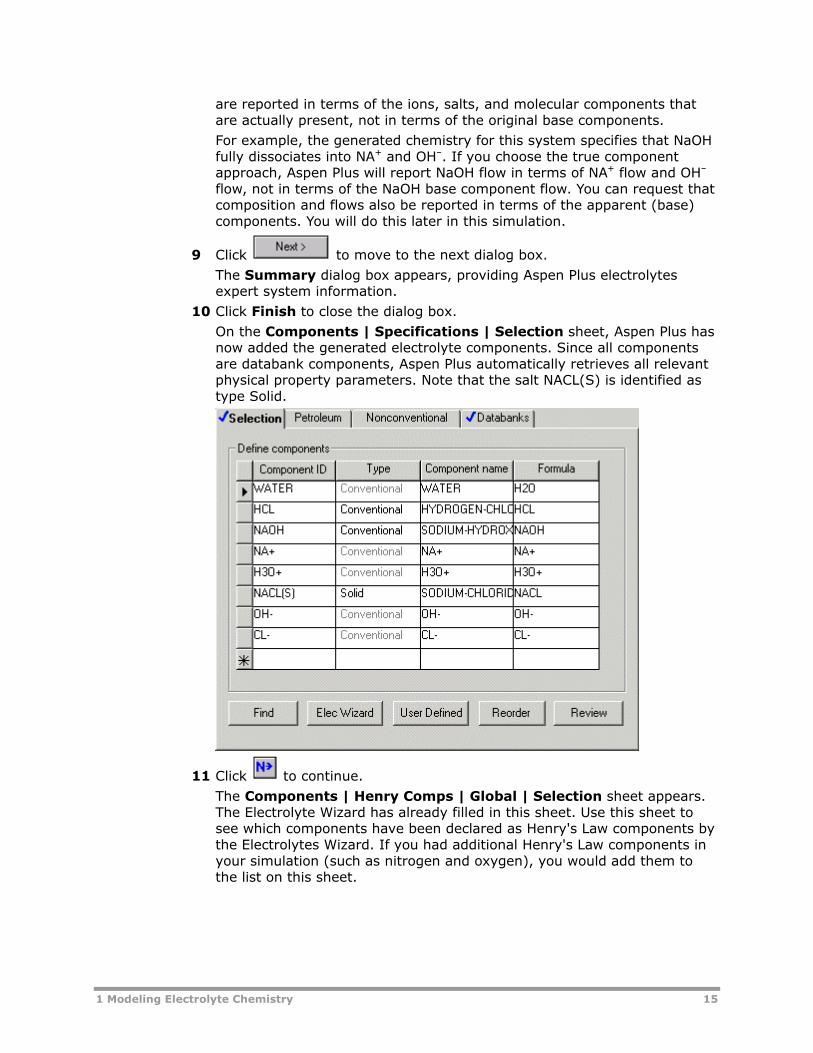
On the Components | Specifications | Selection sheet, Aspen Plus has now added the generated electrolyte components. Since all components are databank components, Aspen Plus automatically retrieves all relevant physical property parameters. Note that the salt NACL(S) is identified as type Solid.
11 Click to continue.
The Components | Henry Comps | Global | Selection sheet appears. The Electrolyte Wizard has already filled in this sheet. Use this sheet to see which components have been declared as Henry's Law components by the Electrolytes Wizard. If you had additional Henry's Law components in your simulation (such as nitrogen and oxygen), you would add them to the list on this sheet.

16 1 Modeling Electrolyte Chemistry
Examining Generated Chemistry In the previous step, the Aspen Plus Electrolyte Expert System automatically generated the chemistry definition for your simulation and named it GLOBAL.
To Examine the Generated Chemistry 1 From the Data Browser, select the Reactions folder.
2 From the Reactions folder, select Chemistry and then Global.
The Reactions | Chemistry | Global | Stoichiometry sheet appears:
To View a Particular Reaction 1 Select a Reaction and click Edit.
The Equilibrium Reaction Stoichiometry dialog box appears, with the data for the selected reaction.

1 Modeling Electrolyte Chemistry 17
The first equilibrium ionic reaction shown is for water dissociation.
2 Close the dialog box and view the other reactions using the same steps.
3 Select the Equilibrium Constants sheet.
The optional equilibrium constant coefficients have been automatically retrieved from the Aspen Plus reactions database.
The Aspen Plus reactions database contains over 600 reactions, which cover virtually all common electrolyte applications.
4 Click to the right of the Equilibrium reaction field to select another equilibrium reaction and view the equilibrium constants.
The second equilibrium ionic reaction is for HCL dissociation. There are no equilibrium constant coefficients for this reaction. Instead of calculating the equilibrium constant directly, Aspen Plus will calculate the chemical equilibrium from the Gibbs free energy of the participating components.

18 1 Modeling Electrolyte Chemistry
To View the Equilibrium Constants for the Salt Reactions The reaction for NACL(S) precipitation and its equilibrium constant coefficients are also available on this sheet.
1 In the Equilibrium constants for option, select Salt.
2 If you had additional salt dissolution reactions you could click and to view them, but since there is only one salt, these buttons are unavailable.
For the complete dissociation reaction of NaOH, no constants are shown. Since this is a complete dissociation reaction, it does not require an equilibrium constant.
If you had your own equilibrium constant coefficients, you would enter them directly on this sheet. If you had additional reactions to include, you would enter them on the Stoichiometry sheet and then perhaps add equilibrium data here.
Selecting Electrolyte Property Models The Properties | Specifications | Global sheet is used to enter the thermodynamic methods used to calculate the properties used in the simulation.
1 From the Data Browser, open the Properties folder and select Specifications.
The Properties | Specifications | Global sheet appears. The Electrolyte Wizard has already completed this sheet:
The Electrolyte-NRTL activity coefficient model, ELECNRTL, is the recommended option set for simulations with electrolytes. ELECNRTL calculates liquid phase properties from the Electrolyte-NRTL activity
1 Modeling Electrolyte Chemistry 19
coefficient model. Vapor phase properties are calculated from the Redlich-Kwong equation of state.
ELECNRTL can represent aqueous and aqueous/organic electrolyte systems over the entire range of electrolyte concentrations with a single set of binary interaction parameters. In the absence of electrolytes, the model reduces to the standard NRTL model.
Aspen Plus contains a databank of binary interaction parameters between water and over 600 electrolyte ion pairs. If the binary interaction parameters between any solvent and an electrolyte ion pair are missing from the databank, and you do not provide values, Aspen Plus provides reasonable default values.
2 Click to continue.
The Binary Interaction | HENRY-1 | Input sheet appears.
Use this sheet to view the Henry's Law parameters retrieved by the electrolytes expert system. If you had your own Henry's Law parameters, you would enter them on this sheet.
3 Click to continue.
The Binary Interaction | VLCLK-1 | Input sheet appears.
Use this sheet to view the Clarke density parameters retrieved by the electrolytes expert system. If you had your own Clarke density parameters, you would enter them on this sheet.
4 From the Data Browser, select the Properties | Parameters | Electrolyte Pair folder.
The Electrolyte Pair sheets define the electrolyte pair parameters: GMELCC, GMELCD, GMELCE, and GMELCN. If you had your own pair parameters, you would enter them on these sheets.
5 Click to continue.
The Electrolyte Pair | GMELCC-1 | Input sheet appears.
6 Click to continue.
The Electrolyte Pair | GMELCD-1 | Input sheet appears.
7 Click to continue.
The Electrolyte Pair | GMELCE-1 | Input sheet appears.
8 Click to continue.
The Electrolyte Pair | GMELCN-1 | Input sheet appears.
9 Click to continue.
The Required Properties Input Complete dialog box appears:

20 1 Modeling Electrolyte Chemistry
Correct representation of physical properties is essential to process modeling. For many simulations, the only physical property specification that you must provide is the selection of a property method. This dialog box shows that the Aspen Plus physical property system has many optional capabilities to increase the accuracy of the physical property calculations.
Because the Aspen Plus electrolytes database has data for all components and pairs in this simulation, you don't need to provide any optional specifications or data.
Now that the Components and Properties specifications are complete, complete the rest of the flowsheet specifications in the same way as for nonelectrolytes. There are no stream or block restrictions in using Aspen Plus electrolytes. You can use all Aspen Plus unit operation models in an electrolytes simulation.
10 Click OK to move to the next required input.
Entering Stream Data The Streams | HCL | Input | Specifications sheet appears. Aspen Plus requires two thermodynamic specifications and enough information to calculate the flow rate of each component.
1 On the Streams HCL Input Specifications sheet, enter the following:
Temperature 25 C
Pressure 1 bar
WATER flow value 10 kmol/hr
HCL flow value 1 kmol/hr
You entered the flow specifications for this stream in terms of the base components (the apparent components). Although you are using the true component approach in this simulation, Aspen Plus can accept stream specifications in terms of the apparent components as well as the true components. Aspen Plus converts the apparent component flow specifications to true component specifications.

1 Modeling Electrolyte Chemistry 21
2 Click to continue.
The Streams | NAOH | Input | Specifications sheet appears.
3 Enter the following data
Temperature 25 C
Pressure 1 Bar
WATER flow value 10 kmol/hr
NAOH flow value 1.1 kmol/hr
4 Click to continue.
Specifying the Flash Block The Blocks | FLASH | Input | Specifications sheet appears. For this simulation, specify the pressure drop and vapor fraction.
1 In the Temperature field, click , select Vapor fraction, and then enter 0.75.
2 In the Pressure field, enter 0 (indicating there is no pressure drop).
3 Click to continue.
The Blocks | MIX | Input | Flash Options sheet appears. As the prompt says, the zero default pressure indicates a zero pressure drop, which is correct for this simulation.
4 Click to continue.
The Required Input Complete dialog box appears informing you that all required input is complete and asking if you want to run the simulation.
Before running the simulation, request that certain optional properties be included in the stream report.
5 Click Cancel to close the dialog box without running the simulation.
Specifying Additional Stream Properties By default, the only component properties that Aspen Plus calculates and reports for this simulation are component mass flows. Since you are using the true component approach, the component flows will be in terms of the components actually present at equilibrium, not the apparent (base) components.
22 1 Modeling Electrolyte Chemistry
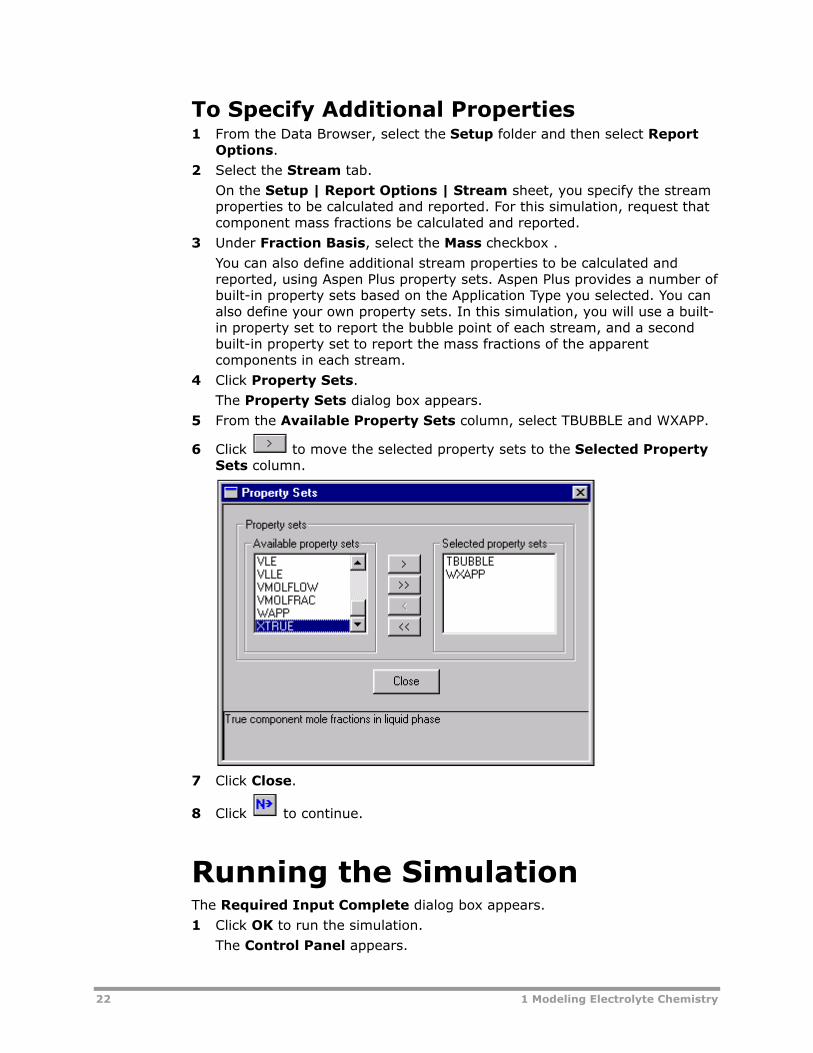
To Specify Additional Properties 1 From the Data Browser, select the Setup folder and then select Report
Options.
2 Select the Stream tab.
On the Setup | Report Options | Stream sheet, you specify the stream properties to be calculated and reported. For this simulation, request that component mass fractions be calculated and reported.
3 Under Fraction Basis, select the Mass checkbox .
You can also define additional stream properties to be calculated and reported, using Aspen Plus property sets. Aspen Plus provides a number of built-in property sets based on the Application Type you selected. You can also define your own property sets. In this simulation, you will use a built-in property set to report the bubble point of each stream, and a second built-in property set to report the mass fractions of the apparent components in each stream.
4 Click Property Sets.
The Property Sets dialog box appears.
5 From the Available Property Sets column, select TBUBBLE and WXAPP.
6 Click to move the selected property sets to the Selected Property Sets column.
7 Click Close.
8 Click to continue.
Running the Simulation The Required Input Complete dialog box appears.
1 Click OK to run the simulation.
The Control Panel appears.

1 Modeling Electrolyte Chemistry 23
As the run proceeds, status messages appear in the Control Panel.
Aspen Plus has a special databank it searches only when you use the ELECNRTL option set, as in this simulation. Some physical property parameters in this databank may be different from the parameters in the standard non-electrolyte databanks. The values of the physical property parameters in the special databank were determined to provide a better fit for electrolyte systems, and are not generally applicable.
When values are retrieved from this special databank, Aspen Plus generates messages in the Control Panel to inform you what properties are retrieved for which components.
2 Use the vertical scrollbar to the right of the Control Panel window to see the messages.
When the calculations finish, the message Results Available appears in the status area at the bottom right of the main window.
3 Examine the results of your run.
Examining Simulation Results 1 From the Control Panel, click .
The Results Summary | Run Status | Summary sheet appears, indicating that the simulation completed normally.
2 Click in the Data Browser toolbar to move to the next results sheet.
The Results Summary | Streams | Material sheet appears.
3 Review the results on this sheet.
4 Use the horizontal and vertical scrollbars to review results that are off the screen.
Since you selected the True Component approach, results for Mass Flow and Mass Frac are in terms of true components.

24 1 Modeling Electrolyte Chemistry
Although you specified the flow rates in terms of the apparent components (1 kmol/hr HCl and 10 kmol/hr H2O), Aspen Plus calculated the flow rates of the true components. In stream HCL, there is only a trace of molecular HCL remaining. Virtually all of the HCl is dissociated into H3O+ and Cl–. Since the HCl dissociation consumes a mole of water, the overall H2O flow rate is reduced from 180 kg/hr (10 kmol/hr) to 162 kg/hr (9 kmol/hr).
You also specified stream NAOH in terms of apparent components (1.1 kmol/hr NaOH and 10 kmol/hr H2O). NaOH dissociates completely into Na+ and OH–. This is reflected by the complete disappearance of molecular NaOH in this stream.
Stream HCL and Stream NAOH are added together in block MIX to form Stream MIXED. Because water dissociation is included as one of the electrolyte reactions, MIX allows H3O+ and OH- to recombine to form water. The heat of this reaction raises the temperature of Stream MIXED from 25 ºC (the temperature of both inlets) to 59.5 ºC. This demonstrates that the heat of electrolyte reactions (including the heat of mixing) is automatically included in Aspen Plus electrolytes calculations.
Stream MIXED feeds into a Flash2 block where water is boiled off. Because ions and precipitated salts are nonvolatile, Stream VAPOR only contains pure water. As the ions are concentrated in Stream LIQUID, the solubility limit of NaCl in water is exceeded, causing 30 kg/hr of molecular NaCl(S) to precipitate.
Examine the bubble temperature for stream MIXED and stream LIQUID. Stream MIXED is subsaturated in NACL and stream LIQUID is saturated with NACL. Aspen Plus correctly calculates the bubble point of LIQUID (109 C) as greater than the bubble point of MIXED (103 C), which is greater than the boiling point of pure water at 1 bar (99.6 C).
Compare the apparent mass fractions for the liquid phase with the true component mass fractions in stream LIQUID. Even though stream LIQUID has precipitated NaCl(S), the apparent mass fraction of NaCl(S) is zero because Aspen Plus does not consider precipitated salts to be apparent components. The apparent mass fractions of the ions Na+, H3O+, OH–, and Cl– are also zero. Precipitated salts and ions can only be true components.
Since the precipitated NaCl(S) is not an apparent component, it is represented in the apparent component approach in terms of the original species that combined to form NaCl(S): NaOH, and HCl. This is why the apparent component basis mass fraction of NaOH is 0.209 even though the true component basis mass fraction of NAOH is zero.
You have now viewed the most relevant results for an electrolytes simulation.
5 This simulation has other Results sheets. Click to view them, if you choose.
Running Electrolytes in EO This topic assumes that you are familiar with running simulations in Equation Oriented mode. If you are unfamiliar with EO, you can either skip this section, or refer to Getting Started Using Equation Oriented Modeling.

1 Modeling Electrolyte Chemistry 25
1 Click on the Control Panel to make it the active window.
2 If the More button at the bottom left corner of the Control Panel is visible, click the More button to see options related to EO modeling.
3 In the menu bar of the Control Panel, toggle the Simulation from Sequential Modular to Equation Oriented.
Aspen Plus builds the EO flowsheet and initializes the EO variable values from the SM solution. The following Warnings are displayed during EO synchronization:
* WARNING WHILE INITIALIZING UNIT OPERATIONS BLOCK: "FLASH" (MODEL: "FLASH2") SMALLEST LIQUID MOLE FRACTION OF 1.11E-27 IS LESS THAN THE COMPOSITION TOLERANCE OF 1.00E-15 THIS MAY RESULT IN LOSS OF ACCURACY OF THE SOLUTION. REDUCE THE EO-OPTION FOR THE COMPOSITION TOLERANCE. * WARNING WHILE INITIALIZING UNIT OPERATIONS BLOCK: "MIX" (MODEL: "MIXER") SMALLEST LIQUID MOLE FRACTION OF 2.44E-28 IS LESS THAN THE COMPOSITION TOLERANCE OF 1.00E-15 THIS MAY RESULT IN LOSS OF ACCURACY OF THE SOLUTION. REDUCE THE EO-OPTION FOR THE COMPOSITION TOLERANCE. * WARNING WHILE INITIALIZING STREAM BLOCK: "NAOH" SMALLEST LIQUID MOLE FRACTION OF 1.61E-17 IS LESS THAN THE COMPOSITION TOLERANCE OF 1.00E-15 THIS MAY RESULT IN LOSS OF ACCURACY OF THE SOLUTION. REDUCE THE EO-OPTION FOR THE COMPOSITION TOLERANCE. * WARNING WHILE INITIALIZING STREAM BLOCK: "HCL" SMALLEST LIQUID MOLE FRACTION OF 7.89E-18 IS LESS THAN THE COMPOSITION TOLERANCE OF 1.00E-15 THIS MAY RESULT IN LOSS OF ACCURACY OF THE SOLUTION. REDUCE THE EO-OPTION FOR THE COMPOSITION TOLERANCE.
To prevent numerical difficulties in the equilibrium equations, liquid compositions of exactly zero are not permitted. When EO is synchronized, all ionic and volatile components that have a mole fraction of zero are reset to the EO Composition tolerance. If this is unacceptable, these components can be removed from EO calculations by specification of Model Comps.
EO solution of an electrolyte simulation using the true approach also requires a smoothing of liquid compositions as they approach zero. The smoothed mole fractions are the raw mole fractions after passing through a smoothing equation. Smoothing ensures that the liquid compositions remain positive during physical property evaluations.
The smoothing tolerance is defined by the EO option Comp-Tol. The Warning messages above were triggered by streams/blocks that have one or more liquid mole fractions below the smoothing tolerance. When the EO problem is solved, compositions less than the composition tolerance should be considered suspect. If it is important to calculate these compositions as accurately as possible, the composition tolerance should be decreased (in this case to 1.e-27 or smaller). Alternatively, if compositions less that the composition tolerance are unimportant, the solution can be accepted as is.

26 1 Modeling Electrolyte Chemistry
In addition, components with very low concentrations are dropped in EO to simplify the problem. In this case, the HCL component (which is almost entirely dissociated into ions) gets dropped. For this example, we do not want any components to get dropped.
For this example, you will solve the problem as is, modify the composition tolerance and option to remove components, and re-solve the problem.
4 In the Control Panel, click to solve the EO simulation.
Like all EO Options, the composition tolerance can be specified at the global level, the hierarchy level, or the block level. For this example, you will specify it at the global level.
5 From the toolbar, select Data | EO Configuration | EO Options
6 In the Remove Components field, select Never. 7 Click the Additional Options button. The Additional Options dialog box
appears.
8 Enter 1.E-28 in the Comp-tol field.
9 Close the Additonal Options dialog box.
10 In the Control Panel, click , then click OK to reinitialize the EO simulation with the new options. This is required to restore the dropped
components. Then click to solve the EO simulation with the modified composition tolerance. The simulation solves without warnings.
Viewing EO Electrolyte Results When using the true component approach with electrolytes, some additional EO variables are created. You can find these on the EO grid for any block or stream.
1 Bring up the stream results for stream NAOH.
2 In the Data Browser tree, click EO Variables to display the EO grid.
3 Scroll down to bottom of the EO grid.

1 Modeling Electrolyte Chemistry 27
BLK.LIQ_H2O is the smoothed liquid mole fraction for water. BLK.LIQ_RAW_H2O is the raw liquid mole fraction for water. Since its value (0.819672) is greater than the composition tolerance, the smoothed value and the raw value are equal.
BLK.LIQ_HCL is the smoothed liquid mole fraction for HCl. BLK.LIQ_RAW_HCL is the raw liquid mole fraction for HCl. Since its value (-6.68191e-058) is less than the composition tolerance, the smoothed value and the raw value are not equal. The value is actually slightly negative because it is difficult to converge on such a small concentration; this is the kind of problem that the smoothing algorithm is designed to alleviate.
BLK.LIQ_H3O+_LOG_ACT is the logarithm of the activity coefficient of H3O+. Liquid phase activity coefficients are used in the evaluation of Chemistry equilibrium constants.
BLK.LOG_KEQ_1 is the log of the equilibrium constant for Chemistry reaction number 1. Chemistry reactions are numbered, with equilibrium reactions occurring first, dissociation reactions second, and salt precipitation reactions last.
BLK.EXT_1 is the extent of reaction for Chemistry reaction number 1.
BLK.TRUE_NA+ is the true component mole fraction of Na+ after all of the streams are mixed together. Since these are the results for a single, liquid phase stream, it has the same value as BLK.NA+.

28 1 Modeling Electrolyte Chemistry
Exiting Aspen Plus 1 From the Aspen Plus menu, select File and then select Exit.
The Aspen Plus dialog box appears.
2 Click No.
– or –
Click Yes if you want to save the run, and enter a Run ID when prompted.
This simulation (using the apparent approach) is delivered as backup file elec1 in the Aspen Plus Examples Library. Use this backup file to check your results.

2 Modeling a Sour Water Stripper 29
2 Modeling a Sour Water Stripper
In this simulation, use a distillation column to strip NH3 and H2S from a sour water feed stream.
You will:
• Modify the generated Chemistry.
• Use the apparent component approach for electrolytes.
• Define a stream property (Property Set).
• Convert the simulation from the apparent approach to the true approach.
Allow about 45 minutes to do this simulation.

30 2 Modeling a Sour Water Stripper
Sour Water Stripper Flowsheet The process flow diagram and operating conditions for this simulation are shown in the Process Diagram: Sour Water Stripper. Two feed streams, one containing sour water, the other steam, are fed to a stripper to remove CO2, H2S, and NH3 from the sour water. Use RadFrac to simulate the stripper.
SOURWAT
STEAM
BOTTOMS
VAPOR
Temperature = 190 FPressure = 15 psiTotal f low = 10,000 lb/hrMass fract ion H2S = 0.001Mass fraction NH3 = 0.001Mass fract ion CO2 = 0.001Mass fract ion H2O = 0.997
Pressure = 15 psiSaturated vaporEstimated H2O flow rate = 2,000 lb/hr
AboveStage 3
On Stage10
5.0 ppm NH3
9 Theoretical stages + condenserPressure = 15 psiEstimated molar ref lux ratio = 25
Condenser temperature = 190 F
saturated vapor distillate
Process Diagram: Sour Water Stripper
The specifications for the column are:
• 10 theoretical stages total (includes one for the condenser).
• Distillate product as saturated vapor (partial condenser).
• Initial estimate for molar reflux ratio = 25.
• No reboiler.
• Feed stream SOURWAT above stage 3.
• Feed stream STEAM on stage 10.
• Column pressure of 15 psia (isobaric).
• Vary the reflux ratio and stream STEAM feed rate to achieve a bottoms product with 5 ppm (mass) of NH3 and a condenser temperature of 190° F.

2 Modeling a Sour Water Stripper 31
Starting Aspen Plus
To Start Aspen Plus 1 From your desktop, select Start and then select Programs.
2 Select AspenTech | Process Modeling <version> | Aspen Plus | Aspen Plus User Interface.
The Aspen Plus Startup dialog box appears. Aspen Plus displays a dialog box whenever you must enter information or make a selection before proceeding. In this simulation, use an Aspen Plus template.
To Select the Template Option 1 Select the Template radio button and click OK.
The New dialog box appears.
2 Use the New dialog box to specify the application type and the run type for the new run. Aspen Plus uses the application type you choose to automatically set various defaults appropriate to your application.
To Specify the Application Type and Run Type for the New Run 1 Select the Electrolytes with English Units template.
The default Run Type, Flowsheet, is appropriate for this simulation.
2 Click OK to apply these options.

32 2 Modeling a Sour Water Stripper
It will take a few seconds for Aspen Plus to apply these options.
Note: If the Connect to Engine dialog box appears, see "Connecting to the Aspen Plus Simulation Engine" on page 56.
The Aspen Plus window is now active.
Drawing the Graphical Simulation Flowsheet In this simulation, begin to build the process flowsheet. Since you will enter your own block and stream IDs, turn off the default options which automatically assign these IDs.
1 From the Aspen Plus menu bar, select Tools | Options.
The Options dialog box appears.
2 Select the Flowsheet tab.
3 Clear the Automatically Assign Block Name with Prefix and the Automatically Assign Stream Name with Prefix options.
4 Click OK to close the Options dialog box and apply the changes.

2 Modeling a Sour Water Stripper 33
5 Place a RadFrac blocks and streams to create the graphical simulation flowsheet as follows:
Note that the distillate stream is connected to the Vapor Distillate port.
6 Click to guide you to the next required input.
The Flowsheet Complete dialog box appears.
7 Click OK to continue.
Specifying Title, Stream Properties, and Global Options The Data Browser window appears. The Setup | Specifications | Global sheet displays default Aspen Plus settings and units used for other sheets.
Use this sheet to give your simulation a title, and to review the stream properties and global options that were set when you selected the Electrolytes with English Units application type.
The Run type field displays Flowsheet, which is appropriate for this simulation.
The Electrolytes with English Units application type sets the following global defaults for electrolytes applications:
• ENG units (English units).
• Mass Flow basis for all flow inputs.
It is always good practice to enter a title for the simulation.
In the Title field, enter Getting Started with Electrolytes - Simulation 2.

34 2 Modeling a Sour Water Stripper
To Review the Report Options Specified in the Selected Template 1 From the Data Browser, select the Setup | Report Options form.
2 Select the Stream sheet.
Aspen Plus displays the following defaults for calculating and reporting stream properties taken from the Electrolytes with English Units template: o Flow Basis of Mass: Aspen Plus will report the component flow rates on
a mass flow basis.
o ELEC_E Stream Format: Aspen Plus formats the Stream Summary sheet for electrolytes.
To Move to the Next Required Input Sheet 3 From the Data Browser, select the Components folder and then select
Specifications.
Specifying Components The Components Specifications Selection sheet appears.
The apparent (or base) components for this simulation are H2O, NH3, H2S, and CO2. Because you chose an electrolytes Application Type, water already appears on the sheet.
2 Modeling a Sour Water Stripper 35
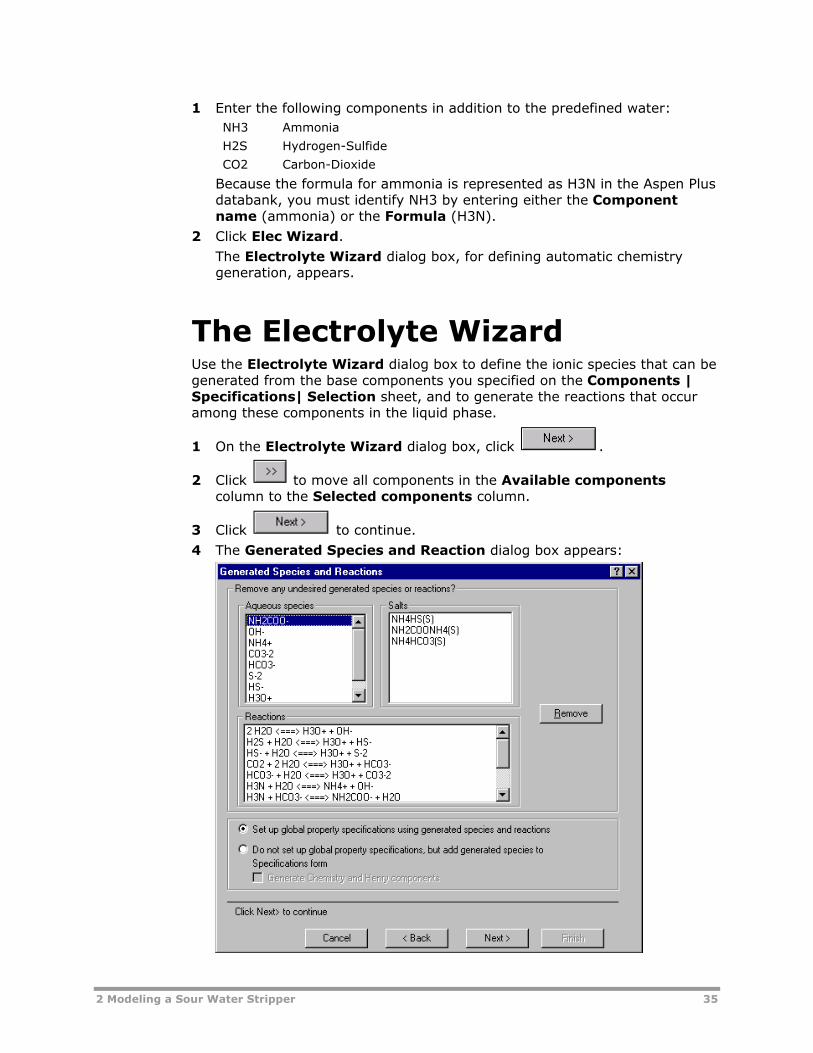
1 Enter the following components in addition to the predefined water: NH3 Ammonia
H2S Hydrogen-Sulfide
CO2 Carbon-Dioxide
Because the formula for ammonia is represented as H3N in the Aspen Plus databank, you must identify NH3 by entering either the Component name (ammonia) or the Formula (H3N).
2 Click Elec Wizard.
The Electrolyte Wizard dialog box, for defining automatic chemistry generation, appears.
The Electrolyte Wizard Use the Electrolyte Wizard dialog box to define the ionic species that can be generated from the base components you specified on the Components | Specifications| Selection sheet, and to generate the reactions that occur among these components in the liquid phase.
1 On the Electrolyte Wizard dialog box, click .
2 Click to move all components in the Available components column to the Selected components column.
3 Click to continue.
4 The Generated Species and Reaction dialog box appears:

36 2 Modeling a Sour Water Stripper
Aspen Plus generates all possible ionic species and reactions for the H2O-NH3-H2S-CO2 system.
In the Generated Reactions list, the following arrows denote different reaction types: <===> Denotes ionic equilibrium and salt precipitation
--->> Denotes complete dissociation
For this simulation, you know that ammonium carbamate formation can be neglected.
To Remove NH2COO- Formation from the Solution Chemistry 5 Select NH2COO– in the Aqueous species list.
6 Click Remove.
7 Now that you have removed NH2COO– from the Generated Aqueous Species list, Aspen Plus automatically removes all reactions involving NH2COO– from the Reactions list.
The salts are also not relevant.
To Remove the Salts from the Solution Chemistry 8 Select NH4HS(S) and NH4HCO3(S) from the Salts list.
9 Click Remove.

2 Modeling a Sour Water Stripper 37
Note: Any time you know that a reaction can be neglected because of expected process conditions, remove it from the solution chemistry to decrease the execution time required for your simulation.
In this example, only ionic equilibrium reactions are generated. The remaining six generated reactions represent partial dissociation of water, partial dissociation of H2S to HS– and S–2, partial dissociation of CO2 to HCO3
– and CO3–2, and partial dissociation
of NH3 to NH4+.
10 On the Generated Species and Reactions dialog box click to accept the generated species and reactions.
The Simulation Approach dialog box appears, allowing you to choose between the true species approach and the apparent component approach. For this simulation, use the apparent component approach.
When you use the apparent component approach, Aspen Plus solves the equations describing solution chemistry as part of the physical property calculations. Aspen Plus modifies the physical properties of the apparent components to account for the reactions described by the solution chemistry. The ions and precipitated salts are not seen by the unit operation models.
The apparent component approach also defines how Aspen Plus reports simulation results. The component flow rates for ions are not reported. Instead, Aspen Plus reports the component flow rates of the apparent components as if no dissociation occurred.
For example, the generated Chemistry for this system specifies that H2S partially dissociates into HS- and S-2. If you choose the apparent component approach, Aspen Plus will report a value for the mole flow rate of H2S that includes molecular H2S, HS-, and S-2.
11 Select the Apparent component approach option.
12 Click to move to the next dialog box.
The Summary dialog box appears, providing Aspen Plus electrolytes expert system information.
13 Click Finish to close the dialog box.
On the Components | Specifications | Selection sheet, Aspen Plus has now added the generated electrolyte components. Since all components are databank components, Aspen Plus automatically retrieves all relevant physical property parameters.

38 2 Modeling a Sour Water Stripper
14 Click to continue.
The Components | Henry Comps | Global | Selection sheet appears. Use this sheet to see which components have been declared as Henry's Law components by the electrolytes expert system in the Henry Comps group it created, GLOBAL. If you had additional Henry's Law components in your simulation (such as nitrogen and oxygen), you could add them to the list on this sheet.
Examining Generated Chemistry In the previous step, the Aspen Plus Electrolyte Wizard automatically generated the chemistry definition for your simulation and named it GLOBAL.
To Examine the Generated Chemistry 1 From the Data Browser, select the Reactions folder.
2 From the Reactions folder, select the Chemistry | Global. The Reactions | Chemistry | Global | Stoichiometry sheet appears.

2 Modeling a Sour Water Stripper 39
To View the Generated Chemistry 1 Select a Reaction and click Edit.
The Equilibrium Reaction Stoichiometry dialog box appears, with the data for the selected reaction that was generated by the Electrolytes Wizard.
2 Close the dialog box and view the other reactions using the same steps.
3 Click the Equilibrium Constants tab. Select the various reactions in the
Equilibrium reaction field. All six reactions have equilibrium constants that have been retrieved from the Aspen Plus reactions database.
4 From the Data Browser, select the Properties folder and then select Specifications.
The Properties | Specifications | Global sheet appears. The Electrolyte Wizard has already completed this sheet:

40 2 Modeling a Sour Water Stripper
5 Ensure that the Use true-components checkbox is cleared.
6 Click to continue.
The Binary Interaction sheet appears for the binary parameters HENRY-1. Use this sheet to view the Henry's Law parameters retrieved by the electrolytes expert system. If you had your own Henry's Law parameters, you could enter them on this sheet.
7 Click to continue.
The Binary Interaction sheet appears for the binary parameters NRTL-1. Use this sheet to view the molecule-molecule interaction parameters retrieved by the electrolytes expert system. If you had your own molecule-molecule interaction parameters, you could enter them on this sheet.
8 From the Data Browser, select the Properties folder, then select the Parameters folder, and then select the Electrolyte Pair folder.
The Electrolyte Pair sheets define the electrolyte pair parameters: GMELCC, GMELCD, GMELCE, and GMELCN. If you had your own pair parameters, you could enter them on these sheets.
9 Click to continue.
The Electrolyte Pair GMELCC-1 Input sheet appears.
10 Click to continue.
The Electrolyte Pair GMELCD-1 Input sheet appears.
11 Click to continue.
The Electrolyte Pair GMELCE-1 Input sheet appears.
12 Click to continue.
The Electrolyte Pair GMELCN-1 Input sheet appears.
13 Click to continue.
The Required Properties Input Complete dialog box appears:

2 Modeling a Sour Water Stripper 41
Correct representation of physical properties is essential to process modeling. For many simulations, the only physical property specification that you must provide is the selection of an option set. This dialog box shows that the Aspen Plus physical property system has many optional capabilities to increase the accuracy of the physical property calculations.
Because the Aspen Plus electrolytes database has data for all components and pairs in this system, you don't need to provide any optional specifications or data.
Now that the Components and Properties specifications are complete, complete the rest of the flowsheet specifications in the same way as for non-electrolytes. Use all Aspen Plus unit operation models in an electrolytes simulation.
14 Click OK to move to the next required input.
Entering Stream Data The Streams | SOURWAT | Input | Specifications sheet appears. Aspen Plus requires two thermodynamic specifications and enough information to calculate the molar flow rate of each component.
1 Enter the following data:
Temperature 190 F
Pressure 15 psia
Total flow Mass 10000 LB/HR
2 In the Composition field, click and select Mass-Frac.
3 Enter the following mass fraction values:
H2O 0.997
NH3 0.001
H2S 0.001
CO2 0.001

42 2 Modeling a Sour Water Stripper
4 Click to continue.
The Streams | STEAM | Input | Specifications sheet appears.
5 In the Temperature field, click and select Vapor fraction.
6 Enter the following data:
Vapor fraction 1
Pressure 15 psia
Composition Mass-Flow
H2O Mass flow value 2000 LB/HR
7 Click to continue.
2 Modeling a Sour Water Stripper 43
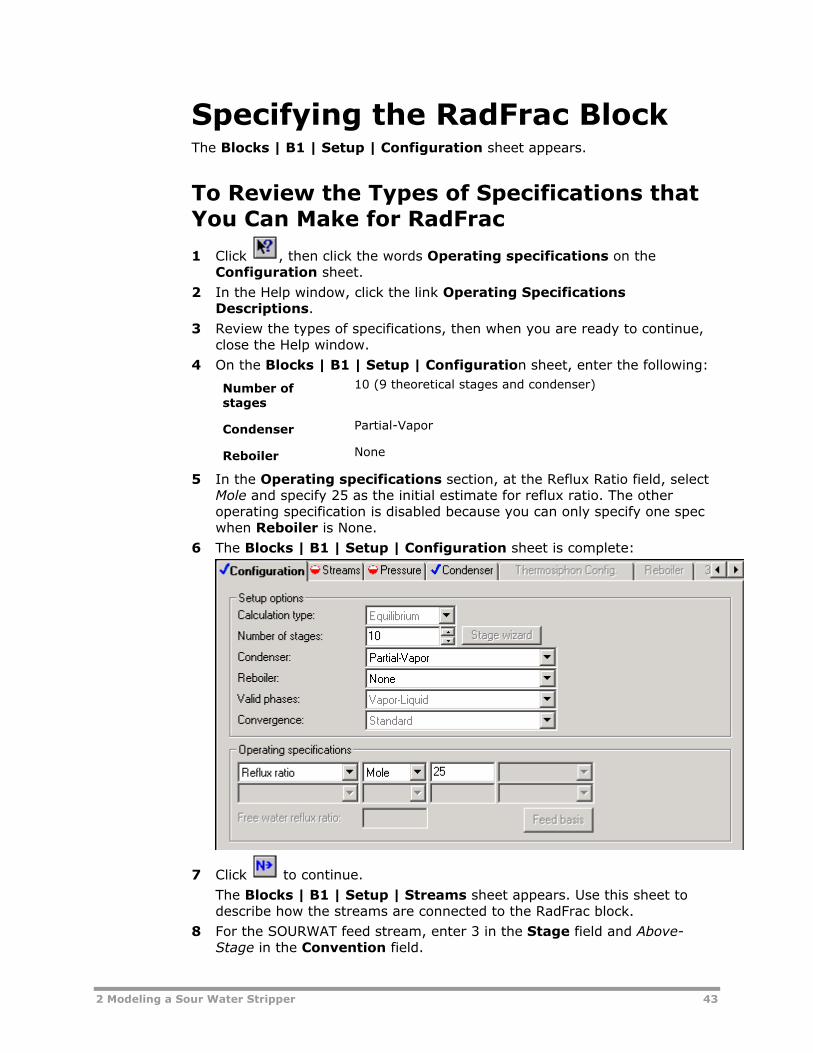
Specifying the RadFrac Block The Blocks | B1 | Setup | Configuration sheet appears.
To Review the Types of Specifications that You Can Make for RadFrac
1 Click , then click the words Operating specifications on the Configuration sheet.
2 In the Help window, click the link Operating Specifications Descriptions.
3 Review the types of specifications, then when you are ready to continue, close the Help window.
4 On the Blocks | B1 | Setup | Configuration sheet, enter the following:
Number of stages
10 (9 theoretical stages and condenser)
Condenser Partial-Vapor
Reboiler None
5 In the Operating specifications section, at the Reflux Ratio field, select Mole and specify 25 as the initial estimate for reflux ratio. The other operating specification is disabled because you can only specify one spec when Reboiler is None.
6 The Blocks | B1 | Setup | Configuration sheet is complete:
7 Click to continue.
The Blocks | B1 | Setup | Streams sheet appears. Use this sheet to describe how the streams are connected to the RadFrac block.
8 For the SOURWAT feed stream, enter 3 in the Stage field and Above-Stage in the Convention field.
44 2 Modeling a Sour Water Stripper
9 For the STEAM feed stream, enter 10 in the Stage field and On-Stage in the Convention field.
Because stream VAPOR is connected to the vapor distillate port, Aspen Plus automatically assigns stream VAPOR as a vapor phase product from stage 1. Similarly, Aspen Plus assigns stream BOTTOMS as a liquid phase product from stage 10. The Streams sheet does not allow flow specifications for distillate product or bottoms product streams.
10 Click to continue.
The Setup | Pressure sheet appears.
To Specify that this Column Operates Isobarically at 15 psia 1 In the Stage 1 / Condenser pressure field, enter 15 psia.
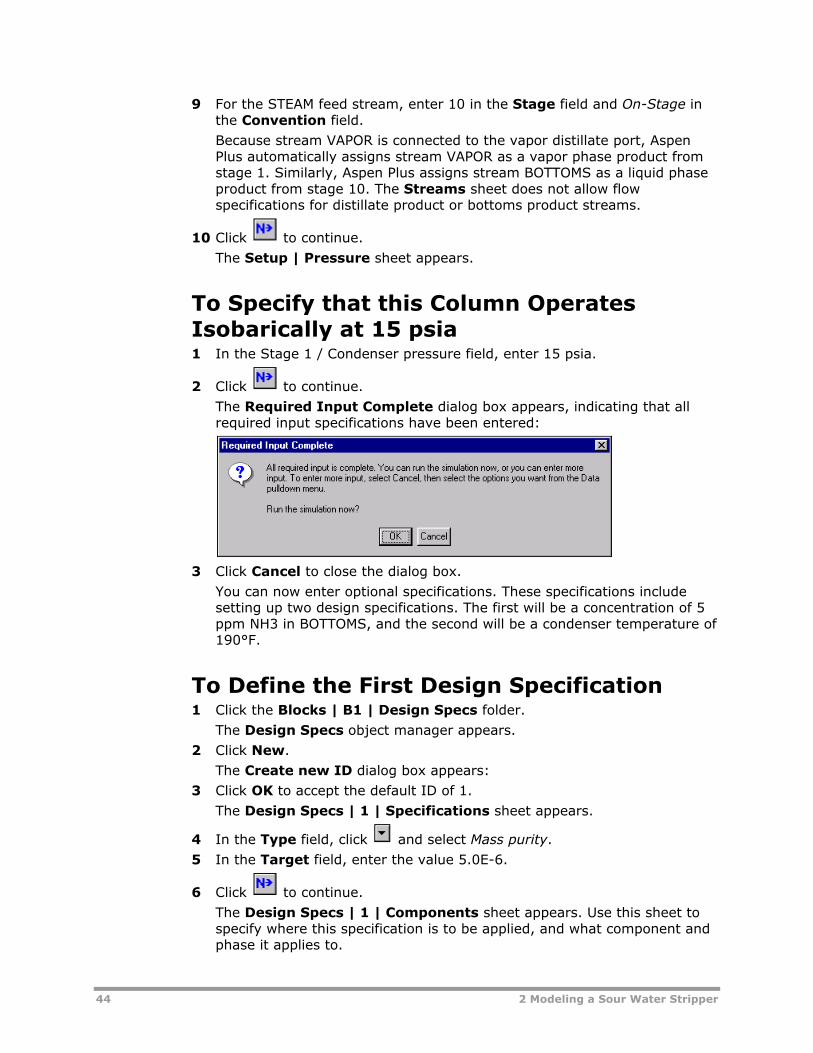
2 Click to continue.
The Required Input Complete dialog box appears, indicating that all required input specifications have been entered:
3 Click Cancel to close the dialog box.
You can now enter optional specifications. These specifications include setting up two design specifications. The first will be a concentration of 5 ppm NH3 in BOTTOMS, and the second will be a condenser temperature of 190°F.
To Define the First Design Specification 1 Click the Blocks | B1 | Design Specs folder.
The Design Specs object manager appears.
2 Click New.
The Create new ID dialog box appears:
3 Click OK to accept the default ID of 1.
The Design Specs | 1 | Specifications sheet appears.
4 In the Type field, click and select Mass purity.
5 In the Target field, enter the value 5.0E-6.
6 Click to continue.
The Design Specs | 1 | Components sheet appears. Use this sheet to specify where this specification is to be applied, and what component and phase it applies to.

2 Modeling a Sour Water Stripper 45
7 In the Components area, from the Available components column,
select NH3 (ammonia) and click .
8 Click to continue.
The Design Specs | 1 | Feed/Product Streams sheet appears.
9 From the Available streams column, select BOTTOMS and click .
The Design Specs | 1 sheet is complete:
To Define Another Design Specification 1 From the Data Browser, select the Design Specs folder.
The Design Specs object manager appears.
2 Click New.
3 In the Create new ID dialog box , click OK to accept the default ID of 2.
A new Design Specs | 2 | Specifications sheet appears.
4 In the Type field, select Stage temperature.
5 In the Target field, enter 190 F.
6 In the Stage field, enter 1.
7 Click to continue.
The Vary Object Manager appears.
Define two manipulated variables to meet the two design specifications. In this simulation keep free the steam feed rate and the reflux ratio specifications provided on the Blocks | B1 | Setup sheet. Aspen Plus adjusts the steam feed rate and reflux ratio to achieve the NH3 bottoms concentration specification and the condenser temperature specification.

46 2 Modeling a Sour Water Stripper
To Define the First Manipulated Variable 1 Click New and then click OK.
The Vary | 1 | Specifications sheet appears.
On this sheet, specify which input variables you want to keep free in order to meet the design specifications you provide.
2 In the Type field, select Feed rate.
3 In the Stream name field, select STEAM.
4 In the Lower bound field, enter 50 lbmol/hr.
5 In the Upper bound field, enter 200 lbmol/hr.
On the Streams | STEAM form you specified a Mass-Flow for stream STEAM. However, when you select the variable type Feed rate on the Vary form, Aspen Plus assumes the Feed rate to be on a mole basis. In this case, varying the Feed rate on a mole basis from 50-200 (lbmol/hr) is equivalent to varying the Mass flow from 900-3600 (lb/hr).
To Define the Second Manipulated Variable 1 From the Data Browser, select the Vary folder.
2 Click New and then click OK.
3 In the Type field, select Reflux ratio.
4 In the Lower bound field, enter 15.
5 In the Upper bound field, enter 50.
As with Feed rate, Aspen Plus always varies the reflux ratio on a mole basis, even if you specify a mass reflux ratio on the Blocks | B1 | Setup form.
6 Click to continue.
The Required Input Complete dialog box appears, indicating that all required specifications are complete.
2 Modeling a Sour Water Stripper 47
7 Click Cancel.
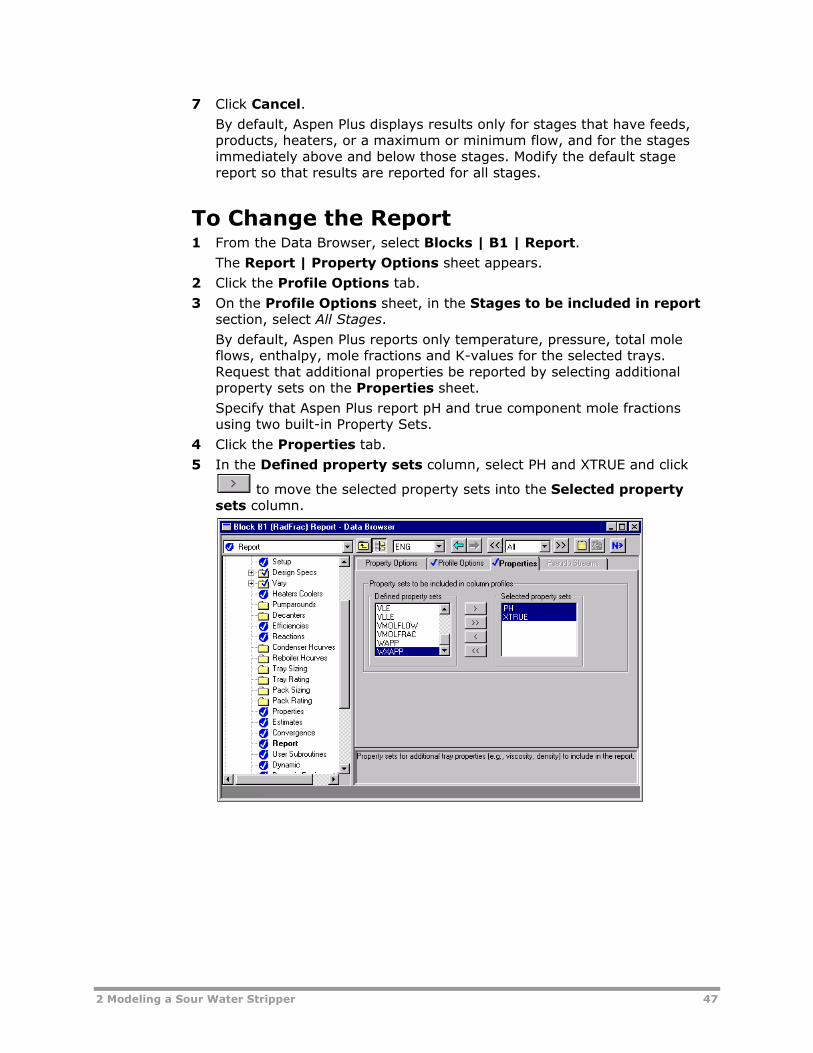
By default, Aspen Plus displays results only for stages that have feeds, products, heaters, or a maximum or minimum flow, and for the stages immediately above and below those stages. Modify the default stage report so that results are reported for all stages.
To Change the Report 1 From the Data Browser, select Blocks | B1 | Report.
The Report | Property Options sheet appears.
2 Click the Profile Options tab.
3 On the Profile Options sheet, in the Stages to be included in report section, select All Stages.
By default, Aspen Plus reports only temperature, pressure, total mole flows, enthalpy, mole fractions and K-values for the selected trays. Request that additional properties be reported by selecting additional property sets on the Properties sheet.
Specify that Aspen Plus report pH and true component mole fractions using two built-in Property Sets.
4 Click the Properties tab.
5 In the Defined property sets column, select PH and XTRUE and click
to move the selected property sets into the Selected property sets column.

48 2 Modeling a Sour Water Stripper
Running the Simulation 1 Click to continue.
The Required Input Complete dialog box appears.
2 Click OK to run the simulation.
The Control Panel appears.
As the run proceeds, messages appear in the Control Panel. It takes a few moments for Aspen Plus to process input specifications and perform the simulation.
As in simulation 1, Aspen Plus displays messages indicating that some properties have been retrieved from a special databank.
When the calculations finish, the message Results Available appears in the status area at the right of the main window toolbar.
3 When the message Results Available appears in the status bar, click to view the results of your run.
Examining Simulation Results Aspen Plus generates many results for this simulation. Examine any results that are of interest to you. This example guides you through a review of some of the simulation results.
To View RadFrac Results 1 In the Aspen Plus menu bar, select Window | Process Flowsheet
Window.
2 On the flowsheet, select the RadFrac block.
3 Click the right mouse button and select Results.
The Blocks | B1 | Results Summary sheet appears. This sheet reports the flows, temperatures, and duties for the top and bottom stage of the column.

2 Modeling a Sour Water Stripper 49
4 Click to move to the next results sheet.
The Balance sheet appears. The block is in mass balance, but is not in enthalpy balance, because heat is being removed from the RadFrac block in the condenser. The enthalpy would have balanced if you had assigned a heat stream to the condenser duty.
A summary of the results of the design specifications is located on the Design Specs | Results sheet. This sheet reports the specified values and the final values for all of the design specifications.
To View Design Spec Results 1 From the Data Browser, select the Blocks | B1 | Design Specs folder.
2 Click the Results tab to view the Design Spec results.
A summary of the results of the manipulated variables is located on the Vary | Results sheet. This sheet reports the specified bounds and the final values for all manipulated variables.
50 2 Modeling a Sour Water Stripper
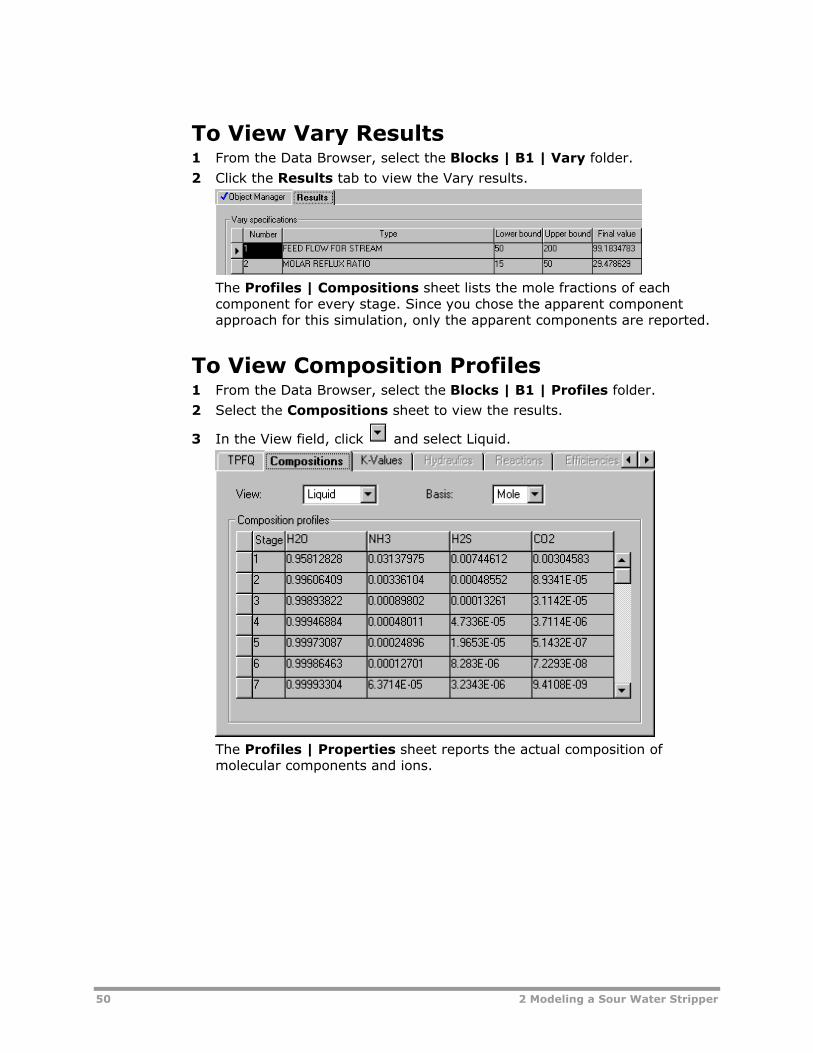
To View Vary Results 1 From the Data Browser, select the Blocks | B1 | Vary folder.
2 Click the Results tab to view the Vary results.
The Profiles | Compositions sheet lists the mole fractions of each component for every stage. Since you chose the apparent component approach for this simulation, only the apparent components are reported.
To View Composition Profiles 1 From the Data Browser, select the Blocks | B1 | Profiles folder.
2 Select the Compositions sheet to view the results.
3 In the View field, click and select Liquid.
The Profiles | Properties sheet reports the actual composition of molecular components and ions.

2 Modeling a Sour Water Stripper 51
To View these Results 1 Select the Properties sheet. You may need to click the arrows at the
right end of the row of tabs to reach it.
Consider the results for Stage 1. The true composition of NH3 and NH4+ sum to 0.03147 on Stage 1. This value is slightly different from the apparent mole fraction of NH3 reported on the Compositions sheet: 0.03138. This slight difference is caused by the solution chemistry.
In general, the total number of moles is not conserved by solution chemistry. In this simulation, the fourth equilibrium reaction consumes 3 moles of reactants and generates two moles of products:
−+ +⇔+ 3322 2 HCOOHOHCO
The total number moles on an apparent component basis will be different from the total number of moles on a true component basis. Thus XNH3 (apparent basis) is not exactly equal to XNH3 (true basis) + XNH4+ (true basis).
The liquid composition of apparent NH3 on stage 1 is:
XNH3 = 0.03138
2 Select the Compositions sheet.
3 In the View field, select Vapor.
The vapor composition of apparent NH3 on stage 1 is:
YNH3 = 0.21116
From these two values, you can calculate a K-value for NH3 on stage 1:
K = YNH3/XNH3 = 6.73

52 2 Modeling a Sour Water Stripper
4 Select the K-Values sheet.
The K-value for NH3 on stage 1 is 6.73. These results demonstrate that when you use apparent components, Aspen Plus also reports the K-values calculated by RadFrac (or any flash) on an apparent basis.
5 Close all open windows.
Converting to True Components Choosing between the true component approach and the apparent component is a matter of personal preference. For all simulations, the simulation results should be equivalent. To demonstrate this, you will convert this simulation from the apparent component approach to the true component approach.
To convert the simulation to the true component approach, you must tell Aspen Plus to use the true component approach, and you must adapt the Design Spec in the RadFrac block (5 ppm mass apparent NH3 in the bottoms).
To Tell Aspen Plus to Use the True Component Approach 1 From the Aspen Plus menu bar, select Data | Properties.
2 On the Properties | Specifications | Global sheet, select the checkbox next to Use true-components.
For the RadFrac block, you entered a desired specification of 5.0 ppm (mass) of apparent NH3 in the bottoms. However, this specification is incorrect for the true component approach, because a significant portion of the apparent NH3 is present as NH4+.
2 Modeling a Sour Water Stripper 53
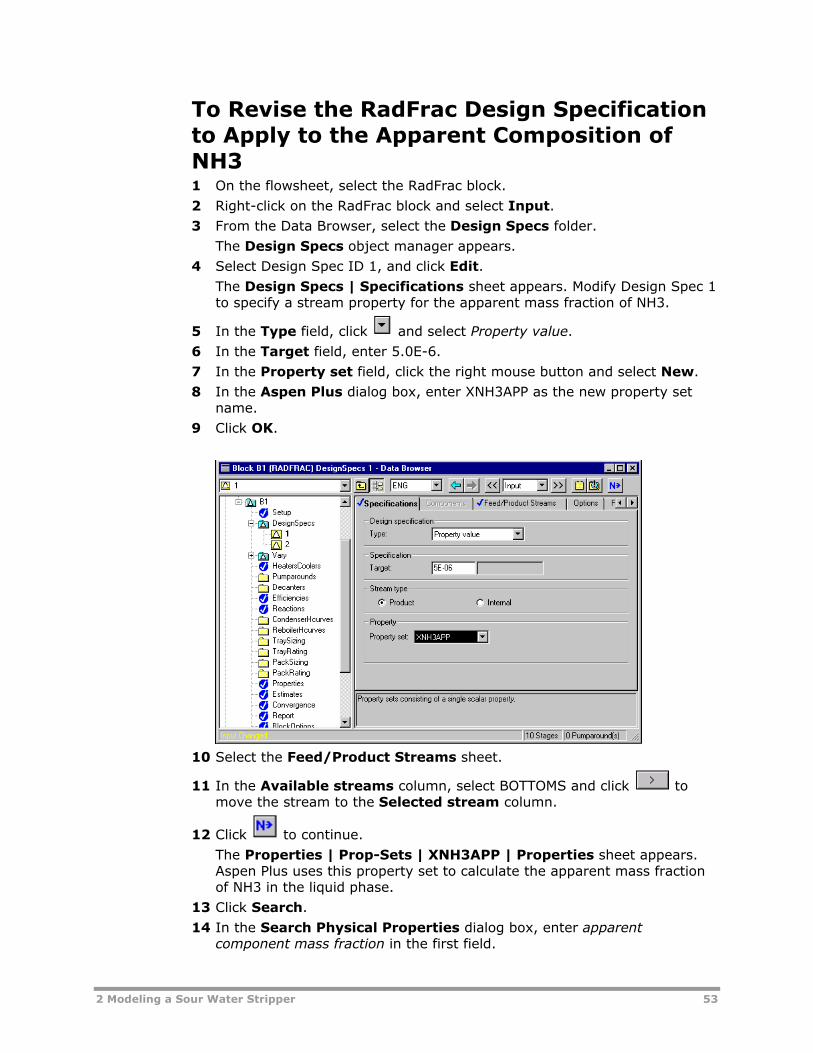
To Revise the RadFrac Design Specification to Apply to the Apparent Composition of NH3 1 On the flowsheet, select the RadFrac block.
2 Right-click on the RadFrac block and select Input. 3 From the Data Browser, select the Design Specs folder.
The Design Specs object manager appears.
4 Select Design Spec ID 1, and click Edit.
The Design Specs | Specifications sheet appears. Modify Design Spec 1 to specify a stream property for the apparent mass fraction of NH3.
5 In the Type field, click and select Property value.
6 In the Target field, enter 5.0E-6.
7 In the Property set field, click the right mouse button and select New.
8 In the Aspen Plus dialog box, enter XNH3APP as the new property set name.
9 Click OK.
10 Select the Feed/Product Streams sheet.
11 In the Available streams column, select BOTTOMS and click to move the stream to the Selected stream column.
12 Click to continue.
The Properties | Prop-Sets | XNH3APP | Properties sheet appears. Aspen Plus uses this property set to calculate the apparent mass fraction of NH3 in the liquid phase.
13 Click Search.
14 In the Search Physical Properties dialog box, enter apparent component mass fraction in the first field.
54 2 Modeling a Sour Water Stripper
15 Click Search.
The system searches for valid physical properties and displays them in the second field of the Search Physical Properties dialog box.
16 Select Apparent component mass fraction (alias WXAPP) from the search results.
17 Click Add.
The system adds the selected physical property and displays it in the third field of the Search Physical Properties dialog box.
18 Click OK.
19 Select the Qualifiers sheet.
20 In the Phase field, click and select Liquid.
21 In the Component field, click and select NH3.
22 Click to continue. The Required Properties Input Complete dialog box appears.
23 Click OK.
Running the True Component Simulation The Required Input Complete dialog box appears informing you that all specifications are complete and the simulation can be run.
1 Click OK.
When the calculations finish, the message Results Available appears in the status area at the right of the Main Window toolbar.
2 Close all open windows, and the Control Panel.
To View Selected Results of the True Component Simulation 1 On the flowsheet, select the RadFrac block.
2 Right-click inside the RadFrac block and select Results.
3 From the Data Browser, select the Profiles folder.
4 Select the Compositions sheet to view the results.
5 In the View field, click and select Liquid.
This sheet reports the liquid phase mole fraction for all components, including the ions. Stage 1 reports the following compositions:
X NH3 = 0.02093
X NH4+ = 0.01054
6 In the View field, click and select Vapor.
2 Modeling a Sour Water Stripper 55
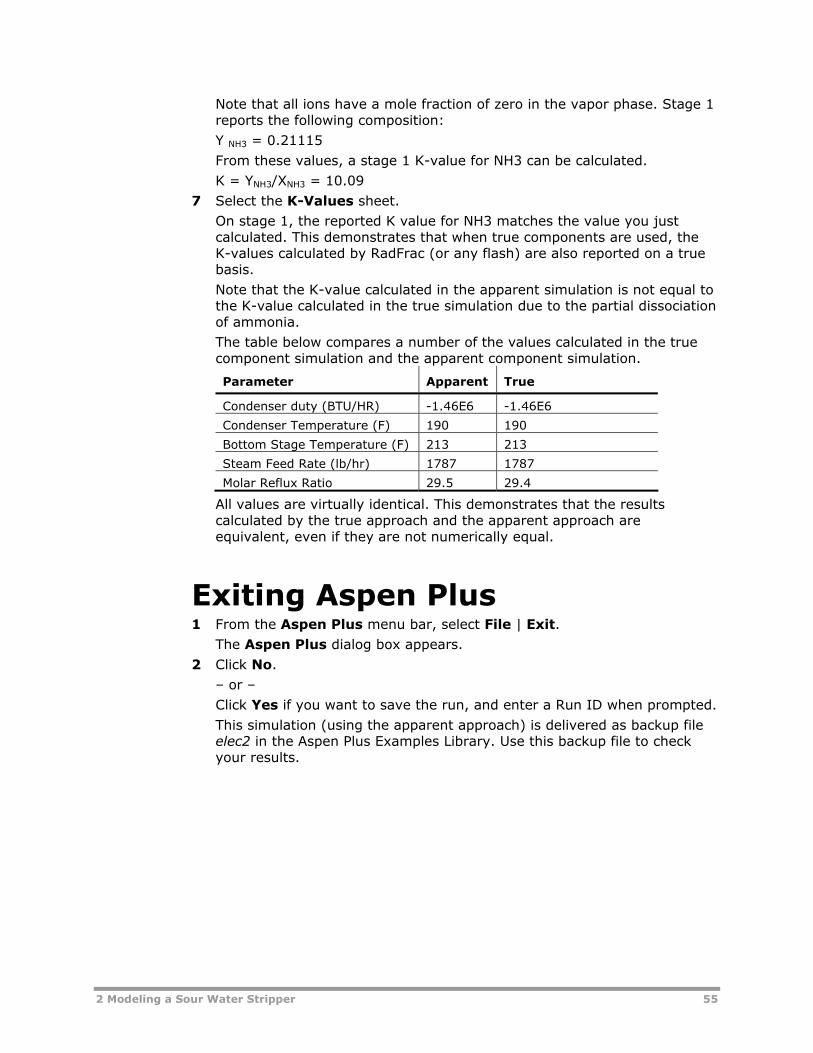
Note that all ions have a mole fraction of zero in the vapor phase. Stage 1 reports the following composition:
Y NH3 = 0.21115
From these values, a stage 1 K-value for NH3 can be calculated.
K = YNH3/XNH3 = 10.09
7 Select the K-Values sheet.
On stage 1, the reported K value for NH3 matches the value you just calculated. This demonstrates that when true components are used, the K-values calculated by RadFrac (or any flash) are also reported on a true basis.
Note that the K-value calculated in the apparent simulation is not equal to the K-value calculated in the true simulation due to the partial dissociation of ammonia.
The table below compares a number of the values calculated in the true component simulation and the apparent component simulation.
Parameter Apparent True
Condenser duty (BTU/HR) -1.46E6 -1.46E6
Condenser Temperature (F) 190 190
Bottom Stage Temperature (F) 213 213
Steam Feed Rate (lb/hr) 1787 1787
Molar Reflux Ratio 29.5 29.4
All values are virtually identical. This demonstrates that the results calculated by the true approach and the apparent approach are equivalent, even if they are not numerically equal.
Exiting Aspen Plus 1 From the Aspen Plus menu bar, select File | Exit.
The Aspen Plus dialog box appears.
2 Click No.
– or –
Click Yes if you want to save the run, and enter a Run ID when prompted.
This simulation (using the apparent approach) is delivered as backup file elec2 in the Aspen Plus Examples Library. Use this backup file to check your results.

56 3 Connecting to the Aspen Plus Simulation Engine
3 Connecting to the Aspen Plus Simulation Engine
If either of the following conditions exist, you will be prompted to specify the host computer for the Aspen Plus simulation engine after you start the Aspen Plus User Interface:
• The simulation engine is not installed on your PC.
• The simulation engine is installed on your PC, but the Activator security device is not connected to your PC.
In these cases, the Connect to Engine dialog box appears.
1 In the Server type field, click and select the type of host computer for the simulation engine.
2 If you choose Local PC as the server for the simulation engine, you do not need to enter any more information into the dialog box. Click OK to continue.
If you choose Windows 2000 or XP server as the server for the simulation engine, enter the following additional information:
3 In the Node name field, enter the node name of the computer on which the Aspen Plus simulation engine will execute.
4 In the other fields, enter the following information:
User name Your user name for the specified host/server.
Password Your password for the above user name.
Working directory
The associated working directory.
5 Click OK.
When the network connection is established, the message Connection Established appears in the message box.
If the Connection Established message does not appear, see your Aspen Plus system administrator for more information on network protocols and host computers for the Aspen Plus simulation engine.


![Aspen Plus Tutorial[1]](https://img.dokumen.tips/doc/110x75/54609dccaf795930708b54af/aspen-plus-tutorial1.jpg)


![Aspen Pumps[1]](https://img.dokumen.tips/doc/110x75/55cf980a550346d033953671/aspen-pumps1.jpg)