Embed Size (px)
Citation preview

!"#!$#%&'
%'
COMO CAMPUS
Information visualization for exploratory interfaces Luigi Spagnolo [email protected]
11 Information and Communication Quality
Why visualization? | 1 !! Highlighting/analysing/learning relationships in
data !! Telling stories with data
!! Informative and persuasive !! Fostering learning !! Goal: provide a simplified and emotional view of a
domain !! Representation accuracy is secondary w.r.t.
communicative impact

!"#!$#%&'
&'
Why visualization? | 2 !! Visual data analysis
!!Mainly informative !!Goal: provide a tool for visual data mining !!High precision is essential
Why visualization? | 2 !! More in general…
!!Understanding the domain and its vocabulary !!The features of information items in it !!How much these features are relevant (within the
specific context of exploration " query) !!How these features are correlated
!"#!$#%&'
"'
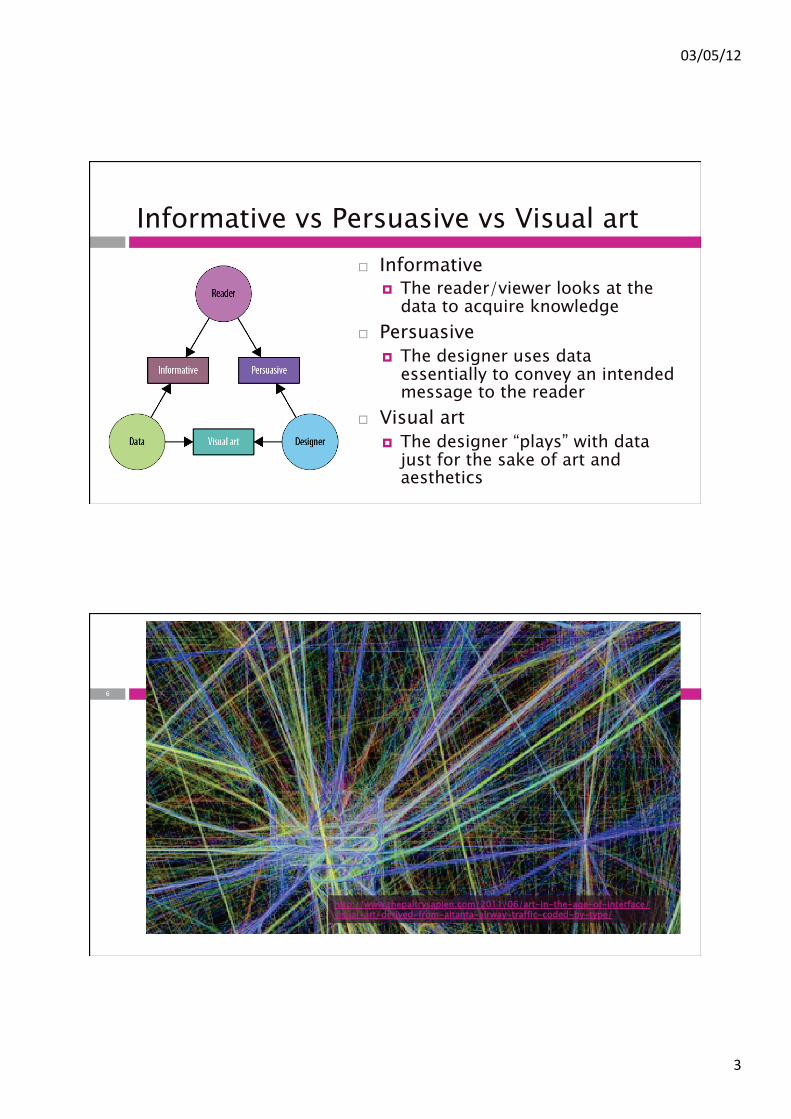
Informative vs Persuasive vs Visual art !! Informative
!! The reader/viewer looks at the data to acquire knowledge
!! Persuasive !! The designer uses data
essentially to convey an intended message to the reader
!! Visual art !! The designer “plays” with data
just for the sake of art and aesthetics
66
hhttttpp::////wwwwww..tthheeppaallttrryyssaappiieenn..ccoomm//22001111//0066//aarrtt--iinn--tthhee--aaggee--ooff--iinntteerrffaaccee//vviissuuaall--aarrtt--ddeerriivveedd--ffrroomm--aallttaannttaa--aaiirrwwaayy--ttrraaffffiicc--ccooddeedd--bbyy--ttyyppee//

!"#!$#%&'
('
Static vs dynamic | 1 !! IInnffooggrraapphhiiccss: static and carefully designed to
convey the intended message(s) and “tell a story with data” !! Often manually drawn (e.g. with software like Adobe
Illustrator) !! AAeesstthheettiiccss is fundamental for eemmoottiioonnaall impact. !! TTaaiilloorreedd to the specific data (and therefore nontrivial
to recreate with different data). !! Relatively data-poor (because each piece of
information must be manually encoded).
88

!"#!$#%&'
$'
Static vs dynamic | 2 !! EExxpplloorraattiioonn: the message(s) emerge from interaction
!! Also in a way that is nnoott pprreeppllaannnneedd bbyy ddeessiiggnneerrss " users discover “which is story the data tell them”
!! DDeessiiggnneedd ttoo bbee aaddaappttiivvee to different datasets (or updates of the same dataset) and different user queries
!! Simpler visualization: must be rreennddeerreedd aatt rruunnttiimmee !! CCoommpplleexxiittyy iiss iinn tthhee iinntteerraaccttiioonn aanndd iinn tthhee aammoouunntt ooff ddaattaa
sshhoowwnn !! HHiigghh rreessppoonnssiivveenneessss is fundamental to support effective
interaction (rich internet applications required)
A brief recall | 1 1100
!! FFaacceett !! A property describing items features
!! FFaacceett vvooccaabbuullaarryy !! Possible values for the property
!! FFaacceett wwiiddggeett !! Feedback: Monitoring the distribution of items w.r.t.
to the terms of a given property !! Selection: Adding (or replacing) terms (or
disjunctions of multiple options or negated concepts) in AND

!"#!$#%&'
)'
A brief recall | 2 1111
!! CCaannvvaass !!Visualization (and analysis) of query results !! Possibly according to one or more dimensions
(facets) at differents levels of granularity
Contents of the lecture 1122
!! Visualizing facets !! For facet widgets !!Univariate (monodimensional) visualizations
!! Visualizing the set of results !! Lists, indexes and alike !!Multivariate (multidimensional) visualizations "
show correlations between features !!Network visualizations " show relationships
between items

!"#!$#%&'
*'
Let’s see an example… 1133
!! Policulture Portal !!http://hoc.elet.polimi.it/PoliculturaPortal/ !!A prototypal interface for exploring 11000011ssttoorriieess
nnaarrrraattiivveess ccrreeaatteedd bbyy ssttuuddeennttss within the PoliCultura contest for Italian schools
!! Several facets: school level, discipline, words extracted from abstracts, etc.
!! See also: !hhttttpp::////wwwwww..mmuusseeuummssaannddtthheewweebb..ccoomm//mmww22001122//ppaappeerrss//ppoolliiccuullttuurraa__ppoorrttaall__1177000000__ssttuuddeennttss__tteellll__tthheeiirr__ss
Visualizing facets 1144

!"#!$#%&'
+'
The elements of visualization | 1 1155
!! A range of possible values for a property " facet vocabulary !! Strings of but also number, dates, complex
concepts, etc. !! Possibly arranged into a hierarchy
!! Possibly sorted according to a natural order
competition : 'Winner'! competition : 'Finalist'! competition : 'Competition'
schoolLevel : 'primary'! schoolLevel : 'junior'! schoolLevel : 'senior'
The elements of visualization | 2 1166
!! A measure of relevance for each term with respect to the context of the current query
!! Possible measures Count: Precision: Recall:
µ :TF !Q " !
t !TF
q !Q
µ t,q( ) = ext t and q( )
µ t,q( ) = ext t and q( )
ext q( ) µ t,q( ) = ext t and q( )
ext t( )

!"#!$#%&'
,'
The elements of visualization | 3 1177
!! A visualization strategy !!Mapping the measure of the term relevance to a
graphical aspect !! E.g. length, width, areas, colors, angles, font
size, etc. !! E.g. for a bar chart:
! t,q( ) = !unit
µ t,q( )µmax,q
where!unit : unit of length (e.g. in pixels)µmax,q : max relevance value for query q
Tag cloud 1188
!! The relevance of a term is represented by the font size
!! PPrrooppoorrttiioonnaall ssccaalliinngg !! The size of a term is directly proportional to its relevance measure
!! LLooggaarriitthhmmiicc ssccaalliinngg !! The size of a tag is proportional to the llooggaarriitthhmm of it relevance
!! Class-based sizing !! The size of a term can assume only some values !! Each possible size corresponds to a range of relevance measure
values !! Each tag takes the size corresponding to the range in which its
relevance measure falls

!"#!$#%&'
%!'
Calculating the size of each tag 1199
!! PPrrooppoorrttiioonnaall ssccaalliinngg !! The size of a tag is directly proportional to its magnitude
!! LLooggaarriitthhmmiicc ssccaalliinngg !! The size of a tag is proportional to the llooggaarriitthhmm of it magnitude
!! Class-based sizing !! The size of a tag can assume only some values !! Each possible size corresponds to a range of tag magnitudes !! Each tag takes the size corresponding to the range in which its
magnitude falls
Proportional scaling 2200
!! The minimum and maximum tag size desired (given as parameter by the designer):
!! Finding the minimum (non-zero) and maximum term relevance:
!! The formula for where
! ti ,q( ) = !min + µ ti ,q( )"µmin( ) #!#µq
µmax,q = maxti!T
µ ti ,q( )( )µmin,q = min
ti!Tµ ti ,q( )( ) with µ ti ,q( ) > 0
!" = "max # "min
!µq = µmax,q #µmin.q
!min,!max
µ ti ,q( ) > 0

!"#!$#%&'
%%'
Logarithmic scaling 2211
!! Exactly the same formula, but with the logarithm (usually with base 10) of the term relevance:
! ti( ) = !min +
!µ ti .q( )" !µmin( )#!#!µ
!" = "max # "min
!$̂ = $̂max # $̂min
!µ ti ,q( ) = logµ ti ,q( )
!µmax,q = maxti!T
!µ ti ,q( )( )!µmin,q = min
ti!T
!µ ti ,q( )( ) with !µ ti ,q( ) > 0
Class-based scaling | 1 2222
!! Again: given calculated
!! The desired number of sizes N (usually between 3 and 20) !! A ordered set of sizes !! And the corresponding ranges !! A mapping based on the same index k
! = ! 0,!1,…,! N{ }! = !0,!1,…,!N{ }
! 0,"0( ), !1,"1( ),…, ! k,!k( ),…{ }
µmax,q = maxti!T
µ ti ,q( )( )µmin,q = min
ti!Tµ ti ,q( )( ) with µ ti ,q( ) > 0
!min,!max

!"#!$#%&'
%&'
Class-based scaling | 2 2233
!! Each range is
!! Lower bound:
!! Higher bound
!k = lk,hk[ ]
lk = µmin,q + k !1( )µmax,q !µmin,q
N
hk = µmin,q + k
µmax,q !µmin,q
N
!! A list of students !! Each student has her own mark between
18-30 !! Studenti = <namei, marki>
!! We want to display the list such that the size of each name depends on how high is the mark
!! We create 3 ranges: !!18-22, 22-26, 26-30
An analogy… 2244
!max !!min = 30 !18 =12
!"#!$#%&'
%"'
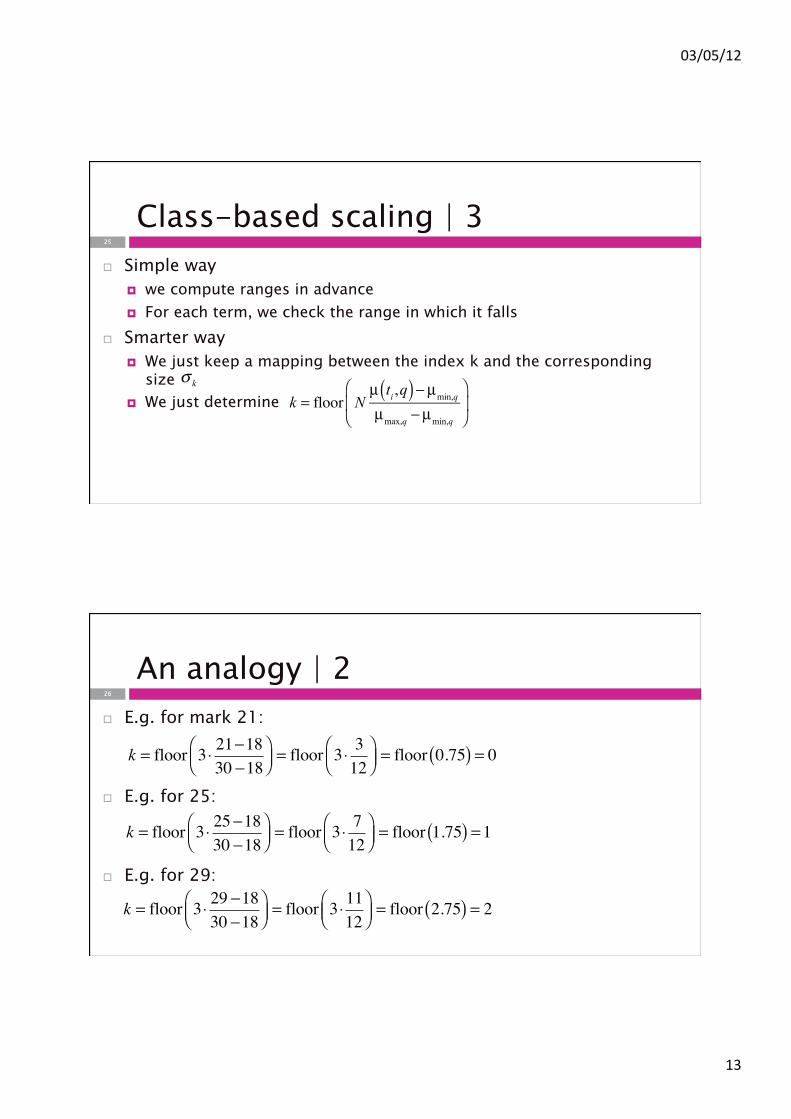
!! Simple way !! we compute ranges in advance !! For each term, we check the range in which it falls
!! Smarter way !! We just keep a mapping between the index k and the corresponding
size !! We just determine
Class-based scaling | 3 2255
! k
k = floor N
µ ti ,q( )!µmin,q
µmax,q !µmin,q
"
#$
%
&'
An analogy | 2 2266
!! E.g. for mark 21:
!! E.g. for 25:
!! E.g. for 29:
k = floor 3! 21"1830 "18
#$%
&'( = floor 3!
312
#$%
&'( = floor 0.75( ) = 0
k = floor 3! 25"1830 "18
#$%
&'( = floor 3!
712
#$%
&'( = floor 1.75( ) =1
k = floor 3! 29 "1830 "18
#$%
&'( = floor 3!
1112
#$%
&'( = floor 2.75( ) = 2

!"#!$#%&'
%('
Which scaling function? | 1 2277
!! PPoowweerr llaaww:: iinn mmaannyy ccaasseess tthhee tteerrmm mmeeaassuurree ((ee..gg.. ccoouunntt)) iiss pprrooppoorrttiioonnaall ttoo aa ppoowweerr ooff tthhee nnuummbbeerr ooff tteerrmmss hhaavviinngg tthhaatt rreelleevvaannccee mmeeaassuurree vvaalluuee !! FFeeww ttaaggss hhaavvee vveerryy hhiigghh ffrreeqquueennccyy !! MMaannyy ttaaggss hhaavvee llooww ffrreeqquueennccyy !! WWiitthh pprrooppoorrttiioonnaall ssccaalliinngg:: ffeeww ttaaggss aarree hhuuggee,,
mmaannyy ttaaggss aarree vveerryy ssmmaallll !! LLooggaarriitthhmmiicc ssccaalliinngg ““aaddjjuussttss”” ppoowweerr llaawwss
ddiissttrriibbuuttiioonnss bbyy ““ttuurrnniinngg”” tthheemm iinnttoo lliinneeaarr…… !! SSmmooootthheerr ddiiffffeerreennccee bbeettwweeeenn ttaaggss
Which scaling function? | 2 2288
!! CCllaassss--bbaasseedd ssiizziinngg:: lliikkee aa sstteepp ((ppiieeccee--wwiissee)) ffuunnccttiioonn
!! PPrrooppoorrttiioonnaall ssccaalliinngg uussiinngg ssiizzeess iinn ppiixxeellss:: !! Since each tag size must be an integer !! Proportional scaling is like class scaling
with !! Class-based sizing can have a
logarithmic scaling too
N = µmax !µmin

!"#!$#%&'
%$'
Tag clouds: pro and cons 2299
!! A tag cloud shows a “simplified” representation of the distribution of terms according to the facet !! Advantage: very immediate to convey basic facts (e.g.
which concepts are more relevant) !! Disadvantage: Cannot analyse in more detail the
quantities into account
Other visualizations | 1 3300
!! Bar charts and histograms !! Length of the bar proportional to the term relevance
measure !! Possibly logarithmic scaling applied !! Allow for a more faithful representation " it is possible to
compare relative length of bars !! Less immediate and “eye candy”

!"#!$#%&'
%)'
Other visualizations | 2 3311
!! Displaying the fraction of a feature with respect to the whole range !! Stacked bars !! Pie chart
!! Lengths are easier to compare than angles !! But pie chart may be more “immediate” and
engaging to convey a message
Pie charts and 3D views 3322
!! The 3D may distort too much the values
!"#!$#%&'
%*'
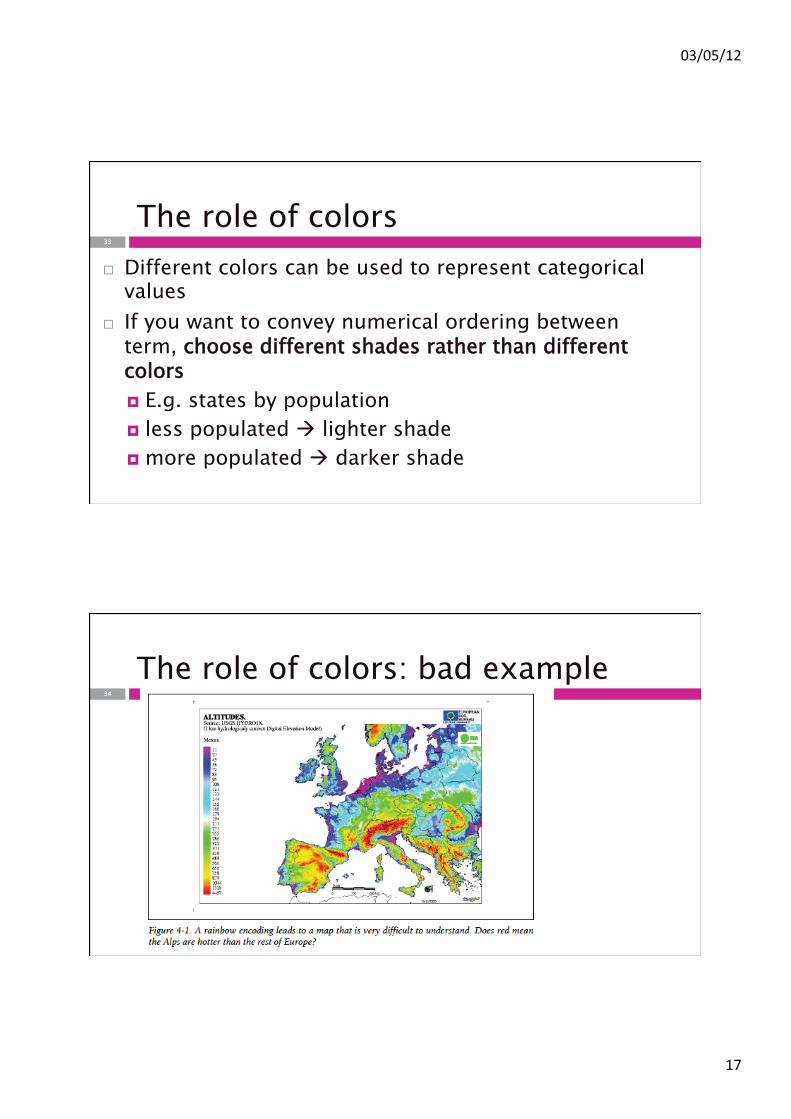
The role of colors 3333
!! Different colors can be used to represent categorical values
!! If you want to convey numerical ordering between term, cchhoooossee ddiiffffeerreenntt sshhaaddeess rraatthheerr tthhaann ddiiffffeerreenntt ccoolloorrss !! E.g. states by population !! less populated " lighter shade !!more populated " darker shade
The role of colors: bad example 3344

!"#!$#%&'
%+'
The role of colors: better solution 3355
Visualizing items 3366

!"#!$#%&'
%,'
Lists, indexes and alike | 1 3377
!! Allow for access to specific items !! Items are represented as a “preview”
!! E.g. thumbnail, snippet, etc. !! Some salient features are chosen by the designer
and/or the user !! Sorting/grouping of items can be allowed
Lists, indexes and alike | 2 3388

!"#!$#%&'
&!'
Lists, indexes and alike | 3 3399
Tubular/grid view
Lists, indexes and alike | 4 4400
Icons rather than text can help at a glance understanding

!"#!$#%&'
&%'
Scatter plot 4411
!! Classical statistical diagram !! Shows correlations between
a feature on the x axis and a feature on the y axis
!! For quantitative data !! Good impact only for
“expert” user
Aggregate views | 1 4422
!! Focus on features shared by items and their correlation !!Access to specific item is secondary
!! Items are grouped and aggregated according to two or more dimensions (at a certain level of granularity) !!Aggregation measures: count, average, min,
max, etc.

!"#!$#%&'
&&'
Aggregate views: matrix chart | 1 4433
!! Two facets: one for rows and one for columns !! Each datapoint (pair of terms) is represented
as a circle (or other shape), where…
!!The size of the shape represents the number of items “belonging” to the data point:
tx ,ty( )!TX "TY
TX : Facet vocabulary for rowsTY : Facet vocabulary for columns
µ tx ,ty ,q( ) = ext q and tx and ty( )
Aggregate views: matrix chart 4444

!"#!$#%&'
&"'
Aggregate views: matrix + pie chart 4455
Aggregate views: mosaic plot | 1 4466
!! A “mix” between stacked bars/columns and matrix plot
!! Width and height of rectangles represent two different features !!The area of the rectangle shows how many items
“belong” to the data point !!More than two dimensions are possible with
additional splits (but becomes less clear)

!"#!$#%&'
&('
Aggregate views: mosaic plot | 2 4477
!! Songs by: !!Theme
(rows) !!Decade
(columns)
Aggregate views: mosaic plot | 3 4488
!! Passengers by: !! Gender (1st
horizontal split) !! Survived vs. deceas
(2nd horiz. Split + color)
!! Travel class (1st vertical split)
!! Age (2nd vertical split)
!! What you can learn from that?

!"#!$#%&'
&$'
Aggregate views: mosaic plot | 4 4499
!! All male crew members died!
!! Richest (1st class) women and children survived
!! Poorest (2nd class) deceased mostly
Pixel grid plot 5500
!! Between a list/index and a mosaic plot…
!! Each “pixel” or tassel represent an item
!! One dimension is represented by color !! A second dimension may be
represented by the tassel shape !! Aggregation is “at a glance”

!"#!$#%&'
&)'
Network graphs | 1 5511
!! Show relations between items as a graph where: !!Nodes are items !! Edges are shared features
!! The edge can be “weighted” depending on how much a pair item have in common !! Weights may be represented by length thickness
and/or by spatial distance
Network graphs | 2 5522
!! Nicoletta Di Blas co-authors on Microsoft Academic Search !! http://
academic.research.microsoft.com/VisualExplorer#686102

!"#!$#%&'
&*'
Visualizing geography 5533
Geographical information 5544
!! TThheemmaattiicc mmaappss visually represent oonnee oorr mmoorree ffeeaattuurreess on a ggeeooggrraapphhiiccaall aarreeaa
!! Digital, iinntteerraaccttiivvee tthheemmaattiicc mmaappss !! Users can zoom and/or adjust visualization in some way !! Users can filter items
!! More features at once: mmuullttiivvaarriiaattee tthheemmaattiicc mmaapp !! Different signs (shapes, colors, icons) can be used for
showing more characteristics on the same map !! Avoid mixing shapes, colors and icons together: the result
may be very messy!

!"#!$#%&'
&+'
Dot map 5555
!! Simplest thematic map !! One placemark = one item at its
exact location (like in Google Maps), or
!! One sign = k items in that area !! Different signs (shapes, colors,
icons) can be used for showing more characteristics on the same map
!! May be messy if many items are concentrated in a small area !! Expecially at low levels of zoom !! Expecially multivariate dot maps
Dot map: nice interactive example 5566
!! http://www.lemonde.fr/election-presidentielle-2012/visuel/2012/04/23/rapports-de-force-entre-les-candidats_1688324_1471069.html

!"#!$#%&'
&,'
Graduated symbol map | 1 5577
!! Also called PPrrooppoorrttiioonnaall ssyymmbbooll mmaapp !! The map is divided into areas
#! (e.g. administrative areas) !! One sign for each area (single
feature) !! One sign for each of N features in
each area (multivariate) !! The ssiizzee ooff tthhee ssiiggnn changes
according to the nnuummbbeerr ooff iitteemmss with feature X on area Y
!! Proportial, linear, class scalings !! Multivariate version tends to be messy
if you display too much values at one
Graduated symbol map | 2 5588
!! Advantages !! Statistical distribution on a certain area clearly showed !! (With respect to dot map) overlapping of signs avoided
!! Disadvantages !! Multivariate version tends to be messy if you display
too much values at once (e.g. facets with many distinct values)
!! The scaling should be carefully chosen to avoid too huge or too small signs

!"#!$#%&'
"!'
Pie chart map | 1 5599
!! Similar to multivariate graduate symbol map !! The map is divided into areas
#! (e.g. administrative areas) !! One circle (pie) for each area !! Each part is cut into slices !! The ssiizzee ooff tthhee sslliiccee is
proportional to the nnuummbbeerr ooff iitteemmss with feature X on area Y
Pie chart map | 2
Information and Communication Quality | Multifaceted Classification and
6600
!! With respect to multivariate graduate symbol map…
!! Advantages !! Less messy when you have to show a lot features at
once !! Disadvntages
!! Features with low frequency are less visible !! Analogously we could have histogram chart maps

!"#!$#%&'
"%'
Choropleth map | 1
Information and Communication Quality | Multifaceted Classification and
6611
!! Using colors, shades or patterns !! The map is still divided into
areas !! Each area is colored/patterned/
shaded according to the feature to show
!! HHiigghh ccoommmmuunniiccaattiivvee ssttrreenngghh, but…
Choropleth map | 2 6622
!! A single area may be colored/shaded/patterned according on mmuuttuuaallllyy eessccuussiivvee vvaalluueess !! E.g. Regions that are
governed by left vs. right parties
!! SSiinnggllee--vvaalluueedd ffaacceettss oonnllyy

!"#!$#%&'
"&'
Choropleth map | 3 6633
!! The gradient of shade/color may be proportial to the frequency of a ssiinnggllee ffeeaattuurree !! E.g. number of earthquakes,
population !! To show more features at
ones you should overlap colors or patterns: too messy
!! You need a mmaapp ffoorr eeaacchh ffaacceett vvaalluuee
Visualizing time 6644

!"#!$#%&'
""'
Timeline 6655
!! Shows discribution of items in time !! Duration can be represented by a bar length !! Callout for item preview !! Two or more “resolutions” (unit of time) " detail vs. overall view
Stacked area chart 6666
!! Shows evolution of multiple (numeric) features over time !! Each feature is represented by
the colored area !! Features are stacked !! The summation of features
represents the whole

!"#!$#%&'
"('
Streamgraph 6677
!! Evolution of trends (themes of discussion) over time: !! stacked area + tag cloud
Designing exploratory applications !! Elicit requirements !! Decide relevant features !! Design effective visualization

!"#!$#%&'
"$'
Designing explorations 6699
Requirements: users and stakeholders !! Identify users and their goals
!! Expert vs novice !!Ontologies used !!Overall understanding vs detailed analysis
!! Identify stakeholders goals towards users !! Identify related scenarios of usage

!"#!$#%&'
")'
Requirements: data and application !! Constraints on the type and quantity of information the
designer can rely on !! Number of items and features to handlw !! Already existing sources (e.g. for information mash-ups) !! Efforts required for editing and classification
#! E.g. classifiying ancient artifacts is quite difficult because experts disagree!
!! Technical and application constraints !! Data formats and kind of devices !! Software architecture, responsiveness, latency (for web
applications) !! Time-to-market
Indentifying relevant features !! With respect to each kind of user, identify
!! The information items they are interested in !! The relevant properties the user may be actually interested
in !! If necessary, map existing data description to the required
facets #! E.g. if you already have “birth-date” and you need “age”, you have
to compute it #! E.g. convert currencies, unit of measures, etc.
!! Also possibly map different classifications for different users
!"#!$#%&'
"*'
Design visualization !! Evaluate each facet and consider
!! Showing relative vs absolute relevance of terms !! Precise representation vs “at a glance” understanding
and “emotive” impact !! Depending on: user interests, number and type of
terms to display, distribution of properties !! Do the same for canvases !! Building a fast prototype with a sample of realistic
data may be very helpful !! Help understanding how data “actually looks like”
COMO CAMPUS
Project B:!design and prototyping of an exploratory interface Luigi Spagnolo [email protected]
7744 Information and Communication Quality

!"#!$#%&'
"+'
The project 7755
!! Choose a topic of your interest !! Find information, create and organize a
collection of information items !! Design the application:
!!The features (facets) used for the exploration !!The visualization of results
!! Delivery material: report + prototype
Topics 7766
!! Suggested domains/information items !! AArrttss,, cciinneemmaa,, lliitteerraattuurree,, mmuussiicc " artworks, novels,
movies, artists involved in the field… !! CCuullttuurraall hheerriittaaggee " e.g. monuments, cities of
interest, museums, etc. !! SScciieennccee aanndd tteecchhnnoollooggyy " discoveries, inventions,
famous scientists, animals, plants, etc. !! Something connected with your study interests (e.g.
thesis " must be discussed) !! Every topic must be agreed with us

!"#!$#%&'
",'
The work | 1 7777
!! Create a collection of 80 (or more) information items !! For each one, write down an abstract of
approximately 100 words !! Classify the items according to at least 5 relevant
facets !! Design a proper visualization for the facets and the
results (at least 2 different canvases) !! “Special” works can be discussed (e.g.
implementing a different kind of visualization)
The work | 2 7788
!! Implement a prototype: !!A Simile Exhibit/Solr application or similar tools !!A sequence of realistic mock-ups showing
features !! Write a report:
!!5-10 pages !!Describe the application, and a scenario of usage

!"#!$#%&'
(!'
The project 7799
!! Choose a topic of your interest !! Find information, create and organize a collection
of information items !! Design the application:
!! The features (facets) used for the exploration !! The visualization of results
!! Delivery material: report + prototype (one week before the exam)
So now what? 8800
!! Start deciding the groups (max two people) !! Communicate us:
!! The team members !! The choice between PPrroojjeecctt AA (1001stories narrative) vs. PPrroojjeecctt BB (exploratory
app) !! The topic of your work (to be approved in both cases)
!! Each group should open a thread on the BEEP website forum (category “PROJECT GROUPS”) !! Write the title of the post as follows: [[PPrroojjeecctt XX]] SSuurrnnaammee0011 -- SSuurrnnaammee0022 where X = A or B, e.g. [[PPrroojjeecctt AA]] DDii BBllaass –– SSppaaggnnoolloo!![[PPrroojjeecctt BB]] SSmmiitthh –– RRoossssii !! All further communications and delivery will be on that thread