Embed Size (px)
Citation preview


Presentation by:Saima Zia
Zunaira Qayyum


Published by:Muhammad RafiqInstitute of Management Sciences
Peshawar, Pakistan

There is a trade-off between money
and fatality risks (accidental death)
which economists term it as Value of
Statistical Life (VSL).
Introduction:
What is Value of Statistical Life
(VSL) ?

There are three approaches to
measure Value of Statistical Life:
1.Compensating wage differentials:
Worker must be paid to take riskier jobs.
2. 2nd approach examines other behaviors
where people weigh costs against risks.

3. Contingent valuation:
Respondents report their willingness to
pay (WTP) to get a specified reduction
in mortality risks.

• No such data of WTP was available in
Pakistan, so , estimates were made which
were lower than regional and
international studies.
• These estimates were made in
comparison of other countries on the
basis of cost of illness and human capital
approach

• VSL is observed in context of
compensating wage differentials among
blue collar male workers in the
manufacturing sector if Lahore.
• Estimates are based on wage risk tradeoff
on industry level and perceived measures
of risk.

Existing
theories on
value of
statistical life:

There are many factors involved in choosing a job
by a worker which are:
money,
working hours,
pension etc.
But job safety is one of the most important factor.

Compensating wage differential
theory:
• Valued compensation in the riskier
job to accept it.
• Or wage should higher than the
other jobs.

Wage compensation approach:
It was first proposed by Adam
Smith which was later on known as
Hedonic (quality adjusted) wage
model.
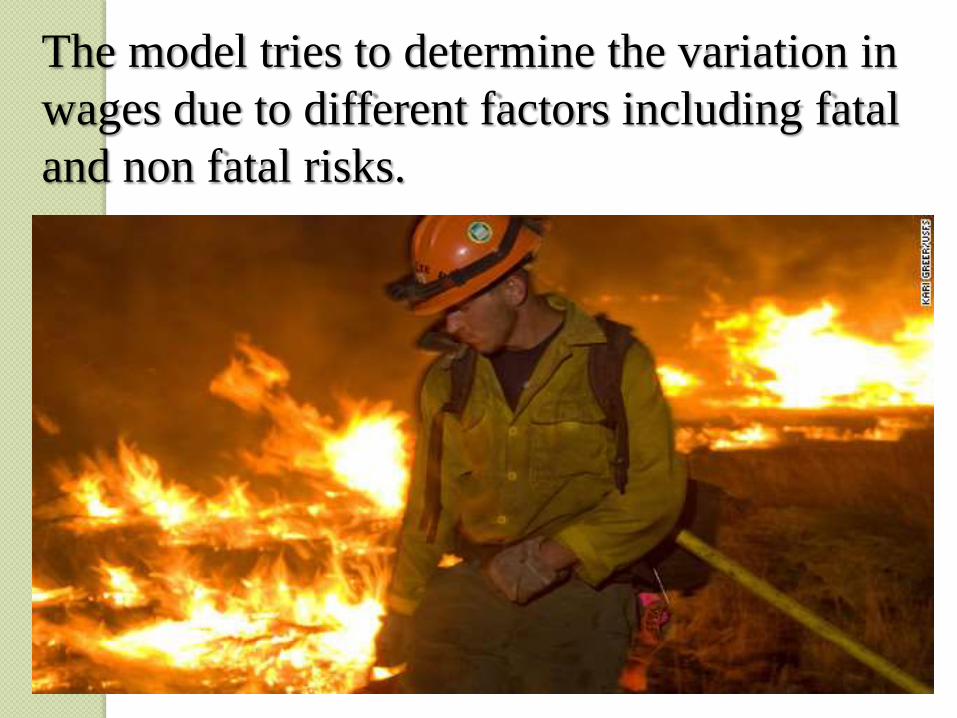
The model tries to determine the variation in
wages due to different factors including fatal
and non fatal risks.

Hedonic wage
differentials:
Firms pay less at increasing costs
of safety, where as workers prefer
a higher paying job.
Firms face an elastic labor supply
curve with respect to wages.

Hedonic (quality adjusted) wage
model compares risk and wage
among blue collar workers

Why Lahore
was chosen for
the study?

Because:
• It is the biggest city in
Punjab.
•Financial center of
Pakistan.
•Second largest industrial
city.

It includes areas such as:
• Kot Lakpat
• Quaid-e-Azam industrial estate
and
• New Sundar industrial estate
among others. Plus it consists of
industries of all sizes
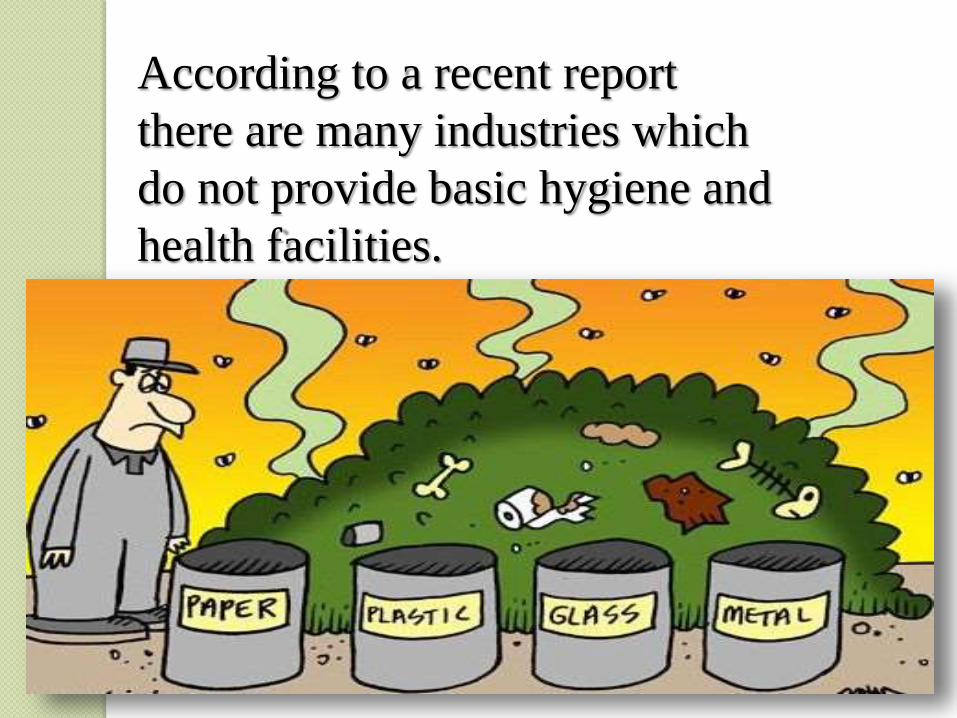
According to a recent report
there are many industries which
do not provide basic hygiene and
health facilities.

The industries lack in basic needs of:
• Exhaust filters
• Fire extinguishers
• Health facilities ( first aid box as primary need)
• Emergency transport
• Waste disposal mechanism.
Most of the companies do not have warning signs
which results in industrial accidents.

Sampling the data
collection method

Why blue collar workers were chosen?
Because according to the labor force
survey (2006) the highest number of fatal
and nonfatal accidents has been reported by
this sector, which has industrial and
mechanical workers who are mostly male.
Variables to be measured:
As jobs vary from hourly,
weekly and monthly among
labors, a standard of 2000 annual
hours are set in order to obtain
VSL and Value of Statistical
Injury.
Fatality and
injury
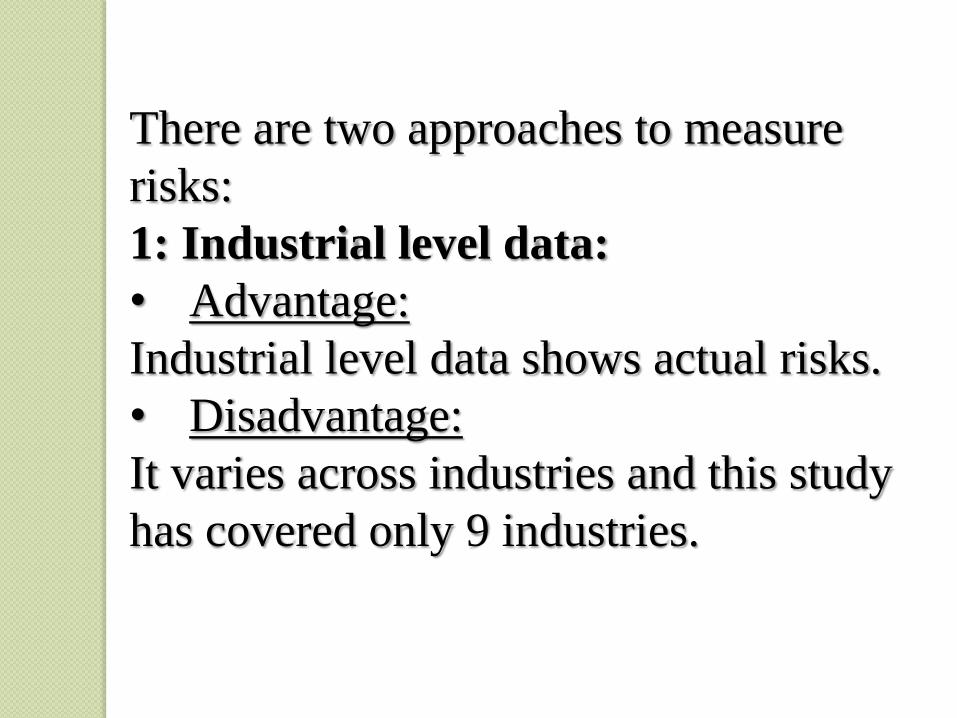
There are two approaches to measure
risks:
1: Industrial level data:
• Advantage:
Industrial level data shows actual risks.
• Disadvantage:
It varies across industries and this study
has covered only 9 industries.

2: Worker level data:
• Advantage:
Varies across workers, factories and
industries. Risk impact in wage is
measured.
• Disadvantage:
Not a measure of actual risks and
measurement errors may occur.

Actual Risk Variables at the
Industry Level:
With regard to actual injury rate at the industry level, we compiled several variables.
We first calculated the actual risk of injury from the PESSI data.
Secondly, we attempted the injury rate of manufacturing workers in Pakistan or in Punjab computed from the Labor Force Survey (LFS, 2006).

We found that these variables also contain huge
measurement errors.
For these reasons, we do not include the actual injury
rate at the industry level in our regression analysis.

Perceived Risk Variables at the
Worker Level:
The study has therefore utilized four risk measures to
assess the Value of Statistical Life and Injury:
PESFAT, PRFNJ, PRFT1 and PRFT2. PESFAT,
PRFT1 and PRFT2 are on fatality risk while PRFNJ is
on injury risk.
16 PESFAT is actual risk measured at the industry
level while PRFT1, PRFT2 and PRFNJ are perceived
risk measured at the worker level.

Results and Discussion:
The average hourly wage rate in log form is 3.705 (anti-
log= PKR 4220).
The average education is six years of schooling and the
average age is 27 years.
The average experience in the present occupation is 5
years.

The professed fatality and non-fatality statistics
measured on the Likert scale reflect the mean risks
as perceived by workers which can be classed as a
below average level of risk (mean risk= 3).
The perceived risk of fatality (PRFT1) has a
positive coefficient
And is statistically significant at the 1% level while
the perceived risk of injury (PRFNJ) has a positive
But insignificant coefficient indicating that a higher
fatality risk is associated with higher wages,
Which is identified in a much cleaner way than in the
case of the industry level analysis.
This is because our identification strategy clearly
controls for all industry level factors and still finds that
wages are higher when the perceived risk is higher.

The coefficients of the human capital variables are not
sensitive to the choice of the other explanatory variables
in the model.
Both age and education show positive and significant
relationships with the hourly wage in all the estimated
regression models.
However, the result of the work experience is
insignificant in all the estimated regression models.
The results of the professional dummy variables are also
robust and show little sign of variations.
The outcome of these two variables shows that a
foreman on average earns 38 percent to 40 percent
whereas supervisors earn 38 percent to 43 percent more
than those in all other professional categories.

Conclusions and Policy
Implications:
The point estimates of the Value of Statistical Life in
Pakistan based on the Hedonic Wage Models range.
The study could not provide the Value of Statistical
Injury because the perceived injury variable used in this
study was statistically insignificant.

The variations in the results are due to the use of different
risk measures, that is, actual and perceived risk measures
in alternative regression models.
Therefore, the study concludes that a compensating wage
differential does exist in the formal private sector and the
market does compensate workers for taking risks.