Embed Size (px)
Citation preview

Same Ecosystem, Different EntrepreneursMEASURING THE VITALITY OF A DIVERSE ENTREPRENEURIAL ECOSYSTEM
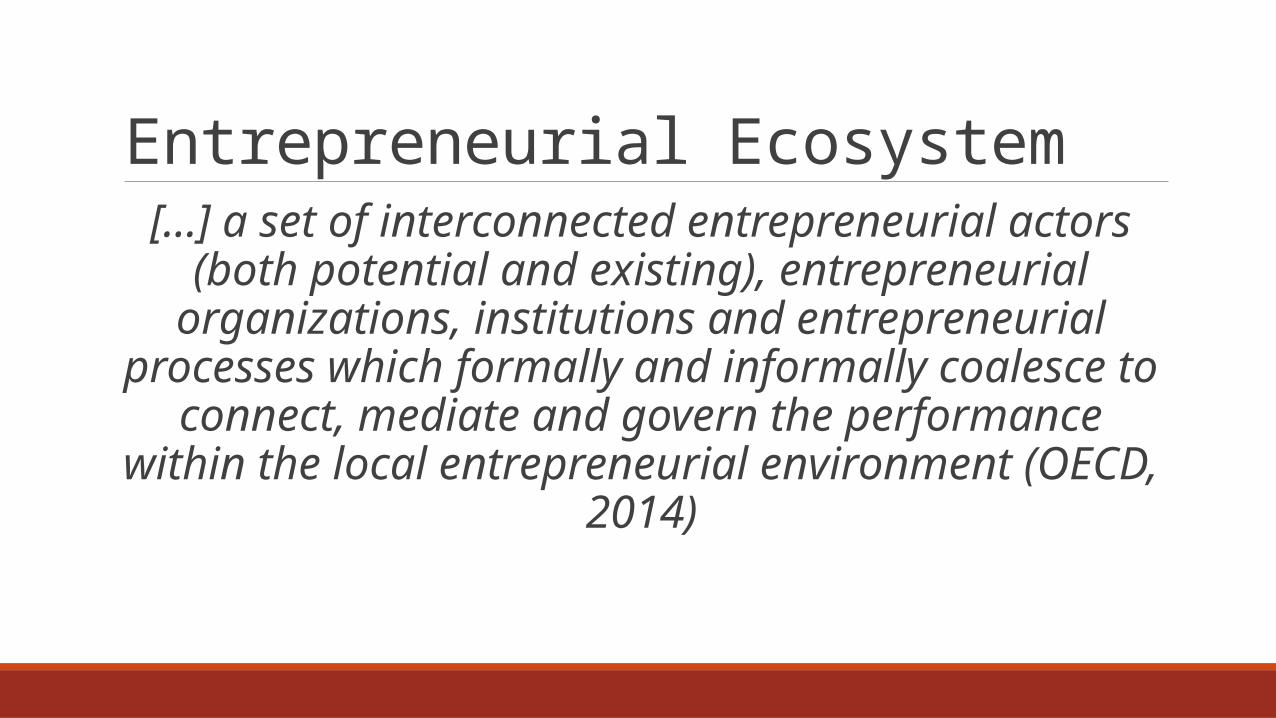
Entrepreneurial Ecosystem[...] a set of interconnected entrepreneurial actors
(both potential and existing), entrepreneurial organizations, institutions and entrepreneurial
processes which formally and informally coalesce to connect, mediate and govern the performance within the local entrepreneurial environment (OECD, 2014)

Research Questions1. What are the requirements of differing types of entrepreneurs within an ecosystem?
2. What are the dynamics of ecosystems with a mix of both urban and rural features?
3. How can we identify useful and practical metrics to assess how well ecosystems function to support different types of entrepreneurs?

Small and Medium Enterprises (SME)
Innovation Driven Enterprises (IDE)
Focus on local and regional markets Focus on global markets
Innovation is unnecessary to the business and its growth
Innovation-driven technology, process or business model is essential to business
Employees are local or regional Employees can be anywhere
Most often family businesses or businesses with little external capital More diverse ownership base
Typically linear growth. Responds quickly to increased cash flow.
Business initially loses money but then can grow exponentially if successful. Requires investment. Slower response to increased cash flow.
Source: Aulet, B. and F. Murray (2013), A Tale of Two Entrepreneurs: Understanding Differences in the Types of Entrepreneurship in the Economy, Ewing Marion Kauffman Foundation.

Study Area: New River and Roanoke Valley MSAs

Methods Interviews and Focus Groups with Entrepreneurs (17 respondents) and Intermediaries (27 respondents)
Entrepreneur Surveys (146 respondents; 84 complete entrepreneur responses)
Review of Secondary Metrics Data

Results
Sole Pro-prietor;
33%
1-4 Employees; 32%
5-15 Em-ployees; 21%
16-100 Em-
ployees; 8%
101+ Employees; 7%
Started and own business
Manage a business started by an entrepreneur in region
Starting a new business not yet underway
Own a student-launched business
Had a business in the past, but am now a mentor
Own a franchise
0 10 20 30 40 50 60
Which of the statements below best describes your business?

Results
Other Services
Manufacturing
Real Estate
Biology and Biotech
Outdoors Related
Support Services and Consulting
Retail and Artisan
IT-Related
0 5 10 15 20 25
10
5
8
12
13
4
2
6
9
14
SMEIDE
(51)
(31)

ResultsSTRENGTHS
“The region is hungry for anything. We’ve gotten a lot of attention and praise.”
Informal Networking
Quality of Life
Growing Entrepreneurial Resources
Skilled Workforce
Higher Education Institutions

ResultsREGIONAL COLLABORATION
“Why would we go to Blacksburg? (or Roanoke?)”
While “spaces of collision” exist, translating these interactions into coordinated resources for emerging entrepreneurs, especially in “hard science spinoffs”, was identified as a challenge.

ResultsSMEs and IDEs
"Quality of life is a plus, but without capital, I can't attract well-qualified, experienced mid-level and senior executives from other areas.“ (IDEs)
“Entrepreneurs go to the municipal building and are sent around everywhere like yoyos.” (SMEs)
“There is a love affair with bricks and mortar investments and not enough support for programming and to support risk-taking.” (both)

ResultsLEVERAGING SUCCESS
“Much rah-rah, very few successes - i.e. companies created that can supply living wages for their founders and create and fund new jobs for new employees.”
“Let’s cultivate a community of ‘cashed out’ serial entrepreneurs.”

ResultsROLE OF HIGHER EDUCATION
“We shouldn’t try to be the Stanford of the East Coast.”

MetricsDENSITY – Relative density of entrepreneurship
FLUIDITY – The accessibility and easy flow of resources in an ecosystem.
CONNECTIVITY – Connections among elements of the ecosystem – its programs, companies and individuals.
DIVERSITY – An assortment of economic specializations, people and opportunities.

MetricsINNOVATION-DRIVEN ENTERPRISES (IDE)
SMALL AND MEDIUM ENTERPRISES (SME)
Density Fluidity Connectivity Diversity
1. Input2. Direct Outcome3. Indirect Outcome
1. Input2. Direct Outcome3. Indirect Outcome
Density Fluidity Connectivity Diversity

MetricsDENSITY
• Workforce Education Levels (%)
• Broadband Density (High Speed Connections per 1,000 households)
• Incubator, Accelerator and Coworking Spaces per Capita
• Number of Business Owners as % of Adult Population
• # New Firms per 1000 people
• Scale-Up Density (# of Scale-Ups for past 5yrs by total # of firms)
• Gross Regional Product
• Unemployment Rate
• Per Capita Income Growth (esp. for low income households)
• Poverty Rate
• Job Growth to Population Growth Ratio
INPUTS OUTPUTS OUTCOMES

MetricsFLUIDITY
• STEM Degrees Issued (Associates and Bachelors)
• University Licensing
• Change in Angel, Venture Capital and other private investments
• $ provided in tax incentive programs
• R&D or High Tech Employment
• # of University Start-Ups
• Business Churn (births and deaths)
• # Inc 5000 Companies (High Growth Firms)
• Gross Regional Product
• Unemployment Rate
• Per Capita Income Growth (esp. for low income households)
• Poverty Rate
• Job Growth to Population Growth Ratio
INPUTS OUTPUTS OUTCOMES
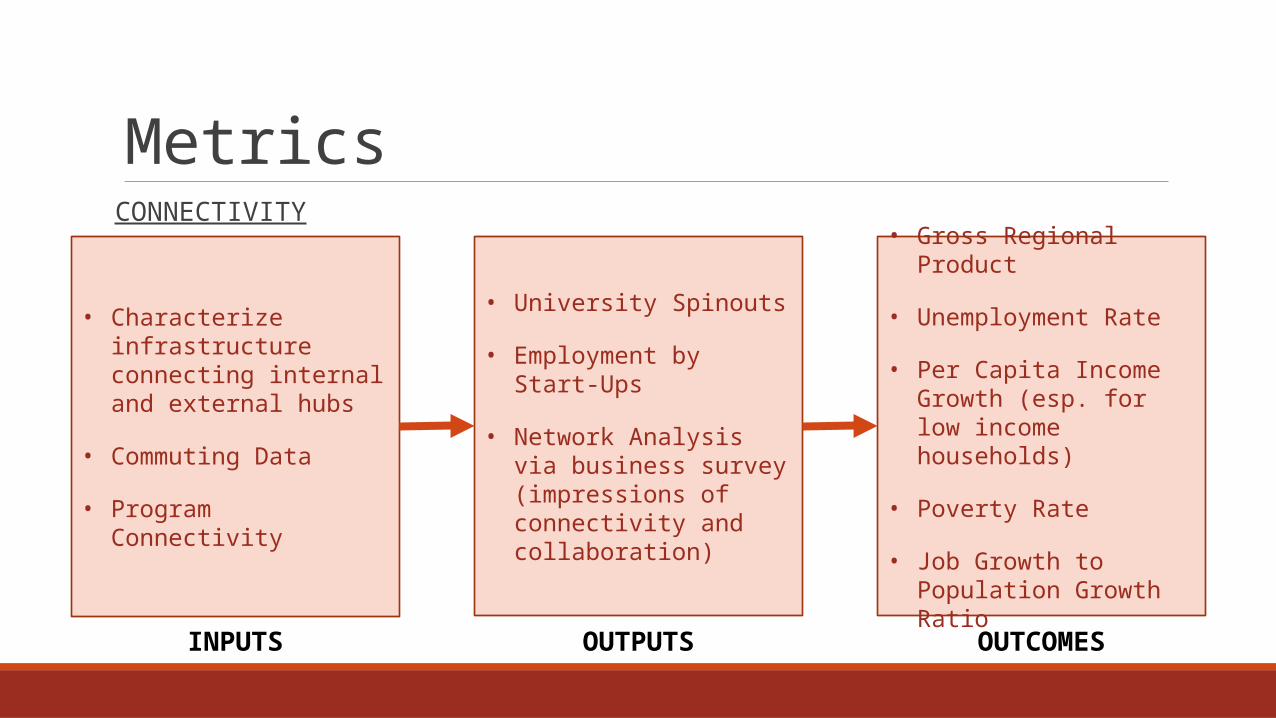
MetricsCONNECTIVITY
• Characterize infrastructure connecting internal and external hubs
• Commuting Data
• Program Connectivity
• University Spinouts
• Employment by Start-Ups
• Network Analysis via business survey (impressions of connectivity and collaboration)
• Gross Regional Product
• Unemployment Rate
• Per Capita Income Growth (esp. for low income households)
• Poverty Rate
• Job Growth to Population Growth Ratio
INPUTS OUTPUTS OUTCOMES

MetricsDIVERSITY
• Population Flux or Net Migration (migrants and immigrants)
• Inventory of Funding Types
• Economic Diversification by Industry
• Economic Diversification by Industry
• Gross Regional Product
• Unemployment Rate
• Per Capita Income Growth (esp. for low income households)
• Poverty Rate
• Job Growth to Population Growth Ratio
INPUTS OUTPUTS OUTCOMES
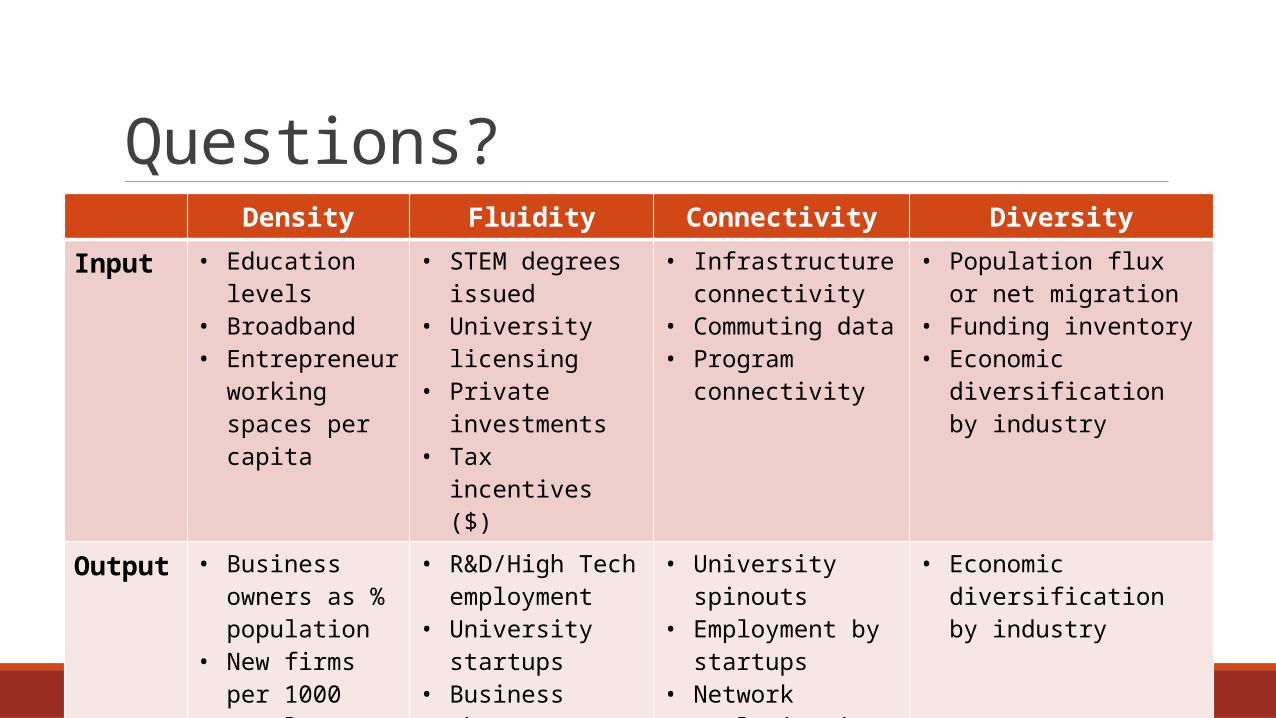
Questions?Density Fluidity Connectivity Diversity
Input • Education levels• Broadband• Entrepreneur
working spaces per capita
• STEM degrees issued
• University licensing• Private investments• Tax incentives ($)
• Infrastructure connectivity
• Commuting data• Program connectivity
• Population flux or net migration
• Funding inventory• Economic diversification
by industryOutput • Business owners
as % population• New firms per
1000 people• Scale Up Density
• R&D/High Tech employment
• University startups• Business churn• High growth firms
• University spinouts• Employment by
startups• Network analysis via
survey
• Economic diversification by industry
Outcome Gross Regional Product; Unemployment Rate; Per Capita Income Growth (esp. for low income households); Poverty Rate; Job Growth to Population Growth Ratio