Embed Size (px)
Citation preview

DEPARTMENT OF EDUCATION IN SOCIAL SCIENCESNational Council of Educational Research and Training
Sri Aurobindo Marg, New Delhi-110016
– A Teacher’s Handbook
Coordinator
M.V. SRINIVASAN
Handbook for Economics Teachers 1
PREFPREFPREFPREFPREFACEACEACEACEACE
Curriculum reform is a continuous process. Econom-ics curriculum has also undergone in India tremen-dously. The task of developing the present handbookhas been initiated by the department as part of thepackage of materials to be used by teachers to imple-ment National Curriculum Framework (NCF) 2005.
In 2005-07, the NCERT has brought out new eco-nomics textbooks based on the NCF 2005. These text-books contain many new topics. These textbooks re-quire some assistance for teachers on how these con-tents can be transacted in classrooms. It was also feltthat those who aspire to become economics teachers inschools can be given learning materials which can helpthem to use a variety of teaching learning materialsspecifically related to economics. Also many teachertraining institutions and universities provide pre-ser-vice and in-service training to teachers. There is nosupport material available for teacher educatorsspecialised in economics education.
Even though lecture is the important method withwhich economics is imparted in secondary students andchalk and black boards are the only aids used in eco-nomics classrooms, the scenario is changing. Thanksto globalisation and information technology, a large

Learning Economics: Some Basic Questions2
number of economics teachers look forward to use ofinformation technology and wish to teach economics ininnovative ways.
In the 1970s, as part of its mandate, the NCERTbrought out Teaching units and Instructional Objec-tives for various subject areas including economics.Asupport material for economics teachers in view ofchanges in the economics curriculum brought out inthe light of NCF 2005 is an overdue and this handbookis trying to fill that gap.
The handbook was prepared collectively by practis-ing school economics teachers, teacher educators andeconomists teaching in universities. The draft outlineof the handbook and the draft manuscripts were pre-sented to economics teachers for their comments andsuggestions. The list of participations of three work-shops conducted to develop the framework of this hand-book and for giving suggestions on the draft chapters isgiven in the next page. Many economics teachers gavetheir comments through e-mail. We wish to place onrecord our gratitude to each one of them.
The contents of this handbook were written, revisedand edited in a collective manner by a group of schooland university teachers and teacher educators. Theircontribution to this handbook as members of editorialteam and as contributors is duly acknowledged. Devel-opment of learning material is a continuous process.Any suggestions and feed back to improve the qualityof this material will be highly appreciated.

Handbook for Economics Teachers 3
R. Srinivasan, Associate Professor, Department ofEconometrics, University of Madras, Chennai – 600005;
Ambika Gulati, Faculty Member, Department ofEconomics, Sanskriti School, New Delhi
M.V.Srinivasan, Assistant Professor, DESS, NCERT.
DETAILS OF CONTRIBUTORS
OVERALL EDITING
Sl. No.
Chapter /Appendix Contributor
1 Learning Economics: Some Basic Questions
M.V. Srinivasan, DESS, NCERT and Prof. Hari Krishnan, Department of Education, Annamalai University, Chidambaram, Tamil Nadu.
2 Economics Education in India: A Review of Syllabi
M.V.Srinivasan, DESS, NCERT.
3 Planning for Effective Economics Teaching
Manju Agarwal, Associate Professor, Central Institute of Education, University of Delhi, Delhi.
4 Teaching a Topic in Indian Economy Using Unit Plan Approach
Manju Agarwal, CIE, Delhi University, Delhi.
5 Lectures, Discussions and Story Telling Jaya Singh, Assistant Professor, DESS, NCERT and M.V.Srinivasan, DESS, NCERT.
6 Teaching Economics Through Problems Pratima Kumari, Assistant Professor, DESS, NCERT and M.V.Srinivasan, DESS.
7 Simulation Games and Teaching Economics
Kartar Singh, Assistant Professor, Institute of Advanced Studies in Education, Jamia Milia Islamia, New Delhi.
8 Using Media and Technology in Economics Classrooms
Ambika Gulati, Head of the Department, Department of Economics, Sanskriti School, New Delhi.
9 Importance of Mathematics in Teaching Economics
Ashita Raveendran, Assistant Professor, DESS, NCERT.
10 Basic Mathematical Tools in Economic Analysis
Ashita Raveendran
11 Use of Algebraic Equations and Graphs R.Srinivasan, Department of Econometrics, University of Madras and M.V.Srinivasan, DESS, NCERT.
12 Concept Mapping and Use of Flow Charts
Subrata Kundu, Principal, Sesomu School, Sri Dungagarh, District Bikaner, Rajasthan.
13 Assessment and Framing Quality Questions in Economics
Pratima Kumari and Prof. Hari Krishnan
Reference Materials for Teachers and Students (Appendix)
Prof. Rama Gopal, Department of Economics, Annamalai University, Chidambaram, Tamil Nadu and M.V.Srinivasan, DESS, NCERT.

1. Late Prof. Tapas Majumdar, Emeritus Professor,Zahir Hussain Centre for Educational Studies,Jawaharlal Nehru University, New Delhi – 110067.
2. Rashmi Sharma, Post Graduate Teacher (Eco-nomics), KendriyaVidyalaya, Jawaharlal NehruUniversity Campus, New Mehrauli Road, NewDelhi – 110 067.
3. Meera Malhotra, Head of the Department (Eco-nomics), Modern School, Barahkhamba Road,New Delhi.
4. S. Sobana Kumari Nair, Head of the Department(Economics), The Mother’s International, SriAurobindo Marg, New Delhi – 110 017.
5. G.Nalini Padmanabhan, Post Graduate Teacher(Economics), D.T.E.A. School, Janakpuri, NewDelhi – 110 058.
6. Bharat C.Thakur, Post Graduate Teacher (Eco-nomics), Rashtriya Pratibha Vikas Vidyalaya,Surajmal Vihar, Delhi – 110 092.
7. Malabika Pal, Senior Lecturer, Department ofEconomics, Miranda House, New Delhi.
OTHER PARTICIPANTS ATTENDED THE
WORK-SHOPS TO DEVELOP THE HANDBOOK

TABLE OF CONTENTS
Preface
About the Handbook
1. Learning Economics: Some Basic Questions 1
2. Economics Education in India: A Review of Syllabi 12
3. Planning for Effective Teaching of Economics 23
4. Teaching a Topic in Indian Economy Using 30
Unit Plan Approach
5. Lectures, Discussions and Story Telling 56
6. Teaching Economics Through Problems 71
7. Simulation Games and Teaching Economics 83
8. Using Media and Technology in Economics 96
Classrooms
9. Importance of Mathematics in Teaching Economics 126
10. Basic Mathematical Tools in Economic Analysis 137
11. Use of Algebraic Equations and Graphs 154
12. Concept Mapping and Flow Charts in Economics 181
13. Assessment and Framing Quality Questions 197
in Economics
Appendix
Reference Materials for Teachers and Students 213
ChapterChapterChapterChapterChapter 1
Learning Economics:Some Basic Questions
You may recall that when we started learningeconomics, we were introduced to three basicquestions in economics viz., (i) what to produce;
(ii) how to produce and (iii) for whom to produce. Thesequestions then took us to the world of economicsknowledge. As teachers of economics, we are confrontedwith yet another three broad questions from studentsand parents: (i) How does the study of economics improveour understanding of society and human behaviour? (ii)What employable skills do we acquire from it? (iii) Howis economics learnt? Each one of us gives a differentanswer to these relevant questions. As graduates of thesubject, we all know the broad areas in Economics.Enriching ourselves to look for answers to the threequestions would help us in motivating our students tolearn better.
This chapter is divided into two sections. The firstsection briefly introduces the relevance of learningeconomics. Two other questions – how economics islearnt and the skills acquired in the learning processare taken up in the second section. Students learningeconomics are required to take certain precautions. Afew important ones are discussed in the final section.
Topics dealt with in this chapter are elaboratelydiscussed in the introductory sections of most graduatelevel textbooks. Besides references mentioned in the

Learning Economics: Some Basic Questions2
end of this chapter, the reader is suggested to refer someof textbooks for better understanding of issues.
Importance of Learning Economics
The use of learning economics can be seen from threedimensions: (i) personal satisfaction; (ii) social benefitsand (iii) an intellectual exploration.
Personal Satisfaction
Most of the activities carried out in a family are economicin nature. As a member of the family, a student ofeconomics witnesses his parents going to work, earningtheir wages or salaries, purchasing goods and servicesin the market, saving a part of their income anddepositing it in a bank, chit fund, investing in land,shares and bonds, borrowing for various purposes, andpaying income tax to name only a few activities. Theadvantage students of economics have is that they learna lot about real life economic activities in a systematicway in schools. This enables them in understandingvarious economic activities taking place in theirsurroundings compared to those who do not studyeconomics. For example, every student purchases goodsin a market. However, it is a student of economics whounderstands the logic behind how much of a good ispurchased and why. This is explained to students inthe topic of Consumer's Behaviour in Class XII. Itintroduces students to the concept of satisfaction orbenefit that a consumer derives when units of acommodity are consumed along with how much theconsumer needs to pay for the good.
Social Benefits
The study of economics widens our understanding aboutand adds value to democracy and good citizenship. AsBarbara Wooten says, “No one can claim to be a citizen ofthe country unless he / she has the knowledge of economics.”Students of economics get the opportunity to learn aboutvarious economic issues faced by the nation. A large variety

Handbook for Economics Teachers 3
of economics curricular activities help them to criticallyanalyse economic issues and make suggestions based oneconomic principles that are studied over the years. Forinstance, class XII students can understand some basics onMacroeconomic principles being used to bail out economiesreeling under the global financial meltdown of 2008.
Economic theories train students to think like a scientist- to put it rightly - as an economist - logically and rationally.In the learning process, students are exposed to the scientificmethodology of collecting evidence - facts and figures andanalysing them by using statistical tools and economictheories. For instance, in Class XI, the statistics project workallows students to demonstrate the following skills:
• Collection of data - whether primary or secondary• Interpretation and presentation of data and• Analysing data to come towards a meaningful
conclusion to their findings.
Intellectual Exploration
Learning economics is an exciting intellectualadventure. Indian economy, for instance, containshundreds and thousands of economic activities. Thereare many organisations and institutions in both privateand public sectors engaged in solving the basiceconomic problems of India. While trying to understandthe Indian economy, students of economics learn anduse various skills that economists need to possess.Economics students also get excited when they mastermany facets of the Indian economic system.
"Learning economics is the real adventure" Lipseysays. At first students of economics encounter economictheories. These theories add to their understanding ofthe world. Like in any other discipline, there is aconstant interplay between theories and facts ineconomics, and students learn to think like aneconomist.
Peterson says "economics offers a pleasing blend ofthe purely intellectual and the artistic, for pure economicanalysis has the rigour and symmetry of science andmathematics, whereas the economic policy partakes morethe uncertain character of an art than a science. The policy

Learning Economics: Some Basic Questions4
maker must develop the skill to relate pure economicanalysis to such real world problems as inflation,unemployment and poverty." Why do we think we haveto agree with what peterson says.
How is economics learned?
Learning a subject differs from subject to subject. Thosewho learn mathematics, for instance, study simplearithmetic in the lower classes and their mathematicsworld expand as they move to higher classes. Inuniversities and colleges, they learn mathematicaltheorems and discover different ways of proving themor invent a new theorem. Also there are different waysof learning mathematics. Different tools may be requiredto learn different topics. In the same manner, learningeconomics also involves certain steps and methods. Itrequires certain tools. They differ from topic to topic.We shall now discuss some of the learning requirementsof an economics classroom.
Learning Economics is a Scientific Activity
Economics is a social science, distinguished from thephysical, biological or environmental sciences, becauseit is concerned with the behaviour of “human beings asmembers of societies”. We all know that human beingsdo not behave in the way animals do when kept inlaboratories. This poses a greater challenge toeconomists as they need to establish hypotheses andassumptions, which are general statements thatformally show the existence of cause and effectrelationships between observable events.
Since people’s behaviours cannot be controlled, whilelearning and developing economic theories, students ofeconomics allow for a large element of unpredictabilityand even capriciousness in human behaviour. Thismakes generalisation and predictability difficult ineconomics. However, since we live in societies and behavemostly in an orderly manner, behaviour can be consideredas predictable. Such orderly behaviour is the basis for any

Handbook for Economics Teachers 5
generalisations and predictions.Students of economics use several statistical tools
to generalise observable behavioural patterns. One suchtool is the Law of Large Numbers, which states that ifthe action or movements of a very large number ofindividual items is analysed, the random movementsof the individual items will be found to cancel oneanother out. This results in a pattern of behaviour,which is similar to a bell-shaped normal distributioncurve. This type of analysis is useful for predicting thebehaviour of a group when the behaviour of individualentities that makes up the group is governed by manysmall factors.
The above discussion highlights the fact thateconomics is concerned with the behaviour of a groupnot an individual. Also economic theories do not andcannot tell us how any individual will react in aparticular situation, but they can frequently predict veryaccurately the way in which a group reacts under agiven set of circumstances. For example, generally it isconsidered that a firm selects that level of output whichmaximises its profits. However, a particular firm’s goalmay be to increase its sales, even if it means that itsoverall profits are not maximised.
Analysing Economic Aspects
Learning economics requires understanding ofeconomic phenomena - relationship between variouseconomic aspects of an economy. For this, students ofeconomics gather, measure and analyse informationrelated to various economic aspects. Since people'seconomic behaviour frequently manifests itself inmeasurable ways, the behaviour is coded and tabulated.They result in tables and large sets of numerical data.This data is used by young economists to interpretdifferent economic situations. For instance, studentsof classes VIII-X collect data relating to few economicvariables for a specific project in social science. Theymight collect details of income and employment fromhouseholds or income, expenditure and profitability of aparticular establishment or enterprise say - a milk

Learning Economics: Some Basic Questions6
cooperative. These activities help them to not onlyunderstand the dynamics of a particular economicphenomenon of the group of households or an enterprisebut also lays the foundations for learning economics.
National Sample Survey Organisation, for example,collects information relating to many aspects of people'slife in India. The NSSO particularly collects the detailsof employment and unemployment and consumptionexpenditure from selected number of households orenterprises. They collect details on the basis ofrequirements made by economists working inuniversities and in government departments. Once datais collected, economists from all over the countryinvestigate the data and use it for various purposes.Even students in Class XI use the data collected alsocalled secondary data to develop insights into the Indianeconomy. For example, students enhance theirunderstanding of the Indian economy by analysing dataon the contribution made by various sectors to the GrossDomestic Product (GDP) of the economy. Based on asingle statistical table, an entire classroom discussionis held on how the Indian economy has evolved frombeing an agrarian economy to being a service orientedone. The factors that have contributed to what the datahighlights, key terms and concepts are explained, andskills of reading and analysing time series data is alsointroduced to the young learners. Hence, the NSSO'swork enriches and updates our understanding ofeconomic behaviour of people in India.
Understanding Economic Theories
Students of economics are expected to understandvarious theories / models developed by economists.Models are nothing but a simplified version of reality.They are tools used by economists to understand the"way an economic system" functions or "generalbehaviour" of people or organisations in an economy.
An economic theory is broadly defined as a "broadstatement that embodies a meaningful relationship betweenobserved economic events." Every economic theory pertainsto the general behaviour of groups and institutions because

Handbook for Economics Teachers 7
they reflect elements common to many specificsituations. But the economic theory does not purportto describe the behaviour of specific persons orinstitutions.
Students of economics use economic theories for variouspurposes. Economic theories, under given circumstances(ceteris paribus about which you will know later) helpstudents of economics to predict, forecast and maketentative statements about the behaviour of an economicsystem or economic events. For example, in Class XIIstudents are introduced to the simple tools of demandand supply which determine market price for acommodity and how a firm maximises profits. Theseprinciples are used by economists engaged in privatecompanies in explaining how much output a companyshould produce in order to maximise its profits.Similarly, Class XII Economics textbooks introducesstudents to the basic components of a governmentbudget and simple Keynesian model of income andemployment determination. Now economists who workfor government departments use macroeconomictheories to reach out to people through planning andexecuting developmental activites.
Economic Theories and Assumptions
Learning economics requires understanding of variousaspects of economic theories. For example, economicsstudents are required to understand assumptions orpostulates. While teaching perfect competition, we listout the assumptions of a perfectly competitive market.Every economic theory is grounded in a set ofassumptions.
There are a few assumptions common to anyeconomic model. For example, the idea of other thingsbeing equal, to put it in a popular Latin phrase, ceterisparibus. It is similar to, as Peterson says, "intellectualequivalence" of controlled experiments done by physicaland biological scientists. However, we are aware thatbiologists can hold or regulate physical conditions suchas human, soil type and manure while investigatingthe growth of plants. Such things are not possible in
Learning Economics: Some Basic Questions8
economics. This is also one of the reasons why economictheories are considered less precise and exact ascompared to theories of other sciences.
Sometimes economists make assumptions, whichare not observed in reality. We may tend to think thateconomic theories based on such unrealisticassumptions are not important. However, economicmodels based on such unrealistic assumptions "opendoor to powerful insights" into the behaviour of theeconomic system or economic relationships under study.For instance, a perfectly competitive market structuredoes not exist in reality. Yet students of economicsrequire to understand its features and implications asit is the most efficient market structure. A deepunderstanding of perfect competition allows students tocompare and contrast other market structures like monopoly,monopolistic competition etc. in terms of price and outputefficiency.
Understanding Abstraction
Economics is introduced to students in lower classes assimple depiction of economic aspects closer to their real life.However, as students move to higher classes and particularlywhen they enter higher secondary and undergraduate levels,they take up economics as a special course. During this stage,economic theories are introduced to them in abstractlanguage.
Peterson defines abstraction as the "process offorgetting unimportant details". Economists constructa theory "to create an oversimplified - or abstract -picture that will make the complexities of the real worldintelligible". Students are expected to understand thenature and purpose of abstraction in economic analysis.This will help in mastering the subject. We live in aworld, which contains a complex web of relationsbetween institutions and individuals. The abstractionhelps in drawing out only those elements thought to beof strategic importance for understanding how thingsactually work in most parts of the world.
Use of Logic and Mathematics
Handbook for Economics Teachers 9
Each economic theory has a logical structure. Ananalysis of economic theory involves deriving a set ofconclusions from a given set of assumptions throughthe process of reasoning. This means economic theoriesalso build their logical structure from stage to stage. Inorder to understand the logical structure of economictheories, students of economics are expected to acquireskills, which enable them to understand long chains oflogical reasoning. Lipsey suggests that it is essential tofollow an argument several times, step-by-step, untilone becomes familiar with the argument to overcomedifficulties in understanding long chains of reasoningin economic theories.
In recent times, a large section of economists suggestthat students should get familiarised with a few topicsin mathematics. We are aware that graphs are used toderive theoretical results in economics. This is the useof geometry in economics. Economists use mathematicalsymbols in stating economic theories and assumptionsand use mathematical theorems in the logical reasoning.A.C.Chiang argues that learning economic theoriesmathematically has the following advantages: (i) the'language' used is more concise and precise; (ii) thereexists a wealth of mathematical theorems at our service(for drawing conclusions on the basis of logicalreasoning); (iii) in forcing us to state explicitly all ourassumptions as a prerequisite to the use ofmathematical theorems, this approach keeps us fromthe pitfall of an unintentional adoption of unwantedimplicit assumptions; and (iv) it allows us to treat thegeneral n-variable case. You will learn more about theuse of mathematics in economics in Chapters 9 and10.
Familiarisation of Vocabulary
Like any subject, economics also contains a lot oftechnical terms. In the beginning students may feel thateconomists have unnecessarily coined different termsor jargon for many common sense ideas. However, asLipsey argues that it is required as an essential "brevityof expression" as the subject grows and expands. Forinstance, we all know the meaning of the terms"demand" and "supply" in economics. They are different

Learning Economics: Some Basic Questions10
from the way they are used in common parlance.Further, suppose each word or phrase used in aneconomic theory is replaced with the full verbaldescription of the ideas expressed, the argument mightbecome cumbersome. When several ideas are combinedin a logical fashion, then use of concepts and termsbecomes inevitable for precise expression. Also, wheneconomics students continue to use these jargons, theyget understood by them easily.
Precautions in Learning Economics
Though learning economics is an exciting experience,students should also guard themselves from errors inlogical reasoning. Three common and importantproblems are described below.
1. Fallacy of composition: While learning economicswe tend to assume that things that may be truefor the individual entities of the economic system,for instence, business firms or household, mayalso be true for the system as a whole. Let ustake one well known concept in macroeconomics:“paradox of thrift.” This concept states thatthough it may be good thing for the individual tosave some of his income, it does not necessarilyfollow that it is always a good thing for the wholecountry to save.
2. False analogies: Economics students also tendto use false analogies – generalise for the countryas a whole on the basis of personal or individualexperience. For example, we find an individualwho consistently spends more than he earnsbecoming bankrupt, but it is wrong to generalisethe same if the government spends more thanthe revenue that it would go bankrupt. We knowthat most governments believe in welfare stateprinciple work with deficit budget. In fact, it isalso the principle which led to birth ofMacroeconomics after the Great Depression.
3. Post hoc ergo propter hoc: This fallacy means“after this, therefore, because of this.” When

Handbook for Economics Teachers 11
students of economics are not able to understandthe sequence or the cause and effect of economicevents they tend to fall into this fallacy. Supposethe Government of India cuts taxes to increaseemployment and stimulate a depressedeconomy. Since this is an appropriate measure,which leads to a reduction in unemployment anda rise in the gross domestic product, studentsmay conclude that, the cause of the recovery isthe tax cut. But this is not necessarily true. Theforces taking the economy towards recoverymight have gathered momentum prior to thedecision of cutting taxes and the timing of thetax cut in relation to economic recovery may havebeen purely coincidental. Very careful analysisof the events is necessary before one can be surethat a particular event is necessarily the causeof a subsequent event.
REFERENCES1. Blaug, Mark, The Methodology of Economics or
How Economists Explain, Cambridge UniversityPress, Cambridge, Reprint Edition, 1988.
2. Chiang A.C., Fundamental Methods ofMathematical Economics, Third Education,McGraw Hill Book Company, Auckland, 1984.
3. Heyne, Paul, The Economic Way of Thinking,Fourth Edition, Science Research AssociatesInc., Chicago, 1983.
4. Lipsey Richard G., An Introduction to PositiveEconomics, Sixth Edition, English LanguageBook Society, London, 1987.
5. Peterson Wallace C., Elements of Economics,W.W.Norton & Company Inc., New York.

ChapterChapterChapterChapterChapter 2
Economics Education in India:A Review of Syllabi
In the previous chapter we have looked at whyeconomics education is an important curricularknowledge in the formal education system particularlyfor the young learners. In this chapter we will look atthe nature of economics curriculum taught in Indianschools.
Economics is a subject introduced to the children inIndian schools for more than 80 years. In those days,princely states or provinces had the responsibility ofproviding schooling for the people. This has led curriculumdevelopers to introduce economics topics in the initialyears of post-independent India along with topics relatedto political science in some states or separately in others.However, the systematic planning of economics educationin India started in 1976 after the introduction of nationalsystem of education i.e. 10+2+3. One of the factorsresponsible for this phenomenon is the inclusion ofEducation in the Concurrent List of the IndianConstitution. This enabled both state and centralgovernments to take interest in planning the curriculumand financing of education.
This chapter is based on the syllabus documentsbrought out by examination boards of states - Nagaland,Manipur, Assam, Andhra Pradesh, Tamil Nadu, Gujarat,West Bengal, Madhya Pradesh, Orissa, Rajasthan andall India boards such as Central Board of Secondary
Education, International Baccalaurette and Council forthe Indian School Certificate Examinations andNational Council of Educational Research and Training(NCERT), New Delhi.
This chapter has three sections. In the first section,we will look at the role of government agencies informulation of economics curriculum in India. Thebroad areas covered by different school boards at thehigher secondary stage are presented in the secondsection. The third section provides some insights intothe nature of economics curriculum presented in thesecond section.
National CurriculumFramework 2005 andEconomics Curriculum
Children acquire knowledge through various sources –their parents, neighborhood, media. Formal educationhas been recognised as the important source throughwhich they acquire skills and competencies required fortheir social life. How economics curriculum is evolved?When government is the prime mover of formaleducation, various policy documents of the governmentprovide direction and formulation of curricularknowledge.
Like other subject areas, economics curriculum alsoevolves from those policy documents. These documentsalso provide guidance in formulating the objectives ofteaching a particular subject and the pedagogicalconsiderations the material developers will have to takeinto account. For instance, the National CurriculumFramework 2005 a national level policy documentbrought out by NCERT suggests that economicscomponent of social science courses introduced at theupper primary stage, i.e., classes VI, VII and VIII couldbe prepared in such a manner that they “enablestudents to observe economic institutions like thefamily, the market and the state”. The NCF 2005 alsostates that the topics of economics course introduced
Handbook for Economics Teachers 13

Economics Education in India: A Review of Syllabi14
at the secondary stage should be discussed from the“perspectives of the people” (NCERT, 2005, p.53).Though this document does not provide clear cutspecifications of a course introduced at the highersecondary level, it gives the general perspectives whichany course at that stage could keep in mind. To quote,
"The higher secondary stage is important as it offers achoice of subjects to students. For some students, thisstage may be the end of their formal education, leadingto the world of work and employment; for others, thefoundation for higher education. They may chooseeither specialized academic courses or job-orientedvocational courses. The foundation at this stage shouldequip them with basic knowledge and the necessaryskills to make a meaningful contribution in the field theychoose" (emphasis added) (ibid).
One of the important outcomes of the NationalCurriculum Framework 2005 is the revision of syllabiof classes I to XII. NCERT also develops model textbooksbased on its syllabi and give free copyright permissionfor state governments to adopt or adapt and use in theirschools. The CBSE recommend these books to studentsstudying in its affiliated schools.
These syllabus documents (NCERT 2006b) form thebasis for developing textbooks and other curricularactivities relating to different subjects. At the highersecondary stage, four courses are suggested for studentsopting Economics: (i) Statistics for Economics; (ii) IndianEconomic Development; (iii) IntroductoryMicroeconomics and (iv) Introductory Macroeconomics.It is suggested that one course should be covered foreach semester. The syllabus document also providesthe rationale for the semesterisation of courses. Toquote,
"Economics courses are being introduced in such a waythat, in the initial stage (in class XI), the learners areintroduced to the economic realities that the nation isfacing today along with some basic statistical tools tounderstand these broader economic realities. In thelater stage (in class XII), the learners are to beintroduced to economics as a theory of abstraction."(NCERT, 2006b, p.114 & 115).
Handbook for Economics Teachers 15
Although NCERT as an apex body develops modelsyllabi and textbooks and suggest various steps intransacting the curriculum, to what extent theseguidelines are followed?
Economics Syllabi: A Review ofNational and International Boards
Syllabus document brought out by examinationagencies form an important guiding material for all theactivities in economics classrooms. The syllabusdocuments brought out by NCERT are publicdocuments which can be adopted or adapted by anyexamination board in India.
Objectives of Teaching Economics
The answer to the question - why economics is taughtin schools, is not only essential in answering studentsbut also for the teachers when they teach economics inschools. Teachers are expected to understand whyeconomics is taught so that they can plan the classroomactivities effectively. The details of objectives would alsohelpful in understanding the contents - topics and sup-topics and why they are included in the curricularcontents. Every syllabus document is supposed toprovide the details of objectives of teaching economics.The CBSE adopts the NCERT syllabi as it is and givesthe details of syllabus topics for economics courses.According to the CBSE (2008) document, the objectivesof teaching economics at the higher secondary stageare: (i) make students to understand some basiceconomic concepts and developing economic reasoningwhich the learners can apply in their day-to-day life ascitizens, workers and consumers; (ii) enable learners torealise their role in nation building and sensitise themto the economic issues that the nation is facing today.(iii) To equip learners with basic tools of economics andstatistics to analyse economic issues. This is pertinentfor even those who may not pursue this course beyondthe higher secondary stage; (iv) To develop an
Economics Education in India: A Review of Syllabi16
understanding among students that there can be morethan one view on any economic issue and to developthe skills to argue logically with reasoning.
Another national level agency is the Council for theIndian School Certificate Examinations (CISCE). Thesyllabus document brought out by CISCE provides thefollowing as aims of teaching economics at the highersecondary stage: (i) To enable candidates to acquireknowledge (information) and develop an understandingof facts, terms, concepts, conventions, trends,principles, generalisations, assumptions, hypotheses,problems, processes, etc. in Economics; (ii) To acquaintcandidates with tools of economic analysis; (iii) Todevelop an understanding of important economicproblems; (iv) To acquaint candidates with the maininstitutions through which the productive process iscarried out; (v) To develop an understanding of the roleof institutions in the functioning of an economy and(vi) To enable candidates to compare their own economicstructure with that of the other areas of the world.
The International Baccalaureate Organisation offerdiploma courses in its affiliated schools. It is equivalentto higher secondary stage in Indian boards. The IBsyllabus document presents the aims of the economicscourse as follows: (i) provide students with a coreknowledge of economics; (ii) encourage students to thinkcritically about economics; (iii) promote an awarenessand understanding of internationalism in economics;(iv) encourage students' development as independentlearners; (iv) enable students to distinguish betweenpositive and normative economics and (vi) enablestudents to recognize their own tendencies for bias. TheIB syllabi contain two levels - higher level and standardlevels. The high level includes a few topics at the in-depth and higher level whereas the standard syllabicontain important and fundamental level. Theeconomics course syllabi of these three boards are givenin the following table.
Table 2.1 shows that there is no uniformity ofsyllabus formulation. While CBSE and CISCE broadlyfollow a pattern that during the first year, students areintroduced to the topics that are either issue-based ones

Handbook for Economics Teachers 17
(Indian economy, money and banking) and a few basicaspects in economics, the IB follows a different pattern.There is no separate syllabus for the first year. Thetheoretical topics are taught during the second year inCBSE and ICSE schools whereas students studying inIB schools start learning from first year onwards. Acareful examination of course objectives show that thestudents studying in ICSE and IB schools are expectedto develop international perspective, students studyingin CBSE schools are required to sensitise themselves in"nation building". The IB syllabus contains a separatesection with the title, "Internationalism in the EconomicsCourse." To quote,
"Economics has an important role to play in promotingsuch international cooperation and mutualunderstanding because of its focus on global issues.Teachers of the course must aim to promote anawareness in their students of how the impact ofeconomics can both improve cooperation andunderstanding between countries and, unfortunately,cause extensive damage.If all participants in the global economy are to achievea better quality of life for their populations, there mustbe economic cooperation between all countries. Thisdoes not mean that developed countries must controlthe destinies of less-developed countries. Instead, itmeans sharing concepts across cultures, against abackground of economic awareness.To achieve this understanding, students must be taughtto consider economic theories, ideas and happeningsfrom the points of view of different individuals, nationsand cultures in the world economy. Although complete
Name of First Year Second YearAgency
Semester 1 Semester 2 Semester 3 Semester 4
CBSE Statistics for Indian Economic Introductory IntroductoryEconomics Development Microeconomics Macroeconomics
ICSE Four modules: (i) Understanding Four modules: (i) MicroeconomicEconomics, (ii) Indian economy- theory, (ii) National Income, (iii)challenges, (iii) Money and International Trade adn (iv) PublicBanking and (iv) Statistics Finance
IB Five Sections: (i) Introduction to economics; (ii) microeconomics; (iii)macroeconomics; (iv) international economics adn (v) development economics
Economics Education in India: A Review of Syllabi18
knowledge is impossible, students can search forunderstanding through a wide range of different aspectsof the global economy. Their search may inspire alifelong interest in the promotion of internationalunderstanding. (p.5)"
The syllabi of all the three boards reveal aconsiderable amount of differences in the curricularpractices. Both IB and ICSE school students studyinternational trade topics - both theoretical and issues,whereas CBSE school students appear to study a fewbasic issues only. While appearing for the final yearexamination, the IB school students can opt for anyone of the two economics syllabi - higher level andstandard level, students studying under ICSE and CBSEboards do not have such options. The IB students areassessed both internally and by the writtenexaminations. They also have many assessment tools -portfolios, assignments and so on. They are awarded20 marks for internal assessment and the remaining80 marks are for external assessment. Studentsstudying in ICSE and CBSE schools face examinationsin the similar fashion - 100 marks for externalexaminations but without any internal assessment. TheIB diploma examination assesses students' performancein the entire course meant for both the years whereasICSE and CBSE students face board examinations onlyin the second year and hence what is taught in thesecond year becomes important for final yearexamination and award of the course certificate.
Even though the syllabi of these agencies andparticularly the CBSE is trendsetter for other boards,the number of schools affiliated to these national andinternational boards in India is very small - roughlyabout one-tenth of total number of higher secondaryschools in the country. The rest are affiliated to statelevel examination boards. In the following section, thesyllabi used in state boards are examined.
Economics Syllabi in states
As pointed our earlier, NCERT plays important role inpreparing National Curriculum Frameworks which formthe guiding document in preparing the model syllabi
Handbook for Economics Teachers 19
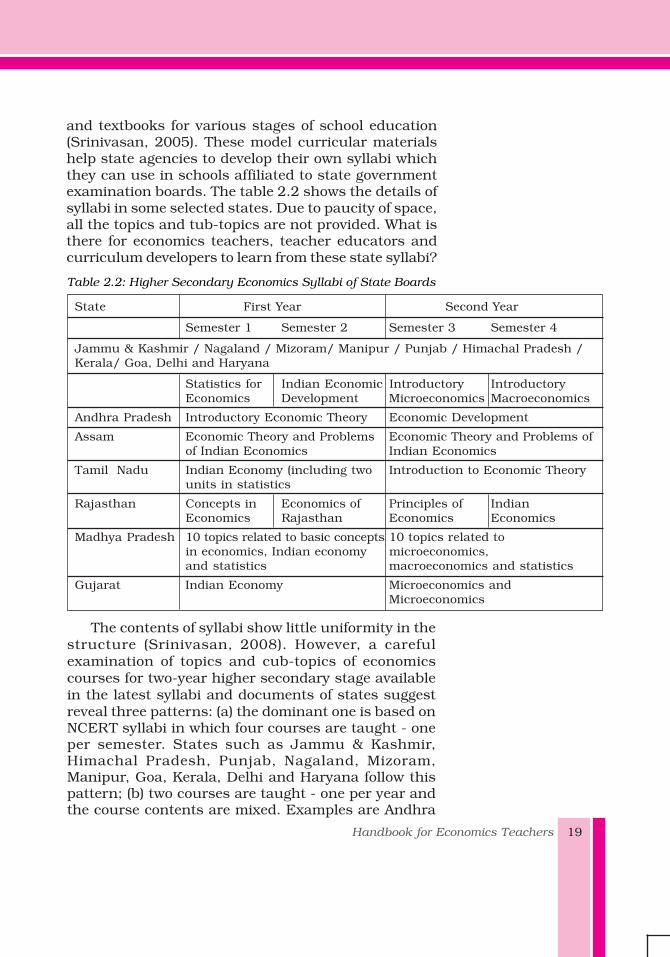
and textbooks for various stages of school education(Srinivasan, 2005). These model curricular materialshelp state agencies to develop their own syllabi whichthey can use in schools affiliated to state governmentexamination boards. The table 2.2 shows the details ofsyllabi in some selected states. Due to paucity of space,all the topics and tub-topics are not provided. What isthere for economics teachers, teacher educators andcurriculum developers to learn from these state syllabi?
Table 2.2: Higher Secondary Economics Syllabi of State Boards
State First Year Second Year
Semester 1 Semester 2 Semester 3 Semester 4
Jammu & Kashmir / Nagaland / Mizoram/ Manipur / Punjab / Himachal Pradesh /Kerala/ Goa, Delhi and Haryana
Statistics for Indian Economic Introductory IntroductoryEconomics Development Microeconomics Macroeconomics
Andhra Pradesh Introductory Economic Theory Economic Development
Assam Economic Theory and Problems Economic Theory and Problems ofof Indian Economics Indian Economics
Tamil Nadu Indian Economy (including two Introduction to Economic Theoryunits in statistics
Rajasthan Concepts in Economics of Principles of IndianEconomics Rajasthan Economics Economics
Madhya Pradesh 10 topics related to basic concepts 10 topics related toin economics, Indian economy microeconomics,and statistics macroeconomics and statistics
Gujarat Indian Economy Microeconomics andMicroeconomics
The contents of syllabi show little uniformity in thestructure (Srinivasan, 2008). However, a carefulexamination of topics and cub-topics of economicscourses for two-year higher secondary stage availablein the latest syllabi and documents of states suggestreveal three patterns: (a) the dominant one is based onNCERT syllabi in which four courses are taught - oneper semester. States such as Jammu & Kashmir,Himachal Pradesh, Punjab, Nagaland, Mizoram,Manipur, Goa, Kerala, Delhi and Haryana follow thispattern; (b) two courses are taught - one per year andthe course contents are mixed. Examples are Andhra

Economics Education in India: A Review of Syllabi20
Pradesh, Assam, Gujarat, Orissa, Pondicherry andTamil Nadu; (c) a set of topics from four broad areas(Indian economy, statistics, microeconomics andmacroeconomics) are mixed and taught in each year.Rajasthan and Madhya Pradesh are examples of statesfollowing this pattern. One can also see these patternsare similar to what is found in the preceding section -syllabi followed in national and international boards.
Besides these patterns, there are a few topics taughtin all the states. They fall under the following ten broadareas of economics: (a) Nature and Scope of Economics;(b) Statistical Tools and Sources of Statistics; (c)Microeconomics; (d) Macroeconomics; (e) DevelopmentEconomics; (f) International Trade; (g) RegionalDevelopment; (h) Developmental Issues; (i) SectoralIssues and (j) Public Finance and Financial Institutions(Srinivasan, 2008).
NCERT recommends four courses - one persemester, the rationale behind the syllabi structured isunclear in most state syllabi documents. In some states,theoretical topics and economic issues are mixed upand provided whereas in others, they are taughtseparately during the first and second year respectively.
In a few states while adopting the NCERT syllabi ordeveloping their own syllabi, students are taughteconomic issues of their own states. For example, inAssam, Goa and Rajasthan, a few topics containingeconomics issue pertaining to these states are alsotaught. This shows that students studying in schoolsaffiliated to state boards are encouraged to develop theunderstanding of the regional perspectives whereas theircounterparts studying in schools affiliated internationaland national boards (CBSE, ICSE and IB) areencouraged to develop regional, national andinternational perspectives.
Some state syllabi appears not to any provideperspective and do not the details of course objectivesand specific objectives. For example, it is stated in MadhyaPradesh syllabi document that the main aim of thesyllabus is to develop "student's competence for higherstudies in colleges and universities. Hence, basicknowledge of the subject, related to theory and applied

Handbook for Economics Teachers 21
aspects, should be imparted to the students". Syllabusdocument of both Tamil Nadu and Madhya Pradesh showthe teaching the course content as the objectives ofteaching economics. The expected specific outcome ofteaching the topic, "economic growth and development, isto "To make the students understand the concepts ofeconomic growth and development." This lead to difficultyfor economics teachers in their classroom practices. Theyhave to invent course and topic-wise instructionalobjectives. This could be one of the important reasons fortheir dependence on particular textbooks.
The economics syllabi appear to be over-burdening(Srinivasan, 2008): A large number of topics are given inthe syllabus - both outdated and latest ones. For instance,the syllabi of Tamil Nadu Board cover almost all economicstopics taught at the undergraduate level. In the first year,topics covered are: (i) economic growth and development,(ii) population, (iii) poverty, (iv) unemployment, (v) planning,(vi) agriculture, (vii) industries, (viii) banking; (ix) foreigntrade; (x) human resource development; (xi) statistics -measures of central tendency, measures of dispersion,index numbers. Another nine topics are included in thesecond year viz., (i) nature and scope of economics; (ii)basic economic problems; (iii) theory of consumerbehaviour; (iv) laws of demand and supply; (v) priceequilibrium; (vi) market structures and pricing; (vii)marginal productivity theory of distribution; (viii) simpletheory of income distribution; (ix) monetary and fiscalpolicies. One may wonder how all these topics could becovered in 216 hours. The West Bengal economics syllabialso have similar structure. The Maharashtra Board stillprovide 10th FYP as part of the course where as India hasmoved to implement 12th FYP. All these factors led totextbook developers to present contents like guidebooksin which bulleted points are given for each syllabus topic.This promote rote learning and may pose a major challengeto learners in understanding economic theory and issuesbetter achieve the objectives of teaching economicscurriculum as envisaged by the curriculum developers.

REFERENCESBose, Sukanya and Arvind Sardana (2008), Teaching
Economics in Schools, Economic and PoliticalWeekly, August 9, 2008.
CBSE (2008), Senior School Curriculum 2010 MainSubjects vol. I, Central Board of SecondaryEducation, Delhi.
IBO (2003), Diploma Programme Guide: Economics,February 2003, International BaccalaureateOrganization, Wales, United Kingdom.
NCERT (2005), National Curriculum Framework2005, National Council of EducationalResearch and Training, New Delhi.
NCERT (2006a), Syllabi for Secondary and HigherSecondary Classes, National Council ofEducational Research and Training, New Delhi.
NCERT (2006b), Syllabus for Classes at theElementary Level, National Council ofEducational Research and Training, NewDelhi.
Srinivasan, M.V. (2005), "Economics Education inIndian Schools: Role of NCERT," Edutracks,July, pp.21-26.
Srinivasan, M.V. (2008), "Teaching Economics: Acomment" Economic and Political Weekly,October 18, pp.77-79.
WEBSITES OF BOARDS FROM WHERE SYLLABI DOCUMENTS ARE
AVAILABLE
http://www.cbse.nic.inhttp://www.cisce.orghttp://www.tn.gov.inhttp://mpbse.nic.in/academics.htmhttp://rajeduboard.nic.in
Economics Education in India: A Review of Syllabi22

ChapterChapterChapterChapterChapter 3
Planning for EffectiveTeaching of Economics
Planning is required at several levels if a goodeconomic education programme is to result. Aproperly designed economic education programme
focus attention upon those understanding, attitudesand skills, which ought to be learnt by every citizenirrespective of who he is and where he lives. Thesepurposes, as stated in National Curriculum Framework2005 are the common threads woven throughout thecurriculum units for teaching economics at all levels.Broad goals, objectives and content areas have also beenspecified in NCF 2005 for teaching economics at theHigher Secondary level. Since each school, each class,each child presents some degree of uniqueness inbackground, interest and special needs, curriculumplanning necessarily becomes more specific and detailedas the classroom level is approached. The planning atthis level thus becomes teacher specific. From planningcurriculum units we move on to the planning of teachingunits which are prepared by the schools and teachersbased on the whole. In this chapter an attempt will bemade to develop the guidelines needed to prepare suchresource units which would help teachers to plan outtheir day-today activities in economics classes.
"Sometimes a teacher might say I planned the topic- Balance of Payments so well and the whole thing fellflat. But the other day I just went to the class and startedoff; and this lesson on Poverty I taught was terrific. So,

Planning For Effective Economics Teaching24
why plan?’’ This can happen. Planned lessons may notalways go well as expected. Instead of abandoningplanning, one can try to review the strategy and thepoints of failure. The reasons could be many. Thestudents may not be in a mood to listen or work. Thebeginning was wrong, the content should have beenapproached differently, the material was not well sortedso the students messed it and so on.
A lesson plan is a guide and there should always bescope for changes; the teachers should keep scope forhandling a particular content and material in differentstyles in the event of unanticipated reactions in the class.Then, for many schools there may not be any choiceabout writing out lesson plans. Most schooladministrators require teacher to do long term planningand also submit daily lesson plans. The fact that lessonplans must be submitted is an indication of the needfor planning the content, strategies, assignments,material aids, evaluation and so on. How it is done is ateacher's prerogative. The teacher is the most crucialfactor in planning Teaching Units.
It is very important here to draw a distinctionbetween the Textbook Units and the Teacher madeUnits. The Textbook Units normally represent the unitstructures presented in the syllabus. The textbookspublished by NCERT follow the course structure anddetails suggested in NCF. The Textbook Units follow alogical sequence to make the write up reader friendly.For example, the narration of facts and concepts relatedto National Income ought to be presented in such anorder that each concept is explained separately one byone, explaining the components of the respectiveconcepts. Comparative analysis of the components andthe illustrations can follow thereafter. Teaching Unitshowever, might follow a different order. The TeachingUnits have to consider the transactional aspects of thesubject matter. Achievement of the goals of curriculumalong with the learning outcomes have to be visualisedin varied teaching-learning situations in a specificclassroom setting from the learners as well as theteacher's perspective. Therefore, the sequencing of the

Handbook for Economics Teachers 25
content could be different. This is a very demandingtask and requires a multiple task-oriented strategy tobe structured for a given period of time. A TeachingUnit has to be flexible enough to allow a completereorganisation of the subject matter if the situation sodemands. A Teaching Unit, often called an Unit Plan,'comprises of a complete plan of teaching a specific topicor an area of a subject with a set of interrelated topicsfor a set of learners. It would consist of the advanced orpreconceived planning of all kind of preparations,activities types of learning activities required to launch,proceed on and evaluate the given contents.
The inputs of an Unit Plan
Various components of an Unit Plan in economics are :(i) Objectives(ii) Content organisation(iii) Preparation of material
• Material for developmental activities.• Enrichment material for the enhancement of
skills and abilities.• Provisions for individual differences
(iv) Sources of information(v) Developmental procedure - approaches,
methods and teaching - learning activities(vi) Evaluation plan(vii) Time planA good teacher prepares a Perspective Plan for the
whole academic year, where the entire syllabus is lookedinto and a termwise plan of different units is prepared.This can clear confusion created when the concernedteacher is absent and another one takes over. Also, itleads to transparency and coordination among thegroup of teachers, teaching different sections. Besidesthe over all plan, each unit / content area needs to bestructured with regard to the objectives, contentcoverage, methodology, specific learning activities andso on, as laid down in the basic components of aTeaching Unit. Let us briefly discuss each componentof a teaching unit.

Planning For Effective Economics Teaching26
Objectives
Contextualizing the objectives of teaching specializedacademic courses at the Higher Secondary Stage, NCF2005 clearly states. “It is expected that the study of asubject will enable children to develop those skills andabilities to make judgement, analyse rival claims andevidence, enter into debates, and undertake independentproject work using a wide range of resources.” It isevident that within the given syllabus and the textbookunits, the teachers need to carefully perceive the specificobjectives for the chosen content.
Acting with an aim allows us to act intelligently”, saysNCF 2005. “The class, the classroom, and relatedlearning sites are spaces where the core of educationalactivity takes place. These must become spaces wherelearners have experiences that help them achieve thedesired curricular objectives. An understanding oflearners, educational aims, the nature of knowledge andthe nature of School as a social space, can help us arriveat principles to guide classroom practices”. Thus, morethan the content, the most important task in settingthe objectives is the learner. Knowledge is to be acquiredin the learner’s context. The teacher has to seek theanswer to the very basic question:
• why should my learners acquire thisknowledge?
• what contribution will the study of this topicmake toward helping the children becomemore competent in life?
Content
The next step is to organise the content to be coveredin the Unit in a logical sequence that suits the learners’level of understanding. Planning to teach a specificcontent area would involve the knowledge andunderstanding of the related concepts. The conceptsin Indian Economic Development for example providethe baseline structures in developing the subject matterwhich revolves around a set of events, issues and

Handbook for Economics Teachers 27
concerns reflected in problems, policies andprogrammes of action. These concepts are importantto develop an understanding of the fundamentalprinciples and premises taught at higher secondarylevel. Planning a unit to help the learner relate theeconomic concepts, theories and generalizations toeconomic problems and policies is very important inunderstanding the subject matter of Indian EconomicDevelopment. The content and the concepts covered ina Unit also need to be sequenced so that the requiredlearning activities fall in line.
Sources and Materials
An important area of working at this level is the teacherpreparation. Various sources tapped and materialcollected by the teacher which would be required duringthe process of learning, by both the students and theteacher. While teaching Units from Indian EconomicDevelopment, several charts, graphs, flow charts,handouts, worksheets, models, pictures, articles, films,filmstrips, OH transparencies will have to be preparedas support materials.
Evaluation and Assignments
The Unit Plan will also consist of details of all theassignments and evaluation strategies to facilitate on-going evaluation of the learners' performances shouldbe thought of and the preliminary preparation for thesame done in advance. The last minute changes andthe alternatives plans could always be made while theUnit is in the transactions mode.
The concept of evaluation is to be understood witha changed perspective. As mentioned in the guidingprinciples of NCF 2005. "The examinations should bemade more flexible and integrated with classroom life."This is possible only when the process of evaluation ismore formative in nature and integrated with thelearning activities, as and when they are performed.Whereas every activity is not to be evaluated,

Planning For Effective Economics Teaching28
examination need not be the only method of evaluation.Nevertheless, the progress made each time has to beassessed transparently, to motivate the children anddevelop confidence in whatever tasks they do. Since thelearning takes place in varied situations and through avariety of tasks children do, the evaluation should alsobe broad based. All such abilities and skills focusedduring the learning processes should be assessed."Participation, interest and level of involvement, extentto which abilities and skills have been honed are somemarkers which can help teachers to gauge the benefitsof what children learn and gain through such activities",says NCF 2005. The teacher should develop strategiesto evaluate the performances accordingly. However, theexamination needs also not to be ignored. The teachersare required to prepare materials to cover the exercisesgiven in the textbooks as well.
Time Planning
Time planning which is integral to teaching is one ofthe objectives of learning too. Since time managementis an important skill of the skill development programmein a subject, special efforts should be made in thisregard. While structuring the activities for a day’s planit is important for a teacher to preconceive the timespent on each activity in the class. The students mustlearn to perform a task within the stipulated time e.g.when a group discussion as a developmental activityon the consequences of population growth in India isorganised in the class, the teacher will distribute somematerials on different aspects of economic development,to be read by each group as home assignment. Theywould be expected to elicit the important points, writedown a Power Point Slides and do a 5 minutepresentation in the class. The rest of the class will beprovided with a handout of the same for reference duringthe presentation and discussion. The teachercoordinates the points, helps each group develop theirpoints and summarises to make the discussioncoherent. The material could be displayed for a free-

Handbook for Economics Teachers 29
time reading and later could be filed by each group. Tosee that the learning is optimum and participationmaximum – each groups’ material must be photocopiedand distributed to all the learners before the discussionstarts. Thus reading, referencing, writing and presentingcan be clubbed in a single activity by making sure thetime limit for every activity during the class hours. Everyother activity in the classroom should be well structuredand managed according to the time available for it.
The next stage is to prepare the details of a particularday’s lesson. The specific activity or set of activities alongwith the complete classroom organistion strategy shouldbe planned out step-wise. Keeping in mind the specificobjectives, the materials to be used should be ready. Adaily lesson plan is different from a Unit Plan in thesense that it is the actual plan of work for a day. Theobjectives, content and the procedural plan should bewritten down step-wise. The trainee teachers often haveto do more preparations so that they may not forgetand as for the reason that their plans are required forthe supervisors. The practicing teachers who haveenough experience of managing the content and thelearners with sufficient ease may just prepare a draftof such a plan. But that does not eliminate the role ofplanning for them either. All teachers must plan andprepare their lessons. Those who don’t, harm theirlearners to unknown limits.

ChapterChapterChapterChapterChapter 4
Teaching a Topic in Indian EconomyUsing Unit Plans
• An Overview of the Unit• Sample Unit Plan
This Unit comprises of the chapters dealing with thedevelopment of different sectors of Indian economy,before and after independence. A critical review of policies,programmes and achievements of the economy in theperiod before the economic reforms and the post reformera is presented. It is suggested that a complete overviewof the economy at present, the past legacy, the dark anddestructive phases, the recovery phase, along with thepresent status of a sector could be taught easily, if thediscussions over a theme are carried forward andbackward in a time line fashion. This kind of contentlinkage is thought to be helpful while linking the presentwith the past.
It is often observed that children find it easier to relatethe facts when we move from present to past. Thepresentation of data and the respective comparativecontent analysis becomes more complete and logistic. Itis also believed that this kind of thematic organisationof content will save a lot of time and repetition whilestrategising a particular learning activity. Thus,presenting a wholistic picture of a sector of the economymeaningfully will be possible.
In this chapter one teaching unit based on the topictitled: Growth pattern of Indian Economy– Before andAfter Independence is presented.

Nevertheless, if a teacher feels uncomfortable withthis arrangement, or, while discussing the conditionsof a sector of the economy, the inferences from the otherareas become inevitable, there should be no such linesdrawn. The class can easily switchover from one sectorto the other.
Sample Unit Plan given here presents the contentareas to be covered and the learning objectives. Basedon the objectives the instructional strategies have beenplanned. The details of the developmental procedure fora particular content and the respective activities are alsogiven. The planning is done in such a manner that theclass and the home assignments are woven together. Mostassignments done by the students are developmental innature, i.e., they facilitate the teaching - learning process.Care has been taken to incorporate the exercises givenat the end of the chapters of the textbook in theworksheets, so that the students do not find the teachingand the testing alien. The subject matter in the Unit Planhere is approached differently than how normally theteachers teach. A comprehensive approach to facilitatethe comparative analysis of the economic trends,concepts, processes and policies is presented here.Learning through discovery is attempted, hence themethodology is child centred. Keeping the learner in thefocus several activities have been planned to see that theconcepts as the foundation stones and the contentstructures are not diverged. It is expected that the learningwill take place in the multiple settings. While exploringthe issues related to the growth patterns, on their own,the learners develop their own perspectives, givejudgements on the developmental processes andachievements of our economy. They surely reconstructthe knowledge during the processes of understanding.
Thematic Organisation of theContent
Content area I
India's Economic Development – before and afterindependence
Handbook for Economics Teachers 31

Teaching a Topic in Indian Economy Using Unit Plans32
• Developmental goals - Five Year Plans.• Structural Composition - GDP, GDP-Per Capita.• Occupational Structure
Content Area II
Demographic conditions – before and afterindependence.
Content Area III
Agricultural sector - growth pattern-before and afterindependence.
• Characteristics of Indian agriculture.• Agricultural production, problems, policies and
achievements.
Content Area IV
Industrial sector – before and after independence• Growth pattern of Indian industries• Overview of production, problems, policies and
achievements before 1991.• An assessment of the economy after economic
reforms of 1991.
Content Area V
Infrastructure and their role in the development ofIndian economy.
• Education as social infrastructure leading tohuman capital for motion
• Health as a social infrastructure.• Energy as an economic infrastructure
Out of the five themes forming this unit's content, thedetails of the teaching strategy for one are given here:
Sample Unit PlanSample Unit PlanSample Unit PlanSample Unit PlanSample Unit Plan
Class : XI Topic : India's Economic Development –Before and After Independence
Content Area 1India's Economic Development
1.1 The sectoral division of the economy representingits institutional set-up and the mixed economicsystem.

Handbook for Economics Teachers 33
1.2 Colonial nature of economic policies -protectionism, production structures
1.3 Development planning and Five Year Plans - Growthof GDP & GDP-PC before and after independence.
1.4 Development goals - Growth equality, self relianceand modernisation
1.5 Structural composition, occupational structurebefore and after independence
Objectives
This area of content will help the learners to understand– how an economic system works– various sectors, processes and institutions of an
economy.– analyse the trends in the growth of GDP, GDP-PC,
pattern of structural growth and occupationalstructure of Indian economy during the British andthe post-independence period.
– critically understand the long-term goals ofdevelopment planning in India.
– be sensitive about the glorious past of the country'seconomy and the systematic destruction, in avariety of ways, done by the colonial rulers.
– develop the skill of critical thinking, a positiveattitude towards the economic development afterindependence.
– acquire the social skills of assuming responsibility,taking turns, respecting ideas and rights of others.
– be able to prepare group reports, summarise theinformation collected, and present it in acomprehensible manner.
Time
• 10 study periods·• A few hours (1 hour everyday) spent at home doing
preparations, reading, solving work sheets.
Resources
• Economic Survey (India) 2012-13• World economic survey 2012-13• Five year Plans (XIIth Plan)• UNESCO Handbook
Materials
Power Point Slides on Sectoral Division of an economy.• Handout to discover production patterns before
independence.

Teaching a Topic in Indian Economy Using Unit Plans34
• Reading materials as case studies on someeconomies of world
• Handout and a Power Point Slides to teach the GDPthrough the Five Year Plans.
• Handout on goals of five year plans - probingquestions
Procedure and Suggested Activities
Instructional Strategy 1
Activity : Class discussionTeaching Point : Institutional set-up of an economySpecific objective : To get acquainted with the basic
structural division of activitiesconstituting an economic system.
Time : 1 study periodMaterials : (i) Power Point Slides containing
the generalization and theflow chart.
(ii) Students' Handout for hometask
Procedure
• Tell the class that they are going to recall the basicconcepts of an economy and its institutional set-up which they learnt in class X.
• Ask them to name one economic good/service theyuse in their daily life.
• Write it down on the board in a manner to develop athree fold sectoral division of the economy, depictingits institutional framework. Develop theinterdependence of all the sectors for one item (Box1).
• Let all the students develop their individual charts.Three basic questions they must answer, shouldbe written on the board –i) Ownership of its enterprise- (who owns the
enterprise?).ii) Type of productive activity it is (what type of
productive activity it is?)iii) Location of the enterprise (which area is it
located - rural or urban?)
Conclude by generalizing – explain through a PowerPoint Slides
Sectoral Division of an Economy (Class Task)

Handbook for Economics Teachers 35
• Dif ferent sectors of the economy areinterdependent. They can't function independently.
• Often, the same good can be produced by morethan one sector.
• Goods produced in the primary sector are usedas intermediate goods for processing by thesecondary sector and vice-versa.
• Productive enterprises could be situated eitherin the rural or urban areas.
• Goods produced in the rural sector could bemarketed in the urban sector and vice-versa.
Flow chart of interdependence among the differentsectors of an economy.

Teaching a Topic in Indian Economy Using Unit Plans36
Prepare for the next class: assign home task. Leteach student choose any 10 goods and services andfind out from their grand parent / great-grand parentwho was of their age before independence, the kind ofgoods they used, their prices, quality, durability,availability and usability.
Prepare a 'Handout' -write down the task with thecriteria and the guidelines. Also mention the class taskbased on this work which students will have to perform.
Students' HandoutStudents' HandoutStudents' HandoutStudents' HandoutStudents' Handout
Home Task : An investigation into the 'ProductionStructures during the British rule, before independencePick up 10 goods / services or both which you use inyour daily life.Find out from your grand parent / great-grand parent who was a citizen of India beforeindependence the following features of those goods:• the kind of good it was• its price• quality• durability• availability• variety• origin
Write down the details in order (brief) and preparea report covering the above points. You will be expectedto share your findings with the class. You can also askquestions like –– Do you think common people were happy?– Were you happy?– Did you get enough money to feed your family?– Could you study in school / university?– Did you have T.V./radio? How many hours did you
spent watching / listening to radio?
Instructional Strategy 1.2Activity : Group discussion developmental
activity based on the teachingpoint - production structuresduring British rule
Specific objectives : • To do a comparative analysis ofthe production structures in thecountry, present and in the past

Handbook for Economics Teachers 37
• To share each other’s views.Time : 1 study period or approx. 40 mts.
Procedure
• Divide the class into groups and let them discusstheir findings.
• Ask them to prepare a group report on the givencriteria highlighting some aspects of theproduction structures existing in Indian economyduring British rule.
• Write down some other points or guidelines onthe board - e.g. common exports, imports,agricultural goods, different industries whichwould have existed, type of farms, transport andcommunication services, garment factory, carindustry and so on.
• Give them 10 minutes for the above task and leteach group take 3 minutes to present their report.
• The teacher should highlight the status of anindividual sector and other economic conditionsat that time.
• Let the students display their interview andpresentation on the wall / board, groupwise, sothat those who could not speak also share theirwork with the others. After the unit is launchedthrough these two activities, the students aremotivated to know more facts about Indianeconomy - its present status and past conditions- sectorwise.
Instructional Strategy 1.3
Activity : Case studyTeaching point : A justification for India's mixed
economy and planned approach todevelopment.
Time : 1½ to 2 study periods.Materials : Extra reading material on
economies of the world (Refer toTextbook page 17 and Box 2.1).
Specific objective : To do a comparative analysis ofIndian economy with some othereconomies of the world.

Teaching a Topic in Indian Economy Using Unit Plans38
Procedure
• Provide material to the students on someeconomies of the world e.g. Russia, Japan, USA,China, India. The material could be in the formof their experiences on the journey towardsdevelopment.
• The students should also be asked to look upother materials on their own depending on theirresource availability (Home task). Let them readthrough the material and come prepared todiscuss.
• The criteria for discussion could be given by theteacher on the board.
• Class task : Group discussion with each grouptaking turns.
• Systems of economic organisation• Their pattern of growth• Their problems• Their policy parameters.• Some time can be spent on the same day to help
students read meaningfully in the class itself.Later the discussions can continue when theyhave read the material and prepared to discussfully.
• They should be given some time in the class tocompile their points and decide who would speakwhat?
• The teacher should try to substantiate andenrich the presentation.
• Later the teacher should conclude by giving ajustification for India's system of economicorganisation.
Sources to be tapped
• World Development Report• Economic Survey• Five Year Plans Report
Instructional Strategy 1.4
Activity : Analysis of trends through data

Handbook for Economics Teachers 39
Teaching point : Planning for development - Five YearPlans
Specific objective : To analyse the plan wise growth ofGDP.
Time : 1½ to 2 study periodsMaterials : 1Chart / Power Point Slides
accompanied with a student'shandout2. Students' handout on goals of FiveYear Plans
Student's Hand out (Class task)Student's Hand out (Class task)Student's Hand out (Class task)Student's Hand out (Class task)Student's Hand out (Class task)
Table showing all the Five Year Plans with Years.1951-2013
Five Year Plans Years GDP GDPPC Long Term Goals
I
II
III
IV
V
VI
VII
F.Y. P VIII
F.Y. P IX
F.Y. P X
F.Y. P XI
• What is GDP? How is it different from the NI?• What is GDP-PC?• Why do you think the rate of GDP increased more
than GDP-PC?• Why has GDP increased? Is it enough?• Why could it not increase more?• Has the increase in GDP and GDP-PC helped India
develop and develop in the right directions?• Why were these goals of development integral to
our five year plans?• How far have we moved ahead to achieve them?• Why didn't British also aim at these goals?

Teaching a Topic in Indian Economy Using Unit Plans40
Procedure
• Introduce the students to the planning phase -from the beginning till present and the trendsin the growth of GDP and GDP-PC.
• Let the students read through the handout andelicit some obvious trends in the growth - withthe help of the chart / Power Point Stides Askquestions in between to lead you to thediscussion on disparities, inequalities and theother goals of self-reliance and modernization.
• Frame some questions related to the gaps in theeconomic status of the people causinginequalities. Give the handout to the studentsas home task. Let them pick-up one questionfor themselves and do some reading - originalthinking on the question and answer like aneconomist and a policy maker for a progressivenation like India.
Distribute the following handout and explain thehome task to be done by the students as preparationsfor the next class task. Also refer Textbook page 19,20, 22, boxes 2.2, 2.4, and 2.5
Students' Handout : Goals oStudents' Handout : Goals oStudents' Handout : Goals oStudents' Handout : Goals oStudents' Handout : Goals of Five Yf Five Yf Five Yf Five Yf Five Year Plans (Homeear Plans (Homeear Plans (Homeear Plans (Homeear Plans (Hometask)task)task)task)task)
Imagine yourself to be an economist and a policymaker for a progressive nation like India. Fromwhatever knowledge you have, of the three phases ofIndian economy, pick up one of the following questionsrelated to the gaps between the economic status ofpeople causing inequalities. Do some reading andthinking and present your point of view in the nextclass.1. How do you think it happened in India that some
people are very poor and some very rich?2. How can this be prevented?3. Does technology have to do something with it?4. Should there be choices regarding which technology
should we use?5. Do we need to redefine modernization for us in our
own interest?6. Before thinking global, do we need to think as
national and, if national means the entire nation

Handbook for Economics Teachers 41
i.e. those who live in affluence, as well as the onesliving in poverty?
7. Can the benefits accruing to the two groups ofpopulation be separated?
8. Would indigenous technology lead to higher / samegains in different fields?
9. Do we need to do more research in the field ofindigenous technology and facilitate its uses formasses?
10. Suggest a plan of action.
Instructional Strategy 1.5
Activity : A discussion debate -Teaching point : Equality, self-reliance and
modernisation as long- term goalsof five year plans in India.
Specific objective : • To create a sensitivity towardsthose who remain poor forgenerations.• How to help the poorest of thepoor and make sure that peopledon't get trapped into poverty?• How to work for bridging the gapbetween poor and rich?
Time : 2 study periodsMaterial : Handout with probing questions
(given in the previous class ashome task)
Procedure
• Let all the students form question wise groups andhave a discussion on what work they have done(10 minutes) and present their views on the issuethey have researched upon.
• Give all the members of a group freedom to present.• Reflect on what students say. Add on to the
information collected and conduct a research baseddialogue. Do some research yourself and on thefeasibility of indigenous technology - its long termuses, gains and losses in terms of growth,sustainability, self reliance and modernization.Present some case studies with facts.
• Try to help students link all the four goals and howthey can be realised simultaneously.

Teaching a Topic in Indian Economy Using Unit Plans42
• At the end, motivate students to take up a projecton indigenous technology
• Suggest some topics and give them time to thinkand choose.
Instructional Strategy 1.6
Activity : Launching a ProjectTeaching point : Planning the project - Making Bio-
Fertilizer for School PlantsSpecific Objectives : To sensitize the students about the
uses of indigenous technology andits role in achieving a sustainablegrowth.
Time : 1 study period.Materials : • A chart with pie graph/an Power
Point Slides of the same• A class worksheet to work along-side the discussion.
Procedure
Tell students to undertake a project, suggest sometopics and explain what a project is and how to do it?All the students can do one project in small groups, or,different groups can do different projects. Give them acomplete plan of the project. For example the followingwork plan could be prepared (in consultation with thestudents) for project ‘Making Bio-Fertilizer for SchoolPlants.
I. Preparation of the Schedule of work for the Project1.1 conducting research - collecting relevant
literature - 1 week1.2 reading literature and writing down posters
and exchanging - material.-1 week1.3 talking to the gardeners and school Principal
- one day during off time.1.4 working hours - S.U.P.W. periods.1.5 starting the work - digging the pits - 4 groups
in 4 places (10x4) 40 students.1.6 2 weeks for digging the pit - after which1.7 starting to put leaves, biodegradable waste
from canteen etc.1.8 every day 10-15 minutes of working;
checking the venues.1.9 work continues for 3-4 months.1.10 digging out the manure.
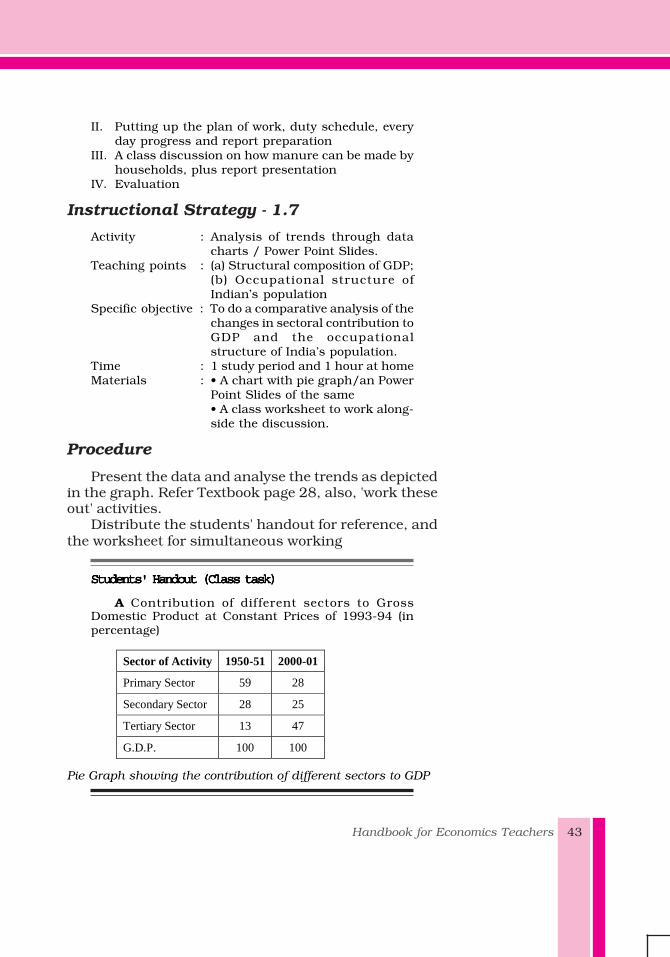
Handbook for Economics Teachers 43
II. Putting up the plan of work, duty schedule, everyday progress and report preparation
III. A class discussion on how manure can be made byhouseholds, plus report presentation
IV. Evaluation
Instructional Strategy - 1.7
Activity : Analysis of trends through datacharts / Power Point Slides.
Teaching points : (a) Structural composition of GDP;(b) Occupational structure ofIndian’s population
Specific objective : To do a comparative analysis of thechanges in sectoral contribution toGDP and the occupationalstructure of India’s population.
Time : 1 study period and 1 hour at homeMaterials : • A chart with pie graph/an Power
Point Slides of the same• A class worksheet to work along-side the discussion.
Procedure
Present the data and analyse the trends as depictedin the graph. Refer Textbook page 28, also, 'work theseout' activities.
Distribute the students' handout for reference, andthe worksheet for simultaneous working
Students' Handout (Class task)Students' Handout (Class task)Students' Handout (Class task)Students' Handout (Class task)Students' Handout (Class task)
A Contribution of different sectors to GrossDomestic Product at Constant Prices of 1993-94 (inpercentage)
Sector of Activity 1950-51 2000-01
Primary Sector 59 28
Secondary Sector 28 25
Tertiary Sector 13 47
G.D.P. 100 100
Pie Graph showing the contribution of different sectors to GDP

Teaching a Topic in Indian Economy Using Unit Plans44
Pie graph showing occupational structure oPie graph showing occupational structure oPie graph showing occupational structure oPie graph showing occupational structure oPie graph showing occupational structure of Indianf Indianf Indianf Indianf IndianPopulation.Population.Population.Population.Population.
Primary Sector
59%
Secondary Sector28%
Tertiary Sector13%
1950-51
Primary Sector27%
Secondary Sector25%
Tertiary Sector48%
2000-01
Sector 1950-51 1996-97
Primary Sector 72.1 67.7
Secondary Sector 10.6 12.7
Tertiary Sector 7.3 20.6
Evaluation : Besides the worksheets which willcontain questions based on the activities done by
students and the textbook exercises a specific strategyto evaluate the learners' performance is suggested asunder:
A seA seA seA seA self evaluation programme for the studentslf evaluation programme for the studentslf evaluation programme for the studentslf evaluation programme for the studentslf evaluation programme for the students
Please fill in the following proforma to help us knowyour learning outcomes.
Primary Sector72%
Secondary Sector11%
Tertiary Sector17%
1950-511996-97
Primary Sector67%
Secondary Sector
13%
Tertiary Sector20%

Handbook for Economics Teachers 45
1. I was asked to collect study material on thetopic……………………….
2. I looked up the following sources to participate inthe class discussion and do a presentation.1. …………….. 2. …………….. 3. ……………..
3. My views on the agricultural subsidies (any othertopic covered in the class) were as following:
……………………………………………………………………..................................................................................
……………………………………………………………………..................................................................................
……………………………………………………………………..................................................................................4. I consulted my parents / my friends / other teachers
/ some experts on this topic, and their views were:
……………………………………………………………………..................................................................................
……………………………………………………………………..................................................................................
……………………………………………………………………..................................................................................5. I visited the following places to collect information
PlacesInformation collected***
6. My group members were -• Happy / not happy• Cooperative / not co-operative• The ideas I contributed towards my group work
were-(i)
……………………………………………………………………............................................................(ii)
……………………………………………………………………............................................................(iii)
……………………………………………………………………............................................................7. I am better informed about the following topics /
subtopics in economics after the group discussion.
……………………………………………………………………..................................................................................
……………………………………………………………………..................................................................................
……………………………………………………………………..................................................................................8. I learnt the following new points as a result of my
own research on the topic (mention the topic youwish to ask the learners)
Teaching a Topic in Indian Economy Using Unit Plans46
……………………………………………………………………..................................................................................
……………………………………………………………………..................................................................................
……………………………………………………………………..................................................................................9. I have not understood the following points very well
……………………………………………………………………..................................................................................
……………………………………………………………………..................................................................................
……………………………………………………………………..................................................................................10. I need to improve my skills of -• Listening patiently and then responding• How to be precise while explaining my points.• How to present myself comfortably.11. I am still very confused about:
…………………………..…………………………….…………………………..…………………………….…………………………..…………………………….[Let the teacher write down the topic and theexpected confusions of the students].
12. Mention some of your other achievements /weaknesses, you discovered your plans to improveyour work.
……………………………………………………………………..................................................................................
……………………………………………………………………..................................................................................
……………………………………………………………………..................................................................................
This exercise may not directly cater to the needs ofthe examination but can surely help the learners andteachers in a variety of ways for example -
• will allow them do a soul searching.• will allow them to think critically on the teaching
points covered as a part of various activities.• will help them develop their own perspectives.• will help them work perspectives towards
building self confidence.• will evaluate themselves about what they’ve
learnt by revising the content areas covered

Handbook for Economics Teachers 47
during the activities and also, what they couldn’t.• in doing self retrospection• It will also help the teacher to know each learner
from his/her angle and evaluates objectively,assess her own teaching, redefine and redesignher developmental tasks, enrich her knowledgeand expectations of her learners moremethodically objectively and pleasantly.
Brief guidelines to prepare the unit plans coveringthe objectives, suggested methodology, teacherpreparations of the three other content areas i.e., II, IIIand IV of the sample unit are given in the followingpages. The teachers can prepare detailed plans byreferring these, the textbook and the sources mentionedon their own.
Content
Content area-IIDemographicconditions beforeand afterindependence
Content Area III• Agricultural
sector- growthpattern beforeand afterindependence.
Objectives
• To give acomparativepicture of thedemographicsituation in thecountry - beforeand afterindependence
• To help themread the datatables meaning-fully, elicit thetrends andcorrelate themwith theeconomicdevelopment ofthe country
• To present astatistical andfactual sum-mary of India’sagriculture, areview of
Suggested Methodology
A set of Power Point Slides or a chartdepicting the data related to the demo-graphic indicators can be used. Thestudents can be provided with a similarworksheet where in they can fill in thecauses for a trend noticed. The PowerPoint Slides will have only the populationstatistics and the worksheet will have thespace for the causes too.
• Some stories / case studies related tolandless labourer, barren lands, of amiddle man and of a village whereland reforms were not effective, couldbe distributed to the children ingroups to analyse the +ve and -ve
Teacher prepara-tions andsources
(i) A Power PointSlides or achart withpopulationstatistics
(ii) A worksheetfor studentsfor working inthe class.
(i) Look up thecase studiesrelated to landreforms and
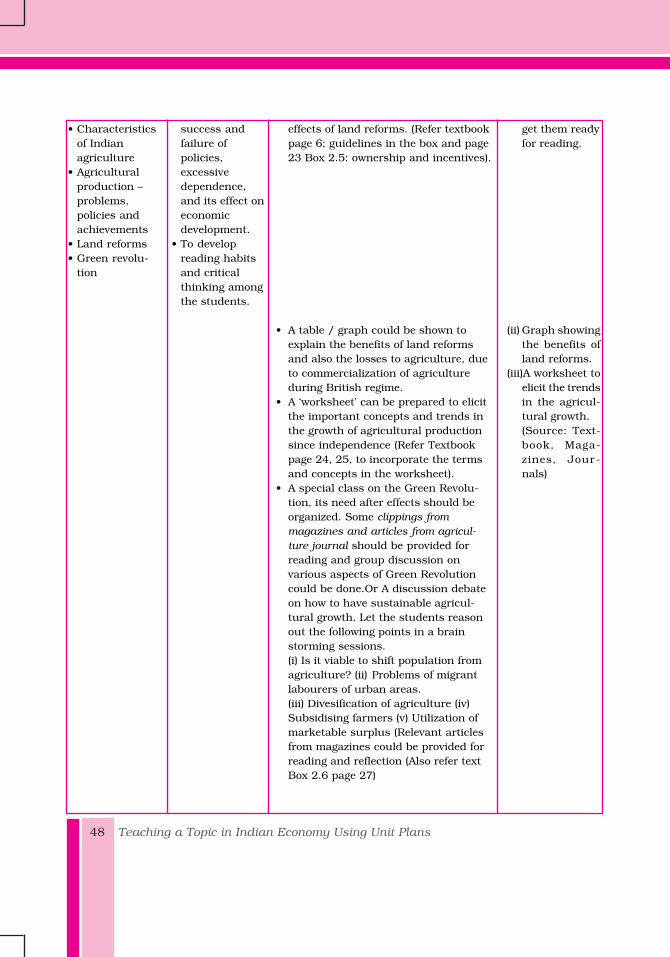
Teaching a Topic in Indian Economy Using Unit Plans48
• Characteristicsof Indianagriculture
• Agriculturalproduction –problems,policies andachievements
• Land reforms• Green revolu-
tion
success andfailure ofpolicies,excessivedependence,and its effect oneconomicdevelopment.
• To developreading habitsand criticalthinking amongthe students.
effects of land reforms. (Refer textbookpage 6; guidelines in the box and page23 Box 2.5: ownership and incentives).
• A table / graph could be shown toexplain the benefits of land reformsand also the losses to agriculture, dueto commercialization of agricultureduring British regime.
• A ‘worksheet’ can be prepared to elicitthe important concepts and trends inthe growth of agricultural productionsince independence (Refer Textbookpage 24, 25, to incorporate the termsand concepts in the worksheet).
• A special class on the Green Revolu-tion, its need after effects should beorganized. Some clippings frommagazines and articles from agricul-ture journal should be provided forreading and group discussion onvarious aspects of Green Revolutioncould be done.Or A discussion debateon how to have sustainable agricul-tural growth. Let the students reasonout the following points in a brainstorming sessions.(i) Is it viable to shift population fromagriculture? (ii) Problems of migrantlabourers of urban areas.(iii) Divesification of agriculture (iv)Subsidising farmers (v) Utilization ofmarketable surplus (Relevant articlesfrom magazines could be provided forreading and reflection (Also refer textBox 2.6 page 27)
get them readyfor reading.
(ii) Graph showingthe benefits ofland reforms.
(iii)A worksheet toelicit the trendsin the agricul-tural growth.(Source: Text-book, Maga-zines, Jour -nals)

Handbook for Economics Teachers 49
Content area-IVIndustry andTrade
– The process ofde-industrial-ization of Indianeconomy duringBritish rule.
– Industrial PolicyResolution of1956, basictenets of thepolicy.
– Growth ofIndian industrybefore 1991,production,problems andachievements.
– Achievements ofIndian industryafter economicreforms.
– Impact ofeconomicreforms onagriculture,industry,services.
• To develop anindepthunderstandingof the function-ing of aneconomicsystem and themacro levelindicators ofeconomicgrowth.
• To trace thepattern ofgrowth of Indianindustry andtrade, beforeand during thepost-indepen-dence era.
• To compare andcontrast thedifferent phasesof industrialgrowth, arguefor and againstthe policiesadopted by thegovernmentfrom time totime.
• Analyse thegrowth andcontribution ofprivate sector inIndia during thepost-reformperiod.
• To enhance theanalyticalpowers, and theskill of criticalthinkingthroughreading,reflection andpeer interaction.
• Begin the topic by organizing adiscussion debate by dividing theclass in four groups. The topics couldbe “controlling and regulating theeconomy hampered the growth anddevelopment of the country”
Or”The growth policy of mixed economicsystem, government regulation, hugeinvestments in public sector enter-prises has resulted in a diversifiedindustrial sector, a sustained expan-sion of agricultural output and stablegrowth in several other areas.”Provide articles from the latest issuesof magazines
• Strengthen the arguments given byboth the sides by presenting asystematic summary of the condition
• Articles fromlatest maga-zines.
Source : Yojana,Kurukshetraand Economic& PoliticalWeekly
• A flow chart toexplain theprocess of de-industrializa-

Teaching a Topic in Indian Economy Using Unit Plans50
of Indian industry and trade duringthe British. Prepare a flow chart todepict the process ofdeindustrialization and then explainthe features of the Industrial PolicyResolution of 1956 and trade policy.This could be done through a setPower Point Slides accompanied bystudents handout.
• The growth of public and privatesector can be taught by showing theinvestment patterns through bargraphs. Students can be asked toconstruct bar graphs be helping themto build a case for private sector. Adiscussion – debate can be organizedas suggested in the textbook page254, Suggested Activities, 1, 2 and 3,and also the hints given in the box onpage. 31.
tion of Indianeconomyduring Britishrule.
• A Power PointSlides tobriefly explainthe industrialpolicyResolution of1956,accompaniedby a students’handout of thesame forstudents torefer.
• A graph toshow the %growth ofindustrialproduction till1991 andduring thepost-reformperiodaccompaniedby a students’handout (ofthe same) anda worksheetfor simulta-neous working
• A pie chart /bar graph toshow theinvestmentsby the privateand publicsector.·Teacher toprepare thedata table anddistribute ashandout forthe prepara-tion of graphs

Handbook for Economics Teachers 51
• Develop a worksheet covering thegrowth of industrial sector in India.Situational questions can be framedand given as home task.
• A survey could be planned forelectricity services in the capital/states provided by private and publicsector enterprises e.g. DESU andNDPL. Refer Textbook, page 54 activity1 Case studies could be developed/prepared after the survey and presen-tations can be done. Students canlook up the websites of some compa-nies and find out their investmentpatterns, turnovers, sales etc. forguidelines (Refer 2, 4 activities on page55)
• The meaning of the following macrolevel concepts should be explainedstepwise with illustrations, to help thestudents understand the economicimplications of the various policies ofthe government.Foreign exchange reserves and foreignexchange markets • balance ofpayments, relevance of exports •surplus, export duties, importlicensing • tariffs, quotas • quantita-tive restrictions • stock exchangeoperations • role of direct and indirecttaxes • foreign direct investment •disinvestment, • outsourcing • RBIand its role in controlling and regulat-ing the financial institutions in aneconomy • devaluation of a currency •privatization •liberalization and •globalization.
• There after the teacher prepare flowcharts on the adverse effects ofeconomic reforms on agriculture,industry infrastructure, employmentand fiscal management could be usedto illustrate the above. (as explainedin the textbook page 49). These flow
by thestudents.Source:Textbook
• To prepare theworksheet forhome task
Source: Websitesof the respec-tive companiesTextbooks.
• Teacherprepared flowcharts
Teaching a Topic in Indian Economy Using Unit Plans52
charts will highlight the foul play ofvarious economic forces in theeconomy. This exercise can beaccompanied with the additional casestudies similar to the one given in theTextbook boxes on pages 49, 50.Different case studies could be given tostudents in groups for reading andreflection.
Guidelines for using the sample unit Plan
The plan of teaching unit presented here issuggestive only. Teachers should feel free to conductany other activities, which they think would gel withthe school they are working with, type of learners, andso on. For most teachers and learners, the activity-oriented approaches to learning will be a novelexperience. Therefore, several cautions will have to betaken to make sure, that the purpose of organisingactivity based learning is not defeated.
• Every such activity that a teacher chooses forher learners must be thoroughly organised :taking care of the class room management,design of the furniture, no. of children in theclass, availability of the material aids, theresearcher needed for enriching the content, timeplanning, and so on.
• The learners must be repeatedly taken intoconfidence that they ought to be serious abouttheir tasks; as, what they do is what they learn!The teacher is a facilitator and a support to themrather than a spoon feeder: that there is somepart of the syllabus behind an activity and thefun part of learning is to generate interest andinvolvement. It is a serious lesson throughexperiential learning rather than the lesson beingjust explained or taught by the teacher. However,the teacher will narrate, explain, clarify thedoubts, elaborate upon the facts, illustrate andgive all the details wherever necessary. Hence,

Handbook for Economics Teachers 53
direct teaching is not completely eliminated.• Since the students have to take a public
examination, the preparation for the samecannot be ignored; rather, it should be integratedwith the work which is planned. The activitiesand the tasks performed by the learners can inno way be besides the syllabus and theexaminations.
• Everytime children are performing out of classtasks, notes for the parents should go to apprisethem of the tasks and the purpose. The gapbetween the school and the home should notexist. Often, children neglect the school workwhen they cannot directly relate it to the syllabusand the examination. The teachers need to befirm and serious.
• Material aid production will have to be taken upin an on-going basis. Suitable and timelypreparation of material aids will not onlyfacilitate learning but teaching as well. Thematerials used in economics classes at this levelmust be content based and developmental innature to sustain the interest of the students.Preparation of the teaching - learning materialis a painstaking task. With large number ofstudents in a class, photocopying handouts,work sheets, reference material for all learnersmight be expensive - especially if the schoolsdon't sanction the funds. We submit here thatalternatives will have to be thought of! Theschools will have to be sensitised towards theneeds of the teacher and learners if the teachingmethodology is to change. There is no choice.One big reason for the learning to be monotonousis, the total dependence on the textbooks. Someteachers do use outside reading materials, butthey are very few. Teacher made materials whichsuit the local needs and facilitate well directedinteractions could only be of actual help.Interested teachers will have to work out viable

Teaching a Topic in Indian Economy Using Unit Plans54
solutions. Often the data supplied by the PublicReports, newspapers, magazines are either notsufficient, is incomplete, not updated, or messedup with the unrequired data. Such data needsto be sorted out, made complete or reprocessedto suit the needs of expected content analysis,interpretation and other learning outcomespossible.
• Whenever learners are put in working modethrough a story, question answer session, newsitem or a case study, it is very important for theteacher to decide, how would this material beused? For example, if it is a case study, theteacher has to decide whether she would read itout to the class, the class would read it on itsown and react immediately, or, would read athome and come prepared to reflect. How and inwhat manner would the learners respond? Theteacher wants some selective students to speakor, when there are 50 learners in a class, howwould the teacher make sure that every onereads, thinks and reacts in some or the otherway? These questions need to be answered andpractical decision ought to be taken before theclass commences. After all learning is every one'sright and not the privilege of some only. If somefieldwork/out of class activity is performed by50 learners, it is to be understood clearly, thatall 50 must have done some work or, to say itmore clearly that each one must have done thework in one's own way and as per one's ownability. Therefore the teacher must strategies thefeedback session in a manner to not to neglectany learner. Remember, large numbers andindividual differences are inevitable; and thereare no choices. Your strategies must be inaccordance to the size of the class and individualdifferences amongst the learners. It is wiser toaccept your learners as your strength rather thana road block.

Handbook for Economics Teachers 55
• Guidelines given in the sample unit plan shouldbe understood and followed along with theguidelines given in the textbook at variousplaces. An effort is made here to give thepedagogical guidelines and the classroomorganisation strategy with regard to the'suggested activity' or a 'work these out'suggestions of the textbook.

ChapterChapterChapterChapterChapter
Lectures, Discussions andStory Telling
"Some people talk in their sleep. Lecturers talk while other peoplesleep"
Albert Camus
Although lectures are ridiculed as the leastpreferred method for disseminating ideas andknowledge and for guiding and motivating
students, it is the most common classroom practice allover the world. Sloman and Mitchell (2002) definelecture as the "delivery of a course through a series ofpresentations by academic staff members to a group ofstudents usually with visual prompts and aids" (p.2).The Oxford Advanced Learners' Dictionary refers thisterm as "a talk that is given to a group of people toteach them about a particular subject, often as part ofa university or college course". Over the years, therehas been a change in the delivery of lectures from meretalk or one-way teachers' transmission of the coursecontent to the use of a variety of methods.
Factors such as (a) non-availability of supportmaterials, (b) the nature of syllabus (crowding ofsyllabus without deleting the outdated ones), (c) lack ofknowledge and interest among teachers inexperimenting with new ways of disseminating thecourse content, (d) lack of incentives for teachers, (e)examination system not permitting teachers to followflexible classroom practices and (f) high pupil-teacherratio (large number of students in each class) cause
5

lecture-based classroom practices resistant to change.However, perception about lectures have changed
from providing merely information of the course to asan important source to motivate, challenge students andenable them get insights from what is transmitted. Inthis chapter, we will examine how and why lectures arestill important method to teach economics and howeconomics teachers can improve their lectures byincorporating discussions and story-telling methods.
Why lectures?Suppose students are expected to learn, for example,
the theory of consumer behaviour in IntroductoryMicroeconomics course. This theory has beenapproached by various schools of thought differently.Not all the vast amount of knowledge generated on thistopic can be introduced to students. Textbooks due totheir own limitations may provide content materials ina highly condensed way. When the same information ispresented by a teacher, students get the opportunity toclear their doubts which may not be possible by use oftextbooks by self. We as economics teachers take notesusing prescribed textbooks, other graduate level booksand from a variety of study materials. We prioritiseinformation about the topic before presentation in acondensed format. In lectures, we give contextualisedexamples to illustrate a point. For educationaladministrators also, lectures are considered as best andefficient use of their resources. A large number ofstudents can be taught using this approach.
One of the major requisites for the economicsteachers in most schools is the completing the syllabusbefore the stipulated date. The problem is acuteparticularly for those who teach classes X and XII. Eventhough in most states, examinations are conducted inMarch, teachers of these two classes are expected tocomplete the syllabus by the end of December of theprevious year. This means a syllabus which is supposedto be taught for the whole academic year - 10 monthsneed to be completed in 7 months only. This realityforces the teachers to do injustice in economicsclassrooms.
Handbook for Economics Teachers 57

Lectures and Discussions58
Though lectures depend on many aspects, twoissues receive major attention - the maturity level ofstudents and time required to process the informationsupplied during lectures. One reason why educationistssuggest avoiding lectures in lower classes is thatstudents may not be able to understand what iscommunicated in lectures. The amount of informationyoung learners can keep in their short-term memory isvery less. Continuous flow of information in lecturesmay lead to loss of information kept in the memory ofstudents or may not be absorbed by them at all.Moreover, young learners learn when they are regularlyengaged in the learning process through activities.
Even the argument that lectures can convey all theinformation that the students are expected to know isbased on the assumption that students are mererecipients of the information and there is no need forother modes of engagement. One of the reasons whyteachers use lectures is the overcrowded syllabus.Teachers view that they are may not be able to completethe syllabus "in time" if they experiment any other modeof classroom engagement.
Preparing students
Before taking up a particular topic for lectures, studentsmay be asked to do some preparatory activities. Someof the ways through which this can be done are thefollowing.
1. Students may be asked to collect and readbackground information about the topic.Although most students in economicsclassroom may find it difficult to collectinformation from internet, teachers can askthose who can access internet and schoollibrary to get the details of the topic the teacheris planning to teach through lectures.
2. If the topic is in the middle of the course,teachers can ask students to revise what waslearnt earlier regarding the topic. Suppose theteacher is planning to teach the topic,

Handbook for Economics Teachers 59
liberalisation and globalisation in class XI.Since a topic similar to this was studied bythe students in class X, students may be askedto revise what they learnt in the class Xchapter. Teachers can also conduct a mini quizcompetition before the beginning of the lectureon class XI topic.
3. Ask students to raise questions on the topic tobe taught: this will help students tocontextualise the topic and its relevance.Students can be asked to read newspapers anddevelop questions on the topic which can bedisplayed as small posters.
4. Assign students to read the contents fromvarious textbooks. Most teachers informstudents to go through their textbook chaptersfor the next day's lecture. In order to knowwhether students read their textbooks, quizcompetition can be conducted on what contentis available on the same topic in differenttextbooks. If only one textbook is used by allthe students, students may be asked to visitschool library for reading about the topic.
Effective Lectures
Two important attributes of a lecture are: (i) preparationof content structure - all the information we wish tocover in a class needs to be structured in the logicalfashion and (ii) the content needs to be well presented.It is commonly believed that teachers need to havecharismatic personality to deliver the lecture. This isnot always true. If a teacher has given sufficient attentionon the structure and method of presentation, she canmake the students participate in the lecture and makethe lecture an effective learning experience for students.John Sloman, Chris Mitchell and Peter Davies findteachers to focus on four issues associated with theplanning the structure of classroom lectures:
(i) Familiarise students with course syllabus andlearning objectives and remind them regularly

Lectures and Discussions60
in each classroom lecture: In the beginning ofthe course lectures, teachers can informstudents what they are expected to learn inthe lecture classes in a student-friendlymanner. For example, if the objective of thelecture topic is to teach a particular economictheory say theory of income determination, itsproperties, how the theory works and how itcan be applied, she can state as they are. Itmay not be necessary to inform about skillssuch as development of cognitive andanalytical skills. In the beginning of eachlecture, its objectives with reference to thecontent need to be clearly spelt out to thestudents.
(ii) Use of contextual examples either from day-to-day life or from media: Even though a feweconomics textbooks provide examples toillustrate a particular concept, it is necessaryfor the economics teachers to keep in stockvarious up-to-date and historical examples.Glancing through a variety of textbooks,reading news papers and searching in theinternet will help them to get good examples.To be specific, real life - context specificexamples make not only make studentsshowing interest but also can help them tosee the relevance of what they are learning aseconomic theories. The number of examplesneeds to be appropriate - neither more norless. These have to be planned and workedout ones.
(iii) Manage the lecture pace: Since economicsteachers like others are expected to completethe syllabus in the stipulated time, they canplan to use classroom lectures efficiently.Teachers use various ways: a few select topicsand sub-topics (i) to be lectured, (ii) to be usedfor self-study and presentation; (iii) as projectwork - done either individually or in groups.When the number of topics is more given the

Handbook for Economics Teachers 61
limited time, dividing the topics would help inpreparing for the lectures.
Some teachers also circulate notes they preparedfor a particular topic after it got completed amongstudents so that they can be made available when thestudents are listening to lectures. It will help studentsto concentrate on what we say in the lectures.
Some scholars suggest that it will be better tocirculate the notes after completing the entire topic.Sometimes, if the notes are circulated before thebeginning of lecture, students do not attend classes forwhich teacher notes is available to them. We also haveto decide what we want students to do in lectures. Ifone of the purposes of lecture is to enable students toacquire the skills of rapid note taking, then specificinstruction can be given to the students on thoseoccasions. When a teacher use lecture as a method ofteaching a topic, she has to balance her pace ofpresentation on the basis of writing speed of students,their abilities and interest in listening, watching andunderstanding in the classroom.
It is necessary to understand the attention span -how much time students are able to concentratecontinuously from the beginning of a class. Studentsmay find it difficult to continue after 20 minutes. Theymay listen to teachers beyond this time period, whenthey are so fascinated or excited by what teacher issaying. Sometimes teacher gives an example in betweenthe lecture or use some anecdotes to bring back thestudents to the attention.
Some teachers also use various other techniques.For example, one teacher says that the use of blackboard during the lecture itself is a natural break forstudents to process the information presented in theclass lectures. This may be true for topics particularlyin statistics, microeconomics and macroeconomics, inwhich various diagrams, flow charts, mathematicalderivations and arithmetic calculations are used.
Using black board during the class lectures requiresome attention. When a teacher talk while writing,students will find it difficult to listen to what she says,copy what she writes on the blackboard and

Lectures and Discussions62
simultaneously notes on what she is saying. Also, somestudents may find difficulty in reading teachers'handwriting, or in hearing what a teacher say if herback is turned while writing.
Activities in class lectures
In most schools about 40-50 minutes is allocated foreach session. Within this time period, the teacher hasto recall what was taught previous day, lecture in theclassroom, taking attendance, if she happened to beclass teacher, giving notes, if not for all the topics, atleast for important topics and assignments to thestudents. As pointed out earlier, students are able toconcentrate only for about 20 minutes continuously atone point of time, teachers are required to make studentlearning not only active but also efficient. In eachsession / period, students are required to (i) identifyimportant points; (ii) distinguish them from others; (iii)identify when the same point is being presented indifferent ways; (iv) perceive connections between onetheory and the other or from one part of a theory andanother (v) relate examples given to illustrate a conceptand theory and think of more examples from their ownknowledge.
Teachers find students doing these processesprovided they are also assisted by them. Beforebeginning to lecture, asking a few questions on the topicwould help students is drawing attention and bringingthem back to the topic. The questions may be of thegeneral type. Suppose we wish to lecture on monopoly,asking students to list out some monopoly firms andwhy do they consider them as monopoly will draw theirattention. In this process, students can grasp thetheoretical points the teacher is making, having firstconsidered some examples and being able to relate yourarguments to them. Asking simple questions two orthree times in during the class lecture can help toprovide a break in pace, an opportunity for reflectionand reinforcement, and a check on students'understanding.

Handbook for Economics Teachers 63
Some teachers also suggest giving questions in theend of session / lecture period. This helps students toknow whether they understood the key points of theclass lecture. Teachers then asked students to writedown their answers and pass them to their neighbourto mark. When students see what their neighbour haswritten, they can learn from each other as well as fromthe teacher, especially if they are asked to spend a coupleof minutes justifying their answer to their neighbour.
Besides asking questions, teachers also drawdiagrams on the black board with some portions blankexpecting the students to fill in or ask students to raisequestions on the topic about which teacher is supposedto lecture. For example, if the teacher is supposed tospeak on Balance of Payments, students are asked toraise questions based on what they saw in news papersor television. They were also asked to list out theirsuggestions on a topic related to policy issues such aspoverty, employment and rural development. In classlecture, they can be given 5-10 minutes, to prepare suchlists with their neighboring students. A few enthusiasticteachers also collect news clippings on selected topicsand sub-topics and raise questions. These activities helpstudents to understand how economics curriculum isconnected to real life.
Since students tend to lose attention after 15-20minutes, giving students a break during the periodbecome essential. Even though short breaks help teachersto bring students back to original or near original level,they can also be used effectively linking the contents.Students can be asked to reflect on what they listened toso far in the class. They can be asked to refer to theirnotes. Using their notes, they can also develop mind-map diagrams. Some teachers simply ask student tokeep quiet or chat with their fellow students. A few othersassign students to read out some entertaining news /jokes related to the subject every day.
Use of Discussions in Economics Classrooms
It was pointed out earlier that there is a possibility thatall the topics of a course may not be possible for the

Lectures and Discussions64
teacher to cover within the stipulated time / periods.To tackle this, teachers can prepare a list of topics whichrequire teacher support and topics which students canmake self study and use discussion mode. Althoughteachers use sometime within the lecture classes fordiscussion, they are spontaneous. There is scope to givestudents opportunity for planned discussion as well.They are of various types. Important ones which canbe used in economics classrooms are (i) teacher initiated(ii) student initiated and (iii) small group discussions.
(i) Teacher Initiated Discussion
The teacher organizes discussions on certain topics,which are found difficult by the students even afterlectures. It requires the feedback of students so thatteachers put some additional effort to explain students.The basic aim of organizing this kind of discussion isto accomplish the needs of a variety of students. In thebeginning it may be difficult to get enough students'participation. As discussion continues, other studentswill also voluntarily participate. Teachers need to bepatient enough to give opportunities for all students toparticipate irrespective of their ability to communicate.
(ii) Student Initiated Discussion
Students initiated discussions is encouraged to knowtheir socialized learning interests. In order tounderstand their ability to lead a group for discussion,leadership skills could be integrated during the courseof discussion. Students may come out with a topic fordiscussion, which would informally a process of seekingclarifications with their teacher. Instead of seekingclarifications, teacher can motivate his students toorganize their course of discussion and the choice oftopics-requiring much of the discussion. The role ofthe teacher in this type of discussion is to organizecollaborative learning by the students themselves andif it is found not satisfactory, necessary discussionscould be organized by the teacher.
In this process all the students may not expect thesame level of discussion; depending upon their ability,

Handbook for Economics Teachers 65
a group leader can be nominated to receive and torespond to the sub-groups if time is found as aconstraint of opportunity for all students. It requiresthe implementation of democratic discussion bound bythe discipline when the decorum of discussion is allowedto develop their innate potentialities.
(iii) Small Group Discussion
This kind of discussion takes place in many classesparticularly when teacher wish to give a break fromlectures. If a teacher wishes students to come out withimportant points, she asks students to conduct smallgroup discussions. Since there will be many groups,teachers have to give some attention on each group sothat the groups are balanced having mixed group ofstudents. In peer group discussions, the students aresubjected to group comparisons and competition. Theyare encouraged to speak freely, frankly and openly tothe entire group. The group provides necessary feedbackto them regarding their level of development. To developthe ability to suggest and convincing skills small groupdiscussions are encouraged. This will help students toface large gathering or develop courage to talk in stages.
Role of the Teacher in Discussion
Regardless of the category, teachers play crucial role inclassroom discussions. She has to plan from scratch -forming groups, selecting the coordinators / leaders ofeach group, choosing topics or helping students to selecttopics, and so on. She has to facilitate discussion, boostup each discussing member's morale. Sometimes, thediscussion may turn into a debate, due to argument.The teacher must make better preparation and plan forknowing when and how to stop the discussion.
Each student has a point of view. Each has his orher ideas on the topic of discussion. Therefore, theteacher must have a broad background on the topicdiscussed. Sometimes, some members of the group maydominate in the discussion. Teachers are also expectedto clarify doubts in the middle of the discussion, if any.

Lectures and Discussions66
In discussions teacher help students to acquiresocializing skills. Teachers are to encourage impartially,manage time and physical resources required for groupdiscussions, and at the same time play the role ofacademic leader for all groups in the class.
Stories and Economics Teaching
Although textbooks form an important tool to teacheconomics, some exceptional teachers use a variety ofother materials to make the economics classroomsinteresting. Some of them propose story telling as amethod to teach economics.
Professor Wong Wei Kang, teaching in Departmentof Economics, National University of Singapore arguesthat story telling as an approach can provide intuitiveunderstanding of economic principles and can engagestudents' interest before they are fully committed tolearn economics in the higher classes. "A carefullyconstructed story brings out the 'flavour' of economicarguments and enables students to grasp the ideasbehind economic arguments better."
According to Kang, storytelling method is based onthe principle of analogy which means that economicprinciples can also be seen in domains that are notgenerally considered as economics. This approach helpstudents to see the connections between argumentsbased on economic theories and concepts in situationswhich people generally do not associate with economics.
According to the protagonists of this approach,stories used in economics classrooms can be categorisedinto three (a) a real world application of economicconcepts or theories, (b) examples from everyday reallife and (c) various fictions including novels, shortstories, fables, panchatantra and Jataka stories.
This approach is not new. Since the birth of moderneconomics, economists used various stories to illustratea particular economic principle or theory. For instance,Adam Smith used pin factory to explain the division oflabour in his book, An Inquiry into the Nature andCauses of the Wealth of Nations. Ricardo in his work,
Handbook for Economics Teachers 67
On the Principles of Political Economy and Taxation, useda story about production of wine in Portugal andEngland to explain the principles of comparativeadvantage. These examples are still used by economicsteachers when we refer the economic theories of AdamSmith and Ricardo (Boettke, 2005).
Economics textbooks brought out by NCERT on thebasis of National Curriculum Framework 2005 provideus with many real life examples to explain the economicconcepts. For example, in class XI Economics Textbook,Indian Economic Development, a fictional story of Anuand Sudha (see page 61) is provided to enable studentsto develop criteria of identifying the poor. Economicstextbooks meant for classes IX (Economics) and X(Understanding Economic Development) contain somany imaginary stories and real life incidences.
One may tend to think that it may not be possible touse fiction to teach economic concepts. However, plentyof evidence is available in the internet show teachersusing children's literature, novels such as RobinsonCrusoe, Atlas Shrugged Ayn Randam by Daniel Defoe,and etc. In the 1970s and 1980s, there was a crazeamong economics teachers to use mystery stories assupplement to economics textbooks (Margaret G. O'Donnell, 1989). Professor Daniel McFadden use classicnovel Robinson Crusoe, to teach production possibilitycurve and other economic concepts.
Teacher needs to be aware of the entire story or novelselected to teach and concepts she expects students tolearn while listening to the story / reading the novel.The teacher is also expected to know the background -economic and social scenario in which the novel waswritten. We are required to list out each plot in the storywhere there is scope for learning the particular economicconcept. Teachers expert in story telling suggest manytechniques to tell effectively, using pause, using eyecontact, telling a story slowly and bringing one's ownself into the task. If required, teachers also engagestudents in classrooms. For example, students can beasked to bring or develop a fictional story and explainclearly how their stories illustrate a particular economic
Lectures and Discussions68
principle or concept. The teacher can collect all thestories students have developed and choose the bestones for the presentation in the classroom.
(Note: Many sections of this chapter are based on achapter in the Handbook for Economics Lecturers, anonline material available freely and can be downloadedfrom website: www.economicsnetwork.ac.uk. Thewriters wish to place on record due acknowledgementto the website operators).
REFERENCES
Sloman and Mitchell (2002), Lectures, in Handbook forEconomics Lecturers, www.economicsnetwork.ac.uk.
Kang, Wong Wei (2005), "Story Telling in theTeaching of Macroeconomics: An Economist'sTales," Paper presented in the FASS-CDTLsymposium: Innovative Approaches toUniversity Teaching and Learning, March 20,2005, National University of Singapore,Singapore.
Peter J. Boettke, "Teaching Economics through AynRand: How the Economy is Like a Novel andHow the Novel Can Teach Us AboutEconomics", The Journal of Ayn Rand Studies6, no. 2 (Spring 2005): 445-65.
Donnell, Margaret G. O', A Historical Note on theUse of Fiction to Teach Principles ofEconomics, The Journal of EconomicEducation, Vol. 20, No. 3 (Summer, 1989), pp.314-320.
ANNEXUREThis is internet era. Suppose we want materials on
a specific topic, internet is the best source available.When one of the writers of this chapter browsed throughvarious websites, one drew his attention. A teacher wholost his job because students did not find his teachingwas forced to undergo training on teaching methods.

Handbook for Economics Teachers 69
He provided his ideas on different types of lectures inhigh school classes as follows. What do you think of hissuggestions?
1. Feedback Lecture
o Assign reading and provide students withan outline of the lecture notes prior tothe lecture.
o Lecture for 10-15 minutes.o Divide students into groups for 15-20
minutes.o Assign each group a discussion question
related to the material.o Continue the lecture.o Discuss the groups' answers as a class.o Repeat, if necessary.
2. Guided Lecture
o Provide students with a list of lectureobjectives (copying them makes a goodwarm up activity.).
o Instruct students to put away theirwriting instruments and listen.
o After 15-20 minutes of lecturing, instructstudents to write down everything theyremembered,
o After 5-minutes, put them in groups of3-4 and have them discuss what theyremembered.
o Help students fill in missing notes.
3. Responsive Lecture: Devote a class periodto answering student-generated questions.
o The questions must be open ended.o They must be related to the unit of study.o Students must specify why they think the
question is important.o The teacher answers as many questions
as possible.o Another option includes the use of white

boards.
4. Pause Procedure Lecture
o Deliver a 20-minute lecture.o Stop.o Have students exchange notes with
another student.o Fill in missing information (on their own
notes).o Instruct students to stand up and face a
partner.o Students quiz each other for one minute.
Lectures and Discussions70

ChapterChapterChapterChapterChapter 6
Teaching EconomicsThrough Problems
INTRODUCTIONIn recent times, economics teachers pose problems tostudents and facilitate them to find solutions. Thesolutions that they come out with and all the steps andprocesses they undergo becomes the part of theirlearning. In this approach, students take an active rolein their learning as they discuss and decide on problem-solving strategies, divide research and otherresponsibilities among group members, communicatethe results of their research back to the group, andfinally craft a problem solution, which is often presentedto students outside their group. This instructionalstrategy is known as problem-based-learning (PBL) orproblem solving method (PSM). In this chapter, we willlook at the scope for using PBL in economics classroomsin Indian schools.
Lectures - Some Limitations
Lectures are major instructional strategy, teachersadopt in most higher-secondary economics classroomsin India. A few enthusiastic teachers carry with themEconomic Survey, graduation level textbooks andReports to classrooms. Yet a few others sit with studentson Internet and help them to source a variety ofmaterials required for project work or to clarify economic

Teaching Economics Through Problems72
concepts. It has been said that for many teachers,lectures are the only option available, as their schoolslack sufficient materials or Internet facilities.
Studies show that lectures have many limitations:(i) less time is devoted for personalized teaching; (ii) inlectures, emphasis is more on giving information ratherthan learning. The lecture-based classrooms representwhat teachers do and not necessarily what learnersneed; (iii) students failed to develop confidence toparticipate effectively in lecture-based-discussions.Lectures are also seen as teacher - dominatedenvironment in which students are spoon-fed. They arealso being looked upon as struggling environment forboth teachers (students neither show interest nor talk)and students (classes are boring) and there is little scopeto develop confidence and independent learning abilitiesor to stimulate those who become disinterested. Inlecture-based instructions, students are content to adopta passive rather than an active role in the learningprocess.
Problems and Learning
In psychology a "problem" usually means 'a task thatcan be defined external to the individual in which anobservable or openly stated solution is provided.' Mazes,puzzles and anagrams are examples of problems. Wesolve these problems using our memory, past experienceand training. For example, if we want the solution for aproblem - to find out the sum of 3 and 7, we need toknow how to add two numbers. Once we know, weprovide solution to this problem as 10. While solvingeach problem, we produce 'responses, which are alreadyin our repertory through memory or use of training.The past experience supplies the requisite informationor skill to find solutions'. However, problems may be ofdifferent types. We may not know solutions to manyproblems in advance or that there may be more thanone solution to a problem. Let us consider this: how toarrive at the number 8 by addition. We all know that wecan arrive at 8 by (i) 4+4; (ii) 5+3; (iii) 2+6 and (iv) 1+7.

Handbook for Economics Teachers 73
Hence we can arrive at four solutions to one problem.Problems are generally solved by (i) trial-and-error:
Grick and Mc Garry (1992) have drawn attention to theway in which the ability to transfer what is learned inone problem situation to another problem situationdepends on making mistakes in the first situation. Theycompared situations in which students first solved aproblem with situations in which they initially failed tosolve a problem. They found that failure to solve thefirst problem led to more solutions of a second, similarproblem. It is with the benefit of correcting errors, theysolved the problems; (ii) insights - by discovering generalrules, pattern of relationships, principles: Metcalfe andWiebe (1987) point out that one of the essentialcharacteristics of an insight problem is that the solutionappears suddenly, without warning and (iii) analysis -analysis of the problem and a step-by-step working ofthe stages toward a solution.
In the formal schooling, we tend to assume that if aperson is able to arrive at solutions for problemsassociated with an issue, she is considered as learnedor acquired knowledge (about issues). In order to arriveat a solution or set of solutions, we take many strategiesand involve ourselves in a variety of activities. Each ofthese activities also forms the part of learning. This ledsome psychologists to consider problem-solving as"complex learning."
Problem-Based Learningand Economics Classrooms
As pointed out earlier, in PBL, teachers pose a set ofproblems associated with a particular curricular area -subject, topics to be covered in the syllabus and seekstudents to provide solutions by following teachersguidance. All the processes students undergo and thesolutions they arrive at form part of learning. The originof PBL can be traced from medical and health careeducation in the 1960s and has now been used as anclassroom organisation or teaching strategy in manysubject areas.
Teaching Economics Through Problems74
Economics is one subject in which a variety of real-life issues are studied and solutions are explored. Weknow that in real life situations, economists working invarious enterprises, large companies, banks andfinancial institutions and government departments useeconomic theories for finding solutions to variouseconomic problems their enterprise face. A large numberof teachers in schools and colleges find that usingsimulated problem-situations, there is greater scope touse PBL as a major instructional approach in theirclassrooms. To quote a study of economics classroomsin select high schools in United States of America:
"the PBL macroeconomics unit incorporatesmultiple collaborative discussions in whichstudents work to frame the problem, decide ona solution, revise the solution on the basis of anew information, and, finally, prepare a speechdescribing their solution. The teacher coachesstudents through this process by challengingtheir inquiry to stimulate knowledge gain(p.326)."
In the PBL environment, teachers facilitate studentsto research materials related to appropriate topics andsources, guide them to develop appropriate "lines ofenquiry" so that they can evolve various economicsolutions to the problems posed. Also a successfulcreation of PBL environment requires teachers topossess sufficient knowledge of economics subject andthe ability to manage students to develop focussedinquiry.
Researchers observe a variety of advantages of thisapproach viz., (i) learners achieve concept attainmentthrough self learning; (ii) it facilitates peer-groupdiscussions among students and they learn to makedecisions and; (iii) it is particularly suitable for creativetasks where more than one answer / solution isexpected; (iv) learners come together to solve problemscollectively by considering various or joint solutions; (v)opportunities for teacher-student and student-studentinteractions are greater; (vi) develop confidence andindependence learning skills in students; (vii) studentslearn to search information through various sources;

Handbook for Economics Teachers 75
(viii) students are able to manage time to research, usethe time effectively - non-teaching hours in schools; (ix)they develop responsibility to contribute to team effort.
Although teachers use a variety of strategies to createPBL environment in economics classrooms, most ofthem take six steps: (i) determine the form of PBLenvironment - either fully which means the entire coursecan be taught using PBL strategy or partially - whichmeans only part or parts of course syllabus units /topics / chapters can be taught through PBL strategy.This decision is taken by teachers depends on the abilityof the students, nature of the course contents, theirown ability and enthusiasm and so on.; (ii) focus ontarget learning outcomes - subject-specific skills suchas use of statistical tools - tables, graphs, analyse theeconomic data and infer from the economic informationand transferable skills such as time management,teamwork, independent learning, decision taking,problem solving, communicating ideas and so on; (iii)determine the learning activities associated with thetask - those tasks which promote subject specific skillsand those which promote transferable skills (iv)presenting the task to students; (v) set up mechanismsto facilitate the work of students to lead, record andmonitor themselves; (vi) assessment.
Bouhuijs and Gijselaers (1993) suggest the followingsteps one can take to create PBL environment in theclassroom:
(i) Students can be organised as small groupseach of which work independently from othergroups (6-8 members)
(ii) Every group needs to be given a set ofproblems related to the chapter/topic unit asdecided by the teacher
(iii) In the first meeting, each PBL group maydiscuss the problem for the first time - firstimpression' views of the problem
(iv) Organising brainstorming sessions for eachgroup in the entire classroom or separately toidentify relevant issues and essential informationrequired to "solve" or respond to the problem
(v) Identification of specific study tasks (libraryresearch, etc.) to be undertaken by group

Teaching Economics Through Problems76
members before the next meeting: Whiledesigning a task, teachers need to be (i) awareof the learning activities students will berequired to perform when tackling the task -design tasks that are consistent with learningobjectives / outcomes specified in the unit /chapter (poor problem design may result inwider differences in intended and actuallearning outcomes) and (ii) try to visualise thedifficulties that may arise in the process -computer facilities, internet, general libraryresources, access to newspaper articles andmagazines, graduation level textbooks andother book materials - with a limited time framestudents may be expected to collect theinformation. There is no point in having largenumbers of students trying to access one book/ one computer - internet facility within alimited time frame.
(vi) Allocation of study tasks to individual groupmembers (the number of students working ona particular task can also be determined atthis stage)
(vii) For each task, the team can select a task'leader' and 'recorder'. The task leader isresponsible for keeping the discussion goingand ensuring that all members participate inteam discussions. The task recorder will beresponsible for recording the researchresponsibilities delegated to members duringthe first meeting and for reading out thisinformation at the start of the everysubsequent meeting. The students areexpected to be responsible for all decisionsarising from the above activities. The teachershould not interfere with the governance ofgroup procedures.
(viii) In the second (and) subsequent meetings,group members are expected to undertake thestudy task allocated to them at the firstmeeting. Tasks include: (i) providing asummary and assessment of relevant
Handbook for Economics Teachers 77
newspaper clippings, magazine and journalarticles, (ii) searching for materials throughinternet; (iii) acquiring and tabulating relevantstatistical information. Sufficient time may berequired to facilitate research.At this stage, members can report back theresults of their research activity to the group(after the task recorder has reminded thegroup of individual responsibilities). Using thisinformation, the group formulates an agreedresponse to the problem.
(ix) Presentation of group responses andassessment: a formal presentation in the classor a written report. Teachers may require someform of response so that formative feedbackcan be provided. Assessment may also besummative, in that the response is graded andcontributes to "internal marks" of the coursework.
An Illustrative example of CourseDesign in a Problem-BasedLearning Mode
"Indian Economic Development" is an economics coursetaught in schools affiliated to Central Board ofSecondary Education and many state Boards at thehigher secondary stage. This course has four units andone of which deals with "Current Challenges FacingIndian Economy". Issues are covered in one unit viz.,poverty, human capital formation, rural development,employment, infrastructure and environment. Since wehave a large number of students in each class, a partialproblem-based learning environment can be created forthis course. This means all the three units can be taughtin other instructional strategies.
The Central Board of Secondary Education suggeststeachers to use 60 periods to teach this unit. This meansroughly about 10 periods may be required for eachissue. Assume that there are about 36 students in a

Teaching Economics Through Problems78
class. This class can be divided into 6 groups. Eachgroup can be asked to take up problems associated toone issue. For each issue, the following needs to bedone:
(i) List out the expected outcomes: For example,in poverty chapter, the following are expectedlearning outcomes: (a) understand the variousattributes of poverty; (b) comprehend thediverse dimensions relating to the concept ofpoverty; (c) critically appreciate the way povertyis estimated; (d) appreciate and be able toassess existing poverty alleviationprogrammes.
(ii) Raising questions associated with differentsub-topics: At this stage, teachers need toformulate a few appropriate questions, whichform as problems. For instance, in the caseof poverty chapter, questions need to beraised by the teacher and posed to thechildren for finding out solutions. Somesample questions are viz., (a) how poverty isdefined? Do you think, the way officialdocuments identify a person affected bypoverty is appropriate? Use real life examplesfrom your surroundings to argue the case.(ii) Examine the changes in the magnitudeof poverty in India since independence; (iii)What are the steps we may have to take toalleviate poverty in India? Do you think onlythe government has the responsibility toaddress poverty? How we as citizens of thiscountry can reduce poverty in India?While posing the questions, it is necessary forthe teacher to understand clearly, what wouldbe tentative answers, what are the materialschildren may be required to collect andwhether the learning objectives can beachieved using these materials and what arethe other transferable skills students may beable to acquire in the process.

Handbook for Economics Teachers 79
(iii) List out the tasks: In order to answer questionstaken up in the previous paragraph, theteacher may have to list out what are theactivities students have to take up. In the caseof present illustrative example, all the studentsin the group may be required to do thefollowing activities:
(a) Search for materials in terms of books,magazines, journals available in the schoollibrary on poverty
(b) Search in the Internet through GOOGLE orany other search engine (there will behundreds of materials through this source).It may take a few hours for students to lookat each material. When they search, there willbe a lot of materials, which may not be usefulto the task. They have to first look at them, ifthey are useful to provide answers to theproblems posed, they can download them andprint those materials.
(c) After collecting the materials through varioussources, they can read and summarise and /or take important notes. They should discussamong themselves what is there in thosematerials and whether they are sufficient tofind solutions to the problems posed by theteacher. They can discuss among themselves.
(d) They can decide how and who do thepresentation of the problem assigned to eachgroup in the class. This can be through PowerPoint slides presentation and / or writtenreport.
In case there is a limitation that each group isfamiliar with only one topic, teachers may require topose the problem differently. Suppose there are 36students, one group will be assigned the role of collectingthe materials; another group can be asked to read thematerials collected and take down notes. There are somestudents who may be good in presenting / articulatingthe points from the notes. Then there are some studentswho may be good at using computers, making power

Teaching Economics Through Problems80
point presentations or preparing graphs, tables. Theycan be asked to do those tasks.
Limitations of PBL
(i) Indian classrooms generally contain largenumber of students in every class. So a partialPBL environment may enable only a sectionof students to participate actively. Studentsin each group may become well-versed withonly those topics assigned to them. There maybe little scope for other students to understandvery well the contents or curricular materialsprepared by other groups' units. Hence,besides students' groups presentations teachermay be required to supplement with additionallectures which teachers may tend to think asdouble work given the limited number ofperiods.
(ii) When students are in the first year ofeconomics course, they may not be in aposition to employ economic theories and toolssuch as demand and supply or anymethodology approach specific to economicsat this stage. Higher secondary students arenot exposed to such curricular knowledge. Atbest, students may use some statistical toolsto describe / present the issues. They can usesimple reasoning or common sense to find outsolutions to the problems posed by theteachers to each group. Also many economicproblems require understanding of socio-historical and geographical issues for providingtentative solutions. However, this could betaken as an additional opportunity of learningabout integrated nature of social sciences,provided teachers motivate them to discussthese issues in classroom discussions.
(iii) If PBL is taken as a method to teach a part ofIndian Economic Development course meantfor class XI, there is already another course -

Handbook for Economics Teachers 81
statistics for economics which contains onechapter on doing a project using statisticaltools learned in the course. The PBLenvironment may require knowledge andunderstanding of statistical tools but goesbeyond merely using the tools as students areexpected to provide solutions to the problemsposed by the teacher. It is necessary todifferentiate the problem-based learning anddoing a project using statistical tools. In otherwords, the statistics for economics portionexpects students only to use the processwhereas the PBL activities enable students tolearn both (economics) content-related skillsand processes (transferable skills) throughactivities.
(iv) There is some scope for apprehension that thisapproach may be suited to situations wherethere is no readymade textbooks available. InIndia, textbooks and guidebooks are broughtout by both public and private sectorpublishers. There is a chance that childrenmay just write what is already there intextbooks and submit as the completed task.Hence, PBL environment requires teachers'careful observation of all the activities of eachgroup and go through the written reportcarefully.

REFERENCESBouhuijs, P. and Gijselaers, W. (1993), Problem-
based Learning as an Educational Strategy,New York Publications, Maastricht cited inForsythe (2002)
Deignton, L.C. (ed.), (1971) The Encyclopaedia ofEducation, The Macmillan Company and theFree Press, vol.7, United States of America.
Frank Forsythe, Problem-based Learning, TheHandbook for Economics Lecturers,Economics Network Homepage:www.economicsnetwork.ac.uk/handbook/pbl, 2002.
Maxwell, N.L., J.R.Mergendoller and Y.Bellisimo,"Problem-Based Learning and High SchoolMacroeconomics: A Comparative Study ofInstructional Methods," Journal of EconomicEducation, Fall 2005, Vol.36, No.4, pp.315-331.
Mayer, R.E., (2003), The International Encyclopaediaof Educational Research, vol.8, Pergamon,Second Edition, Reprint.
Mergendoller, J.R., N.L. Maxwell, and Y.Bellisimo,The ef fectiveness of problem-basedinstruction: A comparative study ofinstructional methods and studentcharacteristics, Interdisciplinary Journal ofProblem-Based Learning, vol.1, no.2, pp.49-69.
Tan, Oon-Seng, Chua-Tee Teo and Stefanie Chye,Problems and Creativity, in Oon-Seng Tan(ed.), Problem-Based Learning and Creativity,Cengage Learning, Singapore.
Teaching Economics Through Problems82
ChapterChapterChapterChapterChapter 7
Simulation Games andTeaching Economics
INTRODUCTIONThis chapter deals with a few basic aspects of simulationgames as a method to teach economics at highersecondary level. In this chapter we first discuss the needand significance of simulation games as a method toteach economics. We then detail the advantages of thismethod, essential steps to be followed while designingand organising a simulation game. This is followed by asuggested list of economics topics and conclusion.
Need and significance ofsimulation games
The scope of economics is increasing. It has beenintroduced at the upper primary level as a part of socialscience course and offered as an optional subject athigher secondary level. It has been observed that theachievement of learners in economics is poor. One ofthe important factors responsible for poor performanceof learners is our methodology. Most of the teachersuse traditional approaches like chalk and talk dependon textbooks, question-answers, lecture etc. in teachingeconomics. Teaching practices, which rely heavily onthe lecture format are not doing enough to develop thecognitive learning skills in students and do not evenmotivate them. Consequently, it limits learner's

Simulation Games and Teaching Economics84
performance up to knowledge level and does not developunderstanding and application abilities in them. Theirparticipation in teaching learning process is poor. Theirmotivational level remains low in learning concepts. So,their performance level is poor.
It has therefore become necessary for educationiststo find some innovative approaches teach to economics,which create interest in learning economic concepts,increase students' motivational level and increase theirparticipation in learning tasks set for them by theteacher. The recommendation in many economicsstudies is to adopt more active and collaborative learningmethodologies. Simulation game is a new technique ofteaching. Its use in education is increasing. Researchstudies have shown that simulation games createinterest in concept learning, increase active participationof learners in learning tasks, increase their achievementlevels and enhance the concept retention. Before todiscuss this approach in detail, let us first understandthe concept of simulation game.
Concept of Simulation Games
The concept of 'simulation game' is based on theconcepts 'simulation' and 'games'. Bob Wilson (1987)defines simulation as "an imitation of reality.” ‘’It is asmaller scale imitation of the 'real thing' whereparticipants carry through an exercise, which representsa real system, or a process, or a procedure, or parts ofthem. The simulation may involve either physical ormental skills or both". J. Megarry (1989) adds that "Asimulation is a working model of reality’’. Educationalsimulations are often simplified or acceleratedrepresentations which allow student to exploresituations." These definitions highlight the following asthe attributes of simulation: (i) It is an artificial situationbased on reality or some of the components of reality;(ii) it provides a learning environment; (iii) it involvesstudents actively in learning process.
The concept of a game needs no introduction. Gamesare competitive activities with an element of fun.

Handbook for Economics Teachers 85
According to Bob Wilson (1987) "A game is acompetition, or exercise, played by adversaries, withthe objective of winning within the rules". J.Megarry(1989) says that a game is played by one or more players,competing and/or cooperating towards a definiteobjective according to an agreed set of rules. Thesespecify procedures for attaining the objectives from thematerials provided, and indicate a scoring system ormethod for identifying winners and losers".
The attributes of a game are the following:(i) contain a set of objectives: Game is a purposeful
activity. It is carried by the participants toachieve the predetermined objectives;
(ii) Rules: The game has certain rules which arefollowed by the participants during the activity;
(iii) Time bound: A game has a time limit. It is playedwithin the specified time;
(iv) Cooperation: The game is played with the activeparticipation and cooperation of the participantsof the group;
(v) Competition: The feel of competition is alwayspresent in the participants who compete againsteach other;
(vi) Scoring System: There is a scoring system ingame which helps in declaration of results ofeach group.
Simulation Games
A simulation game is an educational activity whichcombines the features of both of a simulation (workingmodel of reality and active participation) and of a game(rules, cooperation and competition). According to BobWilson (1987), a simulation game is "an activity whichcombines the qualities of a game (players, rules,competition) with those of a simulation (an imitation ofreality)". J.Megarry (1989), adds that it "combines thefeatures of a game (players, rules, and competition/cooperation) with that of a simulation (working modelof reality)." Simulation game is a group-orientedapproach to teaching. The role of the learning is active

Simulation Games and Teaching Economics86
and the role of the teacher is that of a guide or afacilitator.
Role Play
Role play refers to one type of a simulation in which thedominant feature is the relatively open-ended interactionamong people. In a role-play game, participants needto assume realistic social roles based on a commonsituation, which forms the basis of interaction with oneanother. In the words of J.Megarry (1989), “Role playrefers to a group of techniques in which the participantsare asked to accept a different identity, to try to thinktheir way into someone else’s situation and perhaps intotheir mind as well. Simulation game often allocatesdifferent roles to the participants by issuing them withrole cards bearing the name, age and occupation of theperson they are to represent.” Role play games usuallyrequire (i) profiles, which describes the role behavior tobe performed during the game; (ii) a scenario or casestudy which describes the situation in terms of whichthe roles are to be performed; (iii) rules, which specifythe conditions under which the game is to be playedand which indicate how the winning and losing is to bedetermined.
Advantages of Teaching throughSimulation Games
(i) Motivation: Simulation games have resulted inincreased pupil motivation to learn, particularlywhere pupil motivation may be very low becauseof socio-cultural factors, and where students findmuch of their curriculum irrelevant to their ownlife experiences. In such situation, simulationgames make study material interesting andfascinating. The learners are motivated bydividing them into groups, by assigning roles andby stating rules of the activity. They become moreeager in finding themselves in the activity of

Handbook for Economics Teachers 87
learning. The level of interest increases becausethey have a natural urge to play and it is in theirinstinct.
(ii) Active Participation and Intense Involvement: Thismethod leads to maximum involvement of thelearners and their participation in the teachinglearning process. So it is helpful for the averageand learners having learning.
(iii) Increase in Achievement: The learner’s level ofmotivation and the active involvement in learningprocess help in learning concepts effectivelywhich further increase their achievement.Research studies have shown that pupils whowere taught economics through simulationgames at higher secondary level scored morethan pupils who were taught through traditionalmethods of teaching.
(iv) Retention of Learning: As pupils learn conceptswith motivation and are involved in the learningprocess, it helps in enhancing the retention levelof learners. Research studies have shown thatthe pupils who were taught through simulationgames had high levels of retention in comparisonto those pupils who were taught through thetraditional methods of teaching.
(v) Development of human traits: Teaching throughsimulation games promotes certain humanvalues like co-operation, team spirit, respect forpeers etc. They come close to each other andtheir social relationship gets strengthened.Group work provides the benefit of sharingknowledge.
(vi) Increase in confidence: Students who are taughtthrough simulation games are more confidentin expressing their views. Clarity of concepts,increased interest towards the subject and beingexposed to simulations make them moreconfident in dealing with real life situations.
(vii) Development of Skills: It leads to the developmentof various skills like problem solving,communication and negotiations, decision-making etc.

Simulation Games and Teaching Economics88
(viii) Learning as a by-Product: The pupils participatein the activity with interests but the purpose ofactivity is to learn concepts.
Steps for Designing a SimulationGame Based Exercise
(i) Formulation of Instructional Objectives: It is oneof the most important steps for designing asimulation game based exercise. Objectives ofthe concept, which are to be taught must bewritten in behavioral form for their effectiveattainment.
(ii) Identification of Simulation Game: After theobjectives, an appropriate simulation gameexercise is identified. The components of aconcept help the teacher to identify the mostsuitable exercise in this regard.
(iii) Preparation of Simulation Game: At this stage,work related to rules of exercise, groups, numberof participants in each group, roles, materialrequired, arrangement of furniture etc. iscompleted.
(iv) Assigning Roles: The teacher assigns the roles tothe participants in such a way that the activitygoes on smoothly until it is properly concluded.There are two types of roles, key role andsupporting roles, whereby key roles have main andgreater performance than the supporting roles.
(v) Observers: It is the group of those students whodo not participate in the activity but assist astimekeeper, writing scores, distribution andcollection of material etc. Research studies haveshown that the observers also learn equally withthose who were involved in activity.
(vi) Organization of Simulation Game: This issituation when the whole plan of work is putinto action. The simulation game is played afterthe introduction of rules.
Handbook for Economics Teachers 89
(vii) Intervention: The teacher can provide somefeedback in the progress of the activity if it isrequired, but teacher intervention should beminimum.
(viii) Debriefing: This is a post game general classroom discussion situation in which the pupilsgeneralize the outcomes and the teacher matchesthe outcomes with the objectives of the lesson.The purpose of the activity is expressed as notto entertain but to learn concepts through it.
An Illustration of a SimulationGame in Microeconomics
Topic : Monopolistic CompetitionClass : XIITime : 35 MinutesNature of simulation game: Role Play
Components of Monopolistic Competition
• Many firms• Closely related but differentiated product• Free entry and exit of firms
Selling costs
Instructional Objectives
After going through this activity you should be able to• State the meaning of Monopolistic Competition.• List the features of Monopolistic Competition.• Explain the features of Monopolistic
Competition.• Describe the terms "Product Differentiation" and
"Selling Costs".• Understand the rationale of a firm in
differentiating its product.
Rules
• Divide the whole class into five equal groups.• There would be six students in each group.

Simulation Games and Teaching Economics90
• There would be four firms which will be sellingtheir product "Toothpaste".
• One group shall be consumers.
Procedure
• Four students of first four groups will act as aseller of different firms which are selling theirproduct toothpaste, remaining two students ofeach group will perform promotional activitieslike advertisement on news paper, T.V. andRadio, Free Sampling, etc. to sell their products.Their description is given below.
Table 1. Roles of students
Groups Roles No. of Students TotalStudents Engaged in
PromotionalActivities
Group1 Firm A Colgate 04 02 06
Group2 Firm B Pepsodent 04 02 06
Group3 Firm C Close up 04 02 06
Group4 Firm D Babool 04 02 06
Total 16 08 24
It is clear from the above table that there are sixstudents in each group engaged in performing roles offirms and engaged in promotional activities.
• The fifth group will act as consumers which wishto purchase a product "toothpaste" and for thisthey visit and interact with the members of eachfirm and observe all the promotional activities.The group of consumers will get informationrelated to price, quantity, quality, brand name,colors, type of service etc. about the products.
Debriefing
After the activity has been conducted, the groups wouldshare their experiences and explain the purpose of theactivity. At this stage, the teacher needs to match the

Handbook for Economics Teachers 91
outcomes of the activity with the objectives of the lessonand describe that there are a number of firms selling asimilar product and thus, each firm supply a certainpercentage of the total supply of the product.Competition prevails in the market because there aremany firms. Products of different firms are closesubstitutes of one another. They can be differentiatedfrom each other on the basis of brand name, colors,shape, quality, the expenditure incurred in promotingsales of a firm etc. Finally, the meaning of monopolisticcompetition is derived with the help of students as itrefers to a market situation in which there are manyfirms which sell closely related but differentiatedproducts.
HHHHHOMEWORKOMEWORKOMEWORKOMEWORKOMEWORK
Q1. Give examples of any five consumer goodsindustries where product differentiation isprevalent.
Q2. Find the basis of differentiation of the product"Washing powder" of 1 kg.
Another illustration of a simulation game inMacroeconomics
Topic: Circular Flow of Income in a Simple EconomyClass: XIITime: 35 Minutes
ComponentsHouseholdsFirmsFactor ServicesFactor PaymentsGoods and ServicesPayments for Goods and Services
Instructional ObjectivesPupils should be able to:

Simulation Games and Teaching Economics92
Give examples of factor services and factorpayments.Explain the relationship between Householdsand Firms.List the features of a simple economy.Estimate the aggregate value of goods andservices produced during a year throughexpenditure, product and income methods.
RulesThere will be two leading groups Group A andGroup B comprising of 20 pupils in each group.Group A will demonstrate the roles of ahouseholds and Group B will demonstrate theroles of a firmsThere will be four sub-groups in each groupcomprising five students in each sub-group.
These rules can be explained with the help of thefollowing table:
Group A Group B A1.Human Labour ( 5 students ) B1.Engage Factor Services ( 5 students ) A2. Capitalists ( 5 students ) B2.Makes Factor Payments ( 5 students ) A3. Entrepreneurs ( 5 students ) B3.Selling Goods& Services ( 5 students ) A4.Landlords ( 5 students ) B4.Receives Value of Goods & Services
( 5 students ) Total ( 20 students) Total ( 20 students)
Procedures
Round-1Sub-groups of group A will approach sub-groupB1 for producing factor services.Sub-group B2 will make payments in the formsof wages (A1), interest (A2), profit
(A3), rent (A4).Sub-group B3 will sell final goods and servicesto the group A.Sub-group B4 will receive value of goods andservices from group A.

Handbook for Economics Teachers 93
Round-2Roles of Group A and Group B will beinterchanged.
DebriefingThe teacher would draw and complete the following
diagram on the basis of students' experiences whichthey have learnt through the exercise:
The teacher can focus the explanation on thefollowing as well:
The households receive their payments from thefirms for productive activities. There may fundamentallybe four kinds of contributions that are made duringthe production of goods and services:
(a) Contribution made by human labour,remuneration for which is called Wage.
(b) Contribution made by capital, remuneration forwhich is called Interest.
(c) Contribution made by entrepreneurship,remuneration for which is called Profit.
(d) Contribution made by fixed natural resourcescalled "land", remuneration for which is calledRent.
Features of a Simple Economy
There is only one way in which the households
HouseholdsFirms
Factor Services
Spending
Goods and services
Fig. 7.1 Circular Flow of Income in a Simple Economy

Simulation Games and Teaching Economics94
may dispose off their earnings.Households do not save.Households do not pay taxes to the government.There is no external trade.
Estimation of aggregate value of goods and servicesthroughProduction Method (aggregate value of finalgoods and services produced by all the firms).Income Method (the sum total of all factorpayments).Expenditure Method (aggregate value ofspending on final goods and services that thefirms receive).
Many topics can be taught through simulation game.Some of them are, (i) Fixed cost and Variable cost ( game); (ii) Perfect Competition ( Role play ); (iii) Price Elasticityof Demand ( game ); (iv) Concept of Aggregate Demand( game ); (v) Value Added ( Role play )
Conclusion
In simulation games, learning become entertainingand made relevant to the pupil's life experiences.Learning is achieved by exploratory problem solvingsimulation games involving role play, with self-directedpupil participation. Although, many concepts in microand macro economics can be taught using games, ithas a few limitations such as (i) teachers have to planin advance the execution of the complete game as theprocess of teaching through simulation gaming requiresa proper preparation and (ii) all the concepts ofeconomics cannot be taught through simulation games,which means the teachers are required to identify onlytopics which can be taught through simulation games.
Handbook for Economics Teachers 95
REFERENCESBhatia, S.K. (1995), Learning Economics by Playing,
in Teachers Hand Book, Teaching of Economics,Contemporaries Methods and Strategies forSecondary and Senior Secondary levels, Instituteof Advanced Studies in Education, PublicationNo.13, Department of Education, University ofDelhi.
Megarry, John (1989), Simulation and Gaming: TheInternational Encyclopedia of EducationalTechnology, Pergamon Press, Oxford.
Wilson, Bob (1987), Methods of Training: GroupWork, Vol. 2, Parthenon Publishing, England.
Coleman, James S. (1970), Role of ModernTechnology in Relation to Simulation and Gamesfor Learning to Improve Learning. R.R. BackerCompany, London.
WEBSITEwww.expernomics.com
ChapterChapterChapterChapterChapter 8
Using Media andTechnology in TeachingEconomics
INTRODUCTIONEconomics is a subject that every individual encountersin his / her daily life. From a simple decision that achild needs to make when choosing between thepurchase of an ice-cream versus sweets to the morecomplex issues of inflation and unemployment,economics touches each one of us everyday. Irrespectiveof the profession, we constantly come across statistics,economic statements and government policies whichneed to be understood and analysed. Thus, we asteachers of economics play a vital role in developing akeen interest in our students to explore, discover, thinkand deliberate on different economic issues, ideas andthoughts.
Lectures, the traditional teaching methodology, areimportant for children to learn economic concepts.However, it has its limitations in making the teachinglearning process teacher centric. As students are notactively involved in the process of learning, it reducestheir interest in the subject which consequently impactstheir performance. In order to make children 'think likeeconomists' a vast number of activities need to beundertaken beyond the traditional chalk and talkmethodology. Children need to be engaged in thecurriculum rather than teachers limiting the transactionvia a textbook and black board. Media and technology

thus become effective teaching aids that enhance theteaching learning process and equip learners tounderstand, interpret and analyse what they read, hearand view about economics.
A teacher's role today goes beyond being a giver ofinstruction to a mentor, guide and facilitator. A teacherneeds to nurture her students' skills and attitudes forthem to be able to face the challenges of life. By usingmedia and technology in our teaching, teachers canachieve a variety of objectives that go beyond the basiccognitive domain of knowledge and conceptualunderstanding. Some of the other objectives thatteachers can achieve through these aids include:
• Awareness of ideas and concepts that arebeyond the academic curriculum
• Development of higher order thinking skills,including problem solving, critical thinking,creative thinking
• Development of interest in the subject• Development of life skills that shall be used
by students later in their lives♦ Communication skills - including reading,
writing, listening, speaking♦ Team spirit♦ Respect for others views and thoughts♦ Accepting and appreciating diversity
• Development of research skillsIn this chapter, we discuss the various types of media
and technology that can be used to enhance the learningexperience of our students of economics. Along withdiscussing the key advantages of using a particularmedium, extensive suggestions have been given to theteacher how to use that medium. It should, however, benoted that only a few suggestions have been made withthe hope that teachers will take the ideas forward anddevelop their own activities and assignments usingmedia and technology.
Handbook for Economics Teachers 97
Using Media and Technology in Teaching Economics98
USING DIFFERENT TYPES OF MEDIA AND
TECHNOLOGY IN TEACHING
A wide variety of media and technology are available tosupplement our lectures and lessons. These range fromnewspapers to the internet. Let us discuss in detailhow these different forms could be used to enhanceclassroom teaching in order to improve the learningoutcomes for our students.
Print Media
Print media includes a wide range of sources includingnewspapers, magazines, fliers, bill boards, letters andmailers to name a few. In this section we shall focus onhow to use newspapers and magazines to achieve someof the objectives that we have stated in the previoussection.
Many a times students feel that topics are beingtaught in a vacuum, without any relevance to their lives.Articles demonstrate the relevance of these topics andideas to what is happening in the world or India. Theyhelp students understand how concepts learnt in theclassroom get translated into everyday life. Thesignificance of Economics is suddenly made alive for astudent who reads newspapers and magazinesregularly. In addition, when a student reads an article(s)he is exposed to different perspectives on an issuewhich can help the student frame her own views. Thisis especially true of ‘Editorialas’ and letters to the Editor.In addition, statistical data and surveys conducted bymazazines often relate to course content and makeinteresting points for discussion.
Beyond the content advantage, newspapers andmagazines also help teachers to achieve some of thegeneral objectives of skill and attitude development. Tobegin with students develop a habit of readingnewspapers and magazines more regularly. Theybecome more aware of what is going on around themand the world. They are also able to apply theirknowledge to real world situations.

Handbook for Economics Teachers 99
Use of articles in classroom teaching givesopportunities to teachers to organize discussions andgroup work. These activities help children developcommunication skills ranging from listening to speaking.Group work also makes them respect the views of otherswhilst putting forward their own ideas. They developbetter team spirit and take responsibility for theircontributions to the overall group work.
However, there is a note of caution in using articlesand other newspaper clippings for curriculum relatedclass discussions. Teachers need to be focused andguide the discussion in the direction of the topic onhand. Many a times it has been observed thatunstructured, unprepared or random discussions takeclass discussions towards 'unwanted territory' and leadto wastage of classroom time. Teachers, thus need togently but firmly ensure that there is not too muchdigression from the main topic.
A wide variety of newspapers and magazines areavailable in the market that could be used for classroomteaching. Whilst it is not possible to provide acomprehensive list of newspapers and magazinesavailable due to regional and linguistic constraints afew examples of English newspapers would be The Timesof India, Hindustan Times, Economics Times, BusinessStandard, Financial Express, The Hindu Mint etc andbusiness and economics magazines such as BusinessWeek, Business Today, Economist, Outlook, Economicand Political Weekly etc. However, a teacher could usean article from any local daily or magazine that shemay deem fit for the purpose of enhancing the learningexperience of her students.
Let us now see how newspapers and magazines canbe used practically to ensure that the learner is moreengaged and interested in the subject.
SAMPLE ACTIVITY 1
The following activity helps students to collectinformation from newspapers and discuss it in relationto what they shall study in the classroom.Class: XIITopic: Foreign Exchange Rate Determination
General Objectives:

Using Media and Technology in Teaching Economics100
• Understanding of Foreign Exchange Rate markets• Exposure to information available in newspapers• Development of research skillsResources required:• Newspapers that carry the daily foreign exchange
rate movementsMethod:• Conduct the exercise at least one week before
teaching foreign exchange rate determination.• Ask students to maintain a record of how the
rupee- dollar exchange rate moves everyday fora week and bring their findings to class.
• Through the data collected by the students, ateacher could explain the following:
♦ The exchange varies on a daily basis asexchange rates in India are marketdetermined.
♦ Concepts of depreciation andappreciation.
♦ How the exchange rate would have beenunder a fixed exchange rate regime.
♦ Role of RBI in managing the exchange rate.
SAMPLE ACTIVITY 2
This activity is to be conducted once the topic has beencompleted and allows students to see the practicalityof the topic that has been studied in the classroomClass: XITopic: Presentation of data
General Objectives:• Understanding of presentation of data• Exposure to information available in newspapers
and magazines• Development of research skills• Interpretation of presented dataMethod:• Give students a few days to cut and paste in
their notebooks dif ferent types of datapresentation that are available in newspapersand magazines. These would include:
♦ Pie chart

Handbook for Economics Teachers 101
♦ Bar diagram♦ Time series chart♦ Percentage bar chart♦ Histogram♦ Tables
• On a designated day in the classroom, askchildren to select one of the diagrams that theyhave pasted and explain it in their own words.This could be either a written presentation or anoral presentation.
This exercise will highlight to the students thattables, graphs and diagrams are used to depict a myriadof information and is not only limited to economics.When students articulate what the diagram represents,they understand the language of diagrams and datapresentation.
Newspapers and magazines are particularly relevantwhen teaching Indian economics in Class XI. Newspaperand magazine articles make very good case studies.Articles that list out facts, events or government policieswithout any analytical description can provide the basisfor an active and lively discussion on a topic that ateacher wants to teach.
Sample Activity 3 below discusses how a newspaperarticle could be used to not only to cover the coursecontent but also make students work in groups.
SAMPLE ACTIVITY 3
This activity could be conducted before the problems ofIndian agriculture are explained by the teacher. Thiswill help the teacher to assess the level of priorknowledge that children have and help fill the gaps inthe student’s knowledge.Topic: Indian AgricultureTotal Time for activity: 35 - 40 minutes
General Objectives:• Understanding of problems and issues faced by
Indian agriculture• Development of higher order thinking skills• Development of team spirit• Development of communication skills
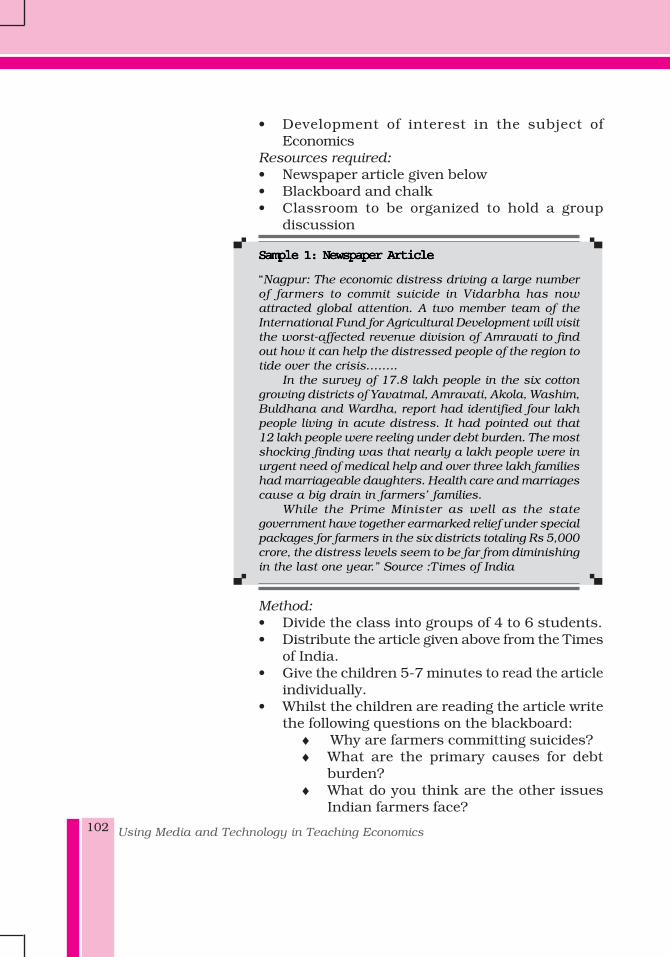
Using Media and Technology in Teaching Economics102
• Development of interest in the subject ofEconomics
Resources required:• Newspaper article given below• Blackboard and chalk• Classroom to be organized to hold a group
discussion
Sample 1: Newspaper ArticleSample 1: Newspaper ArticleSample 1: Newspaper ArticleSample 1: Newspaper ArticleSample 1: Newspaper Article
“Nagpur: The economic distress driving a large numberof farmers to commit suicide in Vidarbha has nowattracted global attention. A two member team of theInternational Fund for Agricultural Development will visitthe worst-affected revenue division of Amravati to findout how it can help the distressed people of the region totide over the crisis……..
In the survey of 17.8 lakh people in the six cottongrowing districts of Yavatmal, Amravati, Akola, Washim,Buldhana and Wardha, report had identified four lakhpeople living in acute distress. It had pointed out that12 lakh people were reeling under debt burden. The mostshocking finding was that nearly a lakh people were inurgent need of medical help and over three lakh familieshad marriageable daughters. Health care and marriagescause a big drain in farmers’ families.
While the Prime Minister as well as the stategovernment have together earmarked relief under specialpackages for farmers in the six districts totaling Rs 5,000crore, the distress levels seem to be far from diminishingin the last one year.” Source :Times of India
Method:• Divide the class into groups of 4 to 6 students.• Distribute the article given above from the Times
of India.• Give the children 5-7 minutes to read the article
individually.• Whilst the children are reading the article write
the following questions on the blackboard:♦ Why are farmers committing suicides?♦ What are the primary causes for debt
burden?♦ What do you think are the other issues
Indian farmers face?

Handbook for Economics Teachers 103
♦ Discuss the social issues highlighted inthe article or any other social issues thatare very relevant to Indian agriculture.
♦ The article suggests government reliefpackages for farmers. Can you suggestany solutions to the problems that arefaced by Indian agriculture?
• After reading the article, give the children 10minutes to discuss the key questions that areput up on the black board.
• After the individual group discussion, onerepresentative of each group can give a summaryof their discussions (maximum time of 2 minutesper group). (This representative could be chosenby the group or the teacher)
• The teacher writes the main findings on theblackboard. The teacher can club the pointsunder the following headings:
♦ The main features of Indian agriculture♦ Problems of Indian agriculture♦ Solutions to the problems faced by Indian
agriculture• As a home task, the teacher could ask the
students to write an essay on the main problemsof Indian agriculture.
The above activity helps students to cover not only thetopic of features and problems faced by Indian agriculture(course content) but also make them aware of the currenthappenings of the Indian economy (farmer suicides dueto debt burden). It helps them relate what they are learningin the classroom to real life situations. Through the activity,we are also able to achieve some of our wider objectives ofdevelopment of communication skills and including allstudents in group work. They also learn to think laterallyand articulate their views. By asking students to think ofpossible solutions to the problem, we expose them tocritical thinking skills. Students also realize that problemscan have different solutions and as long as they are ableto justify their stand adequately there is no one correctanswer to the problem.

Using Media and Technology in Teaching Economics104
SAMPLE ACTIVITY 4
Another example where newspapers and magazines canbecome an effective learning resource is when theirarticles are used as a comprehension passage. Articlesallow a teacher to introduce her students to the worldof news and information that are related to the coursetopics but are beyond the basic text book. Let us seehow this can be done for an article that based on anemployment survey.Topic: EmploymentTotal Time for activity: 35 - 40 minutes
General Objectives:• Understanding of employment surveys• Show students the relevance of economics in
everyday life• Development of communication skills –
comprehension and writing• Enhancing time management skillsResources required:• Magazine article given below - one for each
student• Worksheet 1 - one for each student• Classroom to be organized so that children can
work individuallyMethod:• Distribute a copy of the article to all students.• Give the children 10 minutes to read the article
individually.• Distribute a copy of Worksheet 1 to each student.• Ask students to fill the worksheet once they have
finished reading the article. (give the students20 - 25 minutes to complete the worksheet).
• The worksheet must be completed and handedover at the end of the class.
TTTTTaken from India Taken from India Taken from India Taken from India Taken from India Today Magoday Magoday Magoday Magoday Magazine - April 16, 2001azine - April 16, 2001azine - April 16, 2001azine - April 16, 2001azine - April 16, 2001
McJobs Are ExpandingThe latest employment survey throws up both
disquieting and encouraging trends.By Jairam Ramesh
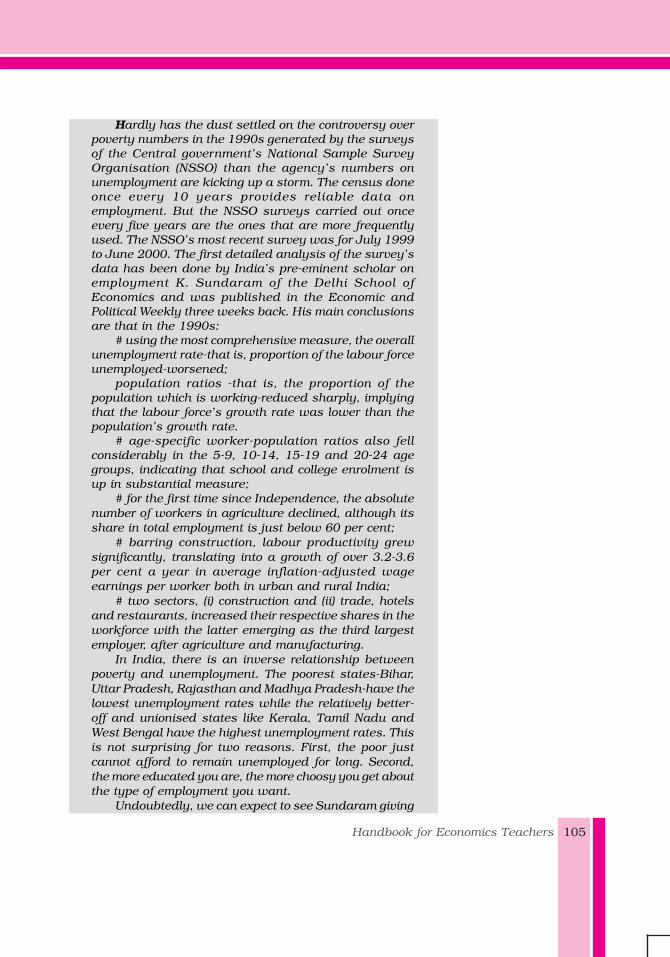
Handbook for Economics Teachers 105
Hardly has the dust settled on the controversy overpoverty numbers in the 1990s generated by the surveysof the Central government’s National Sample SurveyOrganisation (NSSO) than the agency’s numbers onunemployment are kicking up a storm. The census doneonce every 10 years provides reliable data onemployment. But the NSSO surveys carried out onceevery five years are the ones that are more frequentlyused. The NSSO’s most recent survey was for July 1999to June 2000. The first detailed analysis of the survey’sdata has been done by India’s pre-eminent scholar onemployment K. Sundaram of the Delhi School ofEconomics and was published in the Economic andPolitical Weekly three weeks back. His main conclusionsare that in the 1990s:
# using the most comprehensive measure, the overallunemployment rate-that is, proportion of the labour forceunemployed-worsened;
population ratios -that is, the proportion of thepopulation which is working-reduced sharply, implyingthat the labour force’s growth rate was lower than thepopulation’s growth rate.
# age-specific worker-population ratios also fellconsiderably in the 5-9, 10-14, 15-19 and 20-24 agegroups, indicating that school and college enrolment isup in substantial measure;
# for the first time since Independence, the absolutenumber of workers in agriculture declined, although itsshare in total employment is just below 60 per cent;
# barring construction, labour productivity grewsignificantly, translating into a growth of over 3.2-3.6per cent a year in average inflation-adjusted wageearnings per worker both in urban and rural India;
# two sectors, (i) construction and (ii) trade, hotelsand restaurants, increased their respective shares in theworkforce with the latter emerging as the third largestemployer, after agriculture and manufacturing.
In India, there is an inverse relationship betweenpoverty and unemployment. The poorest states-Bihar,Uttar Pradesh, Rajasthan and Madhya Pradesh-have thelowest unemployment rates while the relatively better-off and unionised states like Kerala, Tamil Nadu andWest Bengal have the highest unemployment rates. Thisis not surprising for two reasons. First, the poor justcannot afford to remain unemployed for long. Second,the more educated you are, the more choosy you get aboutthe type of employment you want.
Undoubtedly, we can expect to see Sundaram giving

Using Media and Technology in Teaching Economics106
more insights as he engageshimself in more data-bashing,particularly at the state-level. Inaddition, the Centre’s Task Forceon Employment chaired byPlanning Commission memberMontek Singh Ahluwalia isexpected to submit its report by theend of this month. Given theintellectual prowess of itschairman, the task force’s reportwould definitely be authoritativeand will certainly generate muchdiscussion. What it has to say onorganised-sector employment willbe of special significance. Theseare jobs that are sought after byall but actually gained by a tinyfew-only 7 to 8 per cent of totalemployment in India is in theorganised sector but the pay,privileges and perquisites of thisminuscule minority occupiescentre-stage of policy and politics.
The task force’s calculations reveal that organised-sector employment grew by 1.59 per cent per year inthe 1980s but fell steeply to 0.86 per cent between 1991and 1997. The task force attributes this deceleration tothe sharp fall in the growth rate in public-sectoremployment from 2.22 per cent in the 1980s to 0.38 percent in the 1990s; the growth rate of private-sectoremployment actually went up from 0.16 per cent to 2per cent during the same period. The fall in public-sectoremployment was not compensated by the growth inprivate-sector employment since the private sector’sshare in organised-sector employment was only a third.Even so, the experience of the 1990s is reassuring andif rigid labour regulations and laws are liberalised andwe put in place a pro-labour exit policy, the growth inorganised private sector jobs will be even moreimpressive. The lack of a timely and humane exit policyhas actually hurt labour and only benefitedindustrialists-hence, the paradox of a lot of sick industrybut no sick industrialist in India.

Handbook for Economics Teachers 107
SAMPLE WORKSHEET
Time: 25 minutesName: .......................................................................
WORKSHEET 1WORKSHEET 1WORKSHEET 1WORKSHEET 1WORKSHEET 1
Mc Jobs are Expanding
• After reading the article titled 'McJobs areExpanding' by Jairam Ramesh, answer thefollowing questions:
• All questions must be attempted on the sheetitself. Use the back of the sheet, incase extraspace is required for the answers.
1. Which are the two organizations that collect dataon employment?_____________________________________________
2. Give the main findings of the NSSO survey onemployment in 1990s.__________________________________________________________________________________________
3. Does India have higher rates of poverty linked tohigher rates of unemployment? Justify your answer._________________________________________________________________________________________________________________________________________________________________________________________________________________________________
4. Why has the employment rate of growth in theorganized sector fallen sharply in the 1990s?____________________________________________________________________________________________________________________________________________________________________________________
5. What has been suggested by the author toimprove employment opportunities in India?

Using Media and Technology in Teaching Economics108
_______________________________________________________________________________________________________________________________________
The above activity takes the students beyond therealm of textbooks. It makes the topic more interestingand students learn information that is relevant and yetnot part of the curriculum. It also improves reading,writing and analytical skills of the students.
SAMPLE ACTIVITY 5
Teachers could also use newspaper articles to test howstudents apply the knowledge they learn in theclassroom. See the following example on how a teachercould observe whether her students have understoodthe concept of ‘market equilibrium’ in class XII.Topic: Market EquilibriumTotal Time for Activity: 20 minutes
General Objectives:• Understanding market equilibrium• Show students the relevance of economics in
everyday life• Development of analytical skillsResources required:• Magazine article given below - one for each
student• Classroom to be organized so that children can
work individually
Vegetable prices rise as monsoon plays truant
L.N. Revathy
Traders sorting cabbage at the Mettupalayam vegetablemarket in Coimbatore.
COIMBATORE, Aug. 7, 2002With the southwest monsoon playing truant, arrival
of vegetables, both grown in the hills and plains, in themain Mettupalayam vegetable market in Coimbatoredistrict of Tamil Nadu has started dwindling, leading toprice spiral in the last one week. ….. Business Line
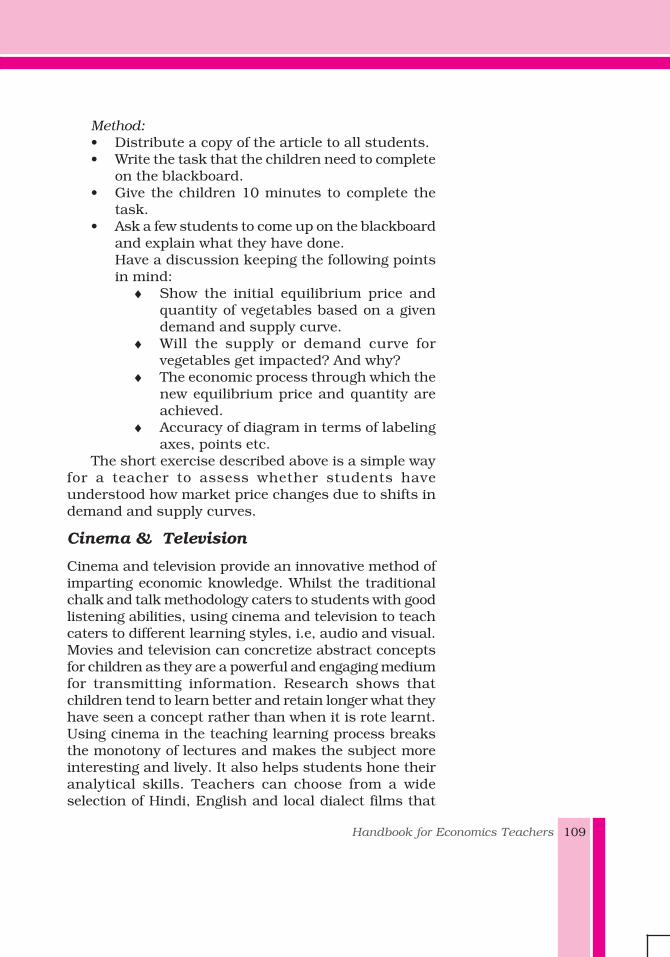
Handbook for Economics Teachers 109
Method:• Distribute a copy of the article to all students.• Write the task that the children need to complete
on the blackboard.• Give the children 10 minutes to complete the
task.• Ask a few students to come up on the blackboard
and explain what they have done.Have a discussion keeping the following pointsin mind:
♦ Show the initial equilibrium price andquantity of vegetables based on a givendemand and supply curve.
♦ Will the supply or demand curve forvegetables get impacted? And why?
♦ The economic process through which thenew equilibrium price and quantity areachieved.
♦ Accuracy of diagram in terms of labelingaxes, points etc.
The short exercise described above is a simple wayfor a teacher to assess whether students haveunderstood how market price changes due to shifts indemand and supply curves.
Cinema & Television
Cinema and television provide an innovative method ofimparting economic knowledge. Whilst the traditionalchalk and talk methodology caters to students with goodlistening abilities, using cinema and television to teachcaters to different learning styles, i.e, audio and visual.Movies and television can concretize abstract conceptsfor children as they are a powerful and engaging mediumfor transmitting information. Research shows thatchildren tend to learn better and retain longer what theyhave seen a concept rather than when it is rote learnt.Using cinema in the teaching learning process breaksthe monotony of lectures and makes the subject moreinteresting and lively. It also helps students hone theiranalytical skills. Teachers can choose from a wideselection of Hindi, English and local dialect films that
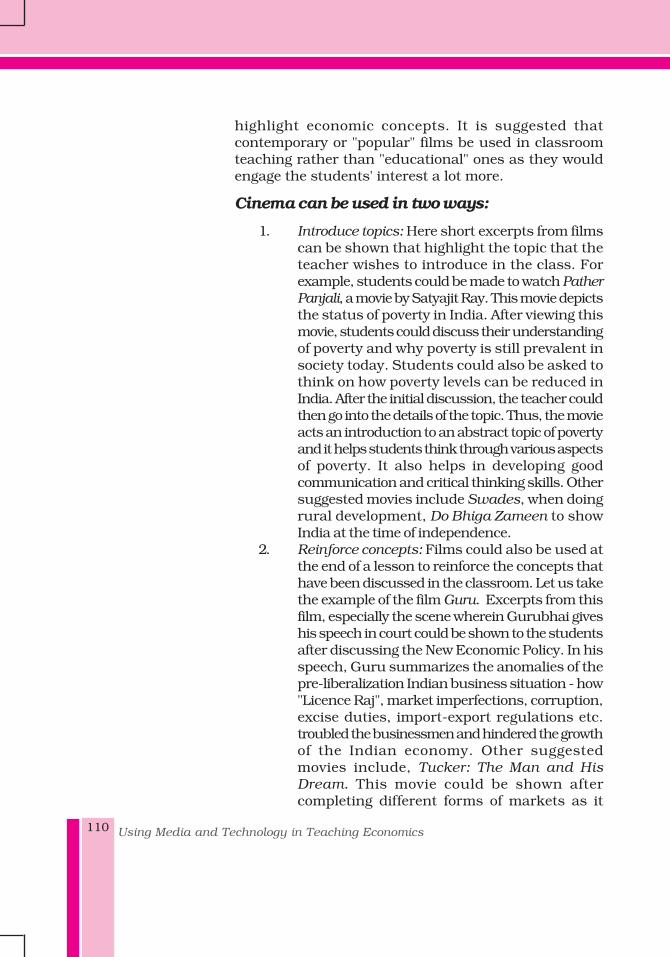
Using Media and Technology in Teaching Economics110
highlight economic concepts. It is suggested thatcontemporary or "popular" films be used in classroomteaching rather than "educational" ones as they wouldengage the students' interest a lot more.
Cinema can be used in two ways:
1. Introduce topics: Here short excerpts from filmscan be shown that highlight the topic that theteacher wishes to introduce in the class. Forexample, students could be made to watch PatherPanjali, a movie by Satyajit Ray. This movie depictsthe status of poverty in India. After viewing thismovie, students could discuss their understandingof poverty and why poverty is still prevalent insociety today. Students could also be asked tothink on how poverty levels can be reduced inIndia. After the initial discussion, the teacher couldthen go into the details of the topic. Thus, the movieacts an introduction to an abstract topic of povertyand it helps students think through various aspectsof poverty. It also helps in developing goodcommunication and critical thinking skills. Othersuggested movies include Swades, when doingrural development, Do Bhiga Zameen to showIndia at the time of independence.
2. Reinforce concepts: Films could also be used atthe end of a lesson to reinforce the concepts thathave been discussed in the classroom. Let us takethe example of the film Guru. Excerpts from thisfilm, especially the scene wherein Gurubhai giveshis speech in court could be shown to the studentsafter discussing the New Economic Policy. In hisspeech, Guru summarizes the anomalies of thepre-liberalization Indian business situation - how"Licence Raj", market imperfections, corruption,excise duties, import-export regulations etc.troubled the businessmen and hindered the growthof the Indian economy. Other suggestedmovies include, Tucker: The Man and HisDream. This movie could be shown aftercompleting different forms of markets as it

Handbook for Economics Teachers 111
highlights oligopolies and barriers to entry andlong run costs.
A drawback of showing movies to students is that itrequires time which extends beyond the stipulatedeconomics class. Thus teachers would need to requestcolleagues for classes to be able to undertake film basedactivities.
A more realistic resource that is widely available tostudents is the television. Television offers a large rangeof news channels that students should be encouragedto watch. These channels have a variety of programmesthat relate to the Indian and world economy, includingbusiness. Channels such as CNBC, NDTV Profit, ZeeBusiness, DD News, CNN- IBN, NDTV 24x7, NDTV India,CNBC Awaz are a few channels that teachers could asktheir students to watch.
There are several ways in which a teacher couldchannelise her students' television viewing.
1. News based activities: A teacher could deputeat least one period a week to discuss whatstudents have watched on the television. Bydoing this the teacher will allow students toclarify doubts and seek clarifications onconcepts, ideas and views that they may haveheard. As students share information it alsogives them a feeling of being involved in thelearning process. Alternatively, a teacher couldprepare a quiz based on the business andeconomics news. This could be played inteams. Such an activity would break themonotony of lecture based teaching, motivateand encourage students to listen to the newsand hence, become more aware of currenteconomic and business affairs.
2. Programme based activities: For this to be asuccess a teacher would need to research onthe programmes that are telecasted at differenttimes. She would need to select an appropriateprogramme for her students to watch basedon which an assignment could be set. Forexample, when the budget is presented by the

Using Media and Technology in Teaching Economics112
Finance Minister in February, there are manyprogrammes that analyse the budget. Here theteacher could ask her Class XI students towatch one such programme so they canidentify what the budget has in store for somespecific sectors of the economy:a. Agriculture, rural economyb. Industryc. Servicesd. InfrastructureThe following day the teacher should hold asmall group discussion (see Sample Activity 3above for methodology) wherein studentsanalyse the impact of the budget on thedifferent sectors of the economy. This activitywould help students reflect on and correlatewhat they have learnt in Indian economicsthrough the year. It shall also be useful forthem to recall later in the year when they reachClass XII and study the different componentsand objectives of a budget.
3. Other activities: Teachers should also try andto develop creative activities that allowstudents to watch television and enhancelearning. For example, in class XII afterteaching the features of an oligopotistic,especially the use of selling costs, a teachercould undertake the following activity:
Ask every student to:• Choose any one commodity of their choice• Watch the advertisements of different brands of
this commodity• Make a chart that compares and contrasts the
different features of the advertisements• Choose one particular brand based on the
advertisements watched and explain why thebrand has been chosen.
So, if a student chooses washing detergents as herproduct then she should closely watch theadvertisements of brands such as Tide, Surf Excel, Ariel,

Handbook for Economics Teachers 113
Rin, Nirma etc. She will then need to make notes onwhat are the common features of all these advertisementsand in what respect do they differ. Things that could beincluded in the table would be price, packaging, anypromotional schemes or freebees, tag line, visual appeal,length of advertisement, time of day at whichadvertisement is telecasted. Based on her chart and visualimpact of the advertisement the student should be ableto explain to the class the brand of detergent she wouldselect. This activity will help students understandconcepts such as non-price competition and persuasiveadvertisements. It also improves their powers ofobservation (as they compare subtle differences inadvertising).
Internet
In a knowledge based world, where there is a deluge ofinformation, it is important to teach our students howto sift, sort and cull out information that can be usedeffectively. Research skills, an important aspect, needto be developed in our students as they cannot know orlearn all available information. They need to learn fromwhere relevant information can be obtained and thenhow to use it. The internet is a resource that providesjust this opportunity. The internet can be used effectivelyin the following different ways.
1. Information collection: The internet is a goldmineof information that can be tapped by studentswith a click of a mouse. This information couldbe used to enhance knowledge on a topic or usedfor projects and assignments. While surfing thenet in search for what the teacher has asked for,a student could also stumble onto a myriad ofother related information that would enrich his/her knowledge.An example wherein 'information collection' fromthe internet could become an interesting andenriching experience for both students andteachers is discussed below:
Class: XITopic: Goals of Five Year Plans

Using Media and Technology in Teaching Economics114
General Objectives:• Understanding the objectives and challenges of
the 12th Five Year Plan• Enhance research skills• Exposure to ideas beyond the academic
curriculum• Developing an interest in Indian economicsResources required:• Internet availability• Bulletin board with thumb pins• Quiz to be prepared by the teacher once the
bulletin board is readyMethod:• Divide the class into groups of 6 students each• Each group would be given one week to surf the
internet to find information on a particular topicrelated to the 12th Five Year Plan. These couldinclude:
♦ Salient objectives♦ Challenges faced♦ Sector -wise proposals
⇒ Agriculture⇒ Industry⇒ Social sectors⇒ Economic infrastructure
• Each group would need to put up their findingson a well presented chart on the bulletin board.
• Students would be given a week to read thedifferent groups' findings on the board (duringtheir leisure time).
• A quiz on the 12th Five Year Plan could be heldto assess the students understanding of whatthey have read.
When such internet based activities are given, it issuggested that the teacher give a few recommended sitesthat students could look at. In the case of plans thefollowing websites could be suggested:
• http://www.planningcommission.nic.in• http://www.developednations.org
When the internet is used a source ofinformation for a larger project, students need

Handbook for Economics Teachers 115
to be guided on where and how to find relevantinformation. Students need to learn how to find,sift and analyse the information and determinewhether it is applicable to the assignment, taskor project on hand. Typically students justdownload information without understanding oranalyzing it. They cut and paste information thatis available on the internet instead ofunderstanding the information and writing it intheir own words. One way in which teacherscould overcome this problem is by askingstudents to give an oral presentation or viva onwhat they have written in their projects. Also,when students are asked to source informationfrom the internet for projects and presentations,they need to be made aware of the issues ofcopyright and plagiarism.
2. Completing Internet based Assignments: Theinternet is a wonderful resource that teacherscan tap to create assignments. When childrenwork on internet based assignments it increasestheir motivation to learn as they become moreactive in the learning process. Teachers have theoption of developing tutorials, assignments orworksheets.
SAMPLE ASSIGNMENT USING INTERNET
An internet based worksheet could be prepared forcomparing the development of India, Pakistan andChina. It is suggested that this worksheet be done as aclassroom activity in order to ensure that children workindependently and do not cross check with each other.
Class: XITime: 1 hourTopic: Comparative Development Experiences of
India and its NeighboursMethod:• Divide the students in pairs• Distribute a copy of the sample worksheet to each
pair.

Using Media and Technology in Teaching Economics116
• Visit the suggested websites to gather the dataon India, China and Pakistan.
• Based on the data collected answer thequestions.
INTERNET BAINTERNET BAINTERNET BAINTERNET BAINTERNET BASED WORKSHEETSED WORKSHEETSED WORKSHEETSED WORKSHEETSED WORKSHEET
Comparative Development Experiencesof India and its Neighbours
Instructions:Visit the site: http://hdr.undp.org/en/media/
hdr_20072008_en_complete.pdfFrom the tables given in the website, complete the tablegiven below for India, China and Pakistan.
Parameter
Life expectancy at birth (yrs)
Adult literacy rate (% above 15 years)
Combined Gross Enrolment Ratio (%)
Life Expectancy Index
Educational Attainment Index
Gross Domestic Product Index
HDI Index
HDI Rank
Total Population
Population growth
% of urban population in 1975
% of urban population in 2005
% of population under 15 years of age in2005
% of population over 65 years of age in 2005
Per capita expenditure on health by thepublic sector
India China Pakistan

Handbook for Economics Teachers 117
Based on the figures written by you, answer thequestions.1. How does India compare with China in terms
of overall human development?2. Has Pakistan achieved high / middle / low
level of human development?3. Compare the urbanization of population in the
three countries.4. How does the percentage of working population
of India compare to that of China andPakistan?
5. What is the percentage of Education Attainmentthat India has achieved?
6. Have the HDI for India, China and Pakistanimproved over time? Justify your answerthrough figures.
7. What should India do to enhance its educationattainment and make it comparable to themore advanced nations?
8. What kind of correlation, if any, do you findbetween life expectancy and human
Per capita expenditure on health by theprivate sector
One year old fully immunized against TB
One year old fully immunized againstmeasles
Population with sustainable access toimproved sanitation
Population with sustainable access toimproved water source
Public expenditure on education as a % ofGDP
Public expenditure on education as a % ofgovernment expenditure
Gross Domestic Product ($PPP)
Gross Domestic Product per capita ($PPP)
Annual growth rate of Gross DomesticProduct
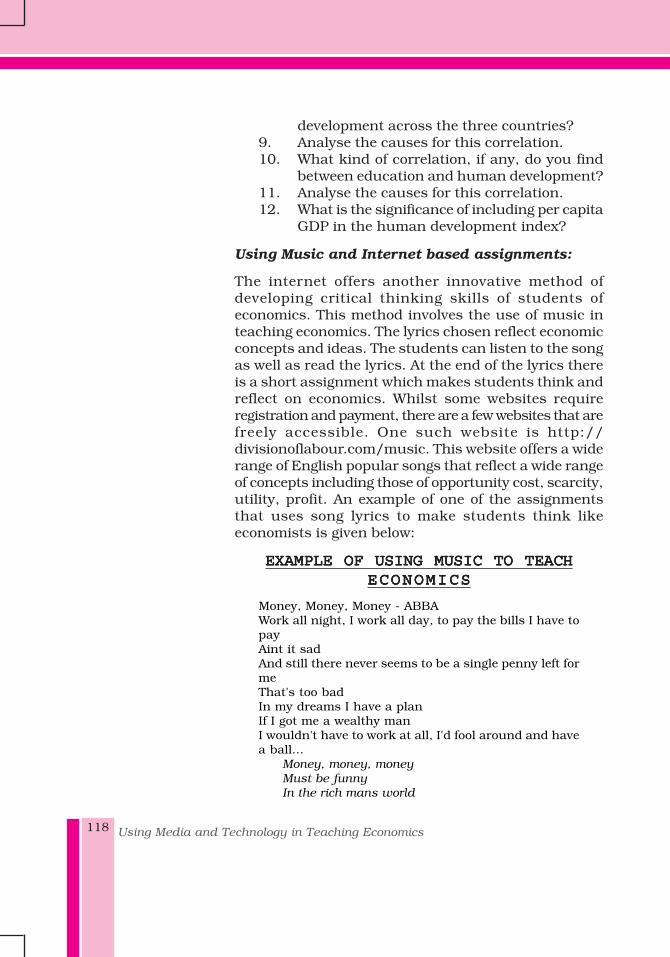
Using Media and Technology in Teaching Economics118
development across the three countries?9. Analyse the causes for this correlation.10. What kind of correlation, if any, do you find
between education and human development?11. Analyse the causes for this correlation.12. What is the significance of including per capita
GDP in the human development index?
Using Music and Internet based assignments:
The internet offers another innovative method ofdeveloping critical thinking skills of students ofeconomics. This method involves the use of music inteaching economics. The lyrics chosen reflect economicconcepts and ideas. The students can listen to the songas well as read the lyrics. At the end of the lyrics thereis a short assignment which makes students think andreflect on economics. Whilst some websites requireregistration and payment, there are a few websites that arefreely accessible. One such website is http://divisionoflabour.com/music. This website offers a widerange of English popular songs that reflect a wide rangeof concepts including those of opportunity cost, scarcity,utility, profit. An example of one of the assignmentsthat uses song lyrics to make students think likeeconomists is given below:
EXAMPLE OF USING MUSIC TO TEACHEXAMPLE OF USING MUSIC TO TEACHEXAMPLE OF USING MUSIC TO TEACHEXAMPLE OF USING MUSIC TO TEACHEXAMPLE OF USING MUSIC TO TEACHECONOMICSECONOMICSECONOMICSECONOMICSECONOMICS
Money, Money, Money - ABBAWork all night, I work all day, to pay the bills I have topayAint it sadAnd still there never seems to be a single penny left formeThat's too badIn my dreams I have a planIf I got me a wealthy manI wouldn't have to work at all, I'd fool around and havea ball...
Money, money, moneyMust be funnyIn the rich mans world

Handbook for Economics Teachers 119
Money, money, moneyAlways sunnyIn the rich mans world
Assignment:Economists often use supply and demand curves to
illustrate markets. Changes in income, preferences, andthe price of a substitute or complement shift demandcurves to the left and right. In the lyrics above, lead singerAnni-Frid Lyngstad is tired of the hard work life requiresand plans to marry a wealthy man. If successful, howwould this marriage change the artist's demand forgoods? How would it change her supply of labor?Illustrate both changes with supply and demand curves.Be sure to explain what is happening in the diagrams.
SOURCE: http://divisionoflabour.com/music
A teacher need not be restrained by the assignmentgiven in the website. She could develop her ownassignment based on the lyrics.
An internet based task makes the subject come alivefor students. They are actively engaged in the learningprocess and it helps them crystallize nebulous andabstract ideas and concepts. This leads to increasedlevels of interest and motivation in the subject, whichpositively impacts the students' performance. However,a drawback of making internet based activities is thatthe internet may not be accessible to all students athome.
3. Internet for teachers: Internet is also a greatresource for teachers. Teachers can use theinternet for a wide spectrum of reasons spanningfrom improving their own knowledge anddownloading games and simulations to developingwebsites, blogs etc. for the students.Many a times as teachers we are not sure of thecorrect meaning or definitions of certaineconomics terms. The internet offers severaleconomic dictionaries where such concepts andterms are very well explained. These websitescould be tapped to clarify subject content. Ateacher needs to 'google' search for the word,concept or idea for which a clarification or

Using Media and Technology in Teaching Economics120
definition is sought and the internet would giveher several options, which she could read.The internet is also storehouse of resourcematerials that can be used effectively forclassroom teaching. We have already discussedabove how internet based assignments can bedeveloped. In addition, statistical data and extrainformation in the form of facts, anecdotes andviews on different topics are available. These canbe used by teachers to make their interactivelectures more interesting and meaningful. Also,several games and simulations are also availableon the internet which can enhance the teachingof micro and macro topics. However, the gamesas suggested on the internet may not be usableby the teachers. Teachers may need to adaptand/or modify these games to make them morerelevant to their classroom context.As mentioned earlier, the internet is a resourcebank for teachers. Here we have been able tohighlight only a few of the resources that can befound on the internet. Though several websitesrequire teachers to pay a subscription fee, thereare a large number of websites that allowteachers to download resources without any cost.Teachers are strongly urged to surf the internetto explore and discover what resources areavailable so that they can make the teachinglearning process more interesting andstimulating for the students.Teachers who are more comfortable with theinternet could lalso develop their own websitesor blogs etc. that would allow for collaborativelearning.
Computer Aided Instruction and / or OHP
Several schools today have access to computers.In case computers are unavailable similaractivities can be done by students by usingsimple charts. The idea of computer aidedinstruction could be at two levels:

Handbook for Economics Teachers 121
a. Teacher based: Here the teacher presents a topicthrough a power point presentation or OHP. Thismakes lectures more visual, colourful andinteresting for students. For example, a teachercould prepare flowcharts or diagrams on a chartpowerpoint presentation and use these aids toenhance the learning experience of the students.For example, the circular flow of income andnational income aggregates could be made livelyand interesting through the use of flowchartson transparencies or powerpoint presentations.(please refer to the chapter or concept mappingin this book on how to make flow charts)
b. Student based: Here children research on a topicand present their viewpoints through power pointor multi media presentation. In this way there ispeer teaching-learning and students improveresearch skills, presentation skills,communication skills, enhance team work andoverall confidence levels. A word of caution inthis activity is that students may need to stayback after school hours or meet outside of schoolto develop their presentations. We shall discussan activity where children use computers for peerlearning.
SAMPLE ACTIVITY ON COMPUTER AIDED INSTRUCTION
Any topic could be used for computer aided instruction.As an example we shall take the topic of 'Infrastructure'that could be taught through this method.
Class: XITime: 6-8 teaching periodsTopic: Infrastructure & Human Capital DevelopmentMethod:• Divide the children of a class into groups of 4-6
students each.• Allow each group to select one type of
infrastructure that they would like to researchand present. This would include topics such as

Using Media and Technology in Teaching Economics122
energy, transport, housing, health, educationetc.
• Give each group at least two weeks to preparetheir presentation.
• Each presentation should not be more than 15minutes, which shall be followed by a questionand answer session.
• Clarify the order in which the presentations shallbe made.
• At the beginning of the lesson the teacher shouldgive an overview of the significance and types ofinfrastructure (in case no student group iscovering this aspect).
A teacher would also need to plan for the studentsto be able to make their presentations. This wouldinclude the arrangement of the computer system withthe LCD projector. In case students are usingtransparencies, the teacher would need to ensure theavailability of the OHP.
When teachers use peer learning the role of the teachershifts from becoming an information provider to a facilitator,consolidator and a discussion guide. The teacher needs toprovide a holistic perspective of the topic that the studentsare presenting. She also becomes a learner, as childrenalways find some information that we teachers are unawareof.
RATIONALE FOR USING MEDIA &TECHNOLOGY
The advantages of using media and technology as atool to enrich the teaching learning process are clear inthe discussion so far. Let us however, summarise belowthe advantages of using media and technology as toolsto direct learning:
• Making learning more child-centric and engagingthe learner actively in the learning process.
• Knowledge beyond the textbook, thus taking thestudent towards beyond being a 'bookworm'.

Handbook for Economics Teachers 123
• Enhanced motivation levels of students, whichleads to increased levels of interest in the subject.
• Enhanced retention of knowledge as the subjectbecomes more interesting and engaging.
• Application of knowledge to real world situationsand everyday life.
• Development of research skills and ability toprocess information in a knowledge based world.
• Development of critical thinking andcommunication skills as students engage indiscussing, deliberating and presenting theirviews and ideas.
• Development of collaborative learning processeswhen group and team work is undertaken.
• Enhanced confidence levels as collaborativelearning processes are undertaken.
Limitations of using media and technology inteaching
It is important to remember that using media andtechnology only enhances and enriches the teachinglearning process. Whilst it provides an innovative,interesting and engaging way to help students learnconcepts, it cannot be a substitute to interactivelectures. Teachers also need to feel comfortable withthe use of media and technology as a teaching aid. Theycould start with simple activities such as data collectionand articles initially and then move to more complexactivities such as multimedia presentation andsimulations and games. However, there are somelimitations in using media in the teaching learningprocess. Some of the issues that teachers need to keepin mind when using media and technology to teach areas follows:
• Changing role of the teacher: Role of teacherchanges from an instructor or informationprovider to a guide and facilitator. Hence,teachers need to give students the chance tothink, talk, discuss, debate and deliberate beforesummarizing and giving their own views.Teachers must be open-minded to ideas and

Using Media and Technology in Teaching Economics124
views of students. They must realize that whenopen ended or grey areas are being discussed,there may not always be a straight jacketedanswer.
• Detailed planning of activities: When teachers goin for media and technology based activities, theyneed to ensure that these activities orassignments are prepared and plannedmeticulously to achieve the desired results. Inorder to develop a good activity, a teacher must:
o Have a set of clear objectives that need to beachieved.
o Determine whether the activity will beindividualistic (eg: newspaper article) or grouped(eg: powerpoint presentations)
o Give specific and clear-cut instructions. Many atimes it has been observed that wheninstructions to students are vague, then despitehaving a good activity the impact of the activityon learning is lost.
o Provide an assessment matrix, if the activity isgoing to be marked. This helps students to realizethe critical areas on which they will be evaluated.For example, when students are asked to makepower point presentations, then the teachercould inform students that they shall be judgedon parameters including, content, presentation,ability to answer questions etc.
• Be a firm facilitator: When engaging students indiscussions teachers should not lose perspectiveof the topic. Teachers need to be firm facilitators.They should navigate the discussion into areasthat are relevant to the topic on hand.
• Have a contingency plan: Many a times thereare Problems as technology failures may occur.It may problems that just when there is theEconomics class where the teacher has plannedto show a movie, there is no electricity. Or, thecomputer system may fail, when the teacherwants to discuss a topic through a power pointpresentation. In these cases, the teacher must

Handbook for Economics Teachers 125
have a back up plan ready so that teaching timeis not wasted.
• Don't overdo the usage of media and technology:Teachers should use their discretion to the extentmedia and technology should be integrated intotheir classroom teaching. Do not let it over powerand become the all-important facet of theteaching learning process and forget the actualcurriculum that needs to be completed. The ideais to have a right balance of media and technologythat is integrated into lesson plans rather thanuse them as independent activities.
To conclude, whilst there are limitations andchallenges when using media and technology in teachingEconomics, the advantages of integrating them are fargreater. This chapter only gives samples of what can beachieved by using media and technology. The ideaspresented here are by no means exhaustive. They areindicative, in the hope that teachers shall take theseforward and experiment. Every teacher is encouragedto use media and technology in her classroom teaching,because unless one doesn't use it one will never knowthe advantages. So teachers, open the world ofinnovative learning experiences for the students!

ChapterChapterChapterChapterChapter 9
Importance of Mathematicsin Teaching Economics
Economics being a living subject deals with current andfuture problems touching all our lives intimately. Therehas been significant change in its character and isundergoing continuous development. One of the majorrevolutions in the subject area is the use ofMathematical expressions in Economics. Mathematicsacting as a language parsimoniously and prolificallyhelps in meeting the purpose of economics. In doing soit provides concrete form to economic laws andrelationships, and makes it more precise and practical.The formal mathematical expression of economic ideasenables to give the loose economic intuition a coherentand logical meaning and in derivation of certain results,which would either be impossible through verbal logicor would involve clumsy, complex and circular process.Economics is often concerned with variables, which aremeasurable and involve relationships between them thatcan be expressed by means of functions and curves fora convenient understanding of the underlying concepts.This necessitates as well as facilitates the use ofmathematical techniques.
The students need to be shown how economics canhelp in understanding what goes on in the world andhow it can be used as a practical tool for decisionmaking. They need to have a good understanding ofhow learning can actually be used outside theclassroom.
To respond to these needs, the new textbooks of classXII, Introductory Microeconomics and IntroductoryMacroeconomics, prepared by NCERT on the basis ofthe recommendations of NCF 2005 have incorporatedthe recent developments in the theory aided by amathematical treatment of the issues involved. The NCF2005 recommends for change in perceptions in thenature of social science curricula including economicsin such a manner that it becomes an intellectual andprofessionally challenging subject of study.Reorganisation of the pattern calls for the restructuringof many traditional ideas.
At the higher secondary stage, the learners are in aposition to understand abstract ideas, exercise the powerof thinkers and to develop their own perceptions. It isat this stage, the learners are exposed to the rigours ofthe discipline of economics in a systematic way. Theeconomics courses are introduced in such a way thaton the initial stages, the learners are introduced toeconomic realities that the nation is facing today alongwith some basic statistical tools to understand thesebroader economic realities. In the later stage, thelearners are introduced to economics as a theoreticalcourse. The treatment of these issues involves the useof mathematical tools and statistical techniques. Themathematical tools with which school students arealready familiar, such as algebra and solutions ofsimultaneous equation have been attempted in thetextbooks. As a result, it should be suitable for studentswith a broad range of backgrounds. The inclusion ofthe recent developments in the theory and theintroduction of simple mathematical expressions intothe economics curricular materials will provide thestudent with the necessary modern tools and enablethem to approach and analyse with more realism theeconomic problems that they will confront in their dayto day life.
The students of the course are very heterogeneouswith respect to their mathematical abilities and priorknowledge of economic concepts and ideas. The teacherhas to address to this problem by initially making them
Handbook for Economics Teachers 127

Importance of Mathematics In Teaching Eoonomics128
equipped with the fundamentals of mathematical toolsthat are covered in the text. The teachers themselvesmight feel that, this alternative of introducingmathematical language to communicate economictheories is not essential as they are coping perfectlysatisfactorily with the verbal presentation. Here it is tobe stressed that mathematics is not a substitute foreconomic ideas, it is a precise form of presentingsome of them. The mathematical presentation oftheories does not mean that we should be discardingverbal approach. Learning basic mathematical methodshas become indispensable for a proper understandingof the current economic literature. The challenge is tounderstand economics, the mathematics being only ameans to an end.
The 'math anxiety' of the students has come intoexistence largely because of the inappropriate mannerin which the subject is often presented to the students.Mathematics is presented to them in an overly formalstyle, not accompanied by any intuitive illustrations ordemonstrations. This impairs the motivation and makesthe topics appear more difficult than they actually are.The teacher may have to make a serious effort tominimise these anxiety causing features and explainwhy it is worth tackling economics mathematically atall. The challenges that the teachers might face includelow levels of confidence with respect to mathematicalability, limited fluency in algebra, limited understandingof the usefulness of mathematical principles in economicargument and dif ficulties in recognising themathematical representation of a problem withineconomic theory. However, disdainful and painful itturns out to be, we cannot dispense the use ofmathematics in economics, which makes it a real social'science' subject. Students should be not only enabledto solve mathematical problems but also shouldunderstand how to convert, a verbal description of aneconomic model into mathematical form. She shouldbe able to mathematically explain the theory. Forexample, when she states the formulae of price elasticityas

Handbook for Economics Teachers 129
.p x
Edx p
Δ=
Δ She should also be able to state what the concept
means. After learning the subject she should havelearned to assimilate data, investigate hypothesis, dealwith uncertainty and complexity and ultimately cometo a decision. They have to learn how to read amathematical expression in words, and to convert wordsinto the language of maths. Often a problem can besolved graphically- the solution can then be replicatedalgebraically. The graphical illustrations give visualreinforcement to algebraic results.
Illustrations of the use of mathematics in economicsare varied and are not far to seek.
The ideas or theorems in economics can be expressedmathematically- e.g.
(i) Quantity demanded depends on price or thatconsumption depends upon level of incomecan be mathematically expressed in the formof functional relationships. Q = f (P), C= f (Y),read as 'quantity is a function of price' and'consumption is a function of income'.
(ii) Economics is the science of choice making andinvolve the use of mathematics ranging fromgeometry to calculus. The consumerequilibrium is studied in the context of givenincome and prices and involves solving ofsimultaneous equations for unknowns.Equilibrium itself is a mathematical conceptderived from statics and dynamics.
(iii) Consumer equilibrium and equilibrium of thefirm involve decisions at the margin andmathematically turns out to be the firstderivative of the relevant function.
(iv) The change in price on account of the changein output depends upon elasticity of demandand supply and 'elasticity' is, in fact, amathematical concept.
(v) The maximisation and minimisation of variableslike profit, cost, revenue, utility etc obviously
Importance of Mathematics In Teaching Eoonomics130
involves mathematical expression and can besolved with the help of differential calculus,linear programming or theory of games.
We can see that the basic relationships inMicroeconomics and Macroeconomics can be put in theform of functions and equations thereby making it easy,smooth and systematic. Mathematical analysis of thesort just described has been used to study how firmsreact to changes in their revenue or cost, how consumersreact to changes in the price of goods they purchase,helps to guide the work of regulatory agencies and soon.
The formal proofs of some of the propositions usedin the Microeconomics and Macroeconomics textbookdeveloped by NCERT is attempted here. No mathematicsother than elementary algebra and solutions ofsimultaneous equations is required to deal with thetextbook. Mathematical tool kit that clearly explainsits principles is also attached wherever necessary. Thesewill help to overcome the fears and prejudices aboutthe use of mathematics in economic theory and handlingthe textbook.
Chapter II in the Microeconomics textbook dealswith the theory of consumer behaviour where we seehow consumers make decisions, how their budgetconstraints and preferences determine their demandsfor various goods and why different goods have differentdemand characteristics. The chapter begins with thebudget set, which is expressed in the form of budgetconstraint that consumers face as a result of theirlimited incomes. To see how budget constraint limitsconsumer’s choices, let us consider a situation in whicha consumer has a fixed income, M, that can be spendon 2 commodities say, good 1 and good 2. Let x1 be theamount of good1 purchased and x2 be the amount ofgood 2 purchased, the prices being p1 and p2
respectively. In that case p1x
1, (i.e. price of good 1 times
the quantity) is the amount of money spent on good 1and p
2x
2 the amount of money spent on good 2.
The budget line shows all combinations of good1and good 2 for which the total amount of money spent

Handbook for Economics Teachers 131
is equal to income. As a result, the combinations ofgood1 and good 2 that the consumer can buy will be onthis line, which gives us derive the budget line equationas p
1x
1 + p
2x
2 = M. The consumer has to restrict his
expenditure up to the level of M. So we use inequalitysign to represent his budget constraint. Therefore thebudget constraint becomes p
1x
1 + p
2x
2 ≤ M. This means
that the total expenditure of the consumer on the twogoods with its prices as p
1 and p
2 , can only be less than
or equal to M. The budget line will be a straight lineintersecting the x-axis and y axis, OA & OE in the fig (i).The point A (where the budget line intersects x axis)measures the quantity of good 1 only and the point E(where budget line intersects y axis) measures thequantity of good 2 that can be purchased using herentire income. So these points will measure M/p
1 and
M/p2 respectively. The concepts of slope and intercepts
is to be introduced here for a better understanding ofthe budget constraint and its changes, with respect tochange in income of the consumer as well as changesin prices of commodity.Slope: The slope is used to tell us how much one variable'Y' changes in relation to the change in another variable'X'.
change in YSlope
change in X=
For a linear function given as y = a+ bx, b measuresthe slope i.e the steepness or incline of the line. Thismeans that a unit increase in x will result in anincrement in y in the amount of 'b'. When b>0, the linewill be positively sloped and when b<0, the line will benegatively sloped.
The equation of a budget line is given as
1 1 2 2p x p x M This has to be converted into slope form i.e.,
1
12 1
2 2
pMx x
p p
1 1 2 2
2 2 1 1
1 12
2 2
p x p x M
p x M p x
p xMx
p p

Importance of Mathematics In Teaching Eoonomics132
The slope here is 1
2
p
p− . It can also be derived from
the equation. Let the change in x1 and x
2, be x
1 and
x2 respectively.
The budget equation now becomes:
1 1 1 2 2 2p x x p x x M ...........(1)
1 1 1 1 2 2 2 2p x p x p x p x M ...........(2)
(2) – (1) 1 1 2 2 0p x p x
2 2 1 1p x p x
2 1
1 2
x p
x p
2
1
change in xSlope
change in x= = −
The negative sign shows that the line slopesdownward. The absolute value of the slope is the rate
of substitution. The slope of the budget line, 1
2
p
p is
the negative of the ratio of the prices of the two goods.The magnitude of the slope tells us the rate at whichthe two goods can be substituted without changing thetotal amount of money spent.
The points A and E are the two intercepts of thebudget line. The y intercept is distance from the orgin
1
2
p
p

Handbook for Economics Teachers 133
to the point at which the line intersects the y axis andthe x intercept is the distance from the orgin to thepoint at which the line intersects x axis. Here it beingM/p2 and M/p1 respectively. Therefore we can see thatthe vertical intercept M/p
2 represents the maximum
amount of good 2 that can be purchased with the incomeM and the horizontal intercept M/p1 tells us themaximum amount of good 1 that can be purchased.
In the linear function y = a + bx, the constant labeled'a' is the y intercept. It is the value of y when x is equal tozero. It is the point where the line intersects the y axis.Effects of changes in Income and Prices:
The budget line depends both on income and the pricesof the goods. But of course prices and income often change.Let us see how such changes affect the budget line.Change in Income: Suppose there is a change in M,say to M1. Then the equation of the budget line will bep
1x
1 + p
2x
2 = M1. Now let us convert this budget equation
to find out the slope and y intercept.p
1x
1 + p
2x
2 = M1
'1 1 2 2'
'12 1 2 2 1 1
2 2 '1 1
22 2
p x p x MpM
x x p x M p xp p
p xMx
p p
+ == − = −
= −
From the equation in the slope form, we can seethat a change in income alters the vertical intercept of
the budget line '
2
M
p, but does not change the slope
1
2
p
p−
(because the prices of neither good changed). The budgetline will shift parallel inward or outward depending onthe change in income. (Fig 2). When M′ > M then the
Fig. 2
E1
E
E2
A2 A A1
Goo
d 2
Good 1
Importance of Mathematics In Teaching Eoonomics134
shift will be outward ( A1E
1) and if M′< M then budget
line shifts inward. (A2E
2)
Change in Prices: Now let us see what happens to thebudget line if the price of one good changes but the price ofthe other does not. Suppose the price of good 1 changesfrom p
1 to p1
1 then the budget line equation will be
,1 1 2 2p x p x M+ =
'2 2 1 1p x M p x= −
'1
2 1
2 2
pMx x
p p= −
In that case the vertical intercept remains unchanged
although the slope now has changed to '
1
2
p
p− .
Because of the decline in the price of good 1 themaximum amount of good 1 that can be purchasedincreases leading to a change in the slope of the linekeeping the vertical intercept constant. (the maximumquantity of good 2 that can be consumed using wholeof the income does not change i.e. M/p
2)
Here using simple mathematical equation andnotations we have explained succinctly and preciselythe form of budget set, how it changes in differentsituations and also tells us something about thedeterminants of a consumer, purchasing power.
The structure of an economic model consists of aset of equations when it is explained in mathematicalform. These equations are constructed by relating anumber of variables to one another. A variable issomething that can take on different values. e.g. price,revenue, cost etc. In economic applications we use threetype of equations namely definitional equation e.g.π ≡R – C , behavioral equation e.g. C = 20 + 5 Q andequilibrium condition e.g. Qd + Qs. The important thingabout variable is the way in which different variablesare related to one another.
Functions are used to describe and symbolizerelationship between variables. The idea of a function notonly involves the concepts of a relation between the valuesof two variables but also shows the dependence of one

Handbook for Economics Teachers 135
variable on the other. e.g. D= f (P) Here demand is a functionof price meaning that the quantity demanded is dependenton the price of the commodity.
It is through application of the relevant mathematicaloperations to these equations, we seek to derive a set ofconclusions.
We have the equation of the linear demand curvegiven as q= a-bp. We can derive a set of conclusionsfrom this equation, which states the relationshipbetween quantity demanded and price.
(i) The slope of this demand curve is –b whichshows that the change in demand per unit
change in the price i.e. q
bp
∆ =−∆
Let us suppose that the change in quantitydemanded is Δq and change in price is Δp.Then the equation becomes
−∆ = − −∆( )q q a b p p
−∆ = − + ∆ −q a bp b p q
∆ =− + − ∆ +q a bp b p q
q a bp b p a bp∆ = − + − ∆ + − (as q= a-bp)
∆ =− ∆q b p
∆ =−∆
qb
p
The negative sign of the slope clearly showsthat the demand curve is sloping downwardsand the demand function show demand as amonotonic decreasing function of the price ofthe commodity. This proves the law of demand.
(ii) Applying to the formulae for elasticity ofdemand we obtain the elasticity of a lineardemand curve at various levels of price.
∆=∆
.d
q pE
p q
pb
q=− (as
q
p
∆∆ = –b)

∴Ed = −−
bp
a bp (as q = a-bp)
Now to find the elasticity at various levels of prices,
let us take price at three levels namely p=0, p=2a
b
and p = a
b .
When p = 0
Ed = −−.0
.0
b
a b = 0 (Substituting 0 in place of p)
When p = 2a
b
Ed = = × =−
22 12
2
ab ab
a aa bb
When p= a
b
Ed = = =∞−
10
ab
ba
a bb
This helps to precisely state that the price elasticityof demand is different at different points on the lineardemand curve.
It follows that there can be no doubt thatmathematical methods are possible in economics andthat it can be used to make the economic relations moreexpressible and clear. Thus mathematical approach isrightly considered as a quick mode of transportation butall the same, a theorist must accustom himself withmathematical techniques and their applications whichdriving lessons to elucidate the problems of economictheory. As in words of Prof.Samuelson, mathematics isneither necessary nor a sufficient condition. It can help…
Importance of Mathematics In Teaching Eoonomics136

ChapterChapterChapterChapterChapter 10
Basic Mathematical Toolsfor Introductory Economics
This chapter is designed to set out some of the basicmathematical tools needed to effectively transact/learn the economics at higher secondary level. It
is odd, that still in this era, mathematics as a subjectevokes fear & awe. Majority of the hue and cry on thenew economics textbooks introduced by NCERT havebeen on the mathematical expressions used. Eventhough high order mathematics is not attempted in theintroductory textbooks, still teachers and students arefinding it difficult in coping with content. Therefore herethe attempt is to give an introduction to basicmathematics capable of providing tools for use ineconomic theory which shall initiate the process oflearning economics better. Graphical illustrations havealso been used to give visual reinforcement to algebraicresults. The users, even if they don’t have anyelementary knowledge of mathematics will be able togo through this chapter as it is done without presumingany elementary knowledge of mathematics. As a result,it should be suitable for students and teachers with abroad range of backgrounds.Let us now go back and remind our selves some of thevery basics involved in dealing with mathematics. Allthese have already been covered in our mathematicscurriculum, but most of us might have been ‘taught tothe test’and may not have intuitive grasp of the subjectand how it works. In economics we take the help of

Basic Mathematical Tools for Introductory Economics138
mathematics to express the real life situations and solvethe problems. We have already discussed the relevanceof mathematical treatment of economics in the previouschapter.
Some Real Basics
Wherever we deal with economics we will come acrossvariables which have some relationship with each otherand can also evolve set of equations. Take the case oftwo variables quantity demanded and price. Both thevariables are related and their relationship can beexpressed in the form of equation. Suppose say therelationship is expressed as Qd= 40 –3p. In essence,this is an equation that says that one side of the equalssign represents a value that is exactly the same as thevalue on the other side of the equation. By substitutingdifferent values for p, the quantity demanded at thatparticular price can be derived. We can derive at manyconclusions, like, price and quantity demanded areinversely related and that for one unit change in pricethe quantity changes by 3 units and so on. Beforemoving on to equations in details lets learn certain basicsrelated to it.
Negative numbers:
In economics while dealing with equations or otherwisewe come across numbers with negative signs attached.The rules of addition , subtraction , multiplication anddivision involving the negative numbers should beunderstood before proceeding further.
(i) Addition of two negative numbers: We add thequantities and affix the negative sign. Eg – 2 +- 4 = - 6
(ii) Addition of 2 numbers have unlike signs i.ewhen one is positive and the other is a negativenumber, we take the difference between thetwo quantities. i.e. subtract bigger quantityfrom the smaller quantity and then affix thesign of the bigger quantity. eg (i) – 2 +4 = 2,eg (ii) 2-4 = -2
Handbook for Economics Teachers 139
(iii) Subtraction of a negative number fromanother: When a negative number is to besubtracted from another number we changethe sign of the ‘subtrahend’(the number to theright or below). Then the operation to be doneturns out to be addition. The two minus signs“cancel” the effect of each other..
Eg (i) 2- -4 = 2 + 4 = 6Eg (ii) 4 - -2 = 4 + 2 = 6Eg (iii) -2 - -4 = -2 + 4 = 2
(iv) Product of two numbers with like algebraic signswill be positive and when numbers have unlikealgebraic signs then the product will be negative.
Eg (i) -2 x -4 = 8(ii) -2 x 4 = -8(iii) 2 x -4 = -8
(v) Similar is the case in division also.Eg (i) –4 ÷ –2 = 2
(ii) –4 ÷ 2 = – 2(iii) 4 ÷ –2 = – 2
Review test:(i) -6 - 2 = ?(ii) 4 - (– 6) = ?(iii) -3 + (–5) = ?(iv) 5 x –6 = ?(v) -30 ÷ –5 = ?
Fractions:
The operations are found difficult when fractions areinvolved. A fraction is a part of a whole, the numeratordenoting the size of the fraction and the denominatordenoting the size of the whole being referred to.
(i) When the fractions have the samedenominator the operations of addition andsubtraction can be done by simply adding orsubtracting the numerators, the denominatorbeing the same.Eg: ½ + 3/2 = 4/2 = 2½ - 3/2 = -2/2 = -1 2/4 + 3/2 = ½ +3/2 = 4/2 =2
(ii) When the numbers have different denominators,

Basic Mathematical Tools for Introductory Economics140
the operations of addition and subtraction canbe done only after applying multipliers to oneor both of the fractions so that they will havea common denominator. For eg, we cannotperform the operation 3/6 + 2/5 directly. Bymultiplying both the numerator anddenominator of 3/6 by 5, we obtain theequivalent fraction
3 5 156 5 30×
=×
Likewise, multiplying the numerator anddenominator of 2/5 by 6, we obtain theequivalent fraction
2 6 125 6 30×
=×
Now we have the common denominator forboth the fractions and therefore their sum canbe obtained simply by adding the twonumerators and retaing the commondenominator. An analogous procedure can beused to subtract fractions.
1 3Eg:
2 5+
Here multiply numerator denominator of 12
by
5 and 35
by 2. It becomes 5 6
10 10+ . The answer
is 1110
.
(iii) When the product of two fractions have to befound out, we just have to multiply thenumerators, which will be the numerator ofthe product and multiply the denominatorsto get the denominator of the product.Eg: ½ x 3/2 = ¾½ x 3/5 = 3/10

Handbook for Economics Teachers 141
(iv) Division is the inverse of multiplication andtherefore to divide one fraction from the other,we have to inverse the divisor (the secondfraction in sequence) and multiply.Eg: ½ 3/2 = ½ x 2/3 = 2/6 =1/3 ½ ¸ 3/5 = ½ x 5/3 = 5/6
Review test:(i) 4/6 – 3/6 = ?(ii) 7/8 + 9/7 = ?(iii) 6/10 + 2/3 = ?
(iv)8 26 3×
(v)7 35 4÷
Indices:
In economics we come across many relationship whichinvolve numbers and variables raised to a power. Theindices or power show how many times a number ismultiplied by itself. A number expressed as 53 means5x 5x5. Here 5 is the base and 3 is the power. Certainrules are to be known to carry out the operations whennumbers are raised to a power, but do have the samebase.
(i) am x a n = am+n
eg: 32 x 34 = 32+4 = 36
(ii) am ÷ an = am–n
eg: 32 ÷ 34 = 32–4 = 3–2
(iii) (ab)n = an .bn
eg: (3 x 2)2 = 32 x 22
(iv) 1/ an = a–n
eg: 1/ 32 = 3–2
(v) (a/b)n = an/bn
eg: (3/2)2 = 32/22
In case of negative numbers raised to power, thenegative sign will be attached depending on whetherthe power is an odd number or even number. If thepower is an odd number then the number will benegative and if it is even then it will be positive. Eg: - 42

Basic Mathematical Tools for Introductory Economics142
= –42 = –4 × –4 = 16–43 = –4 × –4 × –4 = –64
Review test:(i) 32 × 33 =
(ii)2
2 14
4⎛ ⎞× =⎜ ⎟⎝ ⎠
(iii)2
263
2⎛ ⎞ − =⎜ ⎟⎝ ⎠
(iv)3
75
⎛ ⎞ =⎜ ⎟⎝ ⎠
OperationsThe four basic operations addition, subtraction,
multiplication & division can be carried out on theequations. These operations are obvious to all. The skillis in knowing when to do which operation and why weare doing it. There are rules that should be followedwhile carrying out multiple operations which most ofyou might be familiar with. (Remembered easily throughthe acronym BODMAS.)
(i) Anything within BRACKET is to be done first.(ii) Then comes ORDER, i.e anything that is raised
to a power(iii) Next carry out DIVISION operations(iv) Next is the turn of MULTIPLICATION. Here
remember that multiplication operations neednot always be denoted using ‘ X’ , sometimesit will just be ‘.’ or nothing at all.
(v) Then ADDITION(vi) Then finally SUBTRACTION
Eg (i) 6 (5 - 3)2 x 30/6 + 4 – 2 = 6 (2)2 x 30/6 + 4 – 2 = 6 x 4 x 30/6 + 4 – 2 = 6 x 4 x 5 + 4 – 2 = 120 + 4 –2 = 124 – 2 = 122

Handbook for Economics Teachers 143
Review test:(i) 40/2 [ 8-4] + 3/5 [ 6-2]2 - 9(ii) 3/9 [ ¾ - 2/3]2(iii) 62 x 7/4
Algebra:Basic operations being discussed, now let us move onto the algebraic expressions. Algebra is the centralelement of an economist’s tool kit and they should beable to use it rather than simply learn it. The conceptof algebra is a familiar one, but the challenge is to showhow it can be used and to built in the competency andconfidence to use algebra independently to solveeconomic and business problems.Constants and Variables: Mathematical problemsinvolve two kinds of quantities, constants and variables.Constants is a magnitude that does not change. Itretains the same value all through the mathematicaloperations. When a constant is joined to a variable it istermed as co-efficient of that variable. For eg: Giventhe equation Qd = 2P – 3 , here Qd is dependent on Yand the constants here are 2 and 3. 2 may be referredas coefficient of the variable P. A quantity which canassume different values is called a variable. Ineconomics we deal with many variables like price,income, profit, production, cost, revenue etc which canassume many values.Exogenous and Endogenous variables: Given anyequation we should be able to identify the Exogenousand Endogenous variables. Exogenous variables areindependent variables that are not influenced by theother factors in the equation. The Endogenous variablesare dependent and are determined from within. In theabove example, P is the exogenous variable while Qdwhich is dependent on P is the endogenous variable.
Functions:
We are, in fact, not interested in variables for their ownsake. In economics we come across relationship betweendifferent variables which can take different values thatcan be expressed by means of functions. Here we relateone attribute or variable to the other. The manner in

Basic Mathematical Tools for Introductory Economics144
which one variable changes in relation to changes inother related variables is described by means of afunction.
Eg: When we write Qd= f(P), where Qd is the Quantitydemanded and P is the Price, this equation representsthe demand function, which shows the relationshipbetween two economic variables, quantity demandedand Price. Here ‘f’is a convenient way of expressing thephrase “a function of ” The quantity demanded isfunction of Price i.e. Qd here is dependent on theindependent variable P.
Notations:
We come across many notations while expressing therelationship between variables in the form of equationslike, , , 11≡< > ≤≥(i) Summation:
The symbol Σ is used to denote the sum of the terms.
Given the value of x variable to be 3,2,4,6 then xΣ willbe 3+2+4+6=15. Now suppose we have to represent thesummation of n number of terms ie x
1 + x
2 +x
3 +........+
xn we expresses it as
1
n
ii
x , which simply means that
it is the sum of all terms as i ranges from 1 to n. This isto read as sum of x as i ranges from 1 to n. While dealingwith National Income Accounting we have expressed
the sum of various variables in the manner 1
n
ii
x=∑ to
represent the total number of firms and households inthe economy.(ii) Equations and Identities:
An equation is the statement of equality betweenone or more variables and numbers. It is expressed using‘=’ sign. The parts of an equation to the right and left ofthe sign of the equality are the sides of the equationdistinguished as the right hand side and left hand side.
When the equation holds good for all values of thevariable it is called an identity expressed using ‘≡ ’ sign.Eg GDP ≡ C+ I + G or P ≡ R – C etc.

Handbook for Economics Teachers 145
While working with the equations certain rules haveto be kept in mind like, balance of equation is to bemaintained, i.e. whatever is done to the right hand side(RHS) has to be done with the left hand side (LHS) also.Any number can be added, subtracted or divided ormultiplied to one side, provided the same is done to theother side.(iii) Inequalities
There are two inequality signs ‘<’denoting that theLHS is less than the RHS and ‘>’ denoting that the LHSis greater than the RHS. There are weak inequalitiesalso which appear with < or > sign meaning less thanor equal to and greater than or equal to respectively.(iv) Absolute Value: I I
The notation ‘I I ’ is used to denote the absolutevalue. In absolute value we discard the signs attachedto it. For eg if suppose x = -6 then absolute x will bewritten as I x I = 6
Linear Equations, Quadratic or Second DegreeEquations & Simultaneous Equations
Equations in which maximum power of theunknowns is only one are called linear equations. Theseequations when plotted on a graph give straight line.Generally it is stated as y= mx + c. Here m and c areconstants while y and x are variables.
Eg :-(i) 2x+ 3 = 4x –2(ii) 5x +1 =2
(iii)2 64
x + =
If the power of the unknowns is 2, it becomes aquadratic equation or second-degree equation. Eg
(i) x2 + 2x + 4 = 0.(ii) 2x2 = 100(iii) x2 – 9 = 4x
Simultaneous equations are set of equations thatare satisfied by the same value of the variables. As wedeal in Economics more often with relationship betweendifferent variables, we will have to learn the rules of

Basic Mathematical Tools for Introductory Economics146
solving equations. Suppose we have two equations, onefor demand and other for supply. Both are satisfied bythe same value of the variable P.
Qd = 100- 10 P Qs = 80 + 10 PWe know that at equilibrium Qd = Qs. So to find the
Price at the point of equilibrium we have to solve thesimultaneous equations.
As Qd= Qs, we can write the two equations as,
80 + 10 P = 100- 10 P10 P + 10 P = 100-80
20 P = 20P = 20/20 = 1
We have just now found out that the equilibriumprice is 1, now to get the equilibrium Quantity demandedand supplied we have to substitute the value of P inany of the two equations.
Qd = 100-10 P Qs = 80 + 10 P= 10 – 10 x 1 (or) = 80+ 10 x 1= 90 = 90
Solution of Linear Equations:
By solving an equation we mean the determination ofthe particular value of the unknown which satisfies thegiven equation. The process of finding its value is calledsolving the equation and value so found is called theroot or the solution of the equation. To solve linearequations in one unknown we have to first move allterms involving the unknown to the left hand side ofthe equation. Here we have to remember that a termmay be transposed from one side of an equation to theother if its algebraic sign is reversed. That means if it isaddition it becomes subtraction and if it is multiplicationit becomes division or vice versa when it moves fromone side of the equation to the other.
Eg: (i) 4x – 10 = 2x + 24x – 2x = 2 +10 2x = 12
Then divide both sides by the coefficient of theunknown quantity, and the value required is obtained.
Handbook for Economics Teachers 147
x = 12/2 = 6Here the coefficient of x which is in the numerator
when it moves to the RHS will go as denominator.
Eg (ii) 3
24 2x+ =
In this case first all the fractions have to be cleared.If we multiply both sides of the equation by 4, then theequation becomes
34 2 4
4 2x⎛ ⎞ ⎛ ⎞+ = ×⎜ ⎟ ⎜ ⎟
⎝ ⎠ ⎝ ⎠
4 128
4 2x
= + =
After clearing the fractions, now transpose the termcontaining the unknown quantity to one side of theequation, and the known quantities to the other.
x = 6 - 8x = -2.
This answer can also be verified. In the case of simpleequations we have only to show that when we substitutethe value of x in both sides of the equation we obtainthe same result. In our example lets check whether x =
-2 is a correct solutio or not 24 2x 3+ = substuting 2x = −
we get
2 32
4 2−
= + =
2 8 64 4
− += =
6 64 4
= =
Review test:
(i) Given 5x +12 = 10 , x = ?

Basic Mathematical Tools for Introductory Economics148
(ii) Given 53P
+ 10 = 27P
– 3 P = ?
Solution of Quadratic Equations:
The general form of quadratic equation is ax2+bx+c=0,where a, b. c are constants. Here the unknown ‘x’ is ofsecond degree. The solutions can be derived by applying
the formulae, 2 4
2
acb b
a
− ± − where, ‘a’is the coefficient
of x2 , ‘b’ is the coefficient of x and ‘ç’ is the constantquantity in the equation. This formulae has to bememorized.Eg : x2 + 6x + 5 = 0Here a =1, b = -6 and c = 5. Substituting these values inthe formulae,
=26 6 4 1 52
− ± − × ×
= 6 36 20 6 16 6 4
2 2 2− ± − − ± − +
= =
There will be two solutions in case of the Quardratic
equations. The solutions are 6 42
− +and
6 42
− − ie –1
and –5Review test:Solve:
(i) 3x + 2 = x + 6(ii)13 x – 4 (5x –8) + 17 = 0(iii) 4x2 – 37x – 7 = 0(iv) x-2 + x+2 = 0 x-1 x+1
Solution of Simultaneous Equations:
The solution to simultaneous equations can be foundout only if we have the same number of distinct andindependent equations as there are unknowns to befound. In case when there are 2 unknowns, we have to

Handbook for Economics Teachers 149
have 2 equations. We shall confine to simpler cases inwhich the unknown quantities are only two and bothin the first degree.Eg: Solve 3x + 7y = 27..... (1)
5x + 2y = 16..... (2)For solving firstly we have to eliminate one of theunknowns. So for that lets multiply both the equationsby a number, so that the terms in x will be the same inboth the equations. Multiply first equation by 5 andsecond equation by 3. The equations now become15x + 35 y = 13515x + 6y = 48Now subtract 4th equation from the 3rd to eliminate theterms in x. We get,15x + 35 y = 13515x + 6y = 48 29 y = 87 y = 87/29 = 3Substitute this value of y in either of the equations toget the value of x. Suppose we put it in equation 1 weget the value of x as3x + 21 = 27 3x = 27-21 3x = 6 x = 6/3 = 2Therefore, the required solution of the equation is x=2and y= 3Tip: If the coefficients of one unknown have the sameabsolute value, eliminate that unknown by addition orsubtraction. If necessary multiply one or both equationsby such numbers that will make the coefficients of oneunknown have the same absolute value. Add when thecoefficients of one unknown are equal and unlike insign , subtract when the coefficients are equal and likein sign.Review test:Solve: (i) x + y = 19
x – y = 7(ii) x – y = 6 x + y = 0(iii) x + 5y = 18 3x + 2y = 41

Basic Mathematical Tools for Introductory Economics150
Graphing functions:A graph consists of an x –axis (horizontal axis) and y-axis (vertical axis) and a particular point on the graphis identified by its co-ordinates (x,y)Plotting points on a graph;We have two axis, x and y which intersect at the orgin,‘O’. The 1st quadrant will have both x and y coordinatespositive while y coordinate will be negative. The 3rdquardent has points where both the x and y coordinatesare negative and the 4th quardent will have x coordinatenegative and y coordinate positive.As more details on basics of coordinate geometry like,drawing of graphs and its importance are provided in aseparate chapter we would be skipping that section andwill move on to the basics of analytical geometry.
Analytical Geometry:
One of the most important thing to be remembered whiledrawing graphs and diagrams is that we have to makesure that we have labelled both the axis and also havetitled the graphs. Too often we see unlabelled graphswithout titles which make no sense at all!The Straight lines & CurvesIt can be seen that after plotting the points on a graphwhen we join these points it might be a straight line ora curve. The plotted points may join together to form acurve or straight line depending on the degree of theequation. If the equation is a first-degree equation (wherethe power of the unknown variable is equal to 1) thenthe plotted points will join together to form a straightline. Eg (i) 2x + 3 = Y, (ii) Q = 18 – 3P etc. The straightline may either be upward sloping or downward sloping.Eg (i) will give an upward sloping line while eg (ii) willplot a downward sloping line.If the equations are second degree equations(quadraticequation) then the plotted points join together to formcurves. The curves may be convex to the orgin orconcave.
The slope or gradient of a straight line:A very often used term in economics is slope and it is
Handbook for Economics Teachers 151
very essential to understand this concept as many ofthe theories in economics are related to it. To make achild relate this concept with real life, talk to her aboutthe steepness of a hill. When you say the steepness of ahill is one in four, it means that when we move up thehill we rise one meter for every four meters. The slopeof the hill here is ¼. Now if we say the steepness of thehill is one to one then it means that when we move upby two meter we rise one meter i.e. it is a highly steephill. The slope here is 1/2.Now lets try to relate it to the concept of slope. Slope is thevalue got by dividing the vertical distance by horizontaldistance. The slope of the line connecting the two points ona graph (x
1y
1) and (x
2 y
2) is given by y2 – y1/ x 2 – x1 where,
y2 – y1 is the vertical difference between the two points andx2 – x1 is the horizontal difference. It is provided by measuringthe amount of rise (or fall) per unit horizontal distance.The slope of a straight line depends only on its inclinationand will be same at any point. The lines drawn parallel to thestraight line AB will also have the same slope.The slope is positive for an upward sloping line and negativefor a downward sloping line.Let us observe the relation between the magnitude ofthe slope and steepness of a line. The slope of the lineincreases with the increasing steepness. (As shown inour earlier example of hill) when the slope is negative,it increases in absolute terms as the line becomessteeper. Now if the line is a horizontal straight line parallel tox axis then y2 – y1 will be zero, i.e the numerator will be zero.The slope will now be 0/x2 – x1 = 0. In case the line is avertical straight line parallel to y axis then x2 – x1 will be 0and therefore slope will be y2 – y1/ 0 = α.
Intercepts:The straight lines when extended will intersect thecoordinates at two points, one on the x-axis and otheron y axis. The distant from the orgin to the point wherethe line intersects the x-axis (horizontal axis) is calledthe horizontal intercept (x intercept) and the distancefrom the point where it intersects the y-axis (verticalaxis ) is called the vertical intercept (y intercept).

Basic Mathematical Tools for Introductory Economics152
The slopes and intercepts in the equation of a line:The equation of a straight line is generally denoted as y= a + bx. Given such a straight line equation theparameter that comes along with the variable x is theslope of the line. Here it is ‘b’. The vertical intercepthere is á’. Let us look at a demand function given asQd= 40-4P. this equation shows the relationship betweendemand and price. If we draw a straight line using thisequation, it will cut the y axis at 40, which means thatthe vertical intercept is 40. The rate of change of demandwhen price changes depends on the coefficient of P. Inthe above equation the slope is 4, meaning that for everyone unit change in price demand will rise/fall by 4 units.The negative sign here shows the relationship betweendemand and price, i.e it has an inverse relationship.
Even though these are not very ‘hard tools’, teachers willhave to ensure that all students are able to make theintellectual jump by setting aside more time to brief throughthese basics before proceeding further. All these basicmathematical tools will provide a solid foundation for learningintroductory economics and will also be of value to the manywho would like to pursue the learning of the subject. It has tobe kept in mind that learning mathematics is bestaccomplished by doing it and so working through theproblems and review test are essential. The pressure on theteachers to cover the curriculum content might reduce thescope of briefing through mathematical tools but still , theyhave to design certain practical strategies to help studentsachieve at economics by improving their grasp andappreciation of mathematics.

Handbook for Economics Teachers 153
REFERENCESBansal, Anjali (2000) Mathematical Methods for
Economics, Nath Enterprises, DelhiHall, H S Algebra for BeginnersHart, W Walter (1940) Progressive High School
Algebra, The Copp Clark Publishing co Ltd.Vernon E Howes & Roy Dubisch, Self Teaching
Intermediate Algebra , John Wiley & Sons, Inc.New York

ChapterChapterChapterChapterChapter 11
Use of Algebraic Equationsand Graphs in Economics
Use of mathematics in economics started with themathematical presentation of the conditions fora successful coordination of market exchange
by Leon Walras. The ‘Marginal Revolution’ was themathematical exposition of marginal conditions formarket equilibrium. Alfred Marshall, though welltrained in mathematics, used in footnotes in his‘Principles of Economics’. But almost all the neo-classical economists used sophisticated mathematicaltechniques in the construction of economic theories.They presumed that all the microeconomic theories canbe explained using mathematics.
John Maynard Keynes started the new researchagenda - the aggregate economics, but he too usedmathematics to a limited extent. The continuous debatebetween neoclassiscals and Keynesians includeextensive use of mathematics in macroeconomics aswell.
Consequent to these developments, major textbooksat graduate level in West European and North Americanuniversities presented economic theories by usingmathematical notations and equations. As economictheories basically establish cause - effect relationshipbetween economic variables, use of mathematics ineconomics is widely prevalent. The availability of largesets of time series and cross-section data on majoreconomic variables facilitated growth of econometrics
as a discipline, and this reinforced the use ofmathematics in economics textbooks.
For the last several decades, basic economicstextbooks in India, have been extensively using graphs.But in the last one decade, all premier higher educationalinstitutions teach mathematical economics as a corepaper in undergraduate economics courses. Hence, theNCERT textbooks on microeconomics andmacroeconomics use mathematics and graphicalillustrations in the explanation of economic theories.This chapter gives a preliminary exposition tofundamental mathematics and graphical techniquesthat are used in the NCERT textbooks.
ECONOMIC MODELAn Economic model shows relationship between two ormore economic variables. The nature of relationshipincludes the cause-effect relationship and the type ofrelationship expressed in mathematical forms such aslinear or non-linear algebraic equations. Some of thebasic concepts are explained using the simple demandmodel given in the microeconomics textbook.
A demand function is given asQ=d(p) (1)Here, Q is the variable representing quantity
demanded and p is the variable representing price perunit.
A variable is a quantifiable entity, whose value willchange either over time and or across space. Forexample, price changes with quantity demanded andvice versa. Temperature changes with time and isdifferent in different places.
In the equation (1), the value of q is functionallydependent on the value of p. Here, p is an independentvariable, and q is a dependent variable. An algebraicequation can have only one dependent variable and morethan one dependent variable. For example, if demandis dependent on price of the commodity and income ofthe consumer, then ‘demand’ is dependent variable, and‘price’ and ‘income’ are independent variables. Thedemand function is written as
Handbook for Economics Teachers 155
Use of Algebraic Equations and Graphs in Teaching Economics156
Q = d (p, y) (2)Equation (1) implies that change in price is the cause
and change in demand is the effect. Here the changein demand is dependent on the change in price, andchange in price is assumed to be independent. Thereforeprice is the independent variable, and demand is thedependent variable.
The equation (1) does not give other specificationsin the relationship between q and p. The law of demandsays that there is an inverse relation between q and p.If we assume that for every one unit change in p, thelevel of change in q is also a constant, then we canwrite the specific relation between p and q as a linearalgebraic equation.
Q= a – b p (3)Here, if p changes by one unit, then q decreases by
b percent, the negative sign attached to be implies theinverse relation between p and q. If p=o, q=a, whichimplies that the consumer consumes ‘a’ amount if thecommodity is given free.
If you plot equation (3) in a graph sheet, you will geta downward sloping straight line. The slope of such aline is b, and the y intercept is a. this is shown infigure 11.1.
If the demand curve is non-linear, then the algebraicequation well take different forms such as
Q = a-p
Similar to the demand curve, we can get algebraicequations for other economic functions. For instancea short run production function representing the lawof variable proportions can be given as follows:
Here if y is the output and x is the variable factorinput. If you plot this equation in a graph you will gettotal product of variable factor whose (Tpx). If we divideequation (4) by x, you get average product of x CAPx)and plot this in a graph sheet to APx curve. The firstorder derivative of equation (4) is
d/dx(y)=This is the marginal product of x (MPx) and the
corresponding curve is MPx curve. The plotting of agraph is discussed in detail in the next section.

Handbook for Economics Teachers 157
In economics, algebraic equations are used toillustrate the relationship between two or more thantwo variables. In the previous chapter, it was shownhow an the previous equation is useful than the verbaldescription of the economic relationships. In thischapter, we will look at data relating to some economicindicators given in algebraic equations. We will also learnhow they are converted into graphs which help inlearning economics concepts better.
The graphs we use may be referred to as analytical,as opposed to empirical or data graphs. Analyticalgraphs illustrate the relationship between two or morevariables based on the concepts, variables andassumptions of economic theories. In a very directsense, these graphs are illustrations of economic theoryand their assumptions about the relationship amongvariables. What is most important about these graphsto economics is what they mean economically and notmathematically. What is most important in readinggraphs is to understand the relationship between whatyou see on the graph and the underlying economictheory, its concepts and assumptions.
Graph and Graph Sheet –An Introduction
Graph is the most widely used tool to representrelationship between two economic variables. A graphis a diagram that shows how two variables are related.Though computers are used to draw graphs in recenttimes, traditionally graph sheets were used. A graphsheet that we normally use is a centimeter graph sheet,where the divisions are in millimeters and centimeters.Each centimeter denotes a unit of a variable. Eachmillimeter denotes a fraction of the unit of the variable.See the graph sheet given in the previous page.
A graph sheet has two axes- X-axis and Y-axis. Eachaxis represents the number line from –ve £ (negativeinfinity) to +ve £ (positive infinity). The intersection ofthe two axes is the origin “0”. The two axes divide the

Use of Algebraic Equations and Graphs in Teaching Economics158
graph sheet into four quadrants. In the top right,Quadrant I, both X and Y values are positive, hence, itis called positive quadrant. In the top left quadrant,Quadrant II, X values are negative and Y values are
-8 -7 -6 -5 -4 -3 -2 -1 1 2 3 4 5 6 7 -8 90
13
12
11
10
9
8
7
6
5
4
3
2
1
-1
-2
-3
-4
-5
-6
-7
-8
-9
-10
-9
(2,3)Ax
x1
y1
y
x
Fig 9.1Fig 11.1

Handbook for Economics Teachers 159
positive. In the bottom left quadrant, Quadrant III, Xand Y values are negative; hence, it is called negativequadrant. In the bottom right quadrant, Quadrant IV,X values are positive and Y values are negative.
Most of the graphs that represent economic dataand relationships are in the positive quadrant, as mostof the economic variables do not take negative values.For example, price, income, savings, investment,quantity demanded and supplied take only positivevalues. Very rarely, we get economic variables withnegative values like disutility, depreciation anddisinvestments.
A graph sheet is used to represent two-dimensionalfigures-points and lines. Every point in a graph sheetis denoted by a coordinate and every line in a graphsheet is denoted by an algebraic equation.
Point A in the Fig 11.1 is denoted by the coordinate(2,3). Here the first number represents the X value andsecond number represents the Y value. The coordinatesshould always be written in the same order i.e., thefirst number representing the X value and secondnumber representing the Y value.
The straight line DD in the Fig 11.2 is denotedby the equation Y= 80-10X. Let us see how thisalgebraic equation is converted into a straight line ina graph sheet. Given various values for X andcalculate corresponding values for Y using theequation Y=80-10X.
X value Calculation Y value
6 Y=80 –10 * 6 = 80 – 60 = 20 20
5 Y=80 –10 * 5 = 80 – 50 = 30 30
4 Y=80 –10 * 4 = 80 – 40 = 40 40
3 Y=80 –10 * 3 = 80 – 30 = 50 50
2 Y=80 –10 * 2 = 80 – 20 = 60 60
1 Y=80 –10 * 1 ==> 80 – 10 ==> 70 70
Each pair of values of X and Y represents acoordinate in the graph and connecting the points so

Use of Algebraic Equations and Graphs in Teaching Economics160
x -8 -7 -6 -5 -4 -3 -2 -1 1 2 3 4 5 6 7 -8 90 x
130
120
110
100
90
80
70
60
50
40
30
20
10
-10
-20
-30
-40
-50
-60
-70
-80
-90
-100
y1
y1
F(1, 70)
E(2, 60)
D(3, 50)
C(4, 40)
B(5, 30)
A(6, 20)
y=80–10x
-9
Fig 11.2

Handbook for Economics Teachers 161
plotted generates a straight line representing equationY = 80 - 10X. The coordinates are given below:
Coordinates A B C D E F
X values 6 5 4 3 2 1
Y values 20 30 40 50 60 70
In the equation Y= 80 – 10X, 80 is called the Y-intercept, that is, the value of Y if the value of X is zero.
In the equation Y = 80 - 10X, –10 is called thecoefficient of X. The negative sign represents the inverserelationship between the X and Y. The number 10represents the intensity of the relation, that is, for everyone unit change (increase) in X, the value of Y changes(decrease) by 10 units.
For easy understanding, most graphs in economicstextbooks are given as straight lines and simple curves.Such lines are only approximations and the actualbehaviour of an economic variable is usually complexrequiring very complex graphical representation.
Individual Demand Curve
Let the individual demand function for commodity Xbe
QDx = 8 - PxBy substituting various prices of X in this demand
function, we get the following individual demandschedule:
Px (Rs) 8 7 6 5 4 3 2 1 0
QDx 0 1 2 3 4 5 6 7 8
Each pair of price (Px) and Quantity demanded(QDx) values such as (8,0) or (7,1) is a coordinate.Thus, there are nine coordinates. Plotting thecoordinates in the Fig 11.3, we get the individualdemand curve D'D'.
The demand curve shows that at a particular pointof time, if the price of X is Rs. 7, the individual is willingto purchase one unit of X over the period of time
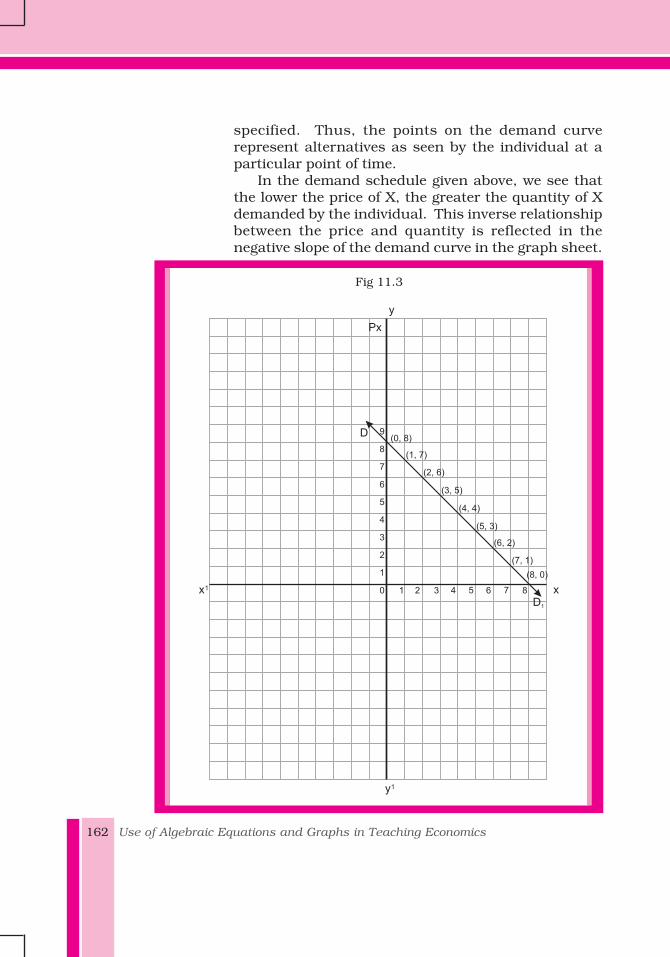
Use of Algebraic Equations and Graphs in Teaching Economics162
specified. Thus, the points on the demand curverepresent alternatives as seen by the individual at aparticular point of time.
In the demand schedule given above, we see thatthe lower the price of X, the greater the quantity of Xdemanded by the individual. This inverse relationshipbetween the price and quantity is reflected in thenegative slope of the demand curve in the graph sheet.
Fig 11.3
x1
y1
y
x1 2 3 4 5 6 7 8
9
8
7
6
5
4
3
2
1
0
(0, 8)
(1, 7)
(2, 6)
(3, 5)
(4, 4)
(5, 3)
(7, 1)
(8, 0)
(6, 2)
Px
D
D1

Handbook for Economics Teachers 163
A nonlinear demand function can be representedby the quadratic function say Qdx = 8/Px. Thecorresponding demand schedule is given below and thegraphical representation in Fig 11.4 shows a perfectrectangular hyperbolic demand curve.
Price Px (Rs) 1 2 4 8
Qdx 8 4 2 1
Graph Sheet - IV
x1
1 20 3 4 5 6 7 8
1
2
3
4
5
6
7
8 (1, 8)
(2, 4)
(4, 2)
(8, 1)
QDx
Px
Fig 11.4

Use of Algebraic Equations and Graphs in Teaching Economics164
Market Demand Curve
Market demand curve is the horizontal summation ofall the individual's demand curves for the commodity.The market demand curve shows the alternativeamounts of the commodity demanded for specific timeperiod at various alternative prices, by all the individualsin the market.
Two individuals have the same demand function say,Qdx = 8 - PxThe two demand schedules and the summation are
given below and the corresponding demand curves aregiven in the Fig 11.5.
Price Px (Rs) Qdx1 Qdx2 Qdm
8 0 0 0
4 4 4 8
0 8 8 16
Individual Producer's Supply Curve
Let a producer's supply function for commodity X beQsx = -40+20PxBy substituting various prices of X in this supply
function, we get the following supply schedule of theproducer.
Px (Rs) 6 5 4 3 2
Qsx 80 60 40 20 0
Each pair of Price and Quantity Supplied value is acoordinate. Thus there are five coordinates; plottingthese coordinates in the Fig 11.6 we get the supply curveof the producer.
The supply curve shows that at a particular point intime, if the price is Rs. 6, the producer is willing to supply80 units of x over the period of time specified. Thus, thepoints on the supply curve represent alternatives as seenby the producer at a particular point of time.

Handbook for Economics Teachers 165
Fig 11.5
x1
1 20 3 4 5 6 7 8
2
4
6
8
10
12
(8, 4)
(8, 0) (16, 0)
QDx
Px
1
3
5
7
9
11
9 10 11 12 13 14 15 16 17
(4, 4)
QDX1
QDX2
QDM
(0, 8)

Use of Algebraic Equations and Graphs in Teaching Economics166
Graph Sheet - VI
x1
10 200 30 40 50 60 70 80
2
4
6
8
10
(80, 6)
QSx
1
3
5
7
9
90 100
(60, 5)
(40, 4)
(20, 3)
QS = – 40 + 20Px x
YPx
S
(0, 2)S
In the supply schedule given above, we see that thehigher the price of X, the greater the quantity of X issupplied by the producer. This direct relationshipbetween the price and quantity supplied is reflected inthe positive slope of the supply curve in Fig 11.6.
Fig 11.6

Handbook for Economics Teachers 167
Market Supply Curve
Market supply curve is the horizontal summation of allthe producers' supply curves for the commodity. Themarket supply curve shows the alternative amounts ofthe commodity supplied per time period at variousalternative prices by all the producers in the market.
The supply schedules of three producers and thesummation are given below and the correspondingsupply curves are given in the Fig 11.7.
Price (Rs) Quantity supplied per unit of time
Px Producer Producer Producer Marketsupply
6 22 42 53 117
5 20 40 50 110
4 16 36 46 98
3 10 30 42 82
2 0 20 35 55
1 0 0 25 25
The supply schedule given below will give a non-linear supply curve for producer II if plotted in a graphsheet (See Fig 11.8).
Px (Rs) 6 5 4 3 2 1
Qsx 42 40 36 30 20 0
Market Equilibrium
Market equilibrium is a condition from which neitherthe consumer nor the producer would tend to change,unless some external forces move them from theequilibrium position. Market equilibrium occurs whenthe quantity of a commodity demanded in the marketper unit of time equals the quantity of the commoditysupplied to the market over the same time period.Geometrically, equilibrium occurs at the intersection

Use of Algebraic Equations and Graphs in Teaching Economics168
Fig 11.7
x1
5 6432
QSx
1
(6,22)
120
115
110
105
100
95
90
85
80
75
70
65
60
55
50
45
40
35
30
25
20
15
10
5
7 8 9
(5,20)(4,16)
(3,10)
(2,0)
(6,42)(5,40)
(4,36)
(3,30)
(2,20)
(0,1)
(6,53)(5,50)
(3,42)
(2,35)
(1,25)
(4,46)
(2,55)
(6,117)
(5,110)
(3,82)
(4,98)
QSx
Px

Handbook for Economics Teachers 169
Graph Sheet - VIII
x1
30
10
9
8
7
6
5
4
3
2
1
20100
(0,1)
QSx
Px
3525155 40 45 50 55
(20,2)
(30,3)
(36,4)
(40,5)
(42,6)
s
s
Fig 11.8

Use of Algebraic Equations and Graphs in Teaching Economics170
of the commodity's market demand curve and marketsupply curve. At the equilibrium point, the price andquantity are called as equilibrium price and equilibriumquantity respectively.
Two sets of demand and supply schedules are givenbelow and the corresponding graphical representationsare given in Figures 11.9 & 11.10.
Price of (Px) Quantity Quantitycommodity X (Rs) demanded (Qdx) supplied (Qsx)
6 2000 8000
5 3000 6000
4 4000 4000
3 5000 2000
2 6000 0
Price of (Px) Quantity Quantitycommodity Y (Rs) demanded (Qdx) supplied (Qsx)
6 0 120000
5 20000 100000
4 40000 80000
3 60000 60000
2 80000 40000
1 100000 20000
Market Equilibrium and Shift inDemand and Supply Curves
The demand curve shows the relationship between priceand quantity demanded of a commodity, when all otherthings like consumer's income, prices of relatedcommodities, tastes and preferences remain constant.If any one or all of these factors change, say, if there isan increase in consumer's income, then the demandcurve shifts to the right implying at the same price morequantity of the commodity is demanded by theconsumer.

Handbook for Economics Teachers 171
Fig 11.9
x1
5 7 9
QSx
Px4 6 8 103210
8000
7500
7000
6500
6000
5500
5000
4500
4000
3500
3000
2500
2000
1500
1000
500
(6,2000)
(5,3000)
(4,4000)
(3,5000)
(2,6000) (5,6000)
(6,8000)
QDx
Qx
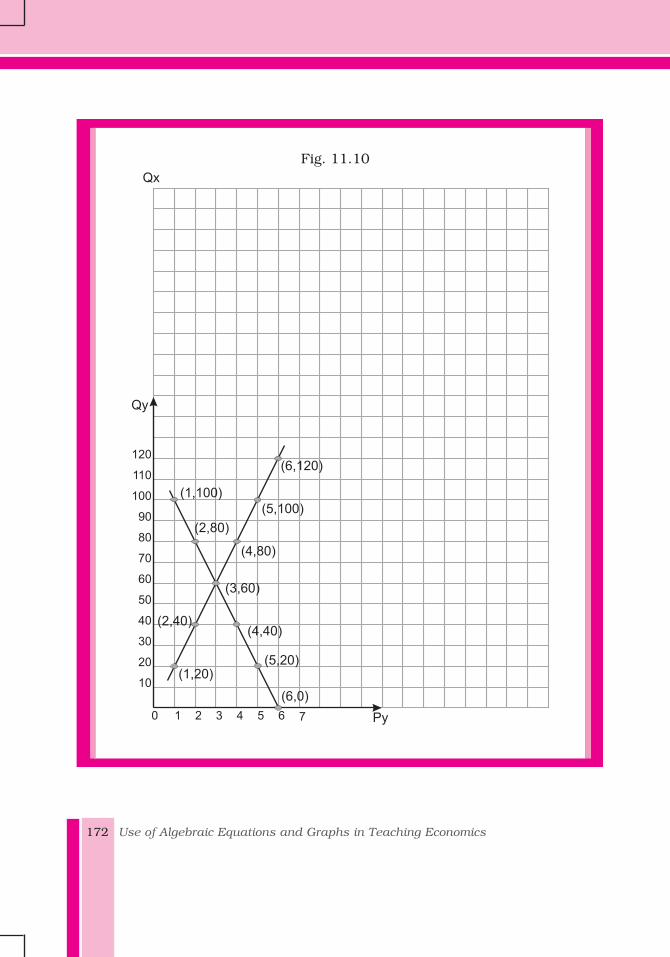
Use of Algebraic Equations and Graphs in Teaching Economics172
x1
3 4 5 Py210
120
110
100
90
80
70
60
50
40
30
20
10
Qx
6 7
(6,120)
(5,100)
(4,80)
(3,60)
(4,40)
(5,20)
(6,0)
(1,20)
(2,40)
(2,80)
(1,100)
Qy
Fig. 11.10

Handbook for Economics Teachers 173
Similarly, the supply curve shows the relationshipbetween price and quantity supplied of a commoditywhen all other things like technology and costs of inputsremain constant. If any one or all of these factorschange, then, the supply curve shifts. For instance, ifthere is improvement in technology so that the cost ofproduction comes down, then the supply curve shiftsto the right implying that the same price more quantityof the commodity is supplied by the producers.
The shifts in the demand curve and supply curveand the consequent changes in the market equilibriumare shown in the schedules given below andcorresponding graphical representations in the Fig11.11.
Price Px (Rs) Qdx 1 Qdx 2 Qdx 1 Qdx 2
1 100000 20000 60000 120000
2 80000 40000 80000 100000
3 60000 60000 100000 80000
4 40000 80000 120000 60000
5 20000 100000 140000 40000
6 0 120000 160000 20000
Price Elasticity of Demand
The value of price elasticity of demand of a commodityshows responsiveness of quantity demanded for a givenchange in price at a particular price-quantitycombination.
The coefficient of price elasticity of demand of acommodity (Ep) is the ratio of percentage change inquantity demanded per unit of time to a givenpercentage in price of the commodity.
Since there is an inverse relationship between priceand quantity demanded of a commodity, the Ep isnegative and it is treated as a positive value byintroducing a negative value in the formula.
− Δ − Δ=
Δ Δ[ Q/Q] * p [ Q] * p
Ep=[ P/P] * Q [ P] * Q

Use of Algebraic Equations and Graphs in Teaching Economics174
Fig 11.11
x1
3 4 5 Px210
120
110
100
90
80
70
60
50
40
30
20
10
Qx
6 7
QSx1QSx2
Qdx2
Qdx1
Fig 11.11
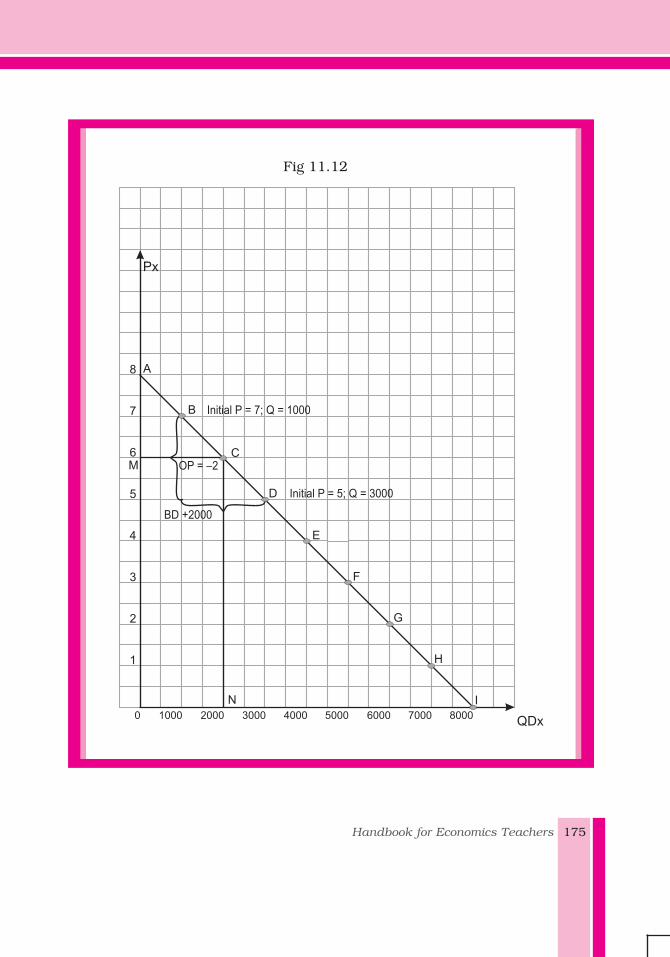
Handbook for Economics Teachers 175
Fig 11.12
x1
8
7
6
5
4
3
2
1
0QDx
Px
20001000 3000 4000 5000 6000 7000 8000
OP = –2
A
B
C
D
E
F
G
H
I
BD +2000
Initial P = 5; Q = 3000
Initial P = 7; Q = 1000
N
M
Fig 11.12

Use of Algebraic Equations and Graphs in Teaching Economics176
8
7
6
5
4
3
2
1
0
0
1000
2000
3000
4000
5000
6000
7000
8000
If Ep >, the commodity is price elastic; if Ep <, itis inelastic and if Ep = 1 it is unitary elastic.
Calculation of price elasticity of demandExample:A market demand schedule is given below and the
demand curve is given in Fig 11.12. The calculation ofprice elasticity of demand is also given here.
Point Price Px (Rs) Quantity demanded-Qdx
A
B
C
D
E
F
G
H
I
The price elasticity from B to D
− −= =
− −[2000] * 7 14000
EP = 7[ 2] *1000 2000
The price elasticity from D to B
− −= =
− −[2000] * 5 10000
EP = 1.67[ 2] * 3000 6000
Thus, we get a different value for elasticity if wemove from B to D than if we move from D to B. Thisdifference results because we used a different base incomputing the percentage changes in each case.
We can avoid getting different results by using theaverage of the two prices and the average of twoquantities instead of either of the two price or quantityvalues. Thus the new formula for the calculation of theprice elasticity will be
−Δ +Δ +
Q * [P1 P2]Ep =
P * [Q1 Q2]

Handbook for Economics Teachers 177
Applying this modified formula to find price elasticityfor the movement from B to D or for a movement fromD to B, we get
− −= =
− −[2000] *12 24000
Ep = 3[ 2] * 4000 8000
This is equivalent of finding price elasticity at thepoint midway between B and D, that is, at C.
Law of variable Proportions
This law analyses the short run production function ofa commodity. The production function shows therelationship between inputs and outputs. The simpleway to generate a schedule for the short run productionfunction is to start with the marginal product of thevariable, say labour. Given an ascending order ofnumbers like 1,2,3 and 4 and then a descending orderof numbers like 4,3,2,1,0 and -1 for the MarginalProduct of Labour (MPL). Assume capital is a fixed factorwith ten units. From the MPL create cumulative columnwhich is the TPL and APL is calculated in the usualway. The schedule is plotted in Fig 11.13.
Capital (K) Labour (L) TPL APL MPL
10 0 0 0 0
10 1 1 1 1
10 2 3 1.5 2
10 3 6 2 3
10 4 10 2.5 4
10 5 13 2.6 3
10 6 15 2.5 2
10 7 16 2.28 1
10 8 15 2 0
10 9 15 1.6 -1

Use of Algebraic Equations and Graphs in Teaching Economics178
Fig 11.13
Point ofInflexion
TPL
APL
Labor
MPL
1 2 3 4 5 6 7 8 90
–1
20
19
18
17
16
15
14
13
12
11
10
9
8
7
6
5
4
3
2
1
Fig 11.13

Handbook for Economics Teachers 179
Short run cost functions
The short run cost functions show the relationshipbetween output and cost. The average and marginalcost functions show the relationship between averagecost and marginal cost of one hand and the output onthe other. The average cost curve is the inverse ofaverage product curve and marginal cost curve is theinverse of marginal product curve. (see Fig 11.14)
From the short run production schedule thecorresponding cost schedules can be generated and ithelps the students to understand the relationshipbetween cost and productivity of a factor. Assume costof one unit of capital is Rs. 100 and cost of one unit oflabour is Rs. 10.
Capital Labour TPL APL MPL Total Average Marginal(K) (L) Cost VarCost Cost
10 0 0 0 0 100 0 –
10 1 1 1 1 110 10 10
10 2 3 1.5 2 120 6.7 50
10 3 6 2 3 130 5 3.3
10 4 10 2.5 4 140 4 2.5
10 5 13 2.6 3 150 3.8 3.3
10 6 15 2.5 2 160 4 5
10 7 16 2.28 1 170 4.4 10
10 8 16 2 0 180 5 –
10 9 15 1.6 -1 190 6 –
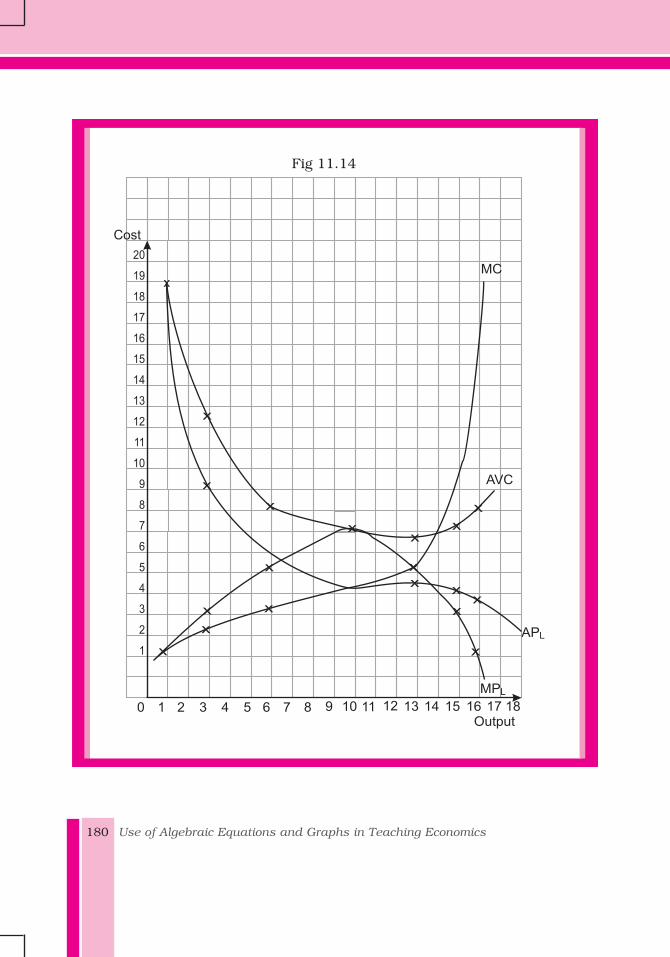
Use of Algebraic Equations and Graphs in Teaching Economics180
Fig 11.14
20
19
18
17
16
15
14
13
12
11
10
9
8
7
6
5
4
3
2
1
x
x
x
x
x
xx
xx
x
x
x
xx
xx
x
x
x
AVC
MC
APL
Output0 1 2 3 4 5 6 7 8 9 10 11 12 13 14 15 16 17 18
Cost
MPL
Fig 11.14

ChapterChapterChapterChapterChapter 12
Concept Mapping andFlow Charts in Economics
What is Concept Mapping?
Concept mapping is a technique of linking differentconcepts to visualise the relationship between them.Here different concepts are shown by means of suitablefigures and then they are joined with arrows or lines.The lines can also be associated with suitable phraseslike 'goes to', 'comes out', 'added to', etc. However, it isnot compulsory to associate the lines with such phrases.The main idea is to make the reader understand what aparticular line means. According to Wikipedia, "Conceptmaps have their origin in the learning movement calledconstructivism. In particular, constructivists hold thatlearners actively construct knowledge." In fact, it is avery good way of learning by doing. However, thetheoretical foundation of concept mapping as a greatlearning tool has been first given by Joseph D. Novokand his research team at Cornell University in the1970s.
Psychological foundations ofconcept mappingIt has been well established by the psychologists thatour real learning does not mean filling up the storehouseof brain by more and more information, as is the case

Concept Mapping and Use of Flow Charts to Teach Economics182
of rote learning. In fact, learning takes place byinteraction of information inputs through differentsystems between different parts of the brain i.e. short-term memory, working memory and long-term memoryand integrating those information inputs with theexisting knowledge. While constructing a concept mapthe learner has to activate the function of the brain insuch a way that the different small concepts of the mapare related to each other. Psychologically conceptmapping facilitates learning in two ways, firstly acquiringthe related images faster and secondly retaining themfor longer period.
Different researches have established that learningof related concepts become much easier than that ofnon-related concepts. It has been nicely explained byNovak, J. D. & A. J. Cañas in a paper, 'The TheoryUnderlying Concept Maps and How to Construct Them': "…… if a person is presented with a list of 10-12 lettersor numbers to memorize in a few seconds, most willrecall only 5 to 9 of these. However, if the letters can begrouped to form a known word, or word-like unit, orthe numbers can be related to a phone number orsomething known, then 10 or more letters or numberscan be recalled. In a related test, if we give learners 10-12 familiar but unrelated words to memorize in a fewseconds, most will recall only 5-9 words. If the wordsare unfamiliar, such as technical terms introduced forthe first time, the learner may do well to recall correctlytwo or three of these. Conversely, if the words are familiarand can be related to knowledge the learner has in her/his cognitive structure, e.g. months of the year, 12 ormore may be easily recalled."
Retention of visual images also becomes longer. Ithas been established in different studies that humanbeings have a good ability to remember images. Forexample, instead of telling students with the help oflanguage how the different sectors of an economy areinterrelated, if we show them this relation by drawingvisual images of different things going from one sectorto another, it will be easier to recall it afterwards; it willbe much easier to recall, even after longer period, if wetell them to draw the figures by themselves.
182
Handbook for Economics Teachers 183
Use of concept mapping inteaching Economics
Economics is a subject in which the students have tounderstand the relationship between abstract concepts.Especially for many a young learner who is studyingthe subject for the first time it becomes very difficult tobuild up a concrete knowledge of abstract concepts andalso to understand the relationship between them.Concept mapping has proved to be one of the good toolsin achieving this objective.
How to develop a concept map?
i) The first step to develop a good concept mapis to decide about the domain. One has todecide about what should be the subjectmatter of the concept map which is going tobe created.
ii) The next step is to set a good focus question.Here it should be decided what one is going toestablish or show by means of the conceptmap.
iii) After this it is better to have a rough sketchshowing how the different key concepts are tobe placed and related.
iv) Then the different key concepts are to belabeled at different places with differentsymbols or figures.
iv) Those concepts are then linked with arrowsand/or linking words or phrases.
v) For good understanding of the relationshipsbetween the sub-domains of the map, it maybe necessary to crosslink different concepts.
vi) Finally, the concept map should be revised tobe given a better look and to be made bettermeaningful. Selection of proper colourcombination and figure is also a veryimportant aspect. It is better to give differentcolours for the concepts of different categories
Concept Mapping and Use of Flow Charts to Teach Economics184
but same colour for the concepts of samecategory.
Types of concept map
Different types of concepts maps have been discussedby different researchers like, hierarchical, cyclical, chain,spider-map or network. There are differences of opiniontoo on what type of concept map is more beneficial forlearning. For example, at the initial stage some of theresearchers strongly advocated for hierarchical conceptmap (Novak,1998). Hibberd, Jones and Morris (2002)and some others could not support this opinion.Safayeni, Derbentseba and Canas (2003), on the otherhand, argued in favour of cyclical type of concept map.Thus the researchers differ in their opinions as to whichtype of concept map is better than the others. However,it is widely accepted that the type of a concept mapdoesn't matter. What is important is that it should besuitable to the subject matter on which we are going toconstruct it.
Advantages of concept mapping
i) A well constructed concept map with goodcolour combination in meaningful figuresattracts a new learner, at the first instanceitself, towards the concept map and, for thatmatter, to understand the relation depicted init.
ii) Concept mapping organises the knowledgesystematically. The learner becomes able todefine and explain different concepts or therelationship amongst them without rotelearning. The whole subject matter becomeslike a picture to her. As a result, retention oflearning also easy for longer period.
iii) As the learner gets the joy of creativity, learningno longer becomes boring to her. She getsimmense interest in the subject matter.

Handbook for Economics Teachers 185
iv) Concept maps also help the teacher to identifywhere her student's concept is not clear. Awrong arrow or a wrong phrase easily reflectsthe problem area of the learner.
v) According to some researchers concept mapsalso help in evaluation of a learner's level oflearning. But researches are still requiredbefore it can be utilized as a powerful tool ofevaluation free from subjectivity.
Use of Computer in constructingconcept map
It should, however, be remembered that the constructionof a concept map never ends. The more we look at it orrevise it, the more we can make it attractive andmeaningful. The use of computer software, likePowerPoint, therefore, helps us a lot in this field.
However, a note of caution is to be mentioned forthe teachers. While constructing the concept map astudent can easily forget the objective of such activityand as a result by losing her path she may get involvedin useless drawing. The teacher should, therefore,develop an idea beforehand about what she expects fromher students and remain vigilant in the class to guideand facilitate her students so that the right objective isachieved within stipulated time.
Let us see a few flow charts developed on the basisof concept mapping of strategies. Such charts alongwith necessary discussion will help not only the teachersto teach but also the young learners to learn somedifficult topics better. The teachers can prepare thesemaps in PowerPoint presentation and show the studentswith the help of LCD projector. These can also beprepared as classroom charts for ready reference. Butit will be even better to let the students prepare thesecharts in computer by themselves. They can prepareeven better charts on the same topic and on other topicstoo. It will make their concepts clear. They will also getmore interest in the subject. However, due to limitationin the use of colour in the book these maps have been

Concept Mapping and Use of Flow Charts to Teach Economics186
shown in bi-colour. But more the use of colour is done,especially different colour for different groups, better amap will look and more interesting it will be to thelearners.
What do we study in economics?
When a student is going to study Economics for thefirst time he should be curious about what he is goingto study in the subject. Consumer Behaviour Theory,Production Theory, Theory of Market and EquilibriumPrice Determination, Theory of Distribution, etc. wesome samples of theories in economics. But littleimportance is given on the discussion on the origin orrelevance of these theories. Wherefrom these theorieshave come? Have they fallen from the sky? What is therelation between these theories? Why should we studythese? These are the questions normally remainunanswered to the young minds and that's why theynormally face difficulty in understanding the subject.So what is required is to correlate the different theoriesof Economics and to show students where a particulartheory belongs in the subject matter or what theimportance of that particular theory is. The followingfigure 12.1 will be helpful in correlating the differenttheories. But to introduce the figure we can go throughthe following question-answer method where theanswers to the questions are expected from the studentsin the classroom.
Teacher: Why do we study Economics?Students: To know how we can earn money; to know
how we can develop our economy; to know howto keep accounts of a company, etc.
Teacher: O.K. Can you tell, what are our basic needsto live in this world?
Students: Food, clothing and shelter.Teacher: Good. Now suppose Mahesh (take the
name of any student in the class) hascompleted his graduation and his father tellshim to maintain his own livelihood by earningfor himself. So he moves on to a town and look

Handbook for Economics Teachers 187
for a job. He gets a job of, say, Rs.7000/-.Suppose with this he takes a rented room;spends certain amount on food, clothing andfurther education; buys a bicycle and a taperecorder for amusement. Will he be satisfiedwith this?
Students: No, sir.Teacher: O.K. So now he wants to shift to a better
house, to get better food, clothing andeducation. Now he doesn't want to ride abicycle. He wants to have a motor bike. Atleast a colour T.V. set he wants to have foramusement. So he tries for a job of bettersalary. Yes, he gets one of Rs.12,000/-. Willhe be satisfied with these?
Students: No.
Factors of( Land, Labour,
Fig. 12.1 What Do We Study In Economics?
How To Solve The Problem Of Unlimited Demand WithLimited Resources Which Have Alternative Uses
By Creating More Utility To The Existing Resources I.e. By Production
FACTOR MARKET
P
EP
OD
S
SQEQ
DPayments to factors of(Rent, Wage,
Factors of ProductionInterest & Profit)
ProductionSector
HouseholdSector
Price of Products
Products P
EP
OD
S
SQEQ
D
PRODUCT MARKET
Theory of Factor Pricing
Consumer Behaviour Theory andTheory of Demand
Theory of Production and Supply
Theory of Market and PriceDetermination
Factors of ProductionCapital & Organisation)

Concept Mapping and Use of Flow Charts to Teach Economics188
Teachers: Well. Now again he wants to buy manyother things. Now in place of a motor bike hewants to have a car. In place of an ordinarycolour T.V. he wants to have a home theatre.So again he tries for a better opportunity andgets one of Rs.22,000/-. Will he be satisfiedwith these?
Students: No sir.Teacher: So, what do we find? Is there any limit of
our demand?Students: No sir. It is unlimited.Teacher: Very good. But to meet this unlimited
demand does Mahesh has unlimited resourceor income?
Students: No sir. It is limited.Teacher: So what is our problem?Students: How to meet unlimited demands with
limited resources.Teacher: How can we meet unlimited demands with
limited resources?The teacher should try to get the answer 'by
production'. If the students can give it, it'sgood. Otherwise he can start another story.
Teacher: Suppose a farmer has 100 quintal of riceby which he has to meet all his expenses forthe whole year. Will he finish the whole amountof rice just to meet his expenses for the year?
Students: No sir. He will utilise some amount forfurther production.
Teacher: Very good. But why will he go for furtherproduction?
Students: To meet his expenses on future demand.Teacher: Excellent! So what is the solution to meet
more and more demands with limitedresources?
Students: Production.Teacher: Yes, production. So now we will see the
basic things required for production. Can youtell first and foremost what do you require toconduct a production?
Students: Land.

Handbook for Economics Teachers 189
Teacher: Yes, a place where you can conduct theproduction process. Next?
Students: Labour.Teacher: Well, the man power who will actually
produce the things. Next?Students: Capital.Teacher: Good, the machinery, the infrastructure,
the stock of raw materials and, of course,money, all these things are included in capital.Now suppose a piece of land is lyingsomewhere, capital is lying somewhere elseand some labourers are also sitting somewhereelse. Will there be automatic production?
Students: No, someone is required to organise theproduction process.
Teacher: So we require some organiser.Remember, answers in the classroom may not come
as expected above. But we have to get theseanswers by proper questioning and directingtheir thought process in the desired way. Nowrefer to the chart.
Teacher: Now let us look at the chart 'WHAT DOWE STUDY IN ECONOMICS?'
Here we can see that the 'PRODUCTION SECTOR' isconducting the production process with the help of thefour 'Factors of Production' i.e. Land, Labour, Capital andOrganisation. But wherefrom are they getting these?
Students: From 'HOUSEHOLD SECTOR'.Teacher: Good, after conducting the production what
are they doing with it?Students: They are selling it to the 'HOUSEHOLD
SECTOR' through the 'MARKET'.Teachers: What are they getting in return?Students: They are getting 'Prices of Products'.Teachers: Well, what are they doing with it?Students: They are distributing it as the 'Prices of
Factors of Production'Teacher: So we can now have a concise idea about
what we are going to study in Economics.
Concept Mapping and Use of Flow Charts to Teach Economics190
Basically the subject matter of Economics canbe studied in two ways. Either we can discussabout the individual economic units or we canalso discuss the economy as a whole. Now whatis another name of small?
Students: Tiny, micro.Teacher: Yes. So that part of Economics which
studies about individual economic units oreconomic units in small scale is calledMicroeconomics. And that part of Economicswhich studies about the economy as a wholeis known as ……
Students: Macroeconomics.Teacher: Good. Now, so far as Microeconomics is
concerned, in a free market economy the mostimportant place is the market where the priceis determined by the market forces of DEMANDand SUPPLY. Now who is demanding forproducts in the market?
Students: The CONSUMERS.Teacher: Well, so to get the demand curve what we
have to study is the 'CONSUMER BEHAVIOURTHEORY AND THE THEORY OF DEMAND'.Now, who are the suppliers in the market?
Students: The PRODUCERS.Teacher: Good, so to get the supply curve we have
to study the 'THEORY OF PRODUCTION ANDSUPPLY'. Now, once we get the DEMAND andSUPPLY curve we have to study thecharacteristics of different MARKETS and thenwe can see how price of a commodity isdetermined in the market. The pricedetermination in the FACTOR MARKET,however, has got a separate importancebecause of certain reasons. And that's why itis discussed under a separate heading i.e.THEORY OF FACTOR PRICING or theTHEORY OF DISTRIBUTION. However, it is notin your syllabus.
So far as Macroeconomics is concerned, we will learnhow national income or employment or general

Handbook for Economics Teachers 191
price level is determined in an economy. Wewill also learn how we can solve challengeslike unemployment or deflation or inflationwith the help of fiscal or monetary or any otherpolicy. For that matter, we will also study whatfiscal or monetary policy is. But in order to doall these first of all we have to study how wecan measure national income of a country.And finally, since no economy can stay isolatedfrom the rest of the world, we need to havesome idea about how economic transactionsof a country are recorded. This is what we aregoing to study in Economics, as far as yourSenior Secondary syllabus is concerned.
How to calculate national income?
National Income Accounting is one chapter where thestudents face maximum difficulty. The difficulty arisesespecially when they have to calculate national incomeaggregates. In most cases students prefer to memorisethe formula. Students are expected to understand manyconcepts and estimate numerical values of theseconceptual estimates.
Here we will see how concept mapping helpsstudents to understand the concepts well and also tocorrelate those concepts so that need not have to mugup lifeless formula anymore and they will be able toprepare concept map required to solve any problem.The concepts as well as the concept map will thenbecome lively to the learners.
Here we are having total three concept maps, titled‘HOW TO CALCULATE NATIONAL INCOME : PRODUCTMETHOD & INCOME METHOD’, ‘HOW TO CALCULATENATIONAL INCOME : EXPENDITURE METHOD’, and‘NATIONAL INCOME ACCOUNTING — THE IDENTITY’.The first two concept maps help in developing the clearunderstanding items and the third one correlates theconcepts and helps students to understand the relationbetween concepts. The students also can prepare candevelop similar ones by themselves.

Concept Mapping and Use of Flow Charts to Teach Economics192
In the first concept map, titled ‘HOW TO CALCULATENATIONAL INCOME : PRODUCT METHOD & INCOMEMETHOD’, we see that the circular flow of income itselfgives us the Domestic Product or Domestic Income.Domestic Product is nothing but the sum total of SALESof final output and CHANGE IN STOCK (which is lyingunsold with the production sector itself). To get the NetDomestic Product (NDP) DEPRECIATION (which is againlying within the Production Sector) is going out of thecircular flow. To get the Net Domestic Product at FactorCost (NDP at FC) INDIRECT TAX is going out of thecircular flow to the Government Sector and SUBSIDYis joining the circular flow form the GOVERNMENTSECTOR. Again NET FACTOR INCOME FROM ABROADis coming form the FOREIGN SECTOR to join NDP atFC to give us Net National Product at Factor Cost (NNPat FC) or Net National Income at Factor Cost (NNI atFC) or National Income (NI).
In the second concept map, titled ‘HOW TOCALCULATE NATIONAL INCOME : EXPENDITUREMETHOD’, we can see how expenditure meted out bydifferent sectors and the estimates on Gross DomesticProduct at Market Price (GDP at MP), coming out of thePRODUCTION SECTOR. So the sum total of all theseexpenditures and INCREASE IN STOCK gives us GDPat MP. So from GDP at MP we get the National Incomein the same way as it has been explained in the previousparagraph.

Handbook for Economics Teachers 193
Factors of( Labour i.e.
Employees, Land,
ProductionCapital & Organisation)
Fig. 12.2. How to Calculate National Income?
Product Method & Income Method
FACTOR MARKET
P
EP
OD
S
SQEQ
DPrices of Factors ofProduction (wage I.e.
Compensation of Employees
HouseholdSector
Price of ProductsSold i.e. Sales
Sale ofProducts
P
EP
OD
S
SQEQ
D
PRODUCTMARKET
NationalIncome orNNP at FC
or NNI
Foreign Sector
atFC
NDP NET Factor Income from Abroad
I.e. Factor IncomeRent, Interest & Profit )
IndirectTaxes
Subsidy
Government Sector
Production Sector
Intermediate
Consump
Increasein stock

Concept Mapping and Use of Flow Charts to Teach Economics194
Fig. 12.3 How to Calculate National Income
Expenditure Method
HouseholdSector
NationalIncome orNNP at FC
or NNI
Foreign Sector
GDPATM
NET Factor Incomefrom Abroad
Government Sector
Production Sector
Net Indirect Tax(Indirect Tax-Subsidy)
Depreciaton
Gross BusinessFixed Investment
Net Export (Export-Import)
Gross Residential Construction Investiment
Private Final Consumption Expenditure
GrossPublic
InvestmentGovt. Final
ConsumptionExpenditure
Increase inStock
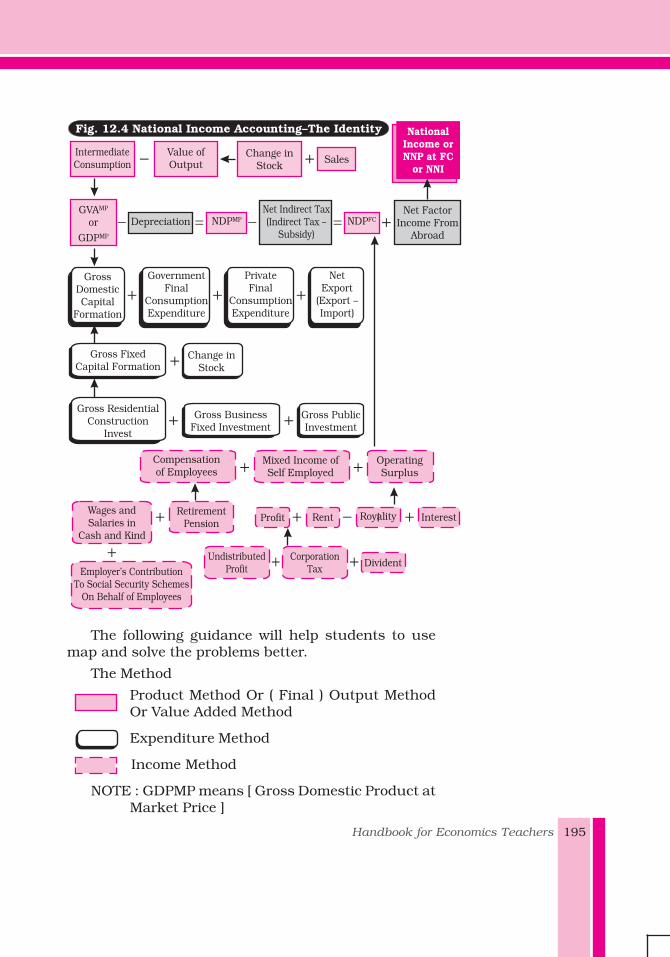
Handbook for Economics Teachers 195
Fig. 12.4 National Income Accounting–The Identity
IntermediateConsumption
Value ofOutput
Change inStock
Sales
NationalIncome orNNP at FC
or NNI
GVAor
GDP
MP
MP
Depreciation NDPMPNet Indirect Tax(Indirect Tax –
Subsidy)NDPFC
Net FactorIncome From
Abroad
GrossDomesticCapital
Formation
GovernmentFinal
ConsumptionExpenditure
PrivateFinal
ConsumptionExpenditure
NetExport
(Export –Import)
Gross FixedCapital Formation
Change inStock
Gross ResidentialConstruction
Invest
Gross BusinessFixed Investment
Gross PublicInvestment
Compensationof Employees
Mixed Income ofSelf Employed
OperatingSurplus
Wages andSalaries in
Cash and Kind
RetirementPension Profit Rent Royality Interest
Employer’s ContributionTo Social Security Schemes
On Behalf of Employees
UndistributedProfit
CorporationTax Divident
The following guidance will help students to usemap and solve the problems better.
The Method
Product Method Or ( Final ) Output MethodOr Value Added Method
Expenditure Method
Income Method
NOTE : GDPMP means [ Gross Domestic Product atMarket Price ]

Concept Mapping and Use of Flow Charts to Teach Economics196
Here we have three terms: (i) G [ GROSS ], (ii) DP [DOMESTIC PRODUCT ] and (iii) MP [ MARKETPRICE ]
To be changed into other three terms: (i) N [ NET ],(ii) NP [ NATIONAL PRODUCT ], and (iii) FC [FACTOR COST ] respectively
With the help of three instruments: (i)DEPRECIATION, (ii) NFIA [ NET FACTORINCOME FROM ABROAD ] and (iii) NIT [ NETINDIRECT TAX ] respectively.
THE TECHNIQUE :GROSS - DEPRECIATION = NET ==> NET +
DEPRECIATION = GROSSDOMESTIC PRODUCT+ NFIA = NATIONAL
PRODUCT ==> NATIONAL PRODUCT - NFIA= DOMESTIC PRODUCT
MARKET PRICE - NIT = FACTOR COST ==> FACTORCOST + NIT = MARKET PRICE
For example :GDPMP + NFIA = GNPMP; GDPFC + NIT = GDPMP;
GDPMP - DEPRECIATION = NDPMPNOTE :To change from one aggregate to another aggregate
we should see out of three terms how manywe have to change and what are those. Utiliseonly those relevant instruments for additionor subtraction as the case may be.
For example :We have to change from GDPFC to NDPMP.As we have to change only two terms G(Gross)to N(Net) and FC(Factor Cost) to MP(MarketPrice), we have to subtract DEPRECIATIONand add NIT with GDPFC . As DP(DomesticProduct) remains same we have nothing to dowith NFIA.

ChapterChapterChapterChapterChapter 13
Assessment and FramingQuality Questions inEconomics
INTRODUCTIONAssessment - a regular element in most economicsclassroom work holds the key to better learning. It isan important component of formal education system.It is expected to help teachers and school managers tounderstand what students learn in the classroom,identifying the challenges faced by them in learning(economics) curricular contents or achieving (economics)curricular objectives and provide remedial measuresfor better learning. Examinations are conducted bygovernment-run boards through schools affiliated tothem to certify students that they have achieved therequired curricular objectives in the subject or groupof subjects. The school managers use tests andexaminations as a tool to assess the performance ofteachers as well.
Economics is taught as a part of part of socialsciences / social studies course in classes 6-10. Theimportance in terms of marks allotted to this subjectvaries from board to board. At the secondary stage, afew boards give less emphasise whereas a few otherssuch as CBSE allot 16-20 per cent of social sciencecourse marks to economics. At higher secondary stage,economics is taught as one of the four elective courses.

Assessment and Framing Quality Questions in Economics198
Curricular Objectives andAssessment
The first and important step in designing assessment isto identify and evaluate the learning objectives i.e.,knowledge and key skills that curriculum developersexpect learners to acquire from a particular course. Itis not an easy task as the nature of students are mixedgroup. Traditionally the knowledge dimension has beengiven greater emphasise as opposed to transferable skills– those skills which are required while learning thecontents of the subject but also useful in the day-to-day life and in many service sector jobs such as abilityto communicate, negotiate, make effective use ofinformation technology and other resources. We mayfind the course objective has already incorporated thesegoals. The modern approach to assessment is expectedto promote both skills and knowledge dimension of thesubject. However we need to ask whether or the existingassessment practices which are mainly directed bygovernment agencies such as Examination Boards haveany scope for assessing various dimensions of the courseobjectives.
In Indian schools, economics students generally haveexams – quarterly, half yearly, mid-term examinations,monthly examinations, revision tests, pre-boardexaminations – almost all of them test the individualknowledge base but questions are often relativelypredictable, and in assessment, as Miller (2006) pointsout, it is difficult to distinguish between surface learningand deep learning. In some Boards, project work isincluded in class XI and 5-10 marks are allotted. Inclass XII, no mark is allotted for project work / activities.So all the marks are alotted to year-end examinations.The IB and ISCE allot 20-25 marks for internalassesment. What we find is rather a continuum –ranging from full marks to year-end examination andone-fourth is allotted for project-work and school-based
198

Handbook for Economics Teachers 199
activities. NCERT recommends 60 per cent marks tobe allotted for year-end examinations and 40 per centfor school-based activities. Why no examination boardfollow this principle?
Every course whether history, geography or economicstaught in schools has specific objectives. Throughclassroom practices and other experiences, schools andteachers are expected to achieve these objectives. It is acommon practice among teachers to plan their classesusing lesson plans to organise classroom and guidestudents to carry out activities or projects. Tests andexaminations (t & e) both written or projects and activitiesenable teachers to come to know how and whether or notstudents succeeded in achieving the curricular objectivesof the economics course, diagnose difficulties pupils facewhile learning and provide remedial measures. Theassessment is also expected to improve the quality oflearning not merely to measure it.
DO IT YOURSELF - 1
The following table provides the objectives of teachingeconomics at higher secondary level. These are givenin the Senior Secondary School Curriculum. Look 10questions in give on page 204 and mark the questionnumbers which fulfil the specific curricular objective.
S. Course Which subject (s) WhichNo. Objectives /topic (s) would be is question
intended to more achieve theappropriate/has greater objective?scope to achieve (Write thethe course objective? question nos.)
1. Understanding basic economic oncepts
2. Developing economic reasoning which thelearners can apply in their day-to-day lifeas citizens, workers and consumers.
3. Sensitise learners' role in nation building
4. Make learners to be sensitive to theeconomic issues that India is facing today
Table 13.1: Course Objectioves in Economics

Assessment and Framing Quality Questions in Economics200
5. Equipping learners with basic tools ofeconomics to analyse economic issues
6. Equipping learners with basic statisticaltools to analyse economic issues
7. Make learners to understand that therecan be more than one view on anyeconomic issue and it is necessary toacquire skills to argue logically withreasoning
Assessment in Economics – AnOverview
There is an old saying - the more things change, themore remains the same. The examination system inIndia is a clear example of this phenomenon. Eventhough a considerable change has taken place inassesment, there is no change in the fundamental(narrow) objective of conducting examinations.
Tests and examinations can be broadly categorizedinto four: (i) entrance tests (assessing the knowledgeand competency before taking up a course), (ii) formativeassessment (tests providing continuous feedback tolearners and teachers about the process of learningduring the course), (iii) diagnostic tests (to determinelearning difficulties faced by the learners) and (iv)summative assessment (tests to determine the extentto which objectives of the course is achieved). Each oneof them serves different purpose. While the diagnostictests are conducted to organize remedial measures,summative assessment tests are used to assign gradesor for certifying the level of mastery achieved by a learnerin a particular course.
In 1950-60s, only essay questions were asked inBoard examination. Students were given the option toattempt 50-60 per cent of the given questions accordingto their own choice. Students had to take twoexaminations – half yearly and end of the year / annuallyand weights given to end of the year examinations washigh as compared to half yearly examinations. Thissystem was found defective in many ways. Since the

Handbook for Economics Teachers 201
number of essay type questions that can be set in acourse is limited, the questions tend to get repeatedover the years. The content coverage was poor withstudents relied upon guess work and selective study ofthe textbook contents. The options given to the studentsalso promoted the selective study of the contents.Questions were defective, containing ambiguity inlanguage. They were set without taking into accountthe curricular objectives – objectives of teachingeconomics. Overall marks assigned to a question werestated but the marks assigned to the parts of thequestion were not specified which led to difficulty onthe part of students in understanding emphasise in aquestion and also promoted subjective marking of theanswers by examiners. Both inter-examiner and intra-examiner reliability were very low.
All these defects called for changes in theexamination system. The present assessment in mostexamination boards is based on the Bloom’s taxonomyof educational goals.
Bloom’s Taxonomy and Teaching Economics
In 1956, Benjamin Bloom and his collaboratorspublished a framework for categorizing educationalgoals. This is popularly known as Bloom's Taxonomy.This framework has been mostly used by school andcollege teachers for planning their classroom activities.Bloom's taxonomy consist six major categories:Knowledge, Comprehension, Application, Analysis,Synthesis, and Evaluation. While each categorycontained sub-categories, by its structure, the taxonomyis hierarchical (levels increase in dif ficulty/sophistication) and cumulative (each level builds on andsubsumes the ones below). This also indicates acontinuum from simple to complex and concrete toabstract (see Box 1).
Six CateSix CateSix CateSix CateSix Categggggories oories oories oories oories of Bloom's Tf Bloom's Tf Bloom's Tf Bloom's Tf Bloom's Taxonomy Deaxonomy Deaxonomy Deaxonomy Deaxonomy Definefinefinefinefineddddd
(i) Knowledge: This "involves the recall of specifics anduniversals, the recall of methods and processes, or therecall of a pattern, structure, or setting."

Assessment and Framing Quality Questions in Economics202
Questions in this category contain terms such as:arrange, define, duplicate, label, list, memorize, name,order, recognize, relate, recall, repeat, reproduce, stateand so on.Example: Define poverty line.(ii) Comprehension "refers to a type of understandingor apprehension such that the individual knows whatis being communicated and can make use of thematerial or idea being communicated withoutnecessarily relating it to other material or seeing itsfullest implications."Teachers ask questions containing words such asclassify, describe, discuss, explain, express, identify,indicate, locate, recognize, report, restate, review, select,translate.Example: How is the price elasticity of demand of acommodity affected by the number of its substitutes?Explain.(iii) Application refers to the "use of abstractions inparticular and concrete situations."Verbs normally used to develop questions are: apply,choose, demonstrate, calculate, employ, illustrate,interpret, operate, practice, schedule, sketch, solve, useand write.Example: The price elasticity of supply of commodity Xand Y are equal. The price of X falls from Rs.10 to Rs.8per unit and its quantity supplied falls by 16 per cent.The price of Y rises by 10 per cent. Calculate thepercentage increase in supply.(iv) Analysis represents the "breakdown of acommunication into its constituent elements or partssuch that the relative hierarchy of ideas is made clearand/or the relations between ideas expressed are madeexplicit."Verbs used to test this goal are, calculate, categorize,compare, contrast, criticize, differentiate, discriminate,distinguish, examine, question, test and so on.Example: Distinguish between intermediate productsand final products. Give example. (v) Synthesis involves the "putting together of elementsand parts so as to form a whole."A few examples of verbs used to test this goal are:arrange, assemble, collect, compose, construct, create,develop, formulate, manage, organize, plan, prepare,set up and write.Example: Explain the circular flow of income.(vi) Evaluation engenders "judgments about the valueof material and methods for given purposes."

Handbook for Economics Teachers 203
A few verbs used to test this goal are: appraise, argue,assess, attach, choose, compare, defend, estimate,predict, rate, core, select, support, value, evaluate.Example: How will you treat the following whileestimating national income in India? Give reasons foryour answer.12345
Organising economics curriculum and classroomactivities as suggested in the taxonomy can help (i) bothstudents and teachers to come to know why economicsis taught; (ii) teachers to organise objectives of eachchapter of the textbook / syllabus as suggested in theframework so that they can clarify objectives forthemselves and for students; (iii) organising set ofobjectives so that economics teachers can (a) planclassroom teaching and other activities; (b) design validassessment tasks and strategies and (c) ensure that whatthey teach and assess are aligned with the objectives ofteaching economics. However, due to various reasons,Bloom's hierarchical taxonomy is mostly used for settingquestion papers to ensure that 'students progress to thehighest level of understanding'. In Indian boardexaminations, these six categories are reduced to four(by clubbing the last three categories under one categorycalled "skills" or "skills and abilities").
Many of you would have set question papers forannual Board examinations. As pointed out earlier, mostof us tend to give emphasise on knowledge recall andto a certain extent on understanding. Questions testingapplication and skills are given third and least priority.
DO IT YOURSELF - 2The following table contains some questions asked inhigher secondary board examinations in India. Classifythem into six categories in column 2 (Type I) and givethe codes given in brackets (Knowledge - K;Comprehension - C; Application- A; Analysis - AN;Synthesis - S and Evaluation - E).

Assessment and Framing Quality Questions in Economics204
Limitations of using Bloom's taxonomy
Studies show that examination system based on Bloom’staxanomy in India is stressful experience for childrenand questions asked in the board examinations arehighly biased towards knowledge recall. To quote froma Report of the National Advisory Committee popularlyknown as Yashpal Committee Report on LearningWithout Burden,
"Children have no choice but to memorise all the 'names'in order to 'prove' in an examination that they have'understood' a phenomenon. Despite all kinds of claimsthat examinations have been reformed, they continueto focus on testing the possession of 'correct'information (i.e., the names of things, definitions,examples, etc.). Recall-type questions outnumber thequestions that test the child's capacity to speculate,evaluate or judge, and to apply an idea in an unfamiliarcontext. Board examinations, taken at the end of classX and class XII, have remained rigid, bureaucratic andessentially uneducative (as the child never sees why heor she was marked in a certain way), and mainly a
Table 13.2: Bloom’s Taxonomic and Economics Question
S. No. Question Type I Type II
1. What is a demand schedule?
2. What is commercial bank?
3. Distinguish between balance of trade and balance of current ac-count.
4. Explain what happens to losses if the firms are free to leave thecountry.
5. The concept of equilibrium is always explained with reference toa) price b) supply c) demand d) time
6. Explain the meaning and objectives of monetary policy.
7. Distinguish between a normal good and an inferior good. Give ex-ample in each case.
8. What causes a downward movement of along a supply curve?
9. Enlist the internal and external diseconomies of scale.
10. Calculate the net value added at factor cost from the following data(in Rs. lakhs.). (i) Depreciation – 20; (ii) intermediate cost – 90; (iii)Subsidy – 5; (iv) Sales – 140; (v) Exports – 7; (vi) Change in Stock –(-) 10; (vii) Imports of raw materials – 3.

Handbook for Economics Teachers 205
source of awe because of the amount of informationthey demand in a manner ready for instant recall. Sucha system obviously influences the tests and annualexaminations taken by schools in earlier classes as wellas the daily pedagogy practised in classrooms." (NCERT,1993, p.17)
The examination system is common to all subjectsand economics courses are not exception to this generalpattern. Memory recall and rote memorisation are givenmore importance and a very little attention is drawn ondeveloping questions that tests economics students'higher mental abilities. Economics is a social sciencehaving potential for developing more than oneperspective and method to understand any economicphenomenon, questions are not asked to test whetherchildren develop these perspectives. Since greateremphasis is laid on memory recall, textbooks producedby most textbook publishing agencies both in publicand private sectors present content materials thatpromote rote memorisation rather than a pedagogicalinstrument for understanding economic concepts.
The National Curriculum Framework (NCF) 2005recommends schools to (i) shift learning away from rotemethods and (ii) making examinations more flexible andintegrated into classroom life. The National Focus Groupon Examination Reforms set up by National Council ofEducational Research and Training, New Delhi statedin its Position Paper that the present examinationsystem is inappropriate for the "knowledge society ofthe 21st century" which requires "innovative problemsolvers". Also the examination system does not servethe needs of social justice. Questions asked in the Boardexaminations encourage rote memorisation and fail totest higher order skills like reasoning and analysis,lateral thinking, creativity and judgement. It does notrecognise differentiation among learners and theirenvironment rather they induce unnecessary anxietyand stress which lead students risking their lives.Economics questions are exception to this trend.
More recently, emphasis has shifted frominstructional objectives, which describe what instructorsdo and the content of material presented duringclassroom instruction, to student learning indicatiors,

Assessment and Framing Quality Questions in Economics206
which describe what students can do as a result of theireducational experiences.
Revision of Bloom's Taxonomy
In 2000, a group of cognitive psychologists, curriculumtheorists and instructional researchers, and testing andassessment specialists came out with a revised versionof Bloom's Taxonomy (Anderson and Krathwohl, 2000).The revised taxonomy has been recognised as "moredynamic" conception of classification. While the originaltaxonomy used nouns, the revised taxonomy containsverbs and gerunds to label their categories andsubcategories.
The "action words" which describe the cognitiveprocesses by which thinkers encounter and work withknowledge are: (i) Remember (Recognizing andRecalling); (ii) Understand (Interpreting, Exemplifying,Classifying, Summarizing, Inferring, Comparing,Explaining, Apply, Executing, and Implementing); (iii)Analyze (Differentiating, Organizing and Attributing); (iv)Evaluate (Checking and Critiquing); (v) Create(Generating, Planning and Producing).
DO IT YOURSELF -3
Classify the questions given in the above table in thecolumn 3 (Type II). You can code them into the following:(i) Remember - R; (ii) Understand - I; (iii) Analyse - A;(iv) Evaluate - E and (v) Create - C.Do you think the revised taxonomy is better than theoriginal one? How?
In the revised taxonomy, knowledge is at the basis ofthese six cognitive processes, but its authors created aseparate taxonomy of the types of knowledge used incognition (i) Factual Knowledge (Knowledge ofterminology and knowledge of specific details andelements), (ii) Conceptual Knowledge (Knowledge ofclassifications and categories, Knowledge of principlesand generalizations and knowledge of theories, models,and structures) and (iii) Procedural Knowledge(Knowledge of subject-specific skills and algorithms,Knowledge of subject-specific techniques and methods,

Handbook for Economics Teachers 207
and Knowledge of criteria for determining when to useappropriate procedures); (iv) Metacognitive Knowledge(Strategic Knowledge, Knowledge about cognitive tasks,including appropriate contextual and conditionalknowledge and Self-knowledge).
Skills and competencies in Economics
The second important aspect economics teachers keepin mind the skills and competencies imparted toeconomics students. Look at the following questions:
(i) How are price and output determined underconditions of perfect competition in the shortrun and long run? Give suitable diagram.
(ii) Explain consumer's equilibrium in case of asingle commodity with the help of a utilityschedule.
(iii) Do you think outsourcing is good for India? Whyare developed countries opposing it?
(iv) Describe development goals of your area asvisualised by you.
The above questions are some examples of questionsasked in the board examinations or given in economicstextbooks. You will find that these questions not onlytest the knowledge aspect of the topics but also test avariety of skills acquired by the learners. For example,the first two questions test whether the economicsstudents are able to draw diagrams and the last twoquestions test the ability of students to analyse andargue with evidence on the topic and at the same timemake judgements while answering the questions. Thelast question also requires students to be aware of thearea in which she resides.
Students taking economics as a course are expectedto achieve the course objectives by studying the coursesand carry out all the course-related activities given bythe course teachers. In this process learners not onlydevelop an understanding of course contents but alsoacquire skills and competencies, also called astransferable skills. These skills are recognised as genericskills students can use in their workplace and in theirday-to-day lives even if they do not pursue higher

Assessment and Framing Quality Questions in Economics208
studies. Even though there is a greater demand fromeducationists, teachers and students, hands-onactivities or doing a project in yet to the required receivesufficient attention in the economics education in India.
Graph skills and data analysis - are not onlynecessary for the economics student to draw a chartusing the economic data but also are useful to analyse,draw conclusions from the economic data. Graph skillsare also used for a variety of other purposes - inmicroeconomics and macroeconomics, economicsstudents are trying to understand the principle behindsome decisions - taken by individual or the country.They are expected to illustrate and explain graphically,mathematically or verbally, how and why such and suchdecisions are taken.
DO IT YOURSELF - 4
As a teacher, we know that students learn various skillswhich they may use when they join the labour market.They may become a professor in a university, salesexecutive in a company, economist in a bank, for thegovernment or private organisation, or as anadministrator or as clerical staff. What are the skillsthey learn while they study economics? You may also
Sl. No.
Details of textbook and chapter
Details of contents Skills students expected to acquire
1 Indian Economic Development (Economics textbook for class XI, NCERT)
Chapter 2: Indian Economy 1950-1990, pages 28 and 31.
Analytical skills - use statistics knowledge to draw pie charts and interpret the data; (ii) communication skills – presenting the analysis in the classroom
2 3 4 5 6

Handbook for Economics Teachers 209
have witnessed demonstration of their skills in theclassroom and in various occasions. List five such skillsthey acquired and the basis, i.e., which part of thechapter / sections of economics texts students learnsuch skills.
Conclusion
In the post-independent India, knowledge – based ormemory recall questions required to help to assesslearners’ ability to understand concepts and issues in asimilar pattern or whether they are able to answer inthe same way and identify the expected one “correct”answer. Students who have acquired such skills arerequired for industrialisation and for working infactories. This understanding has undergone in the early1990s as the developmental path of India’s economymoved from manufacturing to service-driven. Now, thekind of skills required is different – employers requireone who is able to answer differently. To quote from thePosition Paper of the National Focus Group onExamination Reforms brought out by NCERT,
"if standardisation is the key to success inmanufacturing, differentiation is the key to success inthe service sector. If consistency is a key quality of anindustrial worker, problem solving and lateral thinkingare key qualities in a service provider...."
This shows the need for changing the way questionsare asked and answers expected. Rather expecting asimilar answer, examiners are expected to look foruniqueness in every answer for questions asked in theexaminations.
Exposure to various evaluation and assessmentpatterns even if they are non-evaluative, is essential forachieving the curricular objective or economic educationand help learners to order the world of work.

Assessment and Framing Quality Questions in Economics210
REFERENCESAnderson, Lorin W., David R. Krathwohl (ed.) A
Taxonomy for Learning, Teaching, andAssessing: A Revision of Bloom's Taxonomy ofEducational Objectives, Abridged Edition, Allynand Bacon, Second Edition,2000
ARG (1999) "Assessment for Learning: Beyond theblack box," Assessment Reform Group,University of Cambridge School of Education,Cembridge, 1999.
Bawa, M.S. (ed.) (1996), Evaluation in Economics:Teachers' Handbook, Institute of AdvancedStudies in Education, Department ofEducation, University of Delhi.
Newlands, David (ed.) The Handbook for EconomicsLecturers, http://www.economics.ltsn.ac.uk
NCERT (1993), Learning Without Burden, Report ofthe National Advisory Committee Appointed bythe Ministry of Human Resource Development,Government of India.
NCERT (2005) National Curriculum Framework2005, NCERT.
NCERT (2006), National Focus Group Position Paperon Examination Reforms, NCERT, New Delhi.
Appendix: Assessment forLearning: ARG Pamphlet
Assessment is an important area among educationalresearchers all over the world. In the late 1990s,Assessment Reform Group in United Kingdomconducted a review of research on the impact ofclassroom assessment on learning. Since some of itsfindings are important for classroom practitioners allover the world, they are given below.
• There is no evidence that increasing the amountof testing will enhance learning.
• Successful learning occurs when learners haveownership of their learning; when they

Handbook for Economics Teachers 211
understand the goals they are aiming for; when,crucially, they are motivated and have the skillsto achieve success. Not only are these essentialfeatures of effective day-to-day learning in theclassroom, they are key ingredients of successfullifelong learning.
• Assessment which is explicitly designed topromote learning is the single most powerful toolwe have for both raising standards andempowering lifelong learners.
• Assessment can be used effectively to raisestandards when teachers (a) decide how andwhen to assess pupils' attainment at the sametime as they plan the work; (b) are proficient inusing a range of assessment techniques in theclassroom; (c) prepare and make use ofmanageable systems for recording the progressof individual pupils.
• Assessment for learning is different from teacherassessment or formative assessment. Somecharacteristics of assessment that promoteslearning are: (a) it is embedded in a view ofteaching and learning of which it is an essentialpart; (b) it involves sharing learning goals withpupils; (c) it aims to help pupils to know and torecognise the standards they are aiming for; (d)it involves pupils in self-assessment; (e) itprovides feedback which leads to pupilsrecognising their next steps and how to takethem; (f) it is underpinned by confidence thatevery student can improve; (g) it involves bothteacher and pupils reviewing and reflecting onassessment data. This contrasts withassessment that simply adds procedures or teststo existing work and is separated from teaching,or on-going assessment that involves onlymarking and feeding back grades or marks topupils. Even though carried out wholly byteachers such assessment has increasingly beenused to sum up learning, that is, it has asummative rather than a formative purpose.
Assessment and Framing Quality Questions in Economics212
· Current thinking about learning acknowledgesthat learners must ultimately be responsible fortheir learning since no one else can do it for them.Thus assessment for learning involves pupils,so as to provide them with information abouthow well they are doing and guide theirsubsequent efforts. Much of this information willcome as feedback from the teachers, but somewill be through their direct involvement inassessing their own work. The awareness oflearning and ability of learning to direct it forthemselves is of increasing importance in thecontext of encouraging lifelong learning.
• In order to use assessment helping in learning,teachers must be involved in gatheringinformation about pupils' learning andencouraging pupils to review their work criticallyand constructively. The methods for gaining suchinformation are: (a) observing pupils - thisincludes listening to how they describe work andtheir reasoning; (b) questioning, using openquestions, phrased to invite pupils to exploretheir ideas and reasoning; (c) setting tasks in away which requires pupils to use certain skillsor apply ideas; (d) asking pupils to communicatetheir thinking through drawings, artefacts,actions, role play, concept mapping, as well aswriting; (e) discussing words and how they arebeing used.
• Teachers may, of course, collect information inthese ways but yet not use the information in away that increases learning. Use by the teacherinvolves decisions and action -decisions aboutthe next steps in learning and action in helpingpupils take these steps. But it is important toremember that it is the pupils who will take thenext steps and the more they are involved in theprocess, the greater will be their understandingof how to extend their learning. Thus action thatis most likely to raise standards will follow whenpupils are involved in decisions about their work

Handbook for Economics Teachers 213
rather than being passive recipients of teachers'judgements of it.
• Involving pupils in this way gives a fresh meaningto 'feedback' in the assessment process. Whatteachers will be feeding back to pupils is a viewof what they should be aiming for: the standardagainst which pupils can compare their ownwork. At the same time, the teacher's role - andwhat is at the heart of teaching - is to providepupils with the skills and strategies for takingthe next steps in their learning.
Hence assessment for learning depends on whatteachers do in classrooms and how they see their role.

AppendixAppendixAppendixAppendixAppendix
Reference Materials forTeachers and Students
I REFERENCE BOOKS
Whitehead, David J. (ed), Handbook forEconomics, HeinemannEducational Books, London, Reprint Edn.1980
N. Hasan, Teachers' Manual in Economics,Regional College of Education (NCERT),Ajmer, 1970.
Kadambari Sharma & Tripat Tuteja, (ed.)Teaching of Economics, CommonwealthPublisher, New Delhi, 1995
M.S. Bawa (ed), Teaching of Economics:Contemporary Methods and Strategies forsecondary and senior secondary levels,Teachers Handbook, IASE, Dept, ofEducation, University of Delhi,Publication No. 13, Delhi, 1995.
Keith G. Lumsden (ed.), Recent Research inEconomics Education, Prentice hall, NewJersey, 1970.
Mujibul Hasan Siddiqui, Teaching ofEconomics, Ashish Publishing House,New Delhi, 1993.
Nitai Charan Ojha, Concept AttainmentModel and Teaching Economics, GaganDeep Publications, 2004.
Alex M.George and Amman Madan, TeachingSocial Science in Schools: NCERT's NewTextbook Initiative, Sage Publications,2009.
Oliver, J.M. (1973), The Principles of TeachingEconomics, Heinemann Education BooksLtd.
General Economics Books
Kapila, Uma, (2008) Indian Economy SinceIndependence, nineteenth edition2008-09, Academic Foundation, NewDelhi.
Kurien, C.T., (1991) Indian Economy: AReinterpretative Introduction, UniversityPress, Oxford.
Mankiw, N. Gregory, (2002) Principles ofEconomics, Thomson.
Stiglitz, J. (2006), Making Globalisation Work,Penguin books, New Delhi.
Stiglitz, J.E. and C.E. Walsh (2002) Principlesof Economics, 3rd Edition, W.W. Norton
Handbook for Economics Teachers 215

Appendix216
& Company, New York.
Thirlwall, A.P (2003), Growth andDevelopment, 7th ed , PalgraveMacmillan, New York.
Bhaduri, Amit (2005), Development withDignity: A Case for Full Employment,National Book Trust, New Delhi.
Dasgupta, Partha (2007), Economics: A VeryShort Introduction, Oxford UniversityPress, New Delhi.
Galbraith, J.K, (1991), A History ofEconomics, Penguin Books, New Delhi.
Heilbroner Robert, (1999) The WorldlyPhilosophers, The Lives, Times and Ideasof the Great Economic Thinkers,Touchstone, Revised 7th Edition.
II ONLINE RESOURCES
IIa. Web pages
1. Every student and teacher of economicswill find a good reference work invaluable.Fortunately, an excellent reference workis available online.The Concise Encyclopedia of Economics:http://www.econl ib.org/l ibrary/CEE.html
This is probably one of the besteconomics encyclopedias available in themarket, with the full text online. You cansearch the site either alphabetically ortopically (Principles of economics, schools

Handbook for Economics Teachers 217
of economic thought, etc). The section onthe biographies of great economists isworth reading in full. Contributors to thisencyclopedia include several outstandingeconomists including Nobel LaureatesGary Becker and Joseph Stiglitz. You willfind this reference work useful even if youdo not approve of its free-marketorientation.
2. There are good entries on economicstopics in Wikipedia, a free onlineencyclopedia. You can also contribute,either by writing an entry on a subjectnot found in the encyclopedia or byhelping to improve existing entries.http://en.wikipedia.org/wiki/Main_Page
IIB JOURNALS
The best economics journals are available online.That is the good news. The bad news is that you haveto pay for them. However some kind souls take thetrouble of collecting good freely available economicsmaterial and supplying it to us through
1. Pluralist Economics Review.http://pluralisteconomicsreview.net/This monthly compendium of economicspapers can be accessed through the aboveURL and is also delivered free to youremail id on registration.
2. Real-World Economics Reviewhttp://www.paecon.net/PAEReview/Formerly called Post-Autistic EconomicsReview, this on-line journal was theoutcome of a letter of protest againstmainstream economics issued by someeconomics students in France. The

Appendix218
common denominator of the paperspublished appears to be dissatisfactionwith at least some aspects of neoclassicaleconomics but beyond that no particulartheoretical or ideological viewpoint isexcluded. The journal is also deliveredfree by email on registration.
3. e Social Scienceshttp://www.esocialsciences.com/essResearchPapersessResearchPapers.aspEdited by Padma Prakash who wasformally the Deputy editor of EPW, thepapers published in this journal are ofhigh quality.
4. Economic and Political Weekly:The current issue of EPW can be accessedfree online athttp://epw.in/epw/user/userindex.jspTo access the archives you have to be apaid subscriber.
5. If you are keen to sharpen yourpedagogical skills you should regularlyreadThe Journal of Economic Educationhttp://www.indiana.edu/~econed/This journal publishes excellent materialon how economics can be taughteffectively.
An interesting site which publishescomments on papers appearing ineconomics journals is
6. Econ Journal Watchhttp://www.econjournalwatch.org/main/index.php?c=1

Handbook for Economics Teachers 219
IIC ONLINE ECONOMICS BOOKS
There is nothing like reading real books sitting in aroom full of real books. Many book lovers fear that digitalbooks will rob us of this wonderful experience. But wecannot stop progress. And digital books do have someadvantages. They do not occupy shelf space, freeing usof the dilemma of deciding what books to discard whenwe acquire new ones. And hardcopy books cannot haveanimated figures!
While the best economics textbooks are availableonly in hardcopy, there are good digital textbooks.
1. You will find lots of textbooks oneconomics, econometrics, game theoryand statistical techniques in this websiteOnline Economics Textbookshttp://www.oswego.edu/~economic/newbooks.htm
2. The "Economics Web Institute" websitehas textbooks which are unique in thata) they present both the mainstream,neoclassical ideas as well as ideasdeviating from the mainstream theory ;b) they address economic issues withreference to different "geopolitical areas"( Africa, Asia, etc) ; and c) The material ispresented to suit different audiences( Policy makers, managers, teachers,researchers, students and a categorytermed "absolute beginners".) Some of thematerial is interactive and animated. TheURL ishttp://www.economicswebinstitute.org/books.htm
3. An easy to understand Microeconomicstextbook and a Macroeconomics textbookare available athttp://economics.about.com/od/
Appendix220
f r e e e c o n o m i c s t e x t b o o k s /Free_Economics_Textbooks.htm
4. If you think it worth spending time andeffort reading the great economicsclassics like Adam Smith's Wealth ofNations or Marx's Capital … that is, if youare a nerd … there are two websites foryouLibrary of Economics and Libertyhttp://www.econl ib.org/l ibrary/classics.html
and
The Online Books Page, Economicssectionhttp://onlinebooks.library.upenn.edu/webbin/book/browse?type=lcsubc&key=Economics
5. David Newlands (ed), The Handbook forEconomics Lecturers. This book isavailable freely through online in thewebsite:http://www.economics.lstn.ac.uk
IID ONLINE RESOURCES ON INDIAN ECONOMYGone are the days when students had to spend half
their lives traveling to research institutes for obtainingsecondary data. Now all the information you need onthe Indian economy is just a mouse click away.
National Sample Survey Reportsh t t p : / / w w w . m o s p i . g o v . i n /
mospi_nsso_rept_pubn.htmCensushttp://www.censusindia.gov.in/RBI Database on Indian Economyh t t p : / / w w w . r b i . o r g . i n / s c r i p t s /
Statistics.aspx

Handbook for Economics Teachers 221
Ministry of Finance Publicationshttp://finmin.nic. in/WorkingPaper/
index.htmlThis site has full texts of many important
reports, such as the Kelkar report andthe Raghuram Rajan report.
Union Planning Commission Homepagehttp://planningcommission.nic.in/Has all the publications of the Union Planning
Commission, including the full text ofthe Five-Year Plans.
National Family Health Surveyhttp://www.nfhsindia.org/"The survey provides state and national
information for India on fertility, infantand child mortality, the practice of familyplanning, maternal and child health,reproductive health, nutrition, anaemia,utilization and quality of health andfamily planning services."
Central Statistical Organization (CSO)http://mospi.nic.in/cso_test1.htmHas data on National Income Accounting,
Index of Industrial Production ,Wholesale and Consumer Price Indices forUrban Non-Manual Employees, HumanDevelopment Statistics , GenderStatistics, Environment and Energystatistics.
National Institute for Public Finance andPolicy (NIPFP)
http://www.nipfp.org.in/workingpaper.aspAn independent institution under the
ministry of finance, the NIPFP is one ofthe preeminent economics researchinstitutes in India publishing world-class

Appendix222
material related to public finance.
National Council of Applied EconomicResearch (NCAER)
http://www.ncaer.org/activities.htmlNCAER "has done pioneering research work
in areas of applied economics with anemphasis on policy analysis andapplication of modern quantitativetechniques to development issues,regional development and planning,household income, consumption, savings/investment and energy." The full text ofthe working papers published by NCAERare available on this site.
Macroscanwww.macroscan.com
A column in Business Line daily, one ofthe best sources of education on theIndian Economy from a left perspective.
IIE WEBSITES OF INTERNATIONALORGANIZATIONS
World Bank (International Bank for Reconstructionand Development), World Development Reports
http://econ.worldbank.org/WBSITE/EXTERNAL/EXTDEC/EXTRESEARCH/EXTWDRS0,,contentMDK:20227703~pagePK:478093~piPK:477627~theSitePK:477624,00.htmlThis has the full text of the World Development
Reports published annually by the World Bank.Untied Nations Development Programme,

Handbook for Economics Teachers 223
Human Development Reportshttp://hdr.undp.org/en/reports/The full texts of the Human Development
Reports, published annually by theUNDP.
World Health Organisationhttp://www.who.int/publications/en/The site has the full text of World Health
Reports and health Statistics.
United Nations Environment Programmehttp://www.unep.org/publications/
OTHER GENERAL WEBSITESIf you are looking for websites not confined to any
particular topic but covering a wide range of economicissues the following websites are for you.
Voxhttp://www.voxeu.org/
This site is mostly focused on the E.U but there isplenty of material here of immense use to economicsstudents and teachers in India. For this website hat tipto I should acknowledge S.Subramanian, professorMIDS.
Economics Essaysht tp ://www.economicshe lp .org/econ.html
This site is meant for Economics students in Britainbut quite a few of the "essays" are useful for our studentsalso.
National Bureau of Economic Research(NBER)
NBER is "a private, nonprofit, nonpartisanresearch organization dedicated topromoting a greater understanding of howthe economy works. The NBER is

Appendix224
committed to undertaking anddisseminating unbiased economicresearch among public policymakers,business professionals, and the academiccommunity." Although focused mostly onthe U.S economy, economists in India willalso find wealth of information in theNBER working papers. The latest workingpapers will be sent to you by email onregistration.
The working papers published by NBER canbe accessed at
http://www.nber.org/papers/
The NBER Digest presents a summary ofsome of the working papers in a"digested" form.
http://www.nber.org/digest/The full text of some NBER books can be
accessed through the NBER homepage.
Third World Networkwww.networkideas.org"Its mission is to bring about a greater
articulation of the needs and rights ofpeoples in the Third World, a fairdistribution of world resources, andforms of development which areecologically sustainable and fulfill humanneeds."
International Development EconomicsAssociates (IDEAs)
www.twnside.org.sg"IDEAs has been established with the
purpose of building a pluralist networkof heterodox economists engaged in theteaching, research and application ofcritical analyses of economicdevelopment."

Handbook for Economics Teachers 225
( For the above two web sites hat tip toDr.Venkatesh Athreya, ofM.S.Swaminathan Research Foundation.)
IIF ECONOMICS BLOGSIf you want to be up to speed about the great
conversation called economics, and also contribute toit, you should read ECONOMICS BLOGS, such as thoselisted below.
An Awkward Corner http://blogs.livemint.com/blogs/an_awkward_corner/archive/tags/Mint/default.aspx
One of the best economics blogs, it has in-depthdiscussions mostly on the Indian economy by NiranjanRajadhyaksha. an economist who is at home both withadvanced theory and empirical literature, and has thegift of articulating complex economics concepts insimple English.
The Indian Economy Bloghttp://indianeconomy.org/
Marginal Revolutionhttp://www.marginalrevolution.com/ This blog is written by Tyler Cowen and Alex
Tabarrok, economists at the GeorgeMason University in the U.S. It advocatesthe free market viewpoint.
Dani Rodrik's Webloghttp://rodrik.typepad.com/ Rodrik is a professor at Harvard. The blog
claims to present "Unconventionalthoughts on economic development andglobalization". Unconventional because itis skeptical about the argumentsfavouring globalization and privatization.
Greg Mankiw's Bloghttp://gregmankiw.blogspot.com/
Appendix226
Mankiw is a distinguished macroeconomistteaching at Harvard. This blog is closelyfollowed by other blog writers.
Undercover Economisthttp://blogs.ft.com/undercover/Written by Tim Harford, a British economist,
the blog explains how economicreasoning can be used to understandsociety. Harford compiled some of thismaterial in a book also entitledUndercover Economist.
Brad Delong's Bloghttp://www. j -bradford-de long.net/
movable_type/Delong is an economics professor at the
University of California at Berkely. Theblog deals with a wide variety ofeconomics issues from a Keynesianviewpoint.
Becker-Posner Bloghttp://www.becker -posner -blog.com/
index.htmlWritten by the economist Gary Becker and
Richard Posner, a judge as well as afaculty member at the university ofChicago Law School and one of thefounders of Law and Economicsdiscourse.
Paul Krugman, the 2008 Economics Nobelwinner , has an official and an unofficialweb page. The official one is
http://web.mit.edu/krugman/www/
Handbook for Economics Teachers 227
11G STATISTICAL TECHNIQUESRESOURCES
You have the data. But contrary to popular belief,the data do not "speak for themselves"; we have to makethem speak through interpretation. There are websiteswhich provide tools to enable you to make sense of thedata. Here are some of the websites:
http://statpages.org/
http://isi.cbs.nl/FreeTools.htm
http://www.uni-koblenz.de/~kgt/SICSS/StatIM/main.pdf
But these tools cannot do the thinking foryou. For that there is no substitute tousing your gray cells.
IIh ECONOMICS HUMOR
If you want to relax, there is a websitedevoted to economics jokes
http://netec.mcc.ac.uk/JokEc.html
My favorite economics jokes are:
Why did Marx abandon teaching? Becausehe found every class a struggle!
How many monetarists does it take to changea light bulb? None. The free market willdo it automatically.
Economics Twitter
Most of you will have heard of Twitter and many ofyou are probably already using the micro-bloggingservice. Twitter is a great way to keep up-to-date with

Appendix228
breaking Economics stories, and to enagage directlywith Economics teachers, journalists, broadcasters andothers who like to share their enthusiasm for thesubject.
Listed below are some suggested "follows" forEconomics on Twitter. If you are using Twitter thenplease share a connection with us on the site, perhapsby following Geoff and I (we'll follow you too) or by joiningthe Economics Teacher Twibe:
h t t p : / / w w w . t w i b e s . c o m / g r o u p /economicsteacher
Economists on Twitter:Geoff Riley (tutor2u) http://twitter.com/
tutor2u_econJim Riley (tutor2u) http://twitter.com/
tutor2uTim Harford: http://twitter.com/TimHarfordPaul Krugman: http://twitter.com/
NYtimesKrugmanEdmund Conway (Telegraph): http://
twitter.com/EdmundoPhilip Thornton (Clarity Economics) http://
twitter.com/ClarityeconomicThe Economist: http://twitter.com/
theeconomistTyler Cowen (Marginal Revolution) http://
twitter.com/tylercowenFreakonomics http://twitter.com/
freakonomics

229
REFLECT YOURSELF
What do you think about this Handbook? We would appreciate if you reflect on the handbook and fill in this feedback form. Your feedback will be helpful to revise this handbook, to understand your academic needs and to establish a network of you and other economics teaching fraternity working to improve the quality of teaching economics in schools. Please tick (√) mark the relevant box in case of rating scale questions and type your comments and suggestions in the given space (attach a separate sheet, if required). Kindly send us this filled in form as an attached file to our email id: [email protected]). Thank you for your cooperation in this initiative. 1. The purpose of the handbook is to introduce you (a) an understanding of syllabi
taught in Indian schools following various state and central examination boards and (b) to provide a variety of teaching practices you can make use of in economics class. Do you think these objectives are achieved in this handbook?
___________________________________________________________________ ___________________________________________________________________ ___________________________________________________________________ ___________________________________________________________________ 2. In your view, how does the handbook adequately reflect the concerns and
perspectives of National Curriculum Framework 2005? (You can view and download the PDF version of NCF 2005 in NCERT website: www.ncert.nic.in )
___________________________________________________________________ ___________________________________________________________________ ___________________________________________________________________ ___________________________________________________________________ 3. How does the handbook adequately reflect the concerns and perspectives of
National Curriculum Framework for Teacher Education 2009? (You can view and download the PDF version of NCF 2005 in NCTE website: www.ncte-india.org )
___________________________________________________________________ ___________________________________________________________________ ___________________________________________________________________ ___________________________________________________________________

230
4. Each chapter of the handbook has been developed to provide an holistic view of
teaching Economics in schools. Kindly rate each chapter in terms of its objective aim, presentation and coverage of issues.
Sl. No.
Chapter Not Satisfactory
Below Average
Average
Good Excellent
a) Learning Economics: Some Basic Questions
b) Economics Education in Indian Schools: Review of Syllabi
c) Planning for effective Economics Teaching
d) Teaching a topic in Indian Economy Using Unit Plan Approach
e) Lectures, Discussions and Story Telling
f) Teaching Economics through Problems
g) Simulation Games and Teaching Economics
h) Using Media and Technology in Economics Classrooms
i) Importance of Mathematics in Teaching Economics
j) Basic Mathematical Tools in Economic Analysis
k) Use of Algebraic Equations and Graphs
l) Concept Mapping and Flow Charts in Economics
m) Assessment and Framing Quality Questions in Economics
n) Additional Resources and Reference Materials for Teachers

231
5. How do the chapters in the handbook help you to make informed decisions in organising your economics classes?
Sl. No.
Chapter Not relevant
Relevant but not helpful for me
Partly helpful
Quite helpful
Very helpful
a) Learning Economics: Some Basic Questions
b)
Economics Education in Indian Schools: Review of Syllabi
c) Planning for effective Economics Teaching
d) Teaching a topic in Indian Economy Using Unit Plan Approach
e) Lectures, Discussions and Story Telling
f) Teaching Economics through Problems
g) Simulation Games and Teaching Economics
h) Using Media and Technology in Economics Classrooms
i) Importance of Mathematics in Teaching Economics
j) Basic Mathematical Tools in Economic Analysis
k) Use of Algebraic Equations and Graphs
l) Concept Mapping and Flow Charts in Economics
m) Assessment and Framing Quality Questions in Economics
n) Additional Resources and Reference Materials for Teachers
6. Rate the following aspects
Not Satisfactory
Below Average Average Good Excellent
Format of the handbook
presentation Overall impression
232
7. Would you recommend this handbook to other economics teachers? Yes / No 8. What are the best features of this handbook? ___________________________________________________________________ ___________________________________________________________________ ___________________________________________________________________ ___________________________________________________________________ 9. Is there a particular chapter in this handbook that impressed you most? Why? (State in terms of presentation, language, understanding, etc.) ___________________________________________________________________ ___________________________________________________________________ ___________________________________________________________________ ___________________________________________________________________ 10. Which part of the handbook you do not like and believe should be revised in the next edition? ___________________________________________________________________ ___________________________________________________________________ ___________________________________________________________________ ___________________________________________________________________ 11. What constructive criticism you would like to offer to the publisher of this handbook? ___________________________________________________________________ ___________________________________________________________________ ___________________________________________________________________ ___________________________________________________________________

233
12. Which format of the Handbook do you prefer to use?
o Standard printed version ( ) o Electronic version ( ) o Braille ( ) o Audio version ( )
13. Details about you and your institution
a) Name b) Qualification c) Designation d) Teaching Experience (years) e) Institution / Contact Address (with pin code, email, telephone / mobile))