Embed Size (px)
Citation preview

State University Funding Formula Development
Board of Higher Education Meeting | June 16, 2015
Sean P. Nelson, Deputy Commissioner for Administration and Finance

The National Context: A wave of outcomes-based funding
WA
OR
CA
AK
NV
MT
CO
OK
WI
NE
HI
ID
WY
AZ
KS
ND
IA
AR
UT
NM
TX
MN
MO
LA
SD
MS
KY
IL
MI
NY
GA
SC
VA
MD
AL
TN
IN OH
PA
FL
NC
WV DE
NJ
ME
VT NH
MA
RI
CT
Implementing
Implementing in one Sector
Under Development
Active Interest
3
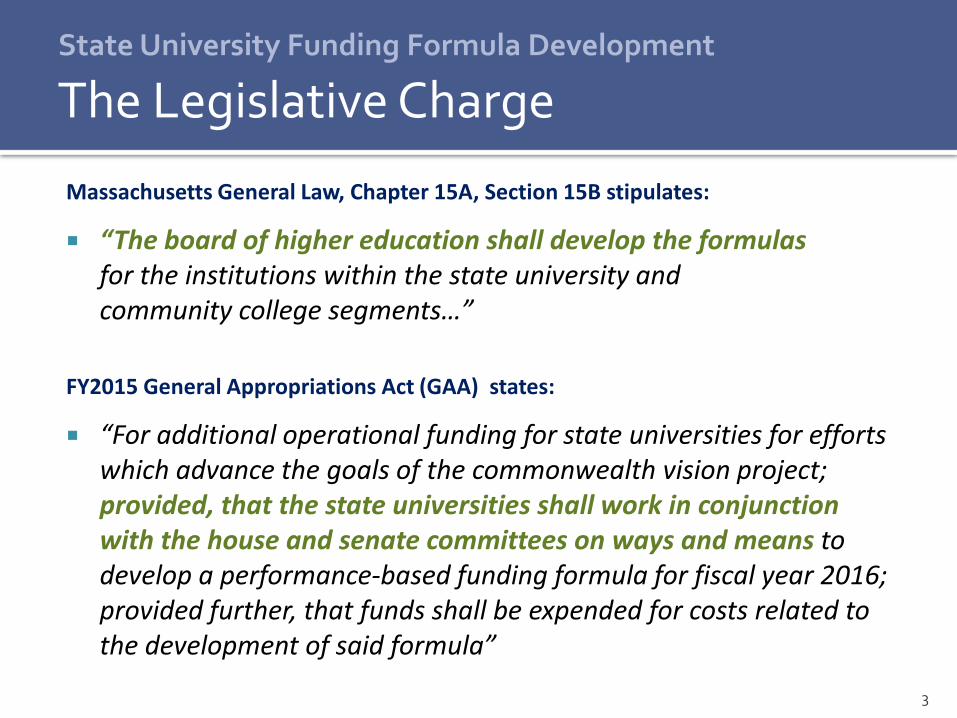
Massachusetts General Law, Chapter 15A, Section 15B stipulates:
“The board of higher education shall develop the formulas for the institutions within the state university and community college segments…”
FY2015 General Appropriations Act (GAA) states:
“For additional operational funding for state universities for efforts which advance the goals of the commonwealth vision project; provided, that the state universities shall work in conjunction with the house and senate committees on ways and means to develop a performance-based funding formula for fiscal year 2016; provided further, that funds shall be expended for costs related to the development of said formula”
State University Funding Formula Development
The Legislative Charge

4
RFP: Following passage of FY15 budget, DHE issued an RFP for consultant to aid in the development of funding formula, in collaboration with state university stakeholders
Working Group: DHE convened working group with representatives from all nine state universities, legislative committees on ways and means, Executive Office of Administration and Finance (A&F), and DHE
Planning Sessions: Funding formula working group held three planning sessions between February and May of 2015 to deliberate and agree upon the various metrics for inclusion
Webinar: A webinar to communicate primary tenets and outcomes of the formula to broader stakeholder group is scheduled for Friday, June 19 at 11am
State University Funding Formula Development
The Planning Process

5
College Participation Raising the percentage of high school graduates going to college—and the readiness of these
students for college-level work
College Completion Increasing the percentage of students who complete degree & certificate programs
Student Learning Achieving higher levels of student learning through better assessment and more extensive use
of assessment results
Workforce Alignment Aligning occupationally oriented degree and certificate programs with the needs of statewide,
regional & local employers
Preparing Citizens Providing students with the knowledge, skills & dispositions to be engaged, informed citizens
Closing Achievement Gaps Closing achievement gaps among students from different ethnic, racial, gender and income
groups in all areas of educational progress
State University Funding Formula Development
The System-level Outcomes

6
Funding formula working group recommended a set of metrics and sub-metrics to be used in assessing outcomes for the state universities.
College Participation ▪ Closing the underrepresented minority (URM) gap
▪ Students retained with 30 credit hours (SCH)
▪ Students retained with 60 credit hours
College Completion ▪ Graduation rate improvement
▪ Degrees per 100 undergraduate full-time equivalent (FTE) students
▪ Degrees per 100 graduate full-time equivalent (FTE) students
▪ Year-over-year increases in the total number of degrees
Workforce Alignment ▪ Increases in the numbers of priority-defined degrees
Degree Productivity ▪ Degrees per $100,000 of total revenue
State University Funding Formula Development
The Metrics

7
The five metrics are weighted:
College Participation 20%
College Completion 30%
Workforce Alignment 17.5%
Degree Productivity 17.5%
Special Mission Institutions 15% For example: If the available funding allocated totals $10 million, performance on
“College Completion” would net a total $3 million in available funding.
State University Funding Formula Development
The Methodology

8
Current outcomes-based formula acknowledges that not all metrics align well with missions of MassArt, Mass Maritime, and MCLA All three campuses still measured in College Participation
and College Completion metrics Formula exempts special-mission institutions from
Workforce Alignment and Degree Productivity and instead assigns a “carve-out” of 5% of the total funding allocated (≈$278K for each institution)
State University Funding Formula Development
The Special-Mission Institutions

9
State University Funding Formula Development
The Funding Outcomes Massachusetts Department of Higher Education: State University Funding Model
Funding Allocations to State Universities
Funding Outcomes: FY 2016 14-15 Appropriations
$ -
Estimated 15-16 Appropriations
$ -
Funding for Outcome Based Formula
$5,560,108
Allocation Split New Money to Performance
Only?
Total from Total from Total from Total from Special Mission Total
Proportion to Base Funding College
Participation College
Completion Workforce Alignment Productivity Subsidy Allocation
Proportion to Outcome Funding
Yes Bridgewater State University $ 215,836 $ 157,902 $ 231,446 $ 150,432 $ - $ 755,616
Cost of Operations Subsidy (type "Yes" or
"No")
Outcome Based Metrics and Weights Fitchburg State University $ 158,785 $ 104,047 $ - $ 150,432 $ - $ 413,264
College Participation 20%
Closing the URM Enrollment Gap 33% Framingham State University $ 139,480 $ 235,308 $ 361,340 $ 181,420 $ - $ 917,547
Number of Students who Cross 30 SCH Threshold 33%
Number of Students who Cross 60 SCH Threshold 33% Massachusetts College of Art $ 57,012 $ 206,016 $ - $ - $ 278,005 $ 541,034
Participation Group Total 100%
College Completion 30% Massachusetts College of Liberal Arts $ 82,405 $ 218,050 $ - $ - $ 278,005 $ 578,460
Five-Year Graduation Rate Improvement 25%
Undergraduate Degrees per 100 FTE 25% Massachusetts Maritime Academy $ 26,046 $ 181,214 $ - $ - $ 278,005 $ 485,266
Graduate Degrees per 100 FTE 25%
Year-over-Year Increases in Total Degrees Produced 25% Salem State University $ 164,698 $ 116,825 $ - $ 184,939 $ - $ 466,462
Completion Group Total 100%
Workforce Alignment 25% Westfield State University $ 116,128 $ 167,650 $ 101,553 $ 153,545 $ - $ 538,875
Year-over-Year Increases in Priority Degrees Produced 100%
Workforce Group Total 100% Worcester State University $ 151,631 $ 281,021 $ 278,680 $ 161,881 $ - $ 873,213
Productivity 25%
Degrees per $100,000 of Revenue 100% Total - State Universities
$ 1,112,022 $ 1,668,032 $ 973,019 $ 973,019 $ 834,016 $ 5,560,108 Productivity Group Total 100%
At-Risk Student Bonus 1.0

10
A dashboard tool will allow for a user-friendly and dynamic visualization of changes in basic data and weights—will be demonstrated during webinar
State University Funding Formula Development
The Dashboard Tool

11
Funding allocations based on the metrics and weights as detailed will be sent to the campuses after July 1st (FY16)
Additional review and further refinement of the funding formula will be necessary going forward, including: Review per-student funding levels amongst campuses Explore a finer metric on “Workforce Alignment” Incorporate metrics for “Student Learning” and “Civic Engagement”
Involvement of state universities, legislature, FAAP committee, and BHE on developing a successor iteration
State University Funding Formula Development
Next Steps

Questions/Comments