Embed Size (px)
Citation preview

Title Page
SCIENCE ACHIEVEMENT OF GRADE IV PUPILS IN STA.
IGNACIA NORTH CENTRAL ELEMENTARY SCHOOL
AS INFLUENCED BY SELECTED VARIABLES
A Research Proposal Presented to
Dr. Lucena G. Garcia,
course instructor
In Partial Fulfillment of the Requirements in
Educational Research (EDUC07) during the
Second Semester 2010-2011
By:
Mariella Alexes Rombaoa
Myrell Joyce Esteban
Judith Repato
Carolyn Grande
Mechille Lacuesta
Jhonalyn Peralta
Loreto Morales
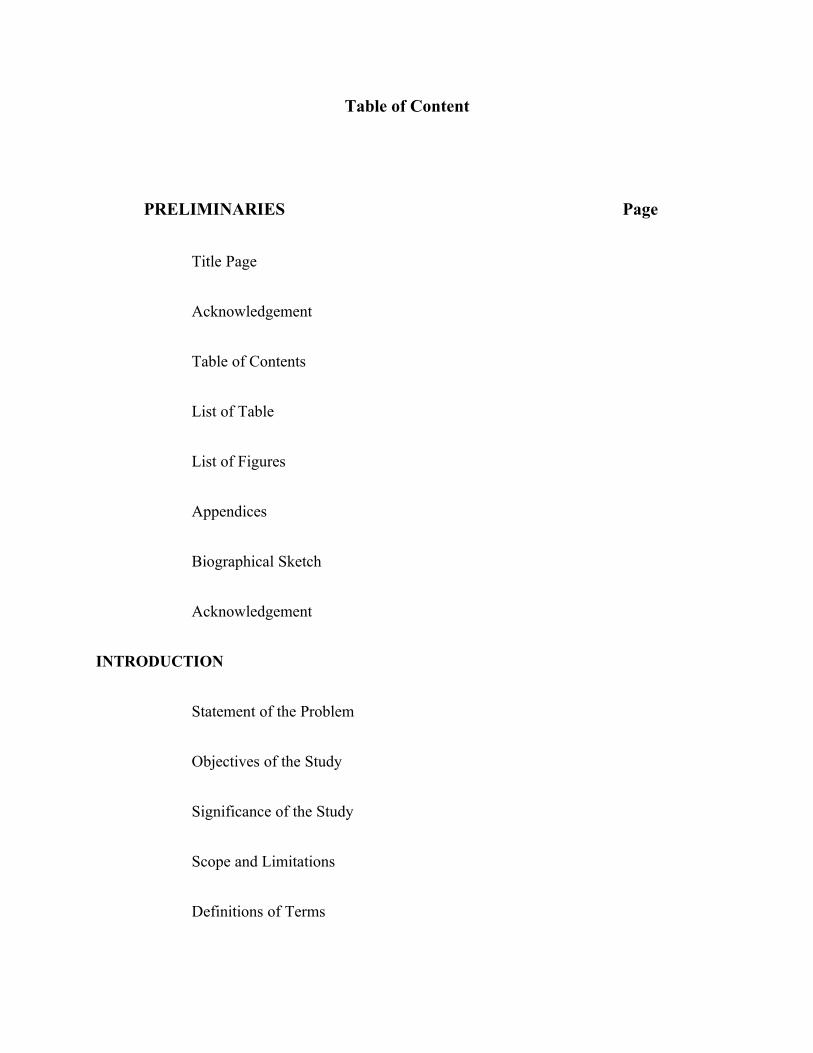
Table of Content
PRELIMINARIES Page
Title Page
Acknowledgement
Table of Contents
List of Table
List of Figures
Appendices
Biographical Sketch
Acknowledgement
INTRODUCTION
Statement of the Problem
Objectives of the Study
Significance of the Study
Scope and Limitations
Definitions of Terms

REVIEW OF RELATED LITERATURE
Related Literature
Related Studies
METHODS AND PROCEDURE
Research design
Respondents of the Study
Locale of the Study
Data Gathering Instrument
Data Gathering Procedure
Data Analysis Scheme
RESULTS AND DISCUSSION
1.1 Teacher’s Attributes
a. Highest degree completed
b. Major field of concentration
c. Number of years teaching Science
a. In service training and seminars in Science attended for the last three years
1.2 School Attributes

a. .Class size
1.3 Pupils Attributes
a.Family income level
b. Adequacy of reading materials at home
c.Home Television Viewing
c.1. TV Programs viewed
c.2. Length of Time spent in viewing
a. week days
b. week ends
c.3. Frequency of TV viewing
1.4 Science Achievement of Grade-IV pupils
1.5 Influence of Selected Variables to the Science Achievement of Grade IV
Pupils in Santa Ignacia North Central Elementary School
SUMMARY, CONCLUSION AND RECOMMENDATION
Summary of the findings
Conclusions
Recommendations

LITERATURE CITED
APENDICES
Appendix Page
A Permit to conduct the Study
B Questionnaire

LIST OF TABLE
Table Page
1 Sampling Frame

LIST OF FIGURES
Figure Page
Figure 1.1.a. Distribution of Teachers in Terms
of Highest Education Qualification
Figure 1.1.b. Distribution of Teachers in terms of their
Major Field of Concentration or Concentration
Figure 1.1.c. Distribution of Teachers in terms of Number
of years teaching Science
Figure 1.3.b. Distribution of Pupils in Terms of facilities and
Reading Material at Home
Figure 1.3.c.1. Distribution of Pupils in Terms of
Home Television Viewing
Figure 1.3.c.2. Distribution of Pupils in Terms

of Length of Viewing
Figure 1.3.c.3. Distribution of Pupils in Terms of TV
Program Viewed
Figure 2 Description of Level of Grade IV Pupils in terms
of their Science Achievement
Table 3a. Influence of Teachers’ Attributes on the Science
Achievements of Grade IV Pupils

APPENDICES
Appendix Page
A Permit to conduct the Study
B Questionnaire

ACKNOWLEDGEMENT
The researchers would like to give their sincerest appreciation to the following persons who
unselfishly provided their assistance and their knowledge and expertise for the completion of this research
proposal:
To Almighty God, our creator and provider.
Dr. Noel Petero, dean of Institute of Education, for allowing us to conduct our research.
Dr. Lucena G. Garcia, course instructor, for her valuable suggestions and scholarly wit and for
making the researchers feel that they can really count on her.
Dr. Arnold E. Velasco and the BSE III major in mathematics, for their expertise in the statistical
analysis of the data and for their patience in elucidating to the researchers the meaning of statistical
computations regarding the data.
The Principal and Grade IV Teachers of Santa Ignacia North Central Elementary School, for
giving us the permission to conduct our research proposal.
To all Grade IV pupils of Santa Ignacia North Central Elementary School for their cooperation
and participation to carry out this research proposal.

To their parents, words are not enough to express how thankful they are for everything that they
have done especially for financial matters, in regards to this research proposal.
Biographical Sketch
It was on the 18th day of August 1990 when a baby boy was born at Pao, San Jose, Tarlac,
That baby was I, Loreto C. Morales. He is the eldest among seven children of loving parents Mr.
Eduardo B. Morales, a hardworking father and Mrs. Melisa M. Capitli, a housewife. He lived in
Sitio San Juan, Moriones, San Jose, Tarlac but presently reside at San Vicente, San Juan de
Mata, Tarlac City with his Aunt Betty, Uncle Joshua and their three kids.
He graduated at Bularit Elementary School with honors in the year 2002 and
consequently finished his secondary education at Villa Aglipay High School in 2008. He is now
in 3rd year here at Tarlac College of Agriculture taking up Bachelor of Elementary Education.
He believes that “ Those who are faithful with little things will receive great things”. He
hopes to finish his studies next year through the help of Almighty God and become successful in
his chosen career.

Biographical Sketch
The researcher was born on March 1, 1991 in Teodoro Memorial Hospital (formerly
known as Malacampa District Hospital), in Malacampa, Camiling Tarlac. She is the only
daughter of Eduardo Rombaoa of Cabaruan Santa Ignacia, Tarlac and the former Maria Manzano
of San Clemente, Tarlac.
She completed her grade school at Taguiporo-Cabaruan Elementary School where she
was a consistent honor pupil and graduated as second honors in 2003. She pursued her high
school life at Santa Ignacia High School and graduated as valedictorian in 2007. She enrolled at
University of Luzon, with a course of Bachelor of Science in Nursing and was once become a
dean’s lister. After that she shifted in Bachelor of Elementary Education, and presently a third
year student.
Her greatest goal is to finish her studies and to become a successful teacher, because she
believes that teaching is the noblest profession.
With the guiding principle, “To be good is not good enough when your dream of
being great”. She is now seeing hope for a brighter tomorrow. With the strong self-
determination, faith to the Father Almighty and perseverance this will help a lot to bring
someone into the highest pedestal of her dreams and ambitions in life.
Judith Repato
The researcher was born on January 23, 1991 in Barangay Quetegan, Mangatarem
Pangasinan. She is the youngest child of Mr. Abraham Repato and Mrs. Natividad Bueno.
She pursue her elementary education at Bunlalacao Elementary School and took her
secondary education in Quetegan National High School. Because she wanted to become a
professional teacher, she took up Bachelor of Elementary Education in Tarlac College of
Agriculture and now a third year student. At first she found it hard to cope because of new
environment and the course she has chosen. But because of the support and advice of her family
and friends, she now found herself enjoyintg and having fun in this course.
She is a loving daughter, caring friend and strong person to face the challenges in her life.
She strongly believes that in every trial in life God is always there in our side and our hearts. For
all the problems, pains and sacrifices, laughter is the best medicine, she also believes that “An
educated man is not weighed by the many books she read but she applies her knowledge and
how we mingle with people”.

Biographical Sketch
On the 2nd day of March, 1992 at Vargas Santa Ignacia, Tarlac, ‘Myrell’ as her family
and friends usually call her was born. She is patient, helpful and works diligently to be
successful.
Myrell, to friends and relatives is simple, approachable and caring who enjoys reading
interesting and inspirational books, reminiscing the treasured moments and connecting pieces of
dreams.
As to her educational background, she took up her elementary grades at Vargas
Elementary School where she was a consistent honor pupil. She finished her secondary education
at Vargas High School and graduated as salutatorian in 2008.
She enrolled at Tarlac College of Agriculture and took up an education as her chosen
career. She chose this vocation because she wanted to become a good teacher someday. Her
motto in life is “Duty first before pleasure”. She believes that teaching is like an adventure where

you can find many things each day and you can use it to have a unique approach towards the
pupils and to have a smooth teaching-learning process.
“There is no elevator to success only stairway”, is the quotation which challenged her to
passes the obstacles she encountered in fulfilling her goals in life.
Biographical Sketch
A filling of joy and happiness was seen on the face of Mr. Rolando Grande and Mrs.
Wilda Grande, when the first cry of their first baby was heard on December 22, 1991. She was
named ‘Carolyn’.
‘Carol’ as she call her friends. Her parents molded her to become a responsible, God-
loving, and understanding lady. She spends her elementary grades at Matubog Nagserialan
Elementary School. She took up her secondary education at Camiling School Home Industries.
Through the help parents of her parents, loving God and friends.
After her graduation in high school, she took entrance examination at Tarlac College of
Agriculture. Luckily she passed the exam. She took up a degree of Bachelor of Elementary
Education and presently a third year student.
Her family served as her inspiration in pursuing her dream- to become a quality and
effective teacher.

Biographical Sketch
The researcher was born on June 15, 1991 in Pob. Bataraza, Palawan. She is the 4th
children of Mr. Alfonso Lacuesta Jr. and former Nelia Encomienda. The family presently resides
at Macarang,Mangatarem Pangasinan.
She finished her primary education in Macarang Elementary School and
graduated as Salutatorian in the year of 2004. She finished also her secondary education in
Macarang National High School and graduated as honor student in the year of 2008.Because of
her determination, she believes that “It’s better to face the hardship of Education than to face the
hardships of Ignorance” so she enrolled at Tarlac College of Agriculture and took up Bachelor of
Elementary Education.
She learned many things and her values and her attitudes were improved in such
a way she became more matured and sociable than ever.

Biographical Sketch
The researcher was born on the 13 th day of October 1990. She is the eldest among the
four children of Mr. Noli Peralta Sr. and Mrs. Jocelyn Peralta. She is presently residing at Brgy.
Balloc, San Clemente, Tarlac.
She started schooling at the age of five at Casipo Day Care Center, and she pursued
her elementary education at Balloc Elementary School and graduated in the year 2003 with
honors. Upon completion of her elementary education, she enrolled her secondary education at
Bamban High School wherein she graduated in year 2003. After graduation she wants to take up
a Business Administration course but due to financial problem that her parents cannot send her to
college, she decided to stopped schooling for one year.
Because of her self-determination to finished her study she pursued her tertiary
education at Tarlac College of Agriculture. She took up the entrance examination and luckily
passed it. At present she enrolled as third year student taking up Bachelor of Elementary
Education.
She hopes to see her dreams come true, through patience and sacrifices in studying with
God’s blessing.
INTRODUCTION
Science is one of the avenues and the greatest vehicle to a nation’s progress. Its
fundamental objective is to promote the enrichment of life and the recognition of the
dignity of the human person which emphasizes that the aspect of human living is directly
influenced by science. Education enables man to go far and wide in all dimensions of
knowledge which give him a better life. Education pushes man to attain spectacular
progress in all his endeavors and brought him to frontiers never opened before it made
him learn how to live more conveniently and fruitfully.
Education for its greatest contribution made man live today in a scientific and
technological age and it is expected that in the years to come he will be surrounded more
by scientific and technological environment.
Elementary education aims to develop a whole child to enable him to acquire the
basic preparation that will make him an enlightened, disciplined, nationalistic, self-
reliant, God-loving, creative citizens in the national community. Science together with
health aims to help the Filipino child gain functional understanding of science skills as

well as scientific attitudes and values needed in solving everyday problems pertaining
health and sanitation, nutrition, food production and environment and its conservation.
Science and Health therefore, must be taught in the elementary grade mainly not
because of the importance of knowing and mastering science information per use, but
because it is most effective and appropriate vehicle for building up to the competencies
that efficient citizens must possess.
With the vital role of science behind scientific and technological advances, the
general idea and theories that hold the knowledge have to be changed. Innovative
strategies, approaches and method have to be applied to make the enriched science
education more functional: one that imbues pupils with not just knowledge and process
skills but the right attitude and motivation to voluntarily enhance their capabilities to
tackle tasks contributory to national development.
The Department of Science and Technology Education Institute, in its report found
out that the Filipino youth in whose hands lies the country’s future in the arena of global
competitiveness have been performing very low in science and mathematics subject.
Bartolome (1996) cited the following evidences. Juan Quezada Jr. (Education
Forum Tap, January 1988), mentioned the very low science literacy of Filipinos and the
failure of the Philippines to develop a technical manpower base, and a critical mass of
scientists, engineers, craftsman and managers.

Gonzales (1999) in his Keynotes speech said a long standing problem has been
poor achievement in NSAT and NEAT Examinations which has many causes. Among
these are lack of pre-service preparation of many of the subject teachers in high school
specifically in science and mathematics and also economics. Another is the shortage of
22,000 classrooms (1998) 15,000 teachers and textbooks wherein the ratio for primary
schools was six students to one book in the secondary schools eight students to one book
Licuanan (1998) said we did not yet develop a scientific culture in the Philippines
partly because of the following reasons:
a. The Filipino child growing up in our socio-cultural environment does not get
enough opportunity to work with his hands.
b. Scarcity of resources in a poor country most people watch as other
demonstrates. In typical schools where equipment is scarce or non-existent it is
not possible for students to do actual experimentations. There is also a practice
in our society to keep things that we value, locked up or on display rather than
allowing them to be part of our daily lives like machines, household items
even people.
Rosas (2000) said that one of the bad news in our education is the declining trend
in the student achievement both elementary and secondary levels over the last half
century and the bottom rank performance of the elementary pupils in science and
mathematics.
Colinares (1999) mentioned that the result of ASEAN competitive examination in
science fall below national expectations.
Campos, (Education Forum, Tap, January 1988) says that the Philippines is at the
bottom rank not only in science and technology but also in medical research and
development.
To strengthen the science education and achievement in our country is to improve
the science equipment, facilities and other instructional materials of our school. In
addition, science is more effective if the teachers have the necessary preparations,
trainings and qualifications. They are more effective if they are equipped with
instructional materials facilities and equipments. Science teachers play an important role
in increasing disparity of science and education and the real needs of the country. A true
educator is one who endeavors to find ways and means of continually improving the
learning situation with which he is connected. He is a keen observer who evaluates the
many trends in education and chooses for his purpose what is believed to best achieve the
goal of science in the curriculum. The teacher must bear in mind that there is no single
method which is superior to the rest. Factors such as availability of instructional
materials, the abilities, interest and stimulates them to actively participate in their daily
guest for science information.
Students then, need to be prepared to cope with the world of change, for progress
and to meet the problems they will face during their lifetime. These can be done by

providing them skills and intellectual attitude essential to understand and cope with the
ever changing world.
However, the problem of low performance in science by the pupils/students still
exists up to the present. Although, there were many factors that have been mentioned by
many researchers there are still some other factors. Hence, this study.
Statement of the Problem
This study aims to assess the science achievement of Grade-IV pupils in Sta.
Ignacia North Central Elementary School in Sta. Ignacia, Tarlac as Influenced by
Selected Variables.
More specifically, this study attempts to answer the following questions:
1. How may the Science Achievement in Sta. Ignacia North Central Elementary
School be described in terms of:
1.1.Teacher’s Attributes
b. Highest degree completed
c. Major field of concentration
d. Number of years teaching Science
e. In service training and seminars in Science attended for the last three years

1.2.School Attributes
b. Class size
c. Number of Science teacher per school
d. Regularity of school visitation
e. Adequacy of Science room and learning resource centre
f. Adequacy of facilities and other instructional projects
1.3.Pupils Attributes
a. Family income
b. Adequacy of reading materials at home
c. Home Television Viewing
c.1. TV Programs viewed
c.2. Length of Time spent in viewing
a. week days
b. week ends
c.3. Frequency of TV viewing

2. How may the Science Achievement of Grade-IV pupils be described?
3. To what extent do the selected variables influence the Science Achievement of
Grade-IV pupils?
Objectives of the Study
This study will be conducted with the following objectives:
1. To describe the Science achievement of Grade-IV pupils in Sta. Ignacia North
Central Elementary School in terms of the following:
1.4 Teacher’s Attributes
a. Highest degree completed
b. Major field of concentration
c. Number of years teaching Science
f. In service training and seminars in Science attended for the last three years
1.5 School Attributes
a. .Class size
1.6 Pupils Attributes
a.Family income level
b. Adequacy of reading materials at home
c.Home Television Viewing
c.1. TV Programs viewed
c.2. Length of Time spent in viewing
a. week days
b. week ends
c.3. Frequency of TV viewing
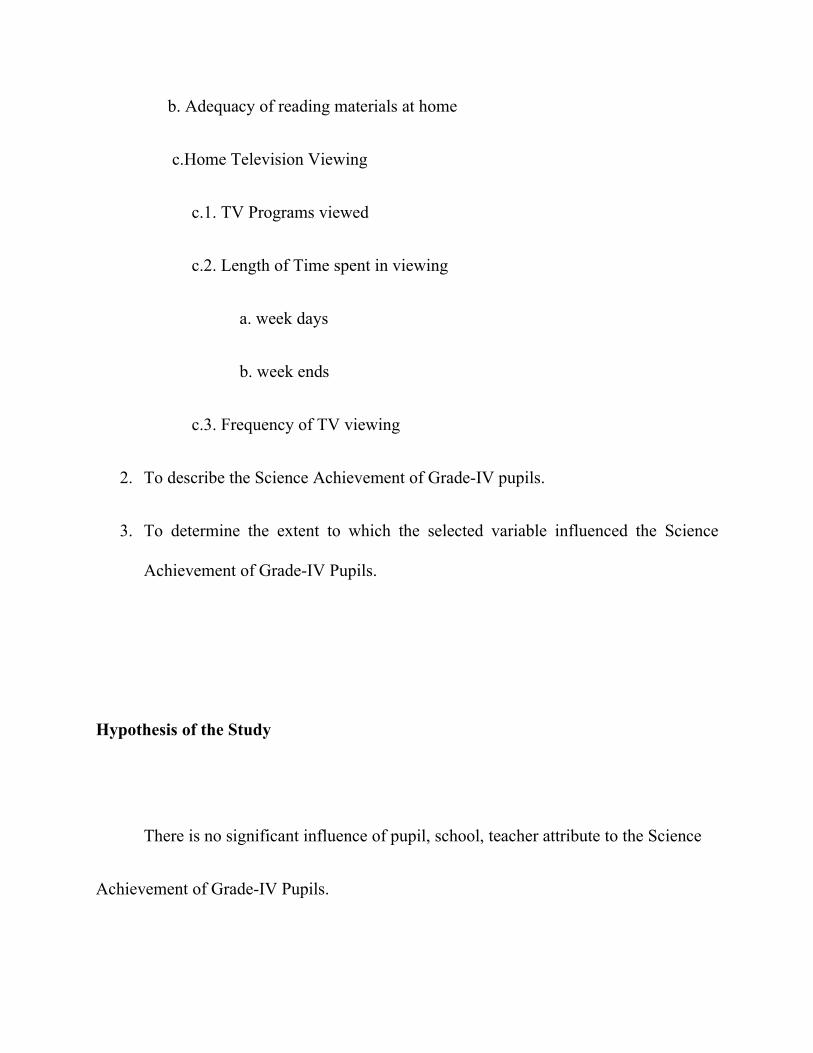
2. To describe the Science Achievement of Grade-IV pupils.
3. To determine the extent to which the selected variable influenced the Science
Achievement of Grade-IV Pupils.
Hypothesis of the Study
There is no significant influence of pupil, school, teacher attribute to the Science
Achievement of Grade-IV Pupils.

Scope and Limitaion of the Study
This study will be limited in Sta. Ignacia North Central Elementary School
(SINCES) School Year 2010-2011. All Science teachers of Grade-IV and pupils who will
be randomly sampled were the respondents of the study. The assessment of the Science
Achievement will be limited to the teacher’s attribute, school attributes and pupil
attributes, and adequacy of Science equipment in school.
Importance of the Study
A continuous of the Science program exist every now and then to make sure the
learners kept abreast of the recent innovations of the modern times, it is therefore
important to determine the strength weaknesses of the program, so that improvement may
be made.
To school officials, the findings serve as an instrument in the improvement of the
Science program and become their basis for its proper implementation directed to its
goal. It may also served as basis for planning Science activities and help teachers develop
programs and activities such as studies, conferences, workshops, seminars, and in-service
education.
Moreover, the results will be the basis for the administrators to devise appropriate
measures, identify and procure science equipment and facilities to ensure effective
teaching-learning process. Findings may also guide curriculum designers in laying out

realistic patterns in Science which will serves as blueprint or guide books to Science
achievement in instruction.
The result of this study serves as an eye opener to textbook writer to produce more
quality in Science, design to meet the needs of the Elementary Science program, thereby
providing pupils with a meaningful and suitable Science Education.
To teachers, the findings serve as a means of identifying the appropriate methods
and techniques in teaching science. Likewise, it is used as a springboard for the teachers
in making modification towards better learning and understanding on the part of the
learners.
For the pupils, the findings serves as a medium of providing new range of
experiences as a part of improving Science program. It will also be used in enhancing the
participation and concern of the parents in the preparation of the learners’ homework.
Solving or minimizing the problems encountered by the Science teachers through
upgrading their teaching competencies. Upgraded teachers competencies lead to the
improvement of the existing Science Education program of our country. Therefore, there
is a need to assess the Elementary Science Education program.
Definition of Terms
Achievement. In this study, it refers to the pupils scores in the achievement test.

Achievement test. It refers to the average of the three periodic examinations
administered by the school.
Hypothesis. it is the tentative theory to be proven from an activity.
Class size. This refers to the number of pupils enrolled in grade IV under the supervision
of one teacher.
Facilities. This refers to the semi-permanent or permanent type of structure such as
demonstration tables, chairs, storage cabinets, and electric outlets.
Supplies and Materials. These are the materials which need continual replacement like
petri dish, alcohol lamp, tripod, beaker, and thermometer.
Adequacy of Facilities, Equipment,Infrastructure and Projects. These attributes refer
to the available facilities, equipment, infrastructure and projects present in the School of
Sta. Ignacia North Central Elementary School.
Teaching experience. This refers to the number of years the teachers is teaching science.
Instructional Materials. These are available materials used by the teachers in teaching
science like pictures, charts, textbooks, manuals, flashcards and maps.
REVIEW OF RELATED LITERATURE
This chapter presents the literature and studies that helped the researchers in their
study.
Related Literature
Educational qualification is important in the teaching-learning process, according
to him can perform a better teaching than the unqualified one.( Pulido, 1971-1972)
According to Tuckman (1975), the faculty who have been long in the service
become better teachers because of their rich accumulated experiences in the subject area.
Dela Cruz (1987) as cited by De Pano (1989), made an intensive investigation on
academic performance and from the findings she concluded that academic performance is
greatly affected by the teacher’s method, techniques and strategies in teaching and in
meeting individual’ needs and differences.
Encarnacion (1992) stated that pupils acquired high grades of achievement when
the teacher uses multi-sensory approaches in presenting the lesson.

Salandanan (1992) stated that to enable educational managers to gauge the
quality of instruction at different levels of the system, measuring achievement is also
useful in monitoring achievement to maintain attendance in learning.
According to Victor (1970), there are essential components of science program
that must be given serious consideration if teaching and learning in the elementary school
is to be effective. These elements can be stated simply as “why”, “what”, and “how”. The
term “why” refers to the specific science process that should be taught for science content
often called the product science.
TV viewing has been part of our daily lives. A survey was conducted in 1998 and
there are four major groups of TV as withheld by student’s choice:These are as follows:
(1)News. It is usually shown from morning to evening. It’s the major way for people to
get information about their life, country and the world. (2)Sports. This is a seasonal
program such as football and basketball.(3)Talk Shows. A kind of program where in
some guests are invited to discuss a certain topic on the show.(3)Soap Opera. This is a
show telling a serial story which is usually a made up story.
Schramm (1981) points out that a media can perform teaching functions. It can help
in all types of education and training of in and out-of-school youth, adult education, in-
service training of teachers, and the skills needed by the people so that they would be
able to perform their functions and roles in nation building.

Kuslam and Stone (1982) stressed that TV as an instructional medium has its
advantages. It can give to an individual a vicarious experience with the whole world.
According to them, broadcast television can increase physical accessibility of education
for people who find it inconvenient or impossible to go to school.
Spencer (1993) stated that parents and teachers should be concerned with the possible
effects of excessive TV viewing. According to her, studies showed that too much TV
viewing can be associated with violent or aggressive behavior, poor academic
performance, precocious sexuality, obesity and the use of drugs and alcohol. She also
emphasized that too much TV interferes with the person’s amount of sleep and
completion of homework that could affect his grades and alertness in school. On the other
hand, other researchers say that TV could be very useful if viewing would be properly
guided by adults even in programs about sex and violence. That is, virtues and positive
values are stressed.
“Media can touch live of a great number of people in the society”, says Holland
(1994). According to him, media can provide young people with information and ideas
about the societies into which they are maturing for there are plenty of communication
grid variables such as TV, radio, cinema, magazines, and popular papers.
Salandanan (1985), in her book , “The Teaching Of Science” says that the
science room of the elementary level is one of the most popular and exciting places to
stay during the day. To every pupil the room is identified with action and continued
search for new information.

In the study Berry (1992), he found out that TV possible enhances academic
performance. He attempted to test the ability of informative TV programs like news
programs in enhancing the memory by comparing adults who watched TV news and
those who read news. After performing their respective tasks, the subjects were asked
about the news that they have read and watched respectively. The result indicated that
adults who watched the news programs could recall more information than those who
read the news on paper. It seemed that TV viewing could improve memory.
As cited by Williams, et. al (1996),television also affects man’s ability to learn.
They referred to television as an antidote to environmental limitations in learning and as
stimulus to creativity with the use of instructional TV in teaching a wide range of
conceptual and social behaviors. However, they also pointed out that TV also has its own
share of detrimental effects, for example, it has been blamed for shortened span of
attention and decreased ability to process written information.
Aside from the above- mentioned bad effects of TV viewing, Siegel, Bremer, and
Houston (1983) cited in the book of Santrock (1996) stated that TV may take
adolescents away from printed media and books. According to them, recent study found
out that adolescents who read books and printed media watched TV less than those who
did not.
Tucker(1987) also cited in the book of Santrock,said that TV trains an individual to
become passive learners. He explained that TV viewing is a passive mental, for it is
observer-directed rather than doer- oriented. As opposed to reading, which requires an
individual to pay close attention to every detail and perhaps, even to visualize bits of
information, TV viewing does not present any challenge to audience concentration and
imagination.
In support to idea stated above, Marvell (1997), in his article, compared TV to a
talking picture magazine that goes on “daily and nightly, asking little, giving out along
with its entertainment, a quality of easily assimilated information”.
Related Studies
Cortes (1999) revealed in her study that majority of the Grade V pupils of Coral
Elementary School were average achievers in Science V. Based on the findings, the
traditional approach of teaching science in Grade V, group I obtained higher mean score
compared with their mean score in the process approach. While in group II, these
approaches are equally effective as far as achievement level of the pupils is concerned.
Dela Cruz (2001) stated that: (a) Most of the science teachers in Malasiqui
District II are B.S.E.ED/B.E.E.D. graduates and were teaching science from 21 years
above,(b) Majority of the science teachers attended in-service trainings/seminars in the
district level as participants and only a few are coaches in winning events in science, (c)
School projects were adequate, infrastructure were inadequate, (d) Majority of the school
made use of school funds to finance science activities, (e) Majority of the pupils belonged

to the low income group but most of them owned television sets and managed to
subscribe/read newspaper, (f) More than one half of the pupils have average final rating
in Science, (g) All 23 schools have inadequate equipments and facilities based from
MECS, Memorandum 315 s. 1982, (h) The teachers in the district encountered serious
problems like insufficient textbooks and references in science, language difficulty and
inadequate vocabulary of pupils in science, likewise, teachers have several subject
preparation, (i) the suggested solutions are provide hand-outs to pupils regarding the
lesson, teacher should teach to the level of the pupils and emphasis on the right attitude
toward the teaching profession.
Guerrero (1997), identified the four most important factors that can improve pupil
performance in school. These are the following: (a.) Parental encouragement and
supervision of their children. (b.) Provision for greater availability of instructional
materials. (c.) Development of healthy and well- nourished children. (d.) Need for
dedicated teachers.
It is necessary to assess the characteristics of individual differences between children
with respect to their background, cognitive abilities and attitude which may be relevant to
their development and progress. These individual differences must be taken into account
in any study that seeks to determine the level of pupil achievement.
Moreover, it is also necessary to assess the characteristics of the teachers who relate
to the pupils. Just as it is necessary to assess pupil character, so too, is determining
teacher background, qualifications, practices and attitude which are mediating factors in
the development and progress.
Tolentino (2001) found in her study that: (1) Most of the science teachers attended in-
service trainings/seminars in the district level as delegates, (2) of the science teachers in
Malasiqui District I were MS/MA units and were teaching science for 21 years above, (3)
School projects were adequate, insfrastructure were inadequate, (4) Most schools made
use of the school funds to finance science activities/programs, (5) Majority of the pupil
respondents belonged to the low income group but most of them owned television sets
and managed to subscribe/read newspaper, (6) Most of the pupils belonged to the average
level of their final rating in Science VI, (7) All schools have inadequate equipment and
facilities based from MECS Memorandum No. 313, s. 1982, (8) The teachers in the
district encounter like: lack instructional materials and equipments such as teaching
guides, devices and apparatuses and several subjects preparations other that science, (9)
The suggested solutions are “ subscription to professional; magazines related to science,
emphasis on the right attitude of teachers towards the equal number of teaching hours
according to their grade assignments.
Mendoza (1999), in her study on the status of Science I instruction on National High
School in the Division of Tarlac, revealed that audio-visual materials were already
available in most of the houses of the respondents which in the teaching-learning process
were needed as supplement in the lessons especially Science. Likewise, the respondents
have sufficient reading materials at home which reinforces the teaching –learning
activities in the school.
Pagaduan (2000), stated that the three strategies Audio-Video Assisted instruction,
Traditional and Modular approach were equally effective on the science performance of
Grade V pupils in Pitombayog Elementary School. This implies that there is no single
method that is best for teaching all the concepts in Science and Health a variety of
teaching procedures and techniques, could create high thinking learners.
Medrano (2000), in his study entitled “ Science and Technology Performance of the
Second Year High School As Affected By Different Teaching Strategies” was conducted
to determine the effects of the different strategies on teaching science and technology on
the performance of the second year high school at Alaminos National High School.
Sanggalang (2005), stated that with regards to the influence of respondents personal
attributes and home TV viewing to their achievements in Science and Technology II,
Science-Related TV program viewing and the length of time spent in viewing during
weekend registered significant influence; non-Science-Related TV program viewing, type
of community and frequency of viewing different types of TV programs registered highly
significant influence.
Laron in 1994 conducted a study on the validation of an instructional module with a
videotaped material for basic nutrition and the class in high school Physics that this can
be successfully taught through the use of films and workbooks without classroom

intervention by teacher. But this is not to say that instructional technology can or could
replace the teacher rather than the media can help teachers to become creative managers
of learning experiences rather than merely dispensers of information. He found out that
films and workbooks were effective means of educating children and as great aids for
teachers.
In the study made by Kabiling (1995), she mentioned that electronics media have
speed up computing and communicating for the students, this has been at the cost of the
inquisitiveness and analytical thinking of young people. She explained that the downward
trend in reading were due to the failure of the parents to instill good reading habits among
their children, the overwhelming volume of information, peer pressure, and the teacher’s
failure to be more creative in motivating students. As for recommendations, she has the
following: (1) parents should act as board of censors in the TV viewing of their children
and should regulate the frequency and length of their TV viewing, (2) teachers should
relate their lessons to the worthwhile TV shows from time to time to encourage their
students to view TV shows that are both educational and entertaining, (3) both teachers
and parents should make their students/children understand that TV viewing is never a
substitute for reading, doing assignments or accomplishing a project.
Finally, Baes (1998), in her study, cites that it is necessity for the educators to avail
themselves of different instructional media to help the pupils open the doors of their
classrooms to the outside world, to bring an intimate close up to its subjects, to feel the

elements of motion, to touch lives of a great number of the people in the society, and to
maintain and adopt a social value for the total development of the society.
Theoretical /Conceptual Framework
The achievement of the pupils depends on the teachers in school and parents at
home. Pupils need their parents at home for guidance and informal education, while in
school, the teachers will give them formal education.
Skills of teachers will be reflected on how the pupils will achieve and react in his
environment. Thus, with a good teaching-learning process, the pupils’ achievement will
be high.
Seminar, conferences and even trainings are just some of the variables that
contribute to teachers academic background. Teachers with more training tend to be more
efficient and up-dated with new trends, techniques and methods of teaching will result to
a higher pupils’ achievement.
Another attribute which is hypothesized to have relationship on pupils
achievement is the experience of the teachers. Teachers who have been in the service for
a number of years are deemed to have refined their teaching methods and have better
understanding of the pupils and mastery of their subject matter. Thus, it is expected that

they teach better than these with scholastic length of teaching experience as new in the
profession ( Ibarra, 1995).
Aside from teacher’s attributes, it is also hypothesized in this study that the family
income, the achievement of pupils. These is a saying that if the family has only few
children, it is most likely that they can afford to buy more educational materials for their
children. Well-to-do family can afford to buy books and other supplementary materials to
enrich their child’s knowledge and skills.
The length of time spent in TV viewing may also affect the students achievement
as proven by a number of studies, which revealed the excessive TV viewing with low
reading skills and poor academic performance. Too much TV exposures interferes with
the learners completion of homework, his amount of sleep, which could affect his
performance in school activities in general (Spencer 1993). It was also found out that
underachievers tend to view TV viewing as an Entertainment medium.
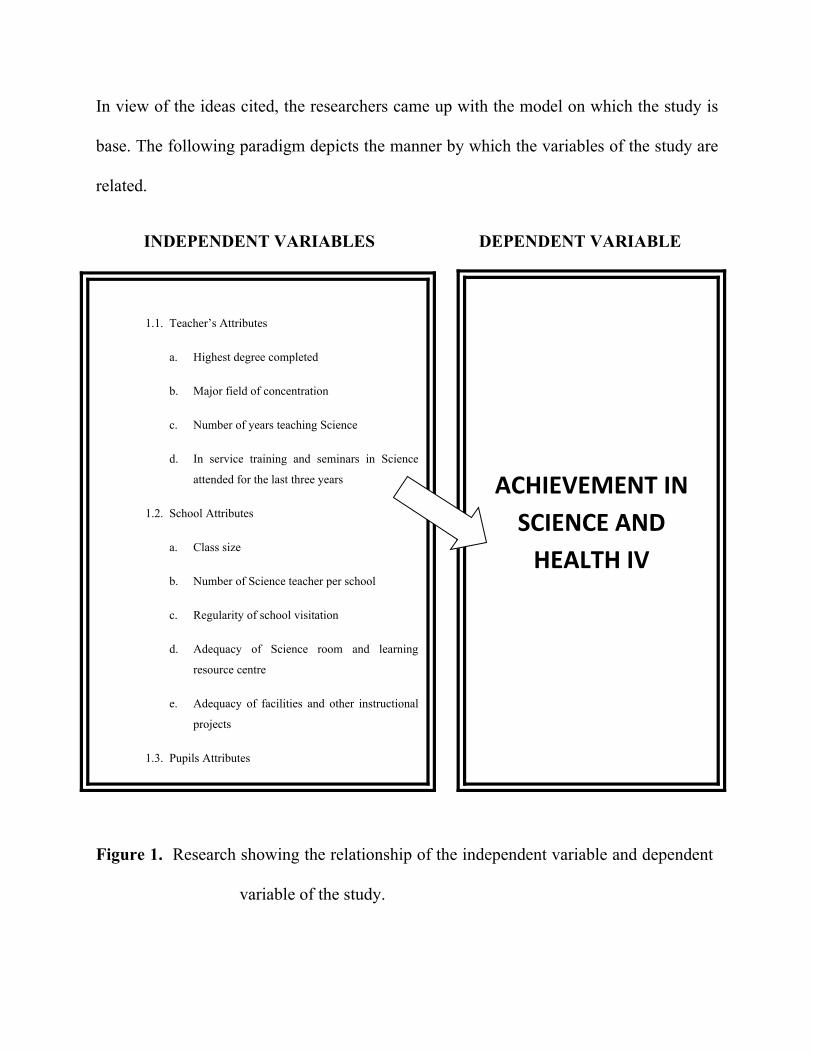
In view of the ideas cited, the researchers came up with the model on which the study is
base. The following paradigm depicts the manner by which the variables of the study are
related.
INDEPENDENT VARIABLES DEPENDENT VARIABLE
Figure 1. Research showing the relationship of the independent variable and dependent
variable of the study.
1.1. Teacher’s Attributes
a. Highest degree completed
b. Major field of concentration
c. Number of years teaching Science
d. In service training and seminars in Science
attended for the last three years
1.2. School Attributes
a. Class size
b. Number of Science teacher per school
c. Regularity of school visitation
d. Adequacy of Science room and learning
resource centre
e. Adequacy of facilities and other instructional
projects
1.3. Pupils Attributes
ACHIEVEMENT IN SCIENCE AND
HEALTH IV

METHODS AND PROCEDURE
This chapter presents the research design, respondents of the study, data-gathering
instrument, statistical tools, data-gathering procedures and statistical analysis.
Research Design
This study will make use of descriptive-correlational research. Through those
methods, the researchers gathered data on Science Achievement of the Grade-IV pupils
and the factors affecting it. Descriptive because it describes the teacher, school and pupil
attributes, correalational because it will determine the extent of influence of selected
variables to the Science Achievement of pupils.
Respondents of the Study
The respondents of the Study will be the 131 pupils from Sta. Ignacia North
Central Elementary School, school year 2010-2011, taken randomly from the four
sections. The total population of the Grade-IV pupils was subjected to Yamane Formula
where the total sample size was established.
Sampling Procedure
The total population of the Grade-IV pupils was subjected to Yamane Formula
where the total sample size was established.
The Yamane Formula is shown below.
n = N
_____
1+Ne ²
Where:
n – sample size
N –total number of population
e –the margin of error (0.05)
To get the sample population, the total population of the one section represent the
population size(n). To complete the sample population, an equal number of pupils per
section were drawn. The sample population was representing the grade level.
In this case there were four sections to complete the sample size representing the
Grade-IV pupils.

Table 1 shows the sampling frame used by the researchers.
Section No. of Teacher Total No. of Pupils Sample Size of Pupils
I 1 49 33
II 1 45 30
III 1 50 34
IV 1 51 34
TOTAL 4 195 131
Locale of the Study
This study will be conducted at Sta. Ignacia North Central Elementary School,
Sta. Ignacia Tarlac.
Data Gathering Instrument
A questionnaire will be used to gather the needed information from the
pupils. The first part of the questionnaire sought to obtain the teachers’ personal profile in
terms of their highest educational qualification, major field of concentration and
specialization, teaching experience in Science and training in Science teaching. The
second part dealt with learning environment of the school in terms of class size by
section, frequency of supervision in each class, infrastructure/facilities/project available
in the school. The third part of the questionnaire sought to obtain the pupils’ personal

profile in terms of annual family income, facilities and reading materials available at
home, home television viewing, programs they watch at home, the length of time they
spent watching during weekdays and weekends and the frequency of viewing. The fourth
part of the questionnaire is the average of the three periodical examination administered
in the school.
To gather supplementary data from the pupils, an unstructured interview will also
utilized by the researchers.
Data Gathering Procedure
A permission to administer the questionnaire to the respondents will be secured
from the Principal of the Sta. Ignacia North Central Elementary School, Sta. Ignacia
Tarlac. Permission from the advisers of four sections will also be secured.
Administration of the questionnaires and test questions in Science will be administered
personally by the researchers.
Unit of Analysis
The Grade-IV pupils will be the unit of analysis in determining the influence of
personal attributes and TV viewing to their achievement in Science and Health IV.

Data Analyses
For objectives Number 1, to describe the Science Achievement in Sta. Ignacia
North Central Elementary School in terms of teacher’s attributes, school attributes and
pupils’ attributes, frequency counts and percentages were used.
For objectives Number 2, in describing the level of achievement of the pupils,
the mean and the standard deviation were established.
For objectives Number 3, to determine the extent to which the selected variable
influence the Science Achievement of Grade-IV pupils.
RESULTS AND DISCUSSIONS
Teacher Attributes
Figures 1.1.a,1.1.b. , 1.1.c. and 1.1.d present the data on highest degree completed, major
field of concentration, number of years teaching in science, In-service training and seminars in
Science attended for the last three years.
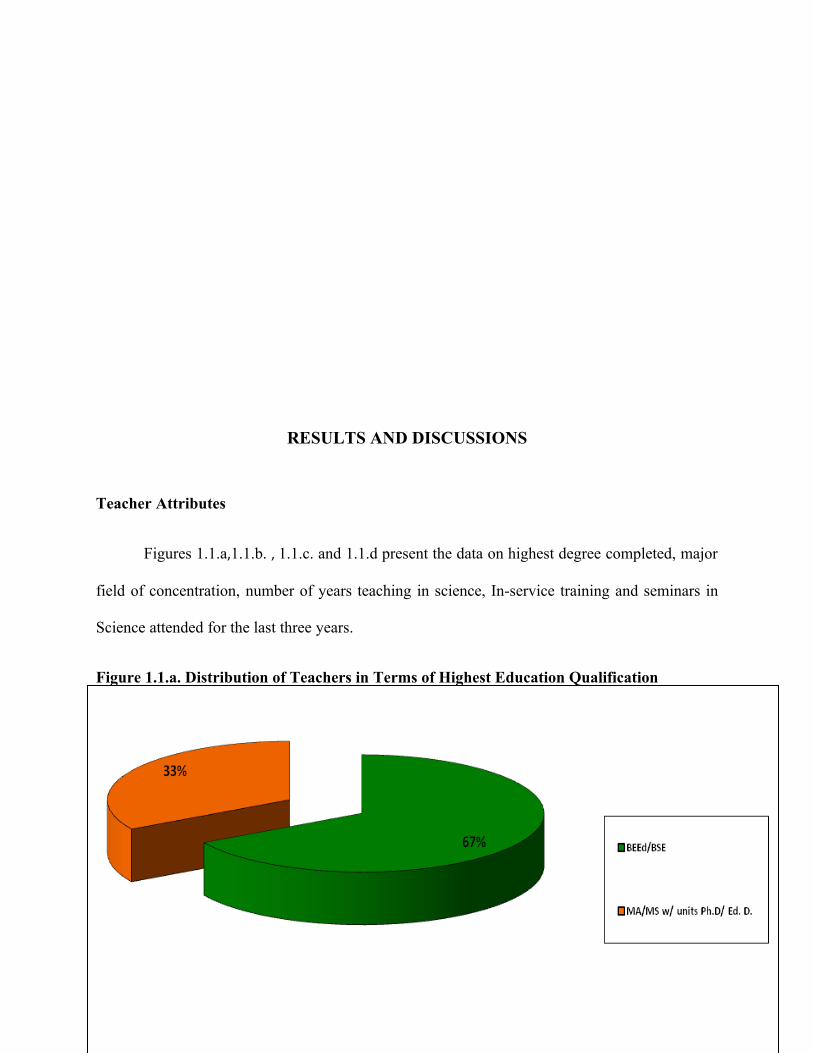
Figure 1.1.a. Distribution of Teachers in Terms of Highest Education Qualification

Highest Education Qualification Frequency ( N) Percentage (%)BEEd/ BSE 4 67 %Ma/MS with units Ph.D./ Ed.D. 2 33 %
In teaching-learning process, the teacher is considered the key factor for an effective
learning processes, thus it produce better output.
Figure 1.1.a. presents the distribution of Science teachers according to their highest
educational qualifications.
The data revealed that of the 4 Grade-IV teachers in Santa Ignacia North Central
Elementary School, 67 % had BEEd/BSE degree and 33 % of them has Ma/MS with units Ph.D./
Ed.D. It seemed that some teachers are too occupied to their families and didn’t finish their thesis
the fact that it is very expensive and they cannot afford.
Figure 1.1.b. Distribution of Teachers in terms of their Major Field of
Concentration/Specialization
Major Field of Concentration Frequency (N) Percentage ( %)Science 1 12.5 %Mathematics 1 12.5 %
English 1 12.5 %Filipino 2 25 %Social Studies 1 12.5 %MAPEH 1 12.5 %Values Education 1 12.5 %TOTAL 8 100 %
Every individual differs on their interest which should be developed by his choice of field
of concentration or specialization to make teaching more interesting.
It is evident that teachers teaching Science have not specialized teaching Science. This
implies that Grade-IV teachers in elementary are expected that they can teach all the subjects.
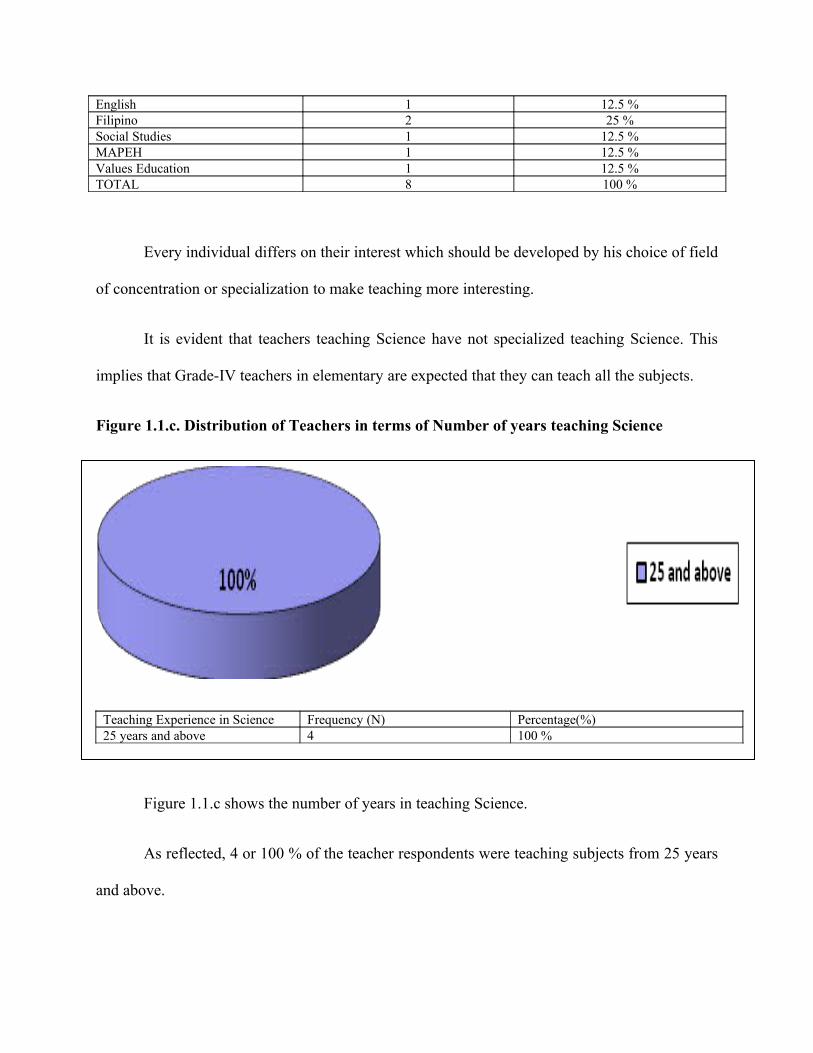
Figure 1.1.c. Distribution of Teachers in terms of Number of years teaching Science
Teaching Experience in Science Frequency (N) Percentage(%)25 years and above 4 100 %
Figure 1.1.c shows the number of years in teaching Science.
As reflected, 4 or 100 % of the teacher respondents were teaching subjects from 25 years
and above.

Figure 1.1.d. Distribution of Teachers in terms of in-service training and seminars in
Science attended for the last three years

The figure 1.1.d. shows that 100 % had attended seminars in science as Delegates and
Demonstration teachers.
LevelDelegate Demonstration TeacherFrequency (N) Percentage (%) Frequency (N) Percentage
(%)District 4 100 % 4 100 %TOTAL 4 100 % 4 100 %

25%
23%26%
26%Grade IV-A
Grade IV-B
Grade-IV-C
Grade-IV-D
School Attributes
Figure 1.2.a.Distribution of Class Size by Section
Based on the figure, almost three fourth or 73.85 % belonged to average class size. Only
26.16 % belonged to large size. In large classes, learning cannot be measured accurately
especially if the pupils were inattentive and half regular attendance
Categorization/ Class Size by Section Total Percentage (%)
A 49 25.1351 – 60/ Large B 45 23.0841 – 50/ Average C 50 25.6430 – 40/ Small D 51 26.16
TOTAL 195 100
25.13 %

Pupils Attributes
Figure 1.3.a. Distribution of Pupils in Terms of Annual Family Income
The income of the family affects the study habit of the pupils. Generally, a low income
family has less access to acquisition of facilities and equipment which could be used for the
learning of pupils.
Based from the table, 69 or 52.67 % of the family has an income below P10,000
annually, 16 or 12.21 % has an income of 10,001.00 – 30,000.00, 9 or 6.87 % has an income of
30,001.00 – 50,000.00, 3.82% has an income of 30,001.00-70,000.00 and the remainng 24.43%
Range Frequency (N) Percentage (%)
P 70,001.00 and above 32 24.43
P 50,001.00 – 70,000.00 5 3.82
P 30,001.00 – 50,000.00 9 6.87
P 10,001.00 – 30,000.00 16 12.21
P 10,000.00 – and below 69 52.67
TOTAL 131 100
has an income of above 70,001.00. Based from the National Economic Development Authority
(NEDA) report of 1997, the monthly average family income was P11,640.00. the projected
annual average family income in 1999 was much higher than in 1997. In totality, all the families
of the pupil respondents have low income. It is therefore foreseen that they can hardly afford to
buy educational materials for their children which are very useful in providing learning
experiences.
Figure 1.3.b. Distribution of Pupils in Terms of facilities and Reading Material at Home

To learn more effectively, children should be provided more facilities and reading materials at
home which can be used as supplements for the learning of pupils in Science.
Facilities Frequency (N) Percentage (%)
Television Set 32 24.43
Science Magazines 5 3.82
Science Books 9 6.87
Tape Recorder 16 12.21Transistor Radio 69 52.67TOTAL 131 100

It could be gleaned from the table that majority of the sudents have television set at
home, followed by Science books and transistor radio, only few number of students have cassette
recorded Science lesson, followed by Science magazines. This means that educational materials
needed in science are available at home of the students.
Figure 1.3.c.1. Distribution of Pupils in Terms of Home Television Viewing
TV PROGRAM Mean RankNON-SCIENCE RELATED
Soap Opera 4.87 2Catoons/Animations 3.58 3Talkshow 2.85 4Entertainment 2.50 5Sports 1.91 7
SCIENCE RELATEDEducational Shows 1.92 6News 5.11 1Documentaries 1.62 8
*Multiple Responses
The table shown reveals that most of the respondents prefer to watch News shows with a
mean of 5.11, next is Soap Opera with 4.81 mean, Cartoon shows with a mean of 3.58,
Talkshows with 2.85 mean, Entertainment with a mean of 2.50, Educational shows with a mean
of 1.92, Sports with a mean of 5.11 and Documentaries with a mean of 1.62.

The data shows that in most home, news shows that provide information to the viewers
are being patronized. This implies that TV viewing to some is a way of getting information. Soap
Opera has strong appeal to the masses for these shows often reflect the lives of the different
people in the society. Variety shows, talkshows, and animations are being watchd mainly to
entertain oneself with music, humor and special performances by famous artists. Sports like
basktball games are also being watched for entertainment. Documentaries were the least
preferred by the pupils.
Figure 1.3.c.2. Distribution of Pupils in Terms of Length of Viewing
HOURS/DAY WEEK DAYS WEEK ENDSFreq. Percentage Freq. Percentage
Less than an hour
26 19.85 4 3.05
1-2 hours 56 42.75 35 26.723-4 hours 27 20.61 41 31.305-6 hours 11 8.40 20 15.276 hours and above
11 8.40 31 23.66
TOTAL 131 100 131 100
WEEKDAYS WEEKENDS

Regarding the hours spent in TV viewing during weekdays, it can be gleaned from the
table that 1-2 hours had a frequency of 56 or 42.75% , 27 or 20.61% watched for 3-4 hours, 26 or
19.85% watched for less than an hour, 5-6 hours and above had a frequency of 11 or 8.40%. The
data imply that the respondents spend time to watch TV even during school days. They look at
TV viewing as a form of break from school pressure.
Regarding the hour spent in TV viewing during weekends, majority of the respondents or
31.30% watched TV for 3-4 hours, 35 or 26.72% watched for 1-2 hours, 31 or 23.66% watched
for 6 hours and above, 20 or 15.27% watched for 5-6 hours and lastly less than an hour wth a
frequency of 4 or 3.05%.
This imply that the respondents spend more hours watching on weekends than wekdays.
This confirms the study of Cumba (1987) which reveals that respondents spend more time
watching on weekends but less than on weekdays. Students have more time to watch TV during
Saturdays and Sundays because there are no classes to attend to during these days, thus making it
favorable for spending their time in TV viewing including movies.
Figure 1.3.c.3. Distribution of Pupils in Terms of TV Program Viewed

3.47
3.52
2.832.813.45
3.99
3.8 Educational Programs
News/Documentaries
Sports
Talkshows
Entertainment
Cartoons/Animations
Soap Opera
Type of TV ProgramFrequency
5 4 3 2 1TOTAL SCALE
Educational Programs 54 19 40 15 8 131 3.47**News/Documentaries 41 29 24 17 11 128 3.52**Sports 17 20 32 24 15 130 2.83**Talkshows 11 27 28 54 10 130 2.81**Entertainment 41 24 27 46 12 128 3.45**Cartoons/Animations 72 14 21 23 6 130 3.99**Soap Opera 57 29 13 40 13 127 3.80**
*Multiple response
Legend:
* Less frequent (1.00-2.33)
**Frequent (2.34-3.66)
***Very frequent (3.67-5.00)
It is very evident that TV viewing has been part of students everyday routine and
cartoons are being watched more than often than other shows. Sports and Talkshows are the least

frequently viewed. This maybe because these programs are not broadcasted daily on TV
channels.
Figure 2 Description of Level of Grade IV Pupils in terms of their Science
Achievement
LEVEL OF ACHIEVEMENT IN SCIENCE
FREQUENCY PERCENTAGE
Above Average(83 and above)
15 12
Average(77-82)
105 80
Below Average(76 and below)
11 8
TOTAL 131 100

Mean = 79.84176 SD = 2.355009
The pupils’ levels of achievement are classified into three categories namely: “above
average”, (83 and above), “average” (77-82) and “below average” (76 and below) based
on their average grades in Science for the first and second grading period SY
2010-2011.
The data shows that most of the students are “average” performers (105 or 80%).
Fifteen students or 12% are “ above average and only eleven or 8% are “below
average” performers in Science.
This implies that majority of the students are “average” performers in Science.
Table 3a. Influence of Teachers’ Attributes on the Science Achievements of Grade IV
Pupils

Legend: ns – not significant
** - highly significant
The highest degree completed and the number of years teaching Science are not
included in the regression analysis because there are no variations in the entry. This
means that the highest degree completed and the number of years teaching Science
has nothing to do with their Science achievement.
Major field of concentration. The teachers’ major field of concentration
registered a coefficient of regression -1.5039 which means that this variable has high
significant effect to the Science achievement of the pupils. This implies that the Science
achievement of the pupils is affected by teachers’ major field of concentration. This
goes to show that when the teacher has
In-Service Training. The teachers’ in-service training has high significant
influence to the Science achievement of the grade IV pupils. The positive sign of
ATTRIBUTES COEFFICIENT OF
REGRESSION
PROBABILITY
Major Field of
Concentration
-1.5039** 8.39748E-16
In-Service Training 1.628572** 2.7189E-16
Multiple Coefficient of Determination = 53.64%
Over-all Probability = 3.71E-32
Strength of Prediction = Strong
coefficient of regression implies that when the teachers have attended various in-
service training it is expected that the Science achievement of the pupils are high. This
maybe because that the teacher who have attend different in-service trainings tend to
be more effective in the sense that he or she is updated with the new trends in different
techniques and strategies in teaching Science.
Prediction accounts 53.64% multiple coefficient of determination which means
that there are still 47.36% unaccounted for. This implies that there are other variables
which may affect the Science achievement of the pupils.
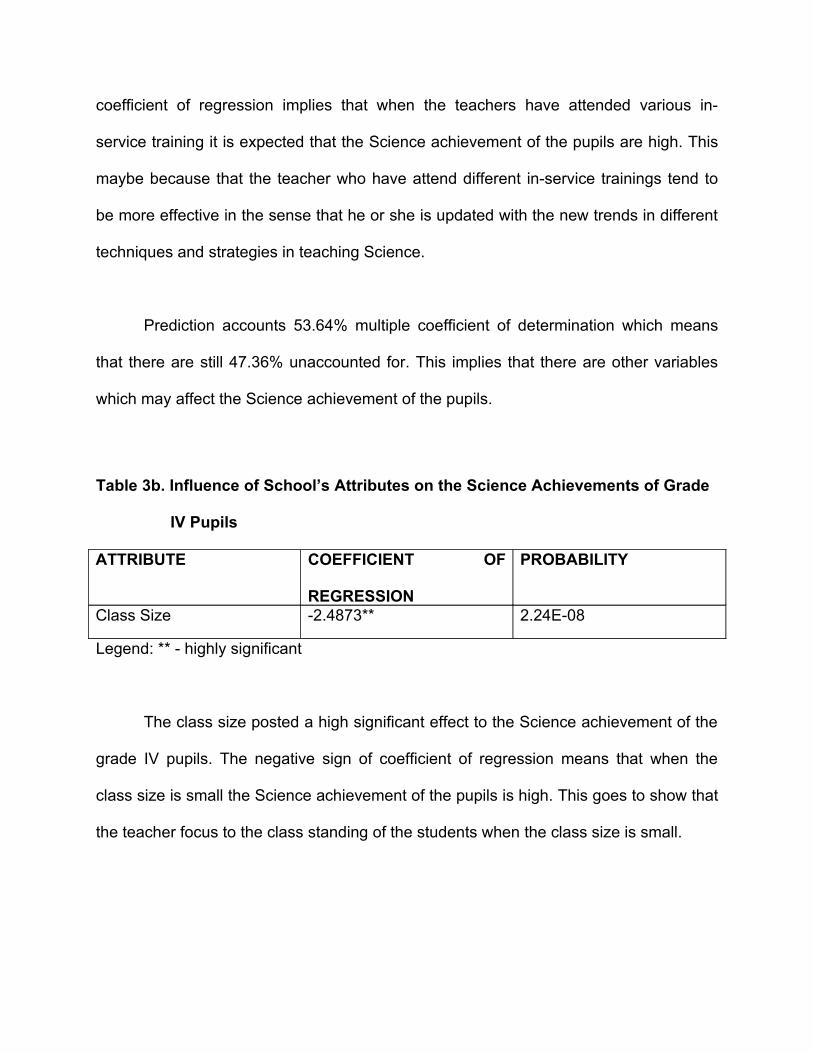
Table 3b. Influence of School’s Attributes on the Science Achievements of Grade
IV Pupils
ATTRIBUTE COEFFICIENT OF
REGRESSION
PROBABILITY
Class Size -2.4873** 2.24E-08
Legend: ** - highly significant
The class size posted a high significant effect to the Science achievement of the
grade IV pupils. The negative sign of coefficient of regression means that when the
class size is small the Science achievement of the pupils is high. This goes to show that
the teacher focus to the class standing of the students when the class size is small.

Table 3c. Influence of Pupils’ Attributes on the Science Achievements of Grade IV
Pupils
ATTRIBUTES COEFFICIENT OF
REGRESSION
PROBABILITY
Family Income 0.3913* 0.0421
Adequacy of Reading
Materials at Home
-0.5369ns 0.0759
Home Television Viewing 0.3147ns 0.0770
Multiple Coefficient of Determination = 29.24%
Over-all Probability = 1.44448E-09
Strength of Prediction = WeakLegend: ns – not significant
* - significant
Results show that the adequacy of reading materials at home and home
television viewing has no significant influence to their Science achievement. This
implies that the adequacy of reading materials at home and home television viewing are
not strong predictors of the pupils’ Science achievement.
Annual income of the family registered high significant influence to the Science
achievement of grade IV pupils. The positive sign of coefficient of regression means that
the higher the income of the family the better the achievement of the pupils. This might

attributed to the fact that when the family has high income the parents can provide the
educational needs of their children.
Prediction accounts 29.24% multiple coefficient of determination which means
that there are still 71. 86% unaccounted for. This implies that there are other variables
which may affect the Science achievement of the pupils.
Tarlac College of Agriculture
Institute of Education
Camiling Tarlac
February ___, 2011
The Principal
______________________
______________________
______________________
Madam:

In line with our research study entitled “Science Achievement of Grade IV Pupils in Sta. Ignacia North Central Elementary School (SINCES) As Influenced by Selected Variables”,in partial fulfilment of the requirements in Educational Research (EDUC 07) during the Second Semester 2010-2011 under Professor Lucena G. Garcia, may we humbly request permission from your good office to float our questionnaire to selected Grade-IV pupils in your school.
Your positive response regarding this matter is highly appreciated. God bless and more power.
Researchers:
Mariella Alexes M. Rombaoa Myrell Joyce R. Esteban Mechille E. Lacuesta
Judith B. Repato Jhonalyn L. Peralta Carolyn V. Grande
Loreto C. Morales
Noted by:
Lucena G. Garcia
(Professor)
QUESTIONNAIRES

I. Part I- TEACHER ATTRIBUTES
Directions: Please supply the information needed or put a check on the blank provided for the purpose. Write your few notations if needed.
A. Highest Educational Qualification
_________ BSEEd/BSE
_________ BS with 18 units in Education
_________ MA/MS with units Ph.D./Ed.D.
_________ Ph.D./Ed.D.
B. Major field of Concentration/Specialization\
_________ Science _________ Social Studies
_________ Mathematics _________ MAPEH
_________ English _________ Values Education
_________ Filipino
C. Teaching Experience in Science
_________ 1-4 years _________ 15-19 years
_________ 5-9 years _________ 20-24 years
_________ 10-14 years _________ 25 and above
D. Training in Science Teaching
1. Resource Speaker
_________ National level _________ District level
_________ Regional level _________ others pls. specify
_________ Division level
2. In-service Trainings/seminars in Science
Level of Training School District Division Region
Delegate
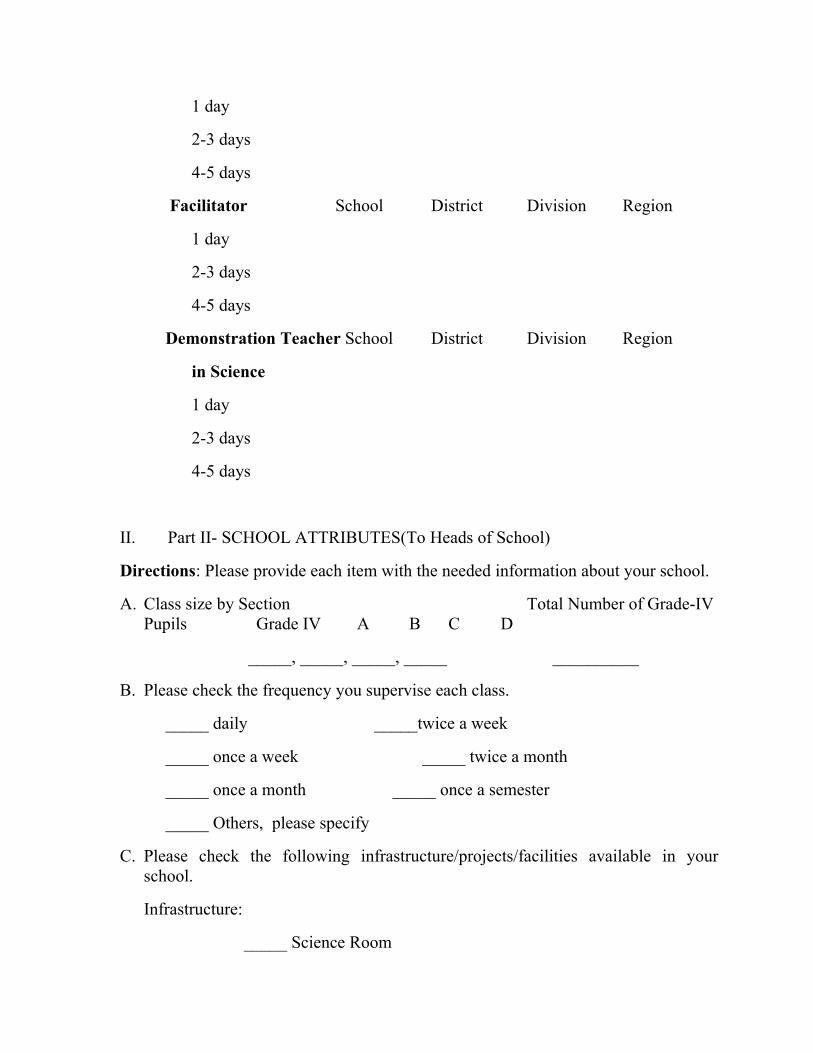
1 day
2-3 days
4-5 days
Facilitator School District Division Region
1 day
2-3 days
4-5 days
Demonstration Teacher School District Division Region
in Science
1 day
2-3 days
4-5 days
II. Part II- SCHOOL ATTRIBUTES(To Heads of School)
Directions: Please provide each item with the needed information about your school.
A. Class size by Section Total Number of Grade-IV Pupils Grade IV A B C D
_____, _____, _____, _____ __________
B. Please check the frequency you supervise each class.
_____ daily _____twice a week
_____ once a week _____ twice a month
_____ once a month _____ once a semester
_____ Others, please specify
C. Please check the following infrastructure/projects/facilities available in your school.
Infrastructure:
_____ Science Room

_____ Learning Resource Center
_____ Others, please specify
Project Devised:
_____ Terrarium _____ Wine Nave
_____ Aquarium _____ Lung/Chest Model
_____ Herbarium _____ Solar system Model
_____ Vivarium _____ Constellation Model
_____ Anemometer _____ Electric Circuit Model
_____ Rain Gauge _____ Others, please specify
Facilities:
_____ Demonstration Table _____ Electric Outlet
_____ Movie Projector _____Others,please specify
_____ Video-cassette recorder

III. PUPIL ATTRIBUTES
Directions: Please supply the information needed or put a check on the blank provided for the purpose. Write your few notations if needed.
A. Annual Family income level
_____ below 10.000.00
_____P 11,000.00- 30,000.00
_____ P 31,000.00- 50,000.00
_____ P 51,000.00- 70,000.00
_____ P 71,000.00 and above
B. From the list of Facilities and reading materials below, kindly check those items you have at home.
_____ Television set _____ Tape recorder
_____ Science magazines _____ Transistor radio
_____ Science books _____ Cassette recorded science lessons
C. Home Television Viewing
Direction: Please put a check mark on the space provided for the television programs you regularly watch at home and for the length of time you usually spend in viewing. Please indicate how many days a week you usually watch your chosen TV programs.
1. Television Programs
_______1.1 Educational Programs

____ National Geographic Channel
____ Discovery Channel
____Ripley’s Believe It or Not
____ Kap’s Amazing Stories
____ Others (Please specify)
_______1.2 News Programs/ Documentary Films
News Programs
____ TV Partol World ____ TV Patrol Northern Luzon
____ 24 Oras ____ News on Q
____ Balitang Amianan ____ Unang Hirit
____ Umagang Kayganda ____ Saksi
____ IBC News ____ Others (Please specify)
____ Bandila
Documentaries
____ S.O.C.O.(Scene Of The Crime Operatives)
____ The Notebook
____ Jessica Soho Report
____ I Witness
____ Others (Please specify)
_______1.3 Sports
____ PBA ____ NBA
____ World Sports ____ Others (Please specify)
____ WBC Wrestling

_______1.4 Talk Shows
____ Showbiz Central ____ E-Live
____ StarTalk ____ The Buzz
____ Love ni Mr. Love ni Misis ____ Others (Please specify)
_______1.5 Entertainment Shows/Musical Shows
____ Eat Bulaga ____ Showtime
____ Willing Willie ____ Others (Please specify)
_______1.6 Cartoons and Animation Series
____ Doraemon ____ Dora the Explorer
____ Sponge Bob ____ Barney
____ Gimmy Nuetron ____ Others (Please specify)
_______1.7 Soap Opera/ TV Series/ Sitcom
____Mara Clara ____ Noah
____ Imortal ____ Dwarfina
____ Machete ____ Bantatay
____Sabel ____ Others (Please specify)
2. Please indicate how frequent you watch the following TV programs/shows. Use the scale below:
5 Always -6 to 7 days a week
4 Very Often -4 to 5 days a week
3 Often -2 to 3 days a week or
2 Sometimes -once a week
1 Not at all -you don’t watch the particular type of program

Type of TV programs 5 4 3 2 1
1.1 Educational Programs
1.2 News Programs/ Documentary Films
1.3 Sports
1.4 Talk Shows
1.5 Entertainment Shows/Musical Shows
1.6 Cartoons and Animation Series
1.7 Soap Opera/ TV Series/ Sitcom
3. During School days (Monday to Friday), how many hours do you usually spend in watching TV? (Please specify)
____ less than an hour ____5 to 6 hours
____1 to 2 hours ____6 hours or more
____3 to 4 hours Others (Please specify) _____
4. During Saturdays and Sundays, how many hours do you spend in watching TV at home? (Please specify)
____ less than an hour ____5 to 6 hours
____1 to 2 hours ____6 hours or more
____3 to 4 hours Others (Please specify) _____