Embed Size (px)
Citation preview

GCSE Geography Revision Pack
SDME (Hazards): 19th May 2015
Key Themes Exam: 3rd June 2015
NAME:
www.geogdebens.wordpress.comContact us for help: [email protected]
or Tweet @eggarsgeoghttp://bit.ly/1lsJ4eG - Geography Pods websiteBBC Bitesize site
Use the blog and OneDrive resources

Rivers & Coasts
Rivers: Need to KnowLandforms:
• V-shape valleys
• Waterfalls & Gorges
• Meanders & Ox-bow lakes
• Floodplains, mouth & delta
Processes:
• Erosion, Transport, Deposition
Floods:
• Causes, impacts, prediction, management, hydrographs
Case studies:
• LEDC flood: Zambezi,
• MEDC flood: Brisbane
• Landforms: e.g. River Derwent
Coasts: Need to KnowLandforms:
• Headlands & bays
• Wave cut platforms
• Caves, arches, stacks and stumps
• Beaches, spits, bars, tombolos
Processes:
• Erosion, Transport, Deposition
Coastal management:
• Hard vs soft engineering, sustainability, advantages and disadvantages
Case studies:
• Landforms: e.g. Hengistbury Head / Lulworth Cove
• Management: e.g. Barton-on-Sea & Highcliffe

Key terms : match up
1. Attrition
2. Abrasion
3. Hydraulic Action
4. Corrosion
5. Meander
6. Oxbow lake
7. Undercutting
8. Rotational cliff slumping
9. Longshore drift
10. Hydrological cycle
a. The process of material being moved along the beach by waves in direction of prevailing wind
b. A bend in the river
c. When chemicals in water acts like an acid to dissolve sediment
d. When a headland collapses due to the base being weakened
e. When a meander is cut off to form a lake
f. The act of particles & water smoothing sediment as if like sandpaper
g. The cycle of water around our planet in solid, liquid and gas form
h. When water and air are forced into weaknesses in rock and split rocks apart
i. When waves or rivers create notches and weaknesses at the base of rocks
j. When particles in water are smashed into other rocks to chip away or break apart

V-Shape Valleys & Interlocking SpursVertical erosion occurs in the upper course of the river. The river is steep and gravity pulls it downhill so it erodes deeply in to the soil. the rocks on the valley sides slide down to make a V shape. Interlockingspurs are like a zip. The river does not have the energy to erode the harder spurs of rock so it flows around them, leaving harder rock spurs sticking out while softer rock erodes in.
Meanders:•Water in a river has slower and faster areas so you get differential erosion & deposition. Water is fastest on the outside edge of the bend so erodes more, it is slower on the inside and so deposits here. Therefore you get curves and bends
Oxbow lakesAre cut-off meanders.When meanders get too tight the water really slows down and too much deposition occurs. Then when a storm happens a new fast channel is eroded straight past, cutting off the old bend which gets left behind as a lake.
FLOODPLAINSThe area of land either side of the river in the lower course that gets flooded.Very fertile and flat land because of rich soils that get deposited after floods.
Mouth: The end of a river where it flows into a lake or the sea
Delta:A deposition landform.When the river reaches the sea the water slows down rapidly and deposits its material. The load builds up and the river gets broken up into lots of smaller tributaries.

• Complete:
– The hard, surface rock is eroded more slowly and so is left unsupported as the underlying _____ rock is more quickly by the river. In time this rock ledge will collapse due to . This material will be swirled around by the river, widening and
the plunge pool at the foot of the waterfall. Eventually as more rock collapses, the will retreat inland leaving a steep gorge.
waterfall deepening gravityeroded resistant softer
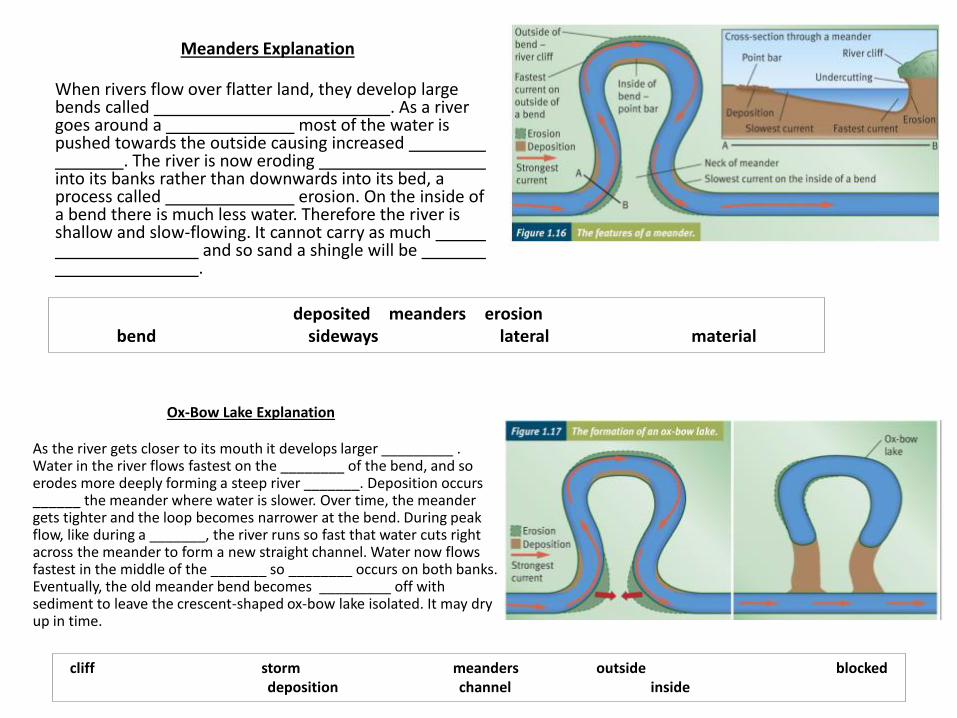
Meanders Explanation
When rivers flow over flatter land, they develop large bends called . As a river goes around a most of the water is pushed towards the outside causing increased
. The river is now eroding into its banks rather than downwards into its bed, a process called erosion. On the inside of a bend there is much less water. Therefore the river is shallow and slow-flowing. It cannot carry as much
and so sand a shingle will be .
deposited meanders erosionbend sideways lateral material
Ox-Bow Lake Explanation
As the river gets closer to its mouth it develops larger _________ . Water in the river flows fastest on the ________ of the bend, and so erodes more deeply forming a steep river _______. Deposition occurs ______ the meander where water is slower. Over time, the meander gets tighter and the loop becomes narrower at the bend. During peak flow, like during a _______, the river runs so fast that water cuts right across the meander to form a new straight channel. Water now flows fastest in the middle of the _______ so ________ occurs on both banks. Eventually, the old meander bend becomes _________ off with sediment to leave the crescent-shaped ox-bow lake isolated. It may dry up in time.
cliff storm meanders outside blockeddeposition channel inside

Hydrological cycle

Structure of a river
What happens to the processes and landforms along a river as you move from source to mouth?
How does the gradient of the land change?
Why do we get waterfalls in the upper course and not lower course?
Why is the river fast in the upper course?
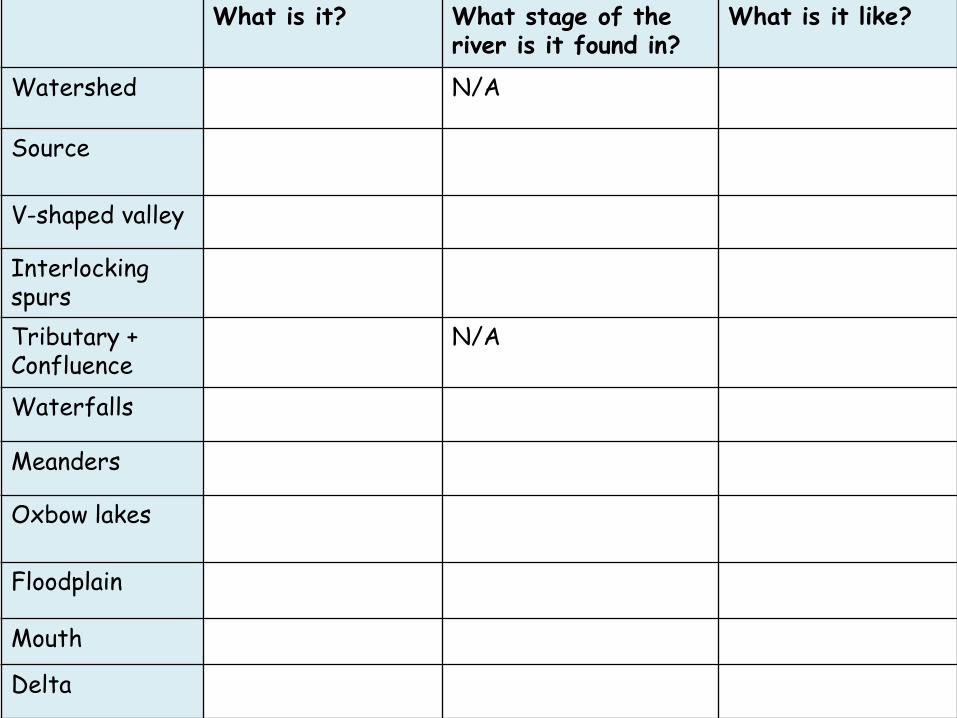
What is it? What stage of the river is it found in?
What is it like?
Watershed N/A
Source
V-shaped valley
Interlocking spurs
Tributary + Confluence
N/A
Waterfalls
Meanders
Oxbow lakes
Floodplain
Mouth
Delta

What features can you tell from a map?

The Flood / Storm Hydrograph•Hydrographs are used to show the relationship between
precipitation and discharge (the amount of water
passing in the river channel).
•Hydrographs are used to predict whether a river is likely
to flood.
•Discharge is measured in Cumecs (cubic metres of
water per second).
•Lag Time is the delay between peak
precipitation and peak river discharge.
•Short Lag Times means water enters the
river system very quickly following rainfall
•Long Lag Times means water takes a longer
time to enter the river system following rainfall
This could be for an urban location,
quick surface runoff and less infiltration
This could be for a rural location, slow surface runoff and more infiltration

•Sh
ort
la
g t
ime
s =
are
ca
use
d b
y s
tee
p s
lop
es , im
pe
rme
able
ro
ck, sp
ars
e v
ege
tatio
n a
nd
a s
ma
ll
dra
ina
ge b
asin
. T
he
se
me
an
su
rfa
ce
run
-off
is h
igh
so
wa
ter
en
ters
th
e r
ive
r qu
ickly
fo
llow
ing
pre
cip
ita
tion.
•Lo
ng
la
g t
ime
s =
are
ca
use
d b
y g
en
tle
slo
pe
s, p
erm
eable
rock, d
en
se
ve
ge
tatio
n a
nd
a larg
e
dra
ina
ge b
asin
. T
he
se
me
an
su
rfa
ce
run
-off
is low
er,
th
ere
is m
ore
inte
rcep
tion a
nd
infiltra
tio
n s
o
wa
ter
take
s lon
ge
r to
ge
t to
th
e r
ive
r ch
an
nel.
Lag
tim
es a
re s
ho
rtif
wat
er c
ann
ot
infi
ltra
te o
r is
no
t in
terc
epte
d, i
t m
ean
s w
ater
fro
m p
reci
pit
atio
n is
en
teri
ng
the
rive
r fl
ow
ver
y q
uic
kly
+ th
ere
is m
ore
su
rfac
e ru
no
ff, e
.g. C
ou
ld b
e an
urb
an d
rain
age
bas
in
Lag
tim
es a
re lo
nge
rif
wat
er c
anin
filt
rate
or
gets
inte
rcep
ted
, it
mea
ns
wat
er is
tak
ing
lon
ger
to e
nte
r th
e ri
ver
chan
nel
+ t
her
e is
less
su
rfac
e ru
no
ff, e
.g. C
ou
ld b
e a
rura
l dra
inag
e b
asin
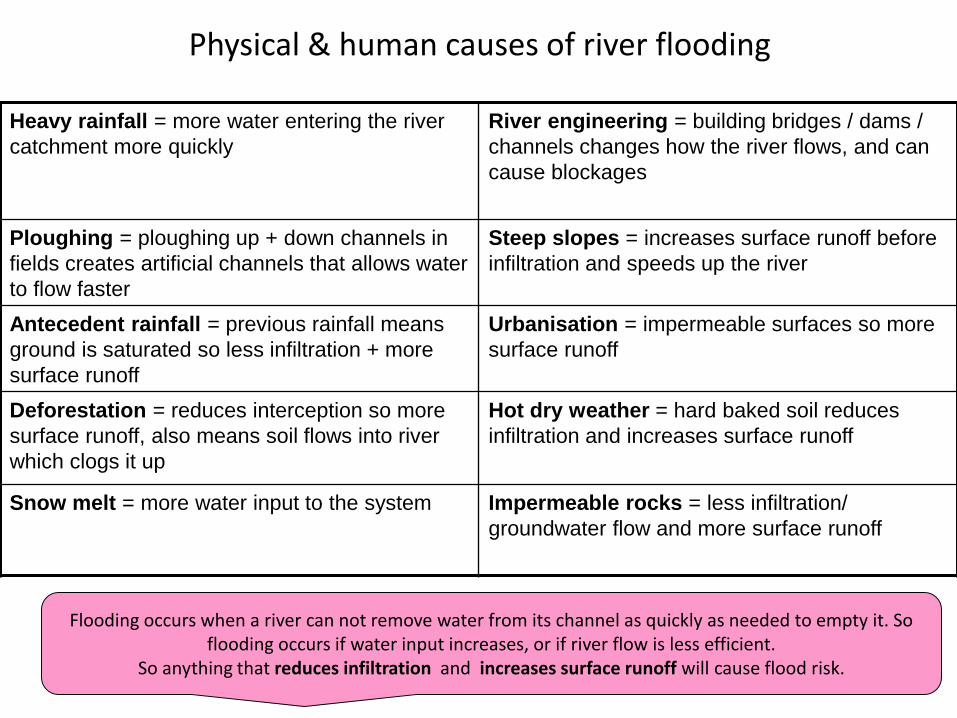
Heavy rainfall = more water entering the river
catchment more quickly
River engineering = building bridges / dams /
channels changes how the river flows, and can
cause blockages
Ploughing = ploughing up + down channels in
fields creates artificial channels that allows water
to flow faster
Steep slopes = increases surface runoff before
infiltration and speeds up the river
Antecedent rainfall = previous rainfall means
ground is saturated so less infiltration + more
surface runoff
Urbanisation = impermeable surfaces so more
surface runoff
Deforestation = reduces interception so more
surface runoff, also means soil flows into river
which clogs it up
Hot dry weather = hard baked soil reduces
infiltration and increases surface runoff
Snow melt = more water input to the system Impermeable rocks = less infiltration/
groundwater flow and more surface runoff
Physical & human causes of river flooding
Flooding occurs when a river can not remove water from its channel as quickly as needed to empty it. So flooding occurs if water input increases, or if river flow is less efficient.
So anything that reduces infiltration and increases surface runoff will cause flood risk.

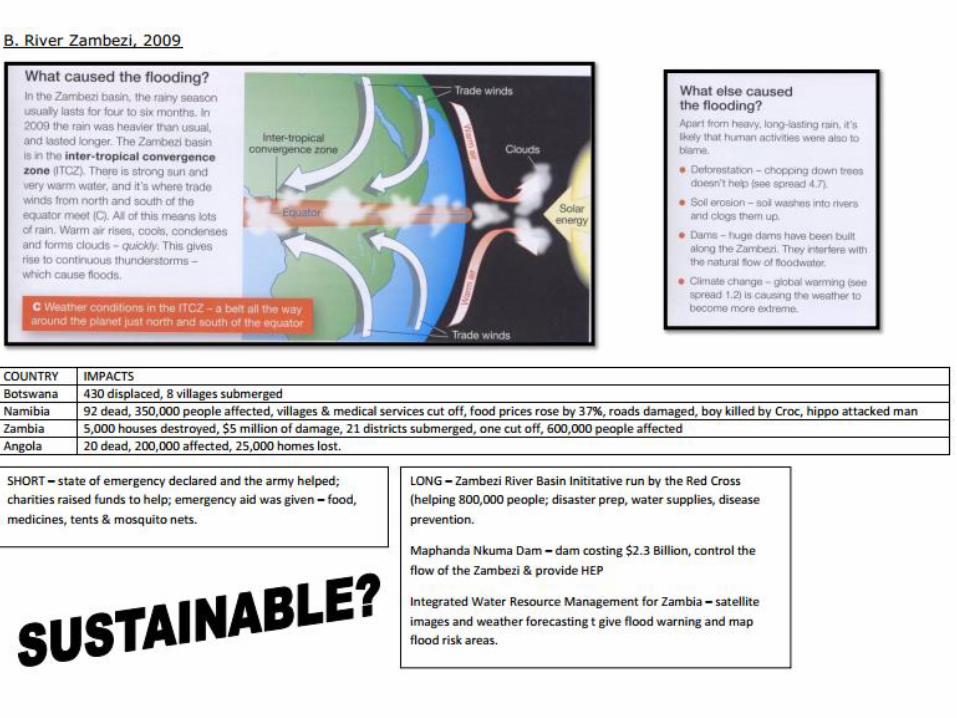

River Zambezi floods Effects
River levels rose by 8 meters, record
levels not recorded since 1963.
Flood water quickly inundated houses
and villages in the Okavango and
Caprivi regions. Huts were constructed
from mud and straw and located within
the flood plain.
700,000 people, or 33% of the total
population of Namibia, were affected by
the flooding
50,000 people we displaced from their
homes.
102 people lost their lives. Villages were cut off by the floodwater.
N$1.1 billion (US$136.4 million) of
economic assets were lost and the
economy reduced by a further N$637
million.
9,000 people were relocated to camps.
These camps had insufficient water
supplies and inadequate sanitation
facilities. In one camp 4000 people
shared two latrines.
The local authorities were unable to
response to the scale of the disaster
Major road access was cut in northern
Caprivi at four locations, limiting access
to health clinics.
Only four out of eleven health clinics
were functioning immediately following
the disaster.
Local relief efforts were hampered by
poor information from the Zambezi River
Basin Authority.
Urban areas were also affected. Cities
in Ohangweena and Oshakiti saw
pumping stations fail and flood water
mixed with sewerage.
Higher water levels boosted fisheries as
more fish became available.
45,000ha of agricultural land was
destroyed and 3,000 livestock (mainly
goats) were lost. Farming is the main
economic activity in the flooded areas.
On March 2009 the
President of the Republic of
Namibia declared a state of
emergency.
The Government allocated N$109 million (US$13million)for the response.
110 relocation camps were established.
International Aid was donated the Namibia with the UN sending approximately $4.2 Million. A total of US$7 million was donated.
Human Response

LEDC Case Study: The River Zambezi Floods, 2009
Deforestation within the
drainage basin So what?
Soil erosion due to drought
and overgrazing So what?
Dams have been build along
the Zambezi So what?
Climate change So what?
The rainy season in the area usually lasts
4-6 months. In 2009 the rain was heavier
than usual and lasted for longer. So what?
e.g. Therefore this meant soils
were saturated therefore less
infiltration and more surface runoff
Drainage systems we
unable to handle the huge
volumes of waterSo what?

MEDC case study: Brisbane floods
• Brisbane River, Queensland, Australia.
• January 2011
• Causes – Tropical Cyclone Tasha (natural hazard) & La Nina event (weather event that brings prolonged heavy rains – wettest December ever, 209mm & raises sea level), (some also blame sea level temp rise)
Response: Military evacuation of thousands of people Emergency Management Queensland in charge Metal flood barriers near Rockhampton Closed airports / highways / ports Evacuation centres in universities / schools Thousands of volunteers to help clear up / search and rescue as well as Fire Brigade
/ Police Raised over $40million in aid in the first two weeks

¾ of Queensland state
declared a disaster zone.
70 towns flooded, 200’000
people affected
Panic – food supplies low,
looting
Over 25,000 homes were
flooding in Brisbane.
43 people died in incidents
related to the flooding.
30 suburbs were flooded in
Brisbane.
Estimates suggest Australia’s
GDP will be reduced by A$30
billion (£18.64 billion) due to
the floods.
An area larger than France and
Germany combined was under
water.
As the floods receded, putrid
mud and debris was left
throughout the city creating
health hazards.
$3billion in damages. Australia
is the world’s largest
exporter of coking coal, used in
steel production. Much of it
comes from Queensland’s
mines, many of which were
flooded.
Over 100,000 properties had
their electricity cut off as a
precaution against the flooding
of electricity substations.
Australia is the world’s 4th
largest exporter of wheat. The
rain damaged the crop so the
wheat could not be used for
bread and was downgraded to
use as animal feed, causing
heavy losses for farmers.
Categorise into social, economic, environmental impacts

River management: Hard + Soft Engineering
Hard Engineering Soft Engineering
Dams Wash lands
Embankments Land-use
zoning
Flood Walls Afforestation
Straightening and
deepening the river
Warning
systems
Storage areas Ensure you can evaluate the advantages and
disadvantages of each scheme.
Be able to evaluate sustainability in social, economic
and environmental sense.

Coast The maximum distance over which waves can travel is known as the…
Fetch One of the erosion processes that involves large waves hurtling beach
material at a cliff is called……..
Abrasion The landform created along stretches of less resistant coastlines (i.e.
areas made of clay) are known as…….
Bays The name given to waves with a weak swash but strong backwash is……
Destructive The process that involves beach material being dropped is more
technically known as….
Deposition What is the name given to the predominant force affecting the coastal
landscape of the UK…….
Prevailing Winds The process that carries material up and down the beach is known
as…….
Long shore Drift What is the name of the process that carries / returns wave energy back
down the beach
Backwash The erosion process that breaks up large boulders into small particles by
bumping them against each other is known as…..
Attrition The areas of land left protruding into the sea as they are more resistant
to wave erosion are called…..
Headlands The force of waves compressing air into cracks in a cliff is an erosion
process called…
Hydraulic Action Coastlines can dissolved by salts and acids in seawater. This is also
known as….
Corrosion The narrow contact zone between land and sea is more commonly called
the…
Coasts: Match the keyword with its meaning

Waves & longshore driftThere are two main types of waves:
• Constructive vs Destructive
• Constructive waves build up the beach, whereas destructive waves remove material and reduce the beach. They form different landforms.
Longshore drift: the process of material being moved along coast by waves in direction of prevailing wind. Shapes beaches, creates spits.

The geology of the coast affects how much it is eroded.
This is differential erosion.
More resistant rocks (e.g. chalk) erode more slowly than less resistant rocks (e.g. clay, limestone)
This gives us BAYS
And HEADLANDS
Coastlines are made of alternating layers of harder (more resistant) and softer (less resistant) rocks.This geology influences what landforms are created.

Impact of geology: O.S. Map of Ballard point, Jurassic Coast.
What type of rock do you think the
headland might be made from? …...
………..............................................
What effect does this have?.............
…………………………………………
What type of rock do you think the
headland might be made from? …...
………..............................................
What effect does this have?.............
…………………………………………
What type of rock do you think the
bay might be made from? ………….
.........................................................
What effect does this have?.............
…………………………………………

• So how do cliffs and wave-cut platforms form?
- The erosion of a cliff is greatest at its base where large waves break - hydraulic action, abrasion and attrition constantly undercut the foot of the cliff
- This forms a dent called a wave-cut notch
- The cliff face is also affected by abrasion as rock fragments are hurled against the cliff by the breaking waves.- The undercutting continues and eventually the overhanging cliff becomes so heavy it collapses downwards -this process continues over time and the cliff gradually retreats inland and becomes steeper.- As the cliff retreats, a gently-sloping rocky platform is left at the base, this is known as a wave-cut platformwhich is exposed at low tide.

Lulworthcove
• Lulworth Cove, on the Jurassic coast in Dorset, has a geology which is a mix of different rocks which have been tilted upwards over the years to become nearly vertical.
• Millions of years ago, a river rain through the rocks to the sea. This allowed sea water to erode the rocks. First the limestone was eroded, then the sea reached the softer rocks of clay and sands and very quick erosion happened.
• Eventually, the sea eroded back in to the land until it reached the resistant chalk. Here the erosion slowed down. This made the perfect horseshoe-shaped bay you can see.
• Eventually this cove will erode further back and join another cove, to form one massive bay.

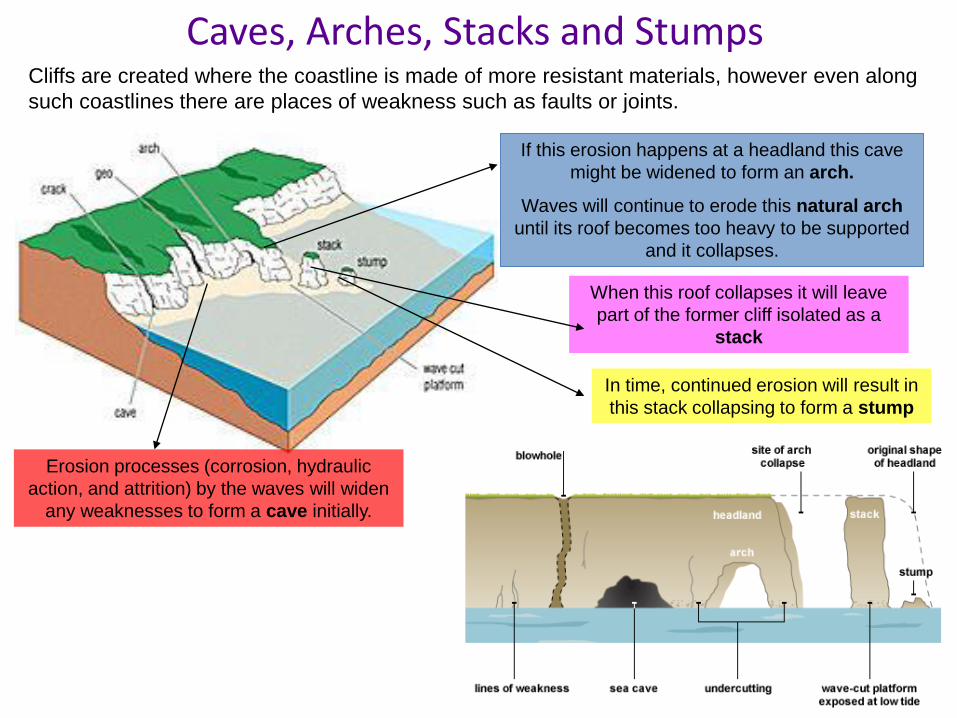
Caves, Arches, Stacks and StumpsCliffs are created where the coastline is made of more resistant materials, however even along
such coastlines there are places of weakness such as faults or joints.
If this erosion happens at a headland this cave
might be widened to form an arch.
Waves will continue to erode this natural arch
until its roof becomes too heavy to be supported
and it collapses.
When this roof collapses it will leave
part of the former cliff isolated as a
stack
In time, continued erosion will result in
this stack collapsing to form a stump
Erosion processes (corrosion, hydraulic
action, and attrition) by the waves will widen
any weaknesses to form a cave initially.

Beaches, spits, bars & tombolos
Coasts are not just eroded, they are also built up by deposition –this is when eroded material is dropped off and builds up over time
This creates beaches
Deposition happens when waves are constructive (so the swash is bigger than backwash so material gets moved up on to the beach).
Material is moved by the sea and can travel miles
Beaches, spits, bars and tombolos are created by deposition and transportation
Beaches develop when the supply of sediment exceeds any sediment lost through backwash and longshore drift. They can be steep shingle or flatter sand.
Where there is a change in the coastline e.g. a headland or an estuary mouth, longshore drift may continue to deposit sediments into the sea forming a spit. E.g. Mudeford Spit at Hengistbury Head
Local currents and changes in wind direction may curve the end of the spit landwards creating a hooked tip. This is a recurved spit.
If a spit joins on to one part of the mainland to another it is called a bar.
Where a spit joins the mainland to an island a tombolo may be created. The longest and best known tombolo in Britain is Chesil beach.

Coastal erosion & management
• Highcliffe, Dorset & Barton-on-Sea, Hampshire• Beach management is a political issue. The two councils do not
agree about coastal management because each area has different values.
• The geology is very soft. The cliffs are layers of sand and clay – very soft rocks, un-resistant to erosion.
• What one council does to protect its coast, has a big impact on the other coastline – e.g. Groynes at Highcliffe trap sediment which starves beaches downcoast at Barton, meaning they are more vulnerable to erosion
• In 1950, both areas were receding at 2metres per year due to cliff slumping.
• Highcliffe installed hard and soft engineering (including rock armour, rock groynes, cliff reshaping, beach replenishment, etc,.) to protect valuable properties and businesses (to ‘hold the line’) whereas Barton decided upon ‘managed retreat’ due to lower land value.

What has happened here? Why?What has happened here? Why? What is this? Why has it been built? How does it work?
Land use here:This is the border between Hampshire and Dorset. Why is that important?:
Land use here:
Coastal Management along Highcliffe and Barton on Sea
Barton on Sea, Hampshire
Highcliffe, Dorset
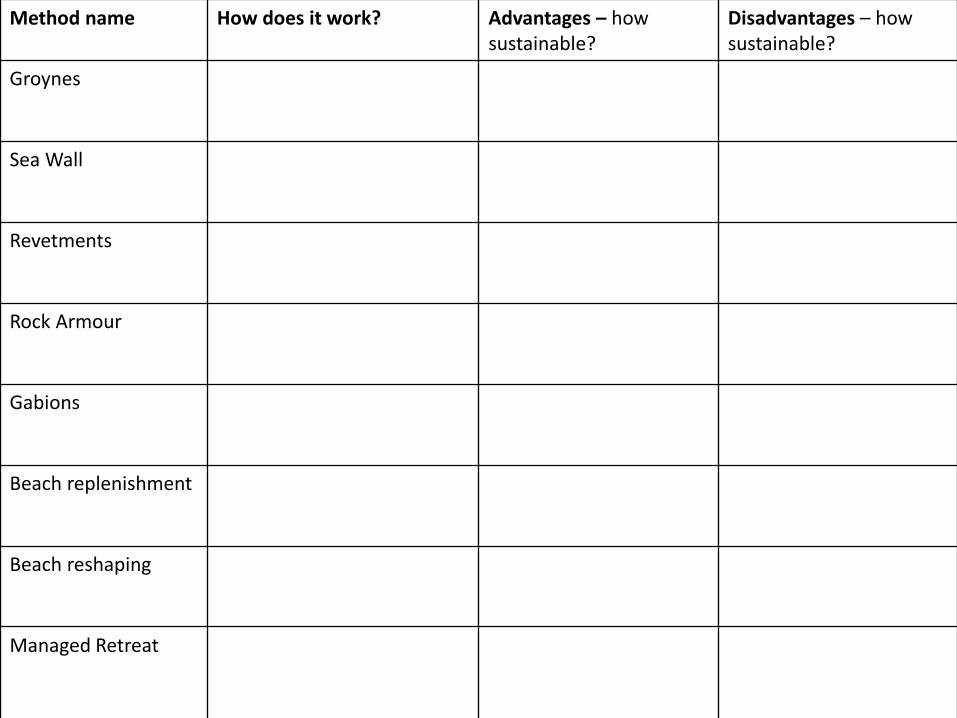
Method name How does it work? Advantages – how sustainable?
Disadvantages – how sustainable?
Groynes
Sea Wall
Revetments
Rock Armour
Gabions
Beach replenishment
Beach reshaping
Managed Retreat

Economic Development
Need to know:• Industry types (primary, secondary, tertiary, quaternary)
• Industrial location (how it varies depending on type of work done)
• Changes over time
• Employment patterns (e.g. between MEDC and LEDC)
• Trade & globalisation
• Aid (Goat Aid, sustainable aid, girl effect)
• Multi-national companies (e.g. Coca Cola, BP)
• Effects of industry on environment (e.g. Coca Cola, tourism)
• Development indicators (e.g. birth rate, death rate) & development gap
• Case studies: Goat Aid, Coca Cola, Gunwharf Quays, etc,.
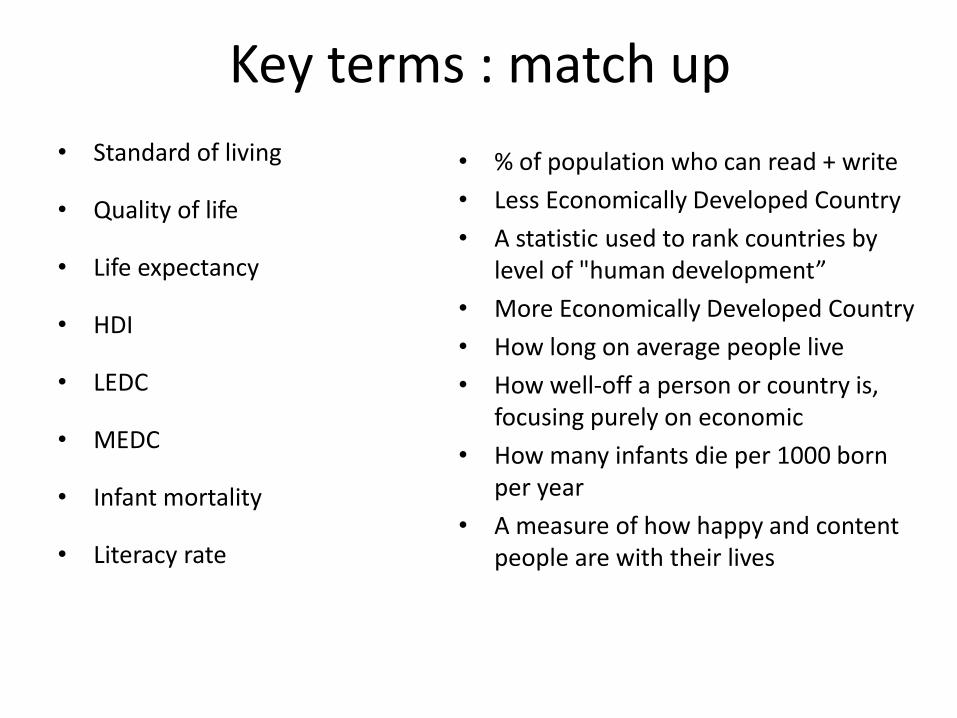
Key terms : match up
• Standard of living
• Quality of life
• Life expectancy
• HDI
• LEDC
• MEDC
• Infant mortality
• Literacy rate
• % of population who can read + write
• Less Economically Developed Country
• A statistic used to rank countries by level of "human development”
• More Economically Developed Country
• How long on average people live
• How well-off a person or country is, focusing purely on economic
• How many infants die per 1000 born per year
• A measure of how happy and content people are with their lives
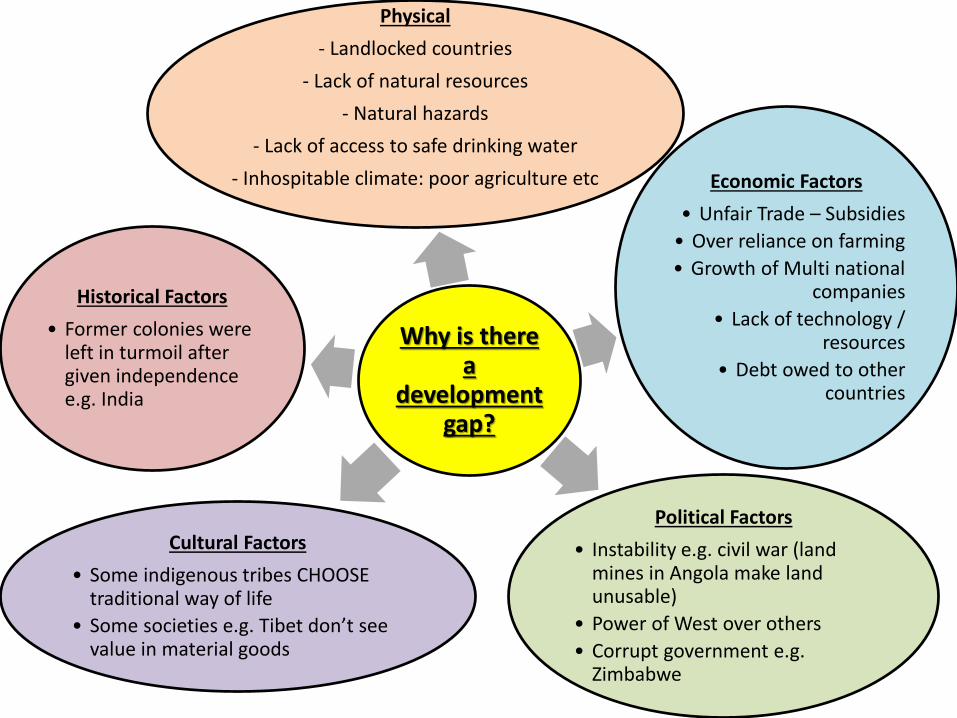
Why is there a
development gap?
Physical
- Landlocked countries
- Lack of natural resources
- Natural hazards
- Lack of access to safe drinking water
- Inhospitable climate: poor agriculture etc Economic Factors
• Unfair Trade – Subsidies
• Over reliance on farming
• Growth of Multi national companies
• Lack of technology / resources
• Debt owed to other countries
Political Factors
• Instability e.g. civil war (land mines in Angola make land unusable)
• Power of West over others
• Corrupt government e.g. Zimbabwe
Cultural Factors
• Some indigenous tribes CHOOSE traditional way of life
• Some societies e.g. Tibet don’t see value in material goods
Historical Factors
• Former colonies were left in turmoil after given independence e.g. India

CASE STUDY EXAMPLES
Physical Factors – Bangladesh flooding
• Regularly occurs due to monsoon season
• Destroys buildings, infrastructure and communications
• Can damage destroy crops and animals
• Contaminates drinking water
Economic Factors –Zimbabwe debt
• Massive international debt – owes 145% of its
total $GDP
• No money to invest in industry / infrastructure
Political – Sudan’s Civil war
- Arab vs non Arab communities
- Fighting over grazing rights & land
- Burnt farmlands, schools, hospitals
- In 2004 approx 50’000 deaths mainly due to starvation, 200’000
refugees
Cultural Factors – e.g. Tibet society
• Buddhist monk society
• See no value in capitalism / money
• Choose freedom from stress, simple lifestyles
Historical – India colony
- Former British colony
- Left in political confusion, after being dragged through war
- Introduced new diseases from UK

Types of industry & employment (PSTQ)
Primary industries = ‘take it’ (e.g. miners, farmers)
Secondary industries = ‘make it’ (e.g. builders, mechanics)
Tertiary industries = ‘service it’ (e.g. doctor, engineer)
Quaternary industries = ‘think it’ (e.g. computer scientist, research & development) Q
T
S
PH
igh
er s
alar
y &
ski
lls
High
er nu
mb
er of w
orkers

Changes over time
Outsourcing = saves money, work sent elsewhere to save costs (e.g. call
centres)
Technology = advances in ICT
means more work from home
Transport = commuting & migrating easier because
there are now fewer barriers to travel
Rising costs = wage levels / laws etc, means costs go up in MEDCs so work moves elsewhere
(e.g. manufacturing)
Competition = fewer people are
needed to complete work
now, e.g. banking uses ICT
Why do LEDCs and MEDCs have different
employment patterns?
Why do employment patterns change over
time?
Why does industrial location change over
time?
Why are more workers in primary employment in LEDCs and more tertiary
in MEDCs?

What might be the effects of a decline in primary or secondary industries on that area?
On the environment?
On local society?On the
economy?
• What do different industries need access to?
Primary? E.g. near resources
Secondary? E.g. transport links
Tertiary? E.g. near consumers
Location factors
Raw materials
Government policy
Availability of markets
Capital(money)
Transport links
Labour(skilled / cheap)
Environment
Energy supply
Primary example = Kaweh Ijen volcano, sulphur miningSecondary = Samsung
manufacturing, South KoreaTertiary = retail / services in
Portsmouth, UKQuaternary = research and
development Portsmouth IBM Science Park

GLOBALISATION = Global interconnectedness & interdependence.
We are linked globally, sharing culture, technology, products, etc. International
division of labour.
• Accused of exploiting NICs/ LEDCs• Has bottling / manufacturing plants in India, Venezuela,
etc., where labour + land costs are low, health and safety is minimal, etc.
• E.g. over-extracting water in India (it takes 3litres of water to make 1litre of coke) – e.g. Kerala village loses 100’000litres of water a day
• In Rajahstan, India – Coca Cola took over the local water supply leaving agriculture to suffer
• The water table dropped 10m• Also used pesticides 30x above recommended levels
• However, Coca Cola invested $1billion into the Indian infrastructure, providing healthcare, roads, services
• Coca Cola employs up to 125’000 people in India
MNC. Coca Cola case studyHow can industry affect the
environment?
Positive and negative impacts?
What would be the effects of primary
industry? Secondary? Tertiary?
How can economic activity be
sustainable?

Impact of MNCs: social, economic, environmental
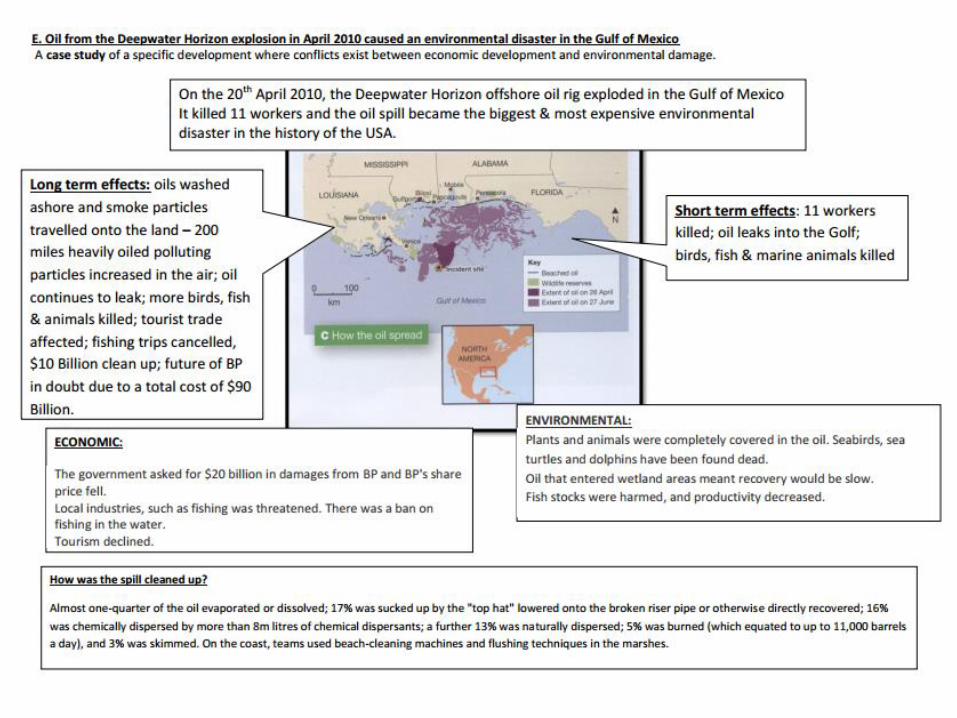
BP
• Where located?
• What happened in the Gulf of Mexico?
• Management?
Coca Cola
• Where located?
• Positive impacts?
• Negative impacts?
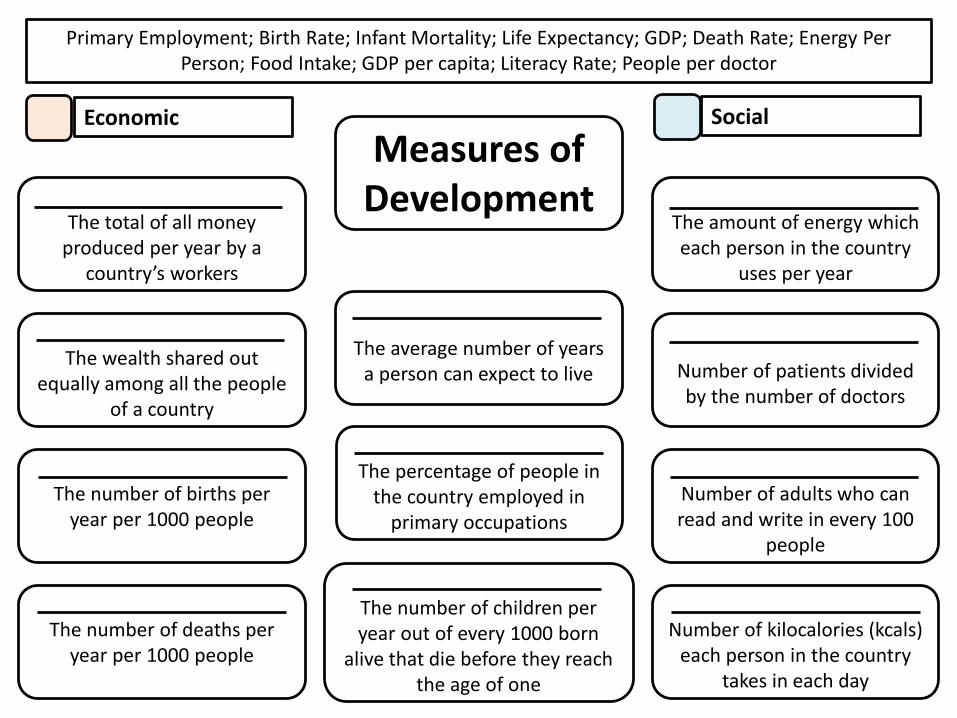
Measures of Development
The total of all money produced per year by a
country’s workers
The percentage of people in the country employed in
primary occupations
The average number of years a person can expect to live Number of patients divided
by the number of doctors
The amount of energy which each person in the country
uses per year
The number of deaths per year per 1000 people
The wealth shared out equally among all the people
of a country
Number of adults who can read and write in every 100
people
The number of children per year out of every 1000 born
alive that die before they reach the age of one
Number of kilocalories (kcals) each person in the country
takes in each day
The number of births per year per 1000 people
Primary Employment; Birth Rate; Infant Mortality; Life Expectancy; GDP; Death Rate; Energy Per Person; Food Intake; GDP per capita; Literacy Rate; People per doctor
Economic Social

Questions to think about
• Describe the pattern of development that is shown in the image [3marks]
• Suggest some factors that influence the speed and level of development in a country [3marks]
• Why might birth rates be high in LEDCs? [2marks]
• Why would an MEDC have lower death rates? [2marks]

GLOBALISATION = Global interconnectedness & interdependence.
We are linked globally, sharing culture, technology, products, etc. International division of labour.
• International trade links (e.g. the EU, etc.)
• Development of Multinational Companies (MNCs) working in NICs
• Government support
• Free trade system
• Improved technology
• Easier transport links
• Flexible migration of workers (e.g. Europe)
Why is globalisation happening?


Employment Changes over time
Primary decrease Secondary decrease Tertiary increase
• Improvements in technology
leads to more machines that
require fewer workers
• Raw materials such as coal
and iron ore become cheaper
to import from foreign
competitors than to extract
them.
•Jobs in primary sector are
seen as being ‘dirty’ and have
fewer career prospects
• Decline in secondary industry
from the 1990s due to cheaper
labour availability in LEDCs
such as China.
• Factories and new technology
is able to manufacture goods
more efficiently using fewer
people.
• Huge increase in high-tech
industries, electronics and
research and development.
• Urban populations increase
so need support and food to be
transported and sold.
• Aspirations increase – people
want more luxury

Naval Shipyard: Secondary
Positive Location Factors:
Negative Location Factors:
Gunwharf: Tertiary
Positive Location Factors:
Negative Location Factors:
IBM: Quaternary
Positive Location Factors:
Negative Location Factors:
Farming: Primary
Positive Location Factors:
Negative Location Factors:

So, what is ‘aid’?
• Aid is help that is given from one country to another in need –usually from MEDCs to help LEDCs/ LDCs (or to countries suffering from a sudden disaster)
• Short term vs long term (more sustainable)
• official government aid / voluntary aid / bilateral aid (tied aid)
• Non-Governmental Organisations (NGOs) = private group that works in other countries but is free from government control, E.g. Red Cross, Oxfam, Greenpeace
• Good aid (sustainable) = targeted aid, sustainable because invests in projects like education, healthcare, services, training for jobs
CASE STUDIES = Goat Aid, Tanzania or Water Aid, Mali

Aid• Aid is help that is given from one country to another in need – usually from MEDCs to help LEDCs/
LDCs (or to countries suffering from a sudden disaster)
• There are different types of aid that can be given: short & long term and a variety of different services / goods provided
• Non-Governmental Organisations (NGOs) = private group that works in other countries but is free from government control, E.g. Red Cross, Oxfam, Greenpeace
• Good aid is sustainable aid and combines long and short term aid projects while educating local people and providing opportunities to improve infrastructure, government, education, healthcare and water supplies as well as human rights.
CASE STUDIES:
Water Aid
Goat Aid
• E.g. Mali
• Inhospitable climate (low precipitation, 65% country as desert, desertification problems, only 50% of population has access to safe drinking water)
• Water Aid working here since 2000
• Provide clean water + sanitation to the slums
• Local community investment, education schemes, hygiene improvements
• Successful at reducing waterborne disease+ deaths from diarrhoea by 65%
• E.g. Tanzania through Oxfam
• Unreliable rainfall, high populations = pressure on land and poverty
• Project run by Oxfam. A pair or flock of goats is donated to a family. Can be used to breed, produce milk & cheese, for fur, etc,. Increases family income.
• Sustainable if part of a cycle & bred because improves nutrition and therefore health, can sell milk/cheese/meat/fur to make an income which can invest in education and training therefore better employment chances. Likely to lead to healthier and wealthier families.
• Particularly good when given to girls (‘the girl effect’)
• Risk of overgrazing and desertification if not managed properly

Types
of Aid
Multilateral AidShort Term
e.g.
Voluntary AidBilateral Aid
Long Term
e.g.
Define these terms
and give an
example
Aid can be sustainable when it:

In camps in Sudan, Oxfam provides temporary shelter and hygienic toilets.
Providing more than 450,000 refugees with access to clean, safe water and sanitation
Oxfam also provide
basic necessities
such as food,
blankets and jerry
cans for carrying
water.
Community volunteers
are involved to educate
others about sanitation
and personal hygiene
We send engineers,
well drillers,
administrators, and
support staff needed
are sent to areas in
need.
UK supporters can raise
funds for ‘Goat Aid’ to
provide goats for families
for longer term solutions to
food crises
Training is provided for
local people. To help
individuals to develop
small businesses to
become self-sufficient
and sustainable.
Children are taught about
hygiene & basic healthcare.
E.g. Food and water
preparation & storage, why
wash their hands, etc.,.

Natural Hazards: Need to know
• Plate boundaries (divergent, convergent, transform)
• Structure of the earth & convection
• Tectonic hazards: distribution patterns, causes, impacts, management
• Climatic hazards: distribution patterns, causes, impacts, management.
• How to plan, predict, prepare for hazards
• Why people choose to live in hazard areas
• Case studies: LEDC and MEDC for each type

Describe the distribution of tectonic hazards? ………………………………………… ……………………………………………………….. ……………………………………………………….. ……………………………………………………….. Explain the link between the location of tectonic hazards and continental plates : ........................... ……………………………………………………….. ……………………………………………………….. ………………………………………………………..

What happens when the plates meet?
Type of Margin Description of Changes Earthquake / Volcanic activity Examples
Convergent (oceanic
and continental)
Oceanic crust is denser than continental crust = subductionoccurs (sinks into the mantle)Sinking crust melts under friction & pressure…forms magma = creates volcanoes
Nazca plate, South
America
Convergent (two
continental)
If both plates are continental, then they are both too light to really subduct. Collision occurs = forms mountain chains
Himalayas
Divergent on Land A.K.A. ‘constructive’ boundaryAs plates diverge, this allows magma to the surface. When crusts diverge on land, it forms a rift valley.
Mid-Atlantic ridge in
Iceland
Divergent under the
Ocean
When plates diverge under the ocean, magma rises to the surface to create new land. As magma rises it cools, forming mountains / volcanoes / land.
The Mid-Atlantic Ridge is the biggest area of divergence
Transform Where plates slide past each other. Creates a lot of earthquakes as friction builds up then one plate jumps forward.
San Andreas Fault,
California

divergent
convergent
transform
Fault: A fracture in the Earth’s crust that shows signs of movement
Continental drift: the movement of the continents over time through plate tectonics
Subduction Zone: the area of a destructive plate boundary where one plate descends beneath another
Convergent (aka destructive): where plates collide together, forcing one plate downwards to form either volcanoes or mountains or trenches
Divergent (aka constructive): where plates are moving apart, allowing magma from the mantle to reach the earth’s surface + create new land
Transform: where plates slide past each other, causing lots of earthquakes
Continental Crust: lighter, permanent land that forms our continents
Oceanic Crust: denser crust under the oceans, constantly recycled

Causes of volcanic eruptions
Volcanoes form when magma reaches the Earth’s surface,causing eruptions of lava and ash.• They occur at destructive (collision/convergent) boundaries
where plates collide, subduct and melt to release magma.They also occur at constructive (divergent) boundaries whereplates separate and allow magma to reach the surface.
• Immediate effects of eruptions can be devastating, but thereare benefits in the long term (such as fertile soils, minerals,sulphur mining, etc,.
• Many volcanoes occur underwater along the ocean floor.
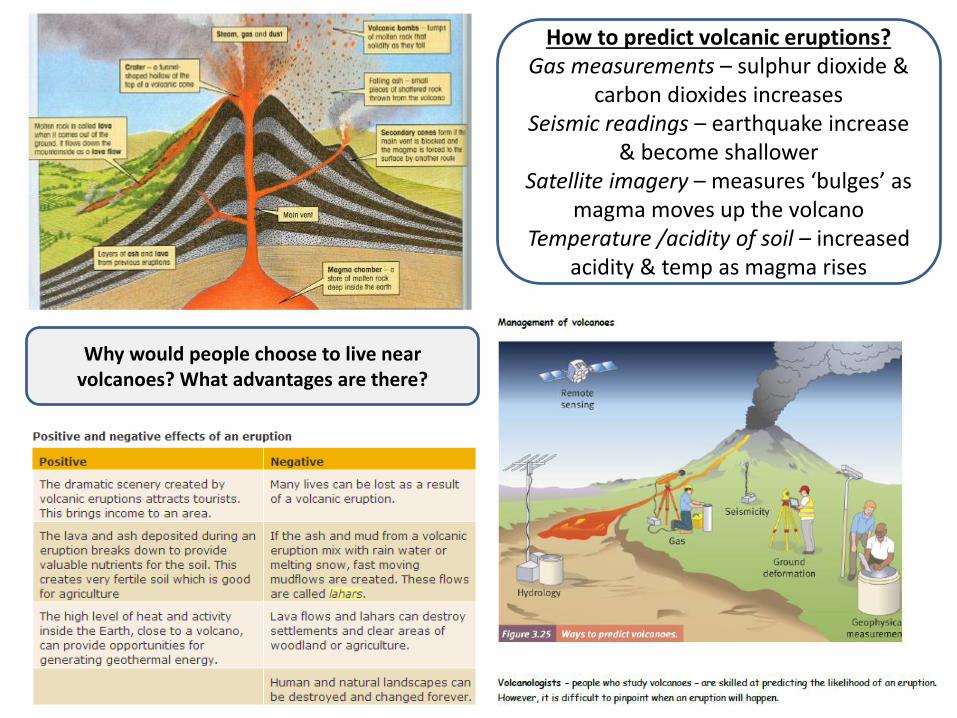
Why would people choose to live near volcanoes? What advantages are there?
How to predict volcanic eruptions?Gas measurements – sulphur dioxide &
carbon dioxides increasesSeismic readings – earthquake increase
& become shallowerSatellite imagery – measures ‘bulges’ as
magma moves up the volcanoTemperature /acidity of soil – increased
acidity & temp as magma rises

What were the main events of the Iceland eruption
between 19th March and 16th April 2010?
14-16th April.
Over the next four days, ash
was ejected up to 8 km high
in the atmosphere and lava
flowed up to 3 km from the
main vent.
1.15am 14th April.
Eyjafjallajökull burst open once more
and a fissure opened through 200m of
ice covering the volcano. A huge cloud
of tephra and ash started to come out
of the volcanic vent.
13thth April
A series of shallow
earthquakes were recorded
12th April.
A second volcanic fissure
opened during an earthquake
measuring 3.2 magnitude
beneath Eyjafjallajökull and
many smaller earthquakes
were recorded
Many thought that the
eruption was over.
31st March. New basalt (the
rock created by cooling lava)
covered around 1 square
kilometre
This eruption produced a spectacular ‘volcanic Disneyland’ and tourists flocked to the site to see amazing lava flows.
20th March.
At 11:30pm a volcanic
fissure opened at
Fimmvörðuháls, a rocky
area between two glaciers
19th March.
Scientists monitoring the
area measured earthquakes
caused by magma moving into fissures
Start Here
Map compiled by Páll Einarsson and Ásta Rut Hjartardóttir, The Geo-science Institute of the University of Iceland

Airspace closed across much of Europe. At least 17’000 flights a day were cancelled. 95’000 total.
Stock market shares in Air Travel agencies dropped
4%.
The disruption cost airlines more than $200 million a day,
$2billion total.
Grounded air cargo flights stopped delivery of items such as food, flowers, medicines &
mail.
Increased use of Eurostar, train
servicesships and ferries
Less demand for air fuel = 1.87million barrels of oil
not needed = loss of money for oil industry = led to increase in petrol
costs
Loss of some products (like fruit)
at supermarketsIncreased spending by people stranded away – for hotels,
food, etc.
Health impacts – some respiratory problems as
ash settles in Iceland
In Iceland – flash floods as 150m ice melted, damaged fields and homes (20
farms evacuated), Route 1 road & bridges damaged, ash silted and blocked rivers,
but increased tourism
Iceland ‘ashpocalypse’ case study impacts

Earthquakes are measured in two ways: - The Richter scale measures the magnitude of an earthquake using an instrument
called a seismograph. It measures the strength of the shaking. - The Mercalli scale measures the damage caused by an earthquake. It rates each quake
from I to XII, depending on how much damage was done
• Earthquakes occur along faults, which are large cracks in theearth’s crust. Earthquakes can happen along any type ofplate boundary.
• A result of a build up of stress / pressure inside the earth’scrust that is caused by the sudden jerking movements of thefault, and are almost impossible to predict.
• Plate movement is not smooth, plates rub & cause friction &‘stick’. Pressure builds up until the plates snap & stress isreleased = earthquake
• Can occur on any type of boundary (e.g. a consequence ofvolcanic activity or mountain building, or just be along atransform fault)
• Measured on Richter scale by seismometers
• Energy from the stress is released in seismic waves thatspread out from the focus (point inside the crust where thestress is released). The epicentre is the point on top of crustdirectly above the focus. The strongest waves are foundnear the centre of the earthquake. This means that the mostsevere damage caused by an earthquake will happen closeto the epicentre.

Haiti earthquake primary and secondary effects
300,000 people injured Cholera outbreak due to
poor sanitation
250,000 dwellings
destroyed or badly
damaged
International airport
unusable
The heat and humidity
started to decay corpses
left in the rubble, leading
to disease
230,000 Dead People sleeping in the
streets as they feared the
effects of aftershocks on
damaged buildings
No telephone system, no
internet or mobile phone
signal
Electricity Supplies
Damaged
Major confusion – public
were not sure what was
going on
Hospitals destroyed Mass graves dug
Main prison destroyed so
4,000 inmates escaped
500,000 people still living
rough when rainy season
began in March
Key government buildings
destroyed
Haiti’s economy could not
sustain its population
before the disaster, 1 in 5
jobs were lost after the
earthquake
International Migration into
neighbouring Dominican
Republic
Roads blocked 3,000 temporary tent
schools set up
Relied on international aid
for recovery (e.g. charity,
foreign governments)

Effects of earthquakes?
Fires
Buildings destroyed
Diseases from stagnant
water
Landslides
Tidal waves
liquefaction
Injury and death
Consider…
How does the impact of a hazard differ between MEDC
and LEDC?
Why might the impacts on an LEDC be more severe than in
an MEDC?
What measures can be taken to respond to a hazard?
How might the level of development of a country
affect how it can respond to a hazard?

• Forms over warm ocean waters with temperatures of at least 27°C
• Form between the Tropics of Cancer and Capricorn
• Water must be at least 60 m deep• Form in hottest times of the year (May-
Nov in northern hemisphere, Nov - Apr in southern hemisphere)
• Low pressure system (air pressure low)Tropical storms are intense, low pressure systems (depressions) known in different parts of the world as hurricanes, cyclones, typhoons.

How hurricanes formHurricanes need a lot of heat to form and a sea surface temperature of at least 27°C, which is why they usually occur over tropical seas. They also need to be between 5 and 20° north or south of the equator. It works like this:1. Warm and wet air rises and condenses to form towering clouds & heavy rainfall. It also creates a low pressure
zone of air near the surface of the water.2. Rising warm air causes the air pressure to decrease at higher altitudes. Warm air is under a higher pressure
than cold air, so it moves towards the ‘space’ occupied by the colder, lower pressure, air to fill the gap. So the low pressure ‘sucks in’ air from the warm surroundings, which then also rises. A continuous upflow of warm and wet air continues to create clouds and rain.
3. Air that surrounds the low pressure zone at the centre flows in a spiral at very high speeds - at speeds of around 120 km/h (75 mph).
4. The faster the winds blow, the lower the air pressure in the centre, and so the cycle continues. The hurricane grows stronger and stronger feeding on warm air/water from below until they reach land.
Seen from above, hurricanes are huge circular bodies of thick cloud around 450 km (300 miles) wide. The cloud brings heavy rain, thunder and lightning.In the centre is the eye of the hurricane, about 45 km across (30 miles) across. Often there will be no clouds in the eye. Seen from below it will seem calmer, with a circle of blue sky above. The eye is formed because this is the only part of the hurricane where cold air is descending, so is calmer.As hurricanes move inshore, their power gradually reduces because their energy comes from sucking up moist sea air.

Prediction:
Using weather equipment and satellite imagery with computer models to predict the track (direction), intensity and time of tropical storms scientists can make a forecast. But it is imprecise, especially about the intensity.
Preparation:- Store emergency supplies at home (e.g. dried foods, water, torches, rations, radio,
blankets, etc,.)- Have an escape route / safety bunker to hide in- Have an emergency plan (personal one & for towns / cities / emergency services)- Store sandbags for making buildings watertight to prevent flood damage- Raise flood barriers/ levees against the storm surge
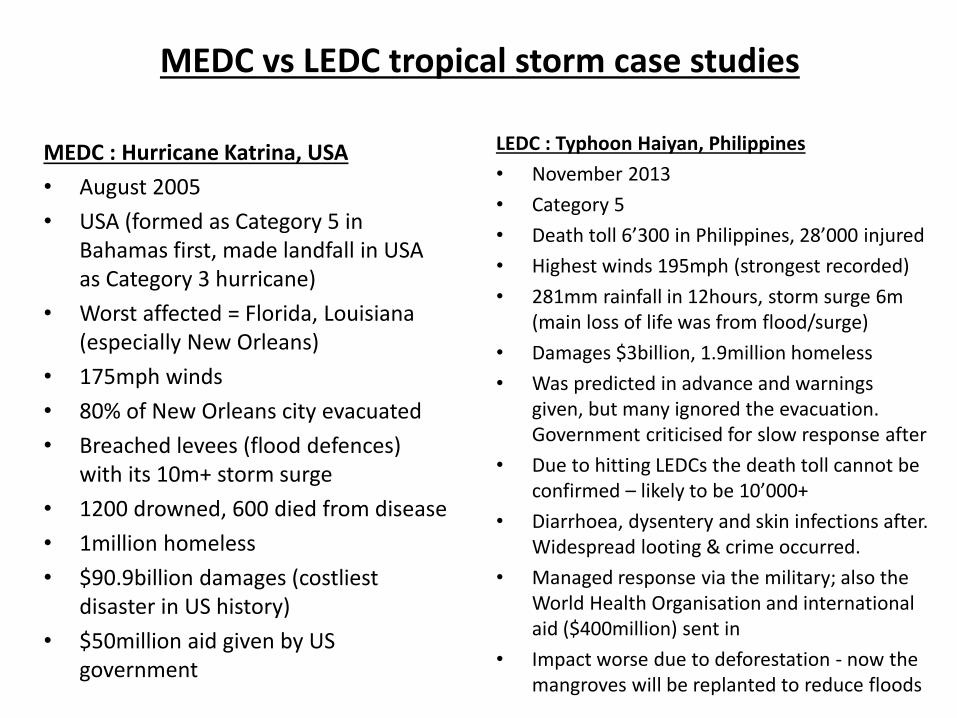
MEDC vs LEDC tropical storm case studies
MEDC : Hurricane Katrina, USA
• August 2005
• USA (formed as Category 5 in Bahamas first, made landfall in USA as Category 3 hurricane)
• Worst affected = Florida, Louisiana (especially New Orleans)
• 175mph winds
• 80% of New Orleans city evacuated
• Breached levees (flood defences) with its 10m+ storm surge
• 1200 drowned, 600 died from disease
• 1million homeless
• $90.9billion damages (costliest disaster in US history)
• $50million aid given by US government
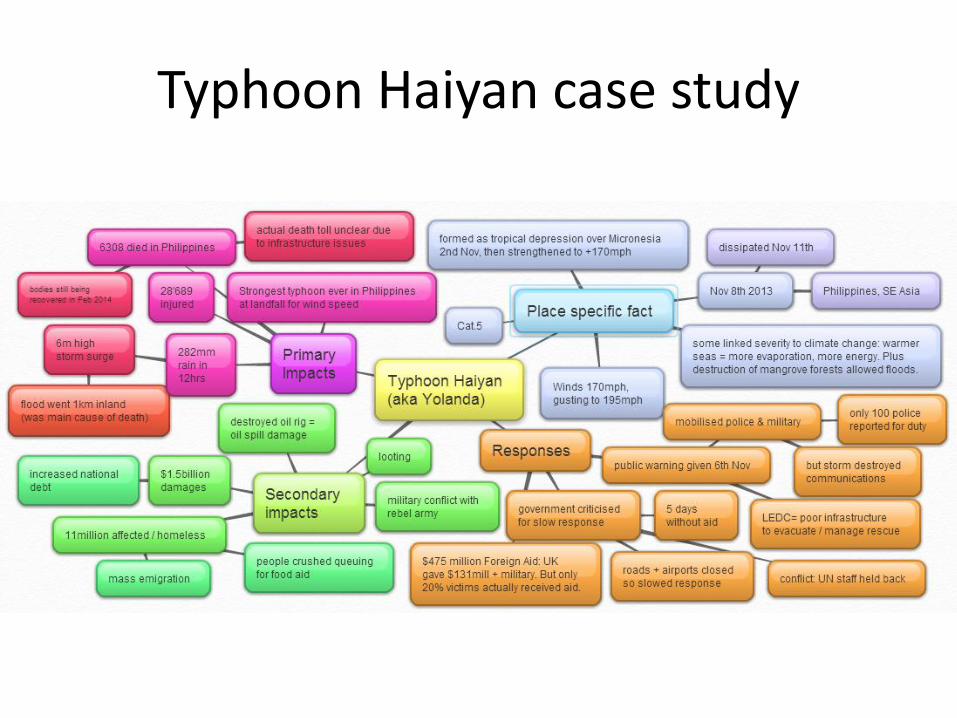
LEDC : Typhoon Haiyan, Philippines
• November 2013
• Category 5
• Death toll 6’300 in Philippines, 28’000 injured
• Highest winds 195mph (strongest recorded)
• 281mm rainfall in 12hours, storm surge 6m (main loss of life was from flood/surge)
• Damages $3billion, 1.9million homeless
• Was predicted in advance and warnings given, but many ignored the evacuation. Government criticised for slow response after
• Due to hitting LEDCs the death toll cannot be confirmed – likely to be 10’000+
• Diarrhoea, dysentery and skin infections after. Widespread looting & crime occurred.
• Managed response via the military; also the World Health Organisation and international aid ($400million) sent in
• Impact worse due to deforestation - now the mangroves will be replanted to reduce floods
Typhoon Haiyan case study

Compare & contrast the impact and management of hazards between MEDC and LEDC case studies.
Vocabulary
MEDC LEDC rural urban sustainablePhysical features Human features climate
infrastructure communications preparationpreparedness tectonic primary effect response
secondary effect impact development
Connectives
however likewise whereas even thoughon the other hand unlike contrasting to
in addition to despite because so as tonevertheless although similarly such as
peners
The impact of hazards is likely to be more severe in………….because……In LEDCs such as Haiti the main impacts were……………………….Whereas in MEDC Iceland the impacts were……………………………..Management of hazards is different between countries, such as…………Impacts of hazards can be reduced by………………………………….
Punctuation

Point 1Hurricane Katrina in August 2005 was the worst disaster in US
history.
Point 3Critics say that the impacts were made
worse by government mismanagement
Point 2When the storm hit Louisiana it was a Category 3 scale
depression.
Make & describe your point
Use place specific evidence (Prove it)
Explain (So What)
Link back toquestion
(Des
crib
e &
exp
lain
th
e im
pac
ts o
f a
clim
atic
haz
ard
yo
u
hav
e st
ud
ied
. 9m
arks
)


Population & Settlement
Population: Need to know• How and why populations change
over time
• Demographic transition model
• Ageing & dependent populations
• Population pyramids
• Overpopulation
• Population management strategies
• Migration
• Impacts of populations on areas
• Case studies: e.g. China, France, Mexico – USA, Brazil
Settlement: Need to know• Why settlements grow and where
• Changes over time
• Land use and land use models
• Changing land use in urban and rural areas
• Urbanisation & counter-urbanisation
• Retail service provision & e-tailing
• Shanty towns
• Sustainable settlements
• Case studies: e.g. Portsmouth, Olympic site, Rio de Janeiro

Keywords check Urbanisation
Push Factor
Pull Factor
Suburb
CBD
Inner city / Twilight Zone
Urban Sprawl
Settlement
Rural
Urban
Infrastructure
Services
Low Order/convenience Goods
High Order/specialist Goods
Counter-urbanisation
Shanty town
The movement of people away from urban to rural areas (often as result of urban overcrowding)
A negative reason which pushes you away from a certain place, e.g. crime
Highly built up areas, e.g. cities & towns
Relatively inexpensive & common goods which are purchased frequently, e.g. milk
The area of more expensive residential development on the outskirts of urban areas
A positive reason that attracts you towards a place, e.g. hope of employment
Central Business District, centre of an urban area with commercial value
The network of basic facilities & services that society needs in order to function, e.g. transport, communications, medical, etc. .
An area/community where people live
The countryside
Useful products / facilities such as shops, schools, libraries, etc. .
Slum areas found in LEDCs, poor quality spontaneous housing
The area usually surrounding the CBD which contains terraced working class housing & industry in MEDC cities
The process of urban areas spreading outwards
More expensive & rarely found goods, e.g. iPads, designer clothing
Process of towns / urban areas becoming bigger over time

2 1
Burgess Urban Model
Zone 1:
Zone 2:
Zone 3:
Zone 4:
Zone 5:
Zone: Example area: Characteristics: Potential problems:
CBD
Industrial
Inner City
Inner Suburb
Outer Suburb
The Hoyt Model
=
=
=
=
=
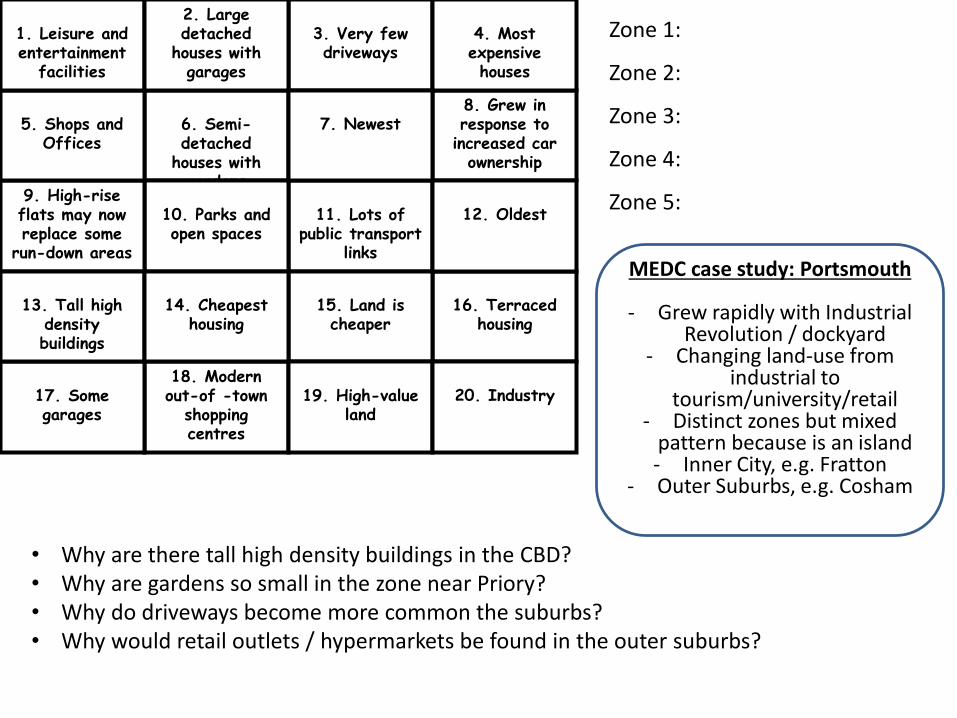
6. Semi-detached
houses with gardens
11. Lots of public transport
links
10. Parks and open spaces
18. Modern out-of -town
shopping centres
16. Terraced housing
17. Some garages
9. High-rise flats may now replace some
run-down areas
5. Shops and Offices
13. Tall high density buildings
1. Leisure and entertainment
facilities
15. Land is cheaper
14. Cheapest housing
19. High-value land
3. Very few driveways
2. Large detached
houses with garages
8. Grew in response to
increased car ownership
12. Oldest
4. Most expensive houses
20. Industry
7. Newest
• Why are there tall high density buildings in the CBD?• Why are gardens so small in the zone near Priory?• Why do driveways become more common the suburbs?• Why would retail outlets / hypermarkets be found in the outer suburbs?
Zone 1:
Zone 2:
Zone 3:
Zone 4:
Zone 5:
MEDC case study: Portsmouth
- Grew rapidly with Industrial Revolution / dockyard
- Changing land-use from industrial to
tourism/university/retail- Distinct zones but mixed
pattern because is an island- Inner City, e.g. Fratton
- Outer Suburbs, e.g. Cosham

Land use model for LEDCs
Describe how the pattern of land-use is different from an LEDC to an MEDC urban area:………………………………………………………….. …………………………………………………………. …………………………………………………………. …………………………………………………………. ………………………………………………………….
Exam Qs:
• Where is the best quality housing found in LEDCs? Why here? (2marks)• Where are shanty towns/ favelas located? Explain why. (3marks)• Describe the characteristics of shanty towns. (4marks)
LEDC urban example: Mumbai, India- Population 13.8million
- Density 29’000 people per km sq- Dharavi shanty town, 1million people per km sq
- Average annual income £2780 per person- Causes of overcrowding: natural increase, urbanisation
- Consequences: shanty town growth, disease, poverty, overcrowding, etc.

Villages/
Hamlets
Villages
Cities
Towns
Capital
Incr
easi
ng
po
pu
lati
on
siz
e &
ser
vice
s
Increasin
g frequ
ency o
f this settlem
ent
Advantages of Brownfield Sites Advantages of Greenfield Sites
Disadvantages of Brownfield Sites Disadvantages of Greenfield Sites
Brownfield site:
Greenfield site:
Environmental

Land use change Portsmouth:
How has Gunwharf changed from 1999-2011?………………………………………………………………………
..............................................................................How has Southsea around Priory changed?
…………………………………………………………………………Why have these changes occurred?
……………………………………………………………………….Are the changes sustainable?
………………………………………………………………………
Case Studies for urban redevelopment / land use change:
Portsmouth (Gunwharf Quays / Southsea) ORLondon (2012 Olympics / London Docklands)
What is sustainability?
How do you think a city can be made
more sustainable?
What problems do cities have
that are unsustainable?

Sustainable urban redevelopment?
BedZed
Gunwharf Quays
London 2012 Olympics

How has retail provision
changed over time?
Quality of Life
Clone towns
Out of town shopping centres / supermarkets
E-tailing
Ethical shopping
MNCs

Settlement hierarchies & sphere of influence
• Smaller settlements = fewer services (mostly low order goods)
• Large settlements = more services (including high order, specialist goods)
• These services affect the sphere of influence
What about?
SuperstoresE-tailing
Clone towns


Portsmouth retail service change
• Change in provision over time from local areas to more centralised• Decline of local goods stores as out-of-town shopping and
superstores increase (e.g. consumers travel to Whiteley village)• Decline of old town centre has been redeveloped into Cascades,
continues to be improved (e.g. new TK Maxx, etc.)• Change of provision from CBD towards Gunwharf – Gunwharf offers
alternative shopping (discount designer) so does not cause too much competition for Commercial Road but still decline of the high street occurs
• Move towards out-of-town supermarkets (e.g. Port Solent hypermarkets, Whiteley retail outlet, etc.) means less trade to local high streets. Small businesses have gone into decline. High Streets now more commonly filled with MNC businesses, e.g. Topshop or Starbucks

Can you identify land use & settlement patterns from different maps?

Is the Gunwharf redevelopment sustainable?
Yes, It is sustainable because:• Mixed land use means that the space is used more often by
different groups of people• As Gunwharf is an outlet area it does not compete directly
with the shops in Commercial Road• Key worker housing and affordable housing have to be
provided as part of the development (e.g. No1 Gunwharf is 23% social housing)
• Generating tourist income for the city• Reusing a site and protecting listed and historic buildings• Is not out of town so is still easily accessible
But, it is Not sustainable where:• Entertainment and restaurants have caused the decline in
other areas such as the town CBD and seafront

London Olympics Site, Stratford
Social Housing Redeveloped derelict housing, but expensive for local residents, knocked down tower blocks – removes social problems but forces relocation (people forced to move away from work)
Services New shops, medical centres, additional underground train lines, etc.
Economic Transport New train lines (extra Jubilee connections), park and ride, have improved transport options and speed
Jobs Short-term jobs in construction / admin, most jobs only for 5years, short-term jobs in services (e.g. restaurants / hotels) during the event, nothing long-term
Environmental Reusing land Reuses brownfield derelict sites, environmentally sustainable, creation of new parks and open spaces
Effect of increased visitors Congestion, noise + air pollution, chance of increased litter, increased waste production (e.g. will sewage services cope?)

Sustainable redevelopment case study:Greenwich Millennium village
• London redevelopment• Sustainable design• Redeveloped a brownfield gasworks site into a
modern community• Mixed land use: 2700 residences, community
facilities, central village green space• Eco-sustainable materials: thermal insulation
windows, non-polluting paint, ecology park, green corridors, recycling water, etc.
• Structured to reduce transport needs = less congestion

Exam Qs:
- Describe two changes in retail provision. ………………………………………………………………… …………………………………………………………………………………………………………………………………
- How have these changes in retail provision affected the quality of life of people? …….. ……………………………………………………………………………………………………………………………………. ……………………………………………………………………………………………………………………………………
Case study Qs:
- Name & locate an urban area you have studied………………………………………………………- Describe how this urban area has been regenerated
…………………………………………..…….…………………………………………………………………………………………………………………………………….…………………………………………………………………………………………………………………………………………………………………………………………………….…………
- Explain how this project is sustainable. …………………………………………………………………….. ……………………………………………………………………………………………………………………………………………………………………………………………………………………………………………………………………

International Migration: Mexico to USA
IMPACTS for Mexico
- Brain drain. Loss of educated and skill workers to USA.
- Increased number of elderly dependents remain in Mexico, fewer of working age = economic stagnation
- Many families benefit because money earned by those in USA is sent back home
- Some get education and training in USA then return to Mexico to bring ideas
- Lack of taxes by legal migrants who pay now to USA, less income for Mexico government
- Social barriers: families divided, young vs old
- Rural problems in Mexico and over-crowding in places like Tijuana before migrants leave
Causes of Migration:
- ‘bright lights’ effect, idea of a better life in USA
- $GDP per capita in Mexico only $12030, compared to USA of $42,296
- Only 91% literacy rate in Mexico
IMPACTS for USA
- Get a flexible workforce, often willing to work for lower pay than American counterparts
- Investment in local area by migrants who consume goods and services here
- Legal migrants will pay tax to US government
- Many workers are highly skilled, keeps the technology industry growing
- However, lots of social tensions and discrimination
- US Border Patrol has 12’000 officers to patrol border with 1million illegal migrants returned each year
- 11.4million Mexican migrants in 2012, of which 5.9million were illegal
- Many send home their income to Mexico therefore less investment to USA
- Some over-crowding and social pressures in schools and for local services

Positive impacts to country of origin Positive impacts to host country
Negative impacts on country of origin Negative impacts on host country
Push Factors and Pull Factors
Management

How and why is global population changing?
Explain the term ‘natural increase’ ……………………………………………………………………………… ………………………… ……………………………………………………………………………………………………..…. Explain the term ‘natural decrease’ ………………… ……………………………………………………..…. ……..…. …………………………………………………………………………. ……………………………..…. …………
When did the population explosion begin? Why did it occur? ……………………………..…. …………………………………………………….. ………………………………………………………………………….. …………………………………………………….. …………………………………………………………………………..
…………………………………………………….. …………………………………………………………………………..
…………………………………………………….. …………………………………………………………………………..
What is ‘exponential growth’? …………………………………………………………………………………… ………………………… ……………………………………………………………………………………………………..….
Why are some parts of the world sparsely populated while others are densely populated? Explain using examples. …………………………………………………………………………………………….
…………………………………………………….. …………………………………………………………………………..
…………………………………………………….. ………………………………………………………………………….. …………………………………………………….. …………………………………………………………………………..
…………………………………………………….. …………………………………………………………………………..

Exam Qs
a. Describe the distribution of countries with the lowest rates of natural increase versus those with the highest rates of natural increase. (4)
b. Identify and compare two countries : one with low and one with high rates of natural increase. Use comparisons such as MEDC, LEDC and other development indicators to suggest why these differences exist. (6)
Use this from last week
Hint…
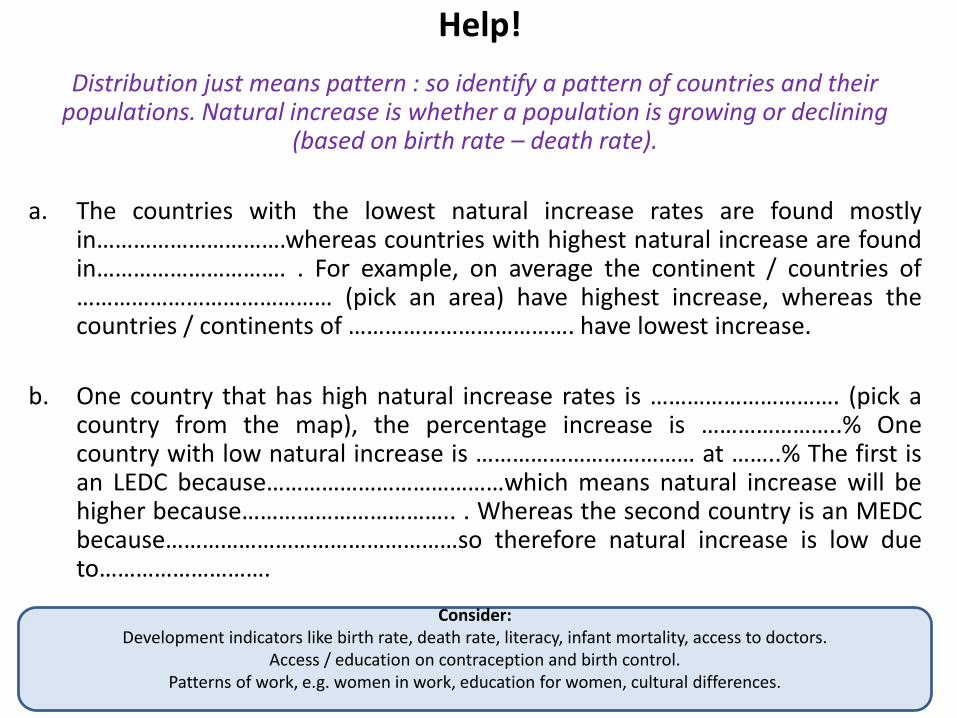
Help!
Distribution just means pattern : so identify a pattern of countries and their populations. Natural increase is whether a population is growing or declining
(based on birth rate – death rate).
a. The countries with the lowest natural increase rates are found mostlyin………………………….whereas countries with highest natural increase are foundin…………………………. . For example, on average the continent / countries of…………………………………… (pick an area) have highest increase, whereas thecountries / continents of ………………………………. have lowest increase.
b. One country that has high natural increase rates is …………………………. (pick acountry from the map), the percentage increase is …………………..% Onecountry with low natural increase is ……………………………… at ……..% The first isan LEDC because…………………………………which means natural increase will behigher because…………………………….. . Whereas the second country is an MEDCbecause…………………………………………so therefore natural increase is low dueto……………………….
Consider: Development indicators like birth rate, death rate, literacy, infant mortality, access to doctors.
Access / education on contraception and birth control. Patterns of work, e.g. women in work, education for women, cultural differences.

Demographic Transition Model
Two colours to annotate: one colour to annotate shape of the graph / trend, second colour to annotate possible reasons or example countries

Statement Which stageon the DTM?
Why here? PROVE IT.
Jack realises there is not enough farmland available in his village for everyone to grow what they need to survive. He and his wife and 5 children migrate to another area where there is fewer people & more land available.
Hospitals are overcrowded with high waiting lists due to an increased demand for joint replacement surgery or to treat geriatric illnesses.
Parents of children face difficulty placing their child in schools close to home due to conflict and waiting lists to attend a school of their choice.
Energy bills in winter rise each year due to pressure on the energy grid to provide enough gas and electricity to meet consumer demand.
The population remains reasonably steady despite fluctuations in birth and death rate.
Try to match up the statement to the correct stage of the DTM and give a reason why here.
e.g. This is because birth rates are high but death rate is falling so people live longer so natural increase is occurring and exponential growth. This means there is not enough farmland or resources because the total population is now too high, with overcrowding.
Stage 2

Economic development increases…..
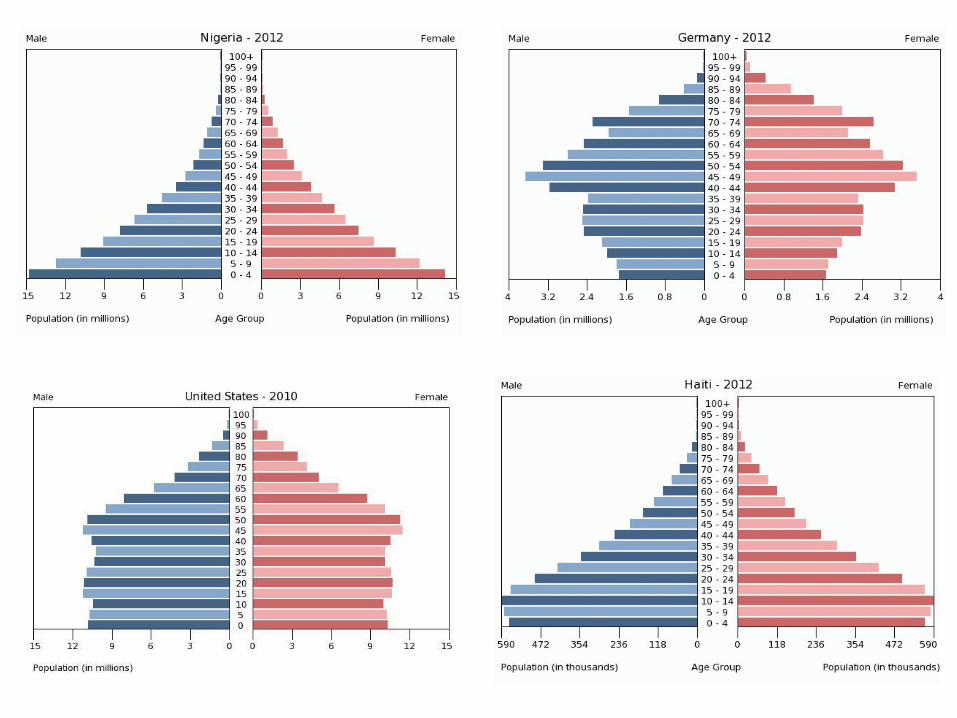
Population pyramids – can you match up the statement to the correct pyramid on the next page?
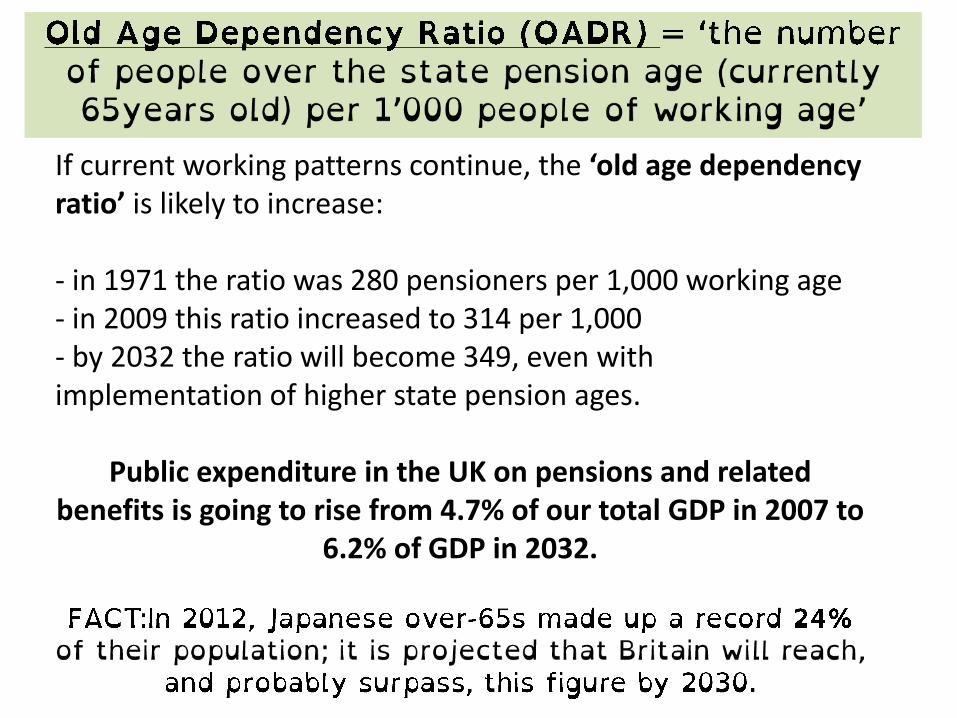
If current working patterns continue, the ‘old age dependency ratio’ is likely to increase:
- in 1971 the ratio was 280 pensioners per 1,000 working age- in 2009 this ratio increased to 314 per 1,000- by 2032 the ratio will become 349, even with implementation of higher state pension ages.
Public expenditure in the UK on pensions and related benefits is going to rise from 4.7% of our total GDP in 2007 to
6.2% of GDP in 2032.

However, the situation isn’t all negative…
Source : http://www.kingsfund.org.uk/time-to-think-differently/trends/demography/ageing-population

• A country’s population increase or decrease depends upon:- Natural increase / decrease (birth rate minus death rate)- Migration
• By 2050, the Japanese population will have declined from 130million to 100million – the biggest drop for any MEDC
• Japan has a low fertility rate: Japanese women have on average 1.3 children per woman
• What are the implications? How might they be managed?

Overpopulation
• Whether an area is overpopulated depends on a range of factors and NOT just on the size of the population
• Overpopulation may also be for a CITY, a REGION or a whole COUNTRY
TOP 5 overpopulated countries:
1. China
2. Singapore
3. India
4. USA
5. Indonesia
Overpopulation =
Carrying capacity =
Optimum population =
With reference to a named example, describe some of the potential impacts of overpopulation. [4marks]
What might influence the carrying capacity of an area? [2marks]

Population management : anti-natalist China
• 1950s, China population growth was 1.9% per year – meaning the country’s population could double in 50 years
• 1979, One Child Policy introduced.
• Incentives and disincentives to conform (China was communist ruled too)
• State offered free education, priority housing, increased pensions, child care benefits to those who conformed to one child.
• Raised the age of marrying to 22 for a man, 20 for a woman and you had to have permission, in order to reduce the ‘reproductive time’ that a couple had together
• Disincentives: if you broke the rule, you could lose your job, be fined, up to 15% of your income, lose all benefits, and in extreme cases be forced to have abortions
• ‘Granny police’ – elders who would turn in to authorities anyone breaking the rules
• Did lead to cases of ‘female infanticide’ – if a girl was born and a couple wanted a son (especially rural families) there were often female murders or abandonment
• It has worked: population growth has slowed to 0.7% and birth rate is falling, but total population is still 1.6 billion. Now, a low birth rate is a problem because there is an ageing population and growth of dependency with too few workers.
• ‘Little Emperor’ syndrome - men now outnumber women and can often be spoilt and picky with parents of girls having to pay large dowries to ‘bribe’ parents of boys to allow marriage
• Rural families were allowed 2 children, and the rule has now been relaxed through the country
• However, there is a problem now of the 4:2:1 ratio – four grandparents, of two parents, being supported by one single child – dependency of elders on a shrinking number of working age

Case study: pro-natalist policy in France
The policies that were put in place to encourage three-children families were:
• 1939 introduced the ‘Code du la famille’ a pro-natalist legislation
• Originally banned contraceptives (until this was repealed in 1969 as immoral / illegal)
• A cash incentive of £675 monthly (nearly the minimum wage) for a mother to stay off work for one year following the birth of her third child
• Maternity leave for first child is minimum 20weeks, rising to 40 weeks for third child
• 100% mortgages / extra credit available to families
• Full tax benefits for parents until child reaches 18
• the 'carte famille nombreuse' (large family card), giving large reductions on train fares
• income tax based on the more children the less tax to pay
• 3 years paid parental leave, which can be used by mothers or fathers
• government subsidised day-care for children under the age of three, and full time school places +3yrs old
• This has resulted in mothers considering having children and remaining in work. The fertility rate in France is one of Europe's highest: risen to 1.98 children per woman (from 1.6 in 1968)
• BUT – problem in future that this ‘baby boom’ will lead to an ageing population crisis
Many areas of Europe have a low fertility rate because of the following reasons:• education - people are more aware of the availability of contraception and consequences an unplanned
pregnancy can have on their career• women in careers - Women may choose to follow career rather than start a family while young• later marriages – therefore have children later, therefore fewer children (average 1.6 children per woman)• state benefits - couples no longer need children to care for them when old, so have fewer childrenFrance was a country with concerns that professional women were choosing not to have children. The government were worried that the population was not going to replace itself over time.

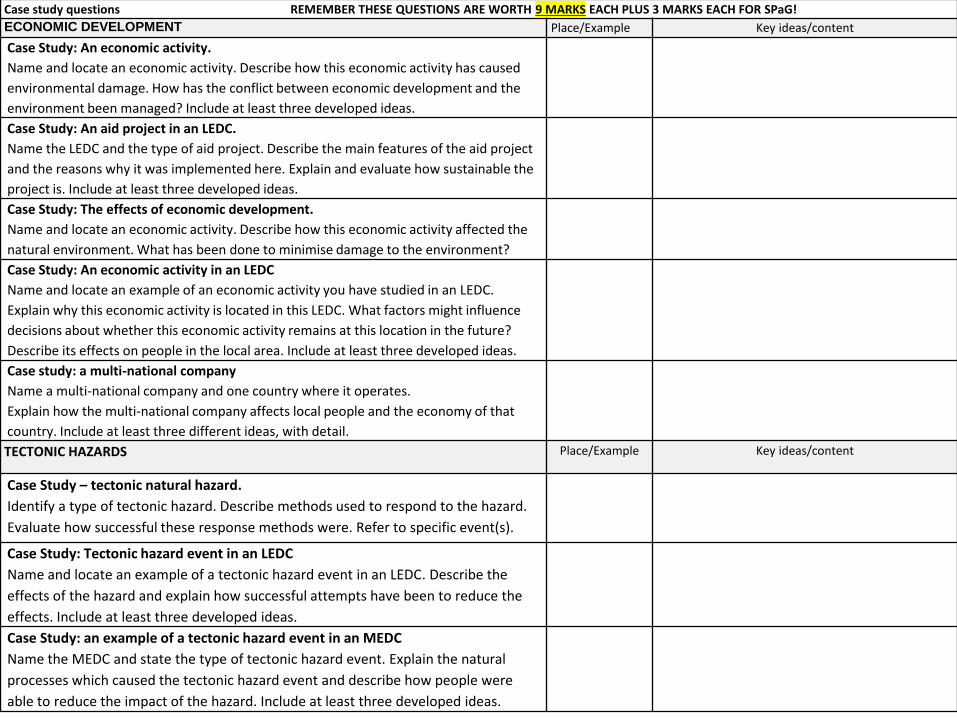
Case study questions REMEMBER THESE QUESTIONS ARE WORTH 9 MARKS EACH PLUS 3 MARKS EACH FOR SPaG!
RIVERS Place/Example Key ideas/content
Case Study: Flooding in an MEDC
Name a river in an MEDC which has been affected by flooding.
Describe the causes and impacts of the flooding event. Evaluate the responses by people to manage the flood consequences. Include at least three developed ideas.
Case Study: River valley and landforms
Name a river valley you have studied. Describe one or more landforms which are found in
this river valley. Explain how these landforms have been formed. Use a labelled diagram or
series of diagrams in your answer. Include at least three developed ideas.
Case Study: River flooding
Name a river where flooding is managed. Describe how the flooding is managed in this
place and explain how sustainable these methods are. Include at least three developed
ideas.
Case Study: River landforms and processes
Name of river valley you have studied. Describe one landform which is found in this river
valley and explain how it was formed. You may use a labelled diagram(s). Include at least
three developed ideas.
COASTS Place/Example Key ideas/content
Case Study – Coastal management
Name an area of coastline you have studied. Describe the impacts of erosion here and
suggest how the coastline is protected from erosion. To what extent are these protection
methods sustainable? Include at least three developed ideas.
Case Study: Coastal area and landforms
Name a coastal area you have studied. Describe one or more landforms which are found in
this coastal area. Explain how they have been formed. You may use a labelled diagram in
your answer. Include at least three different ideas, with detail.
Case Study: Coastal depositional landforms and processes
Name a coastal area you have studied that has deposition landforms. Describe one
deposition landform in this coastal area, and explain how natural processes have created
this landform and changed it over time. You may draw a diagram as part of your answer.
Include at least three developed ideas.
Case Study: Coastline management
Name an area of coastline where management has taken place. Describe how the
coastline has been managed and explain how sustainable these methods are. Include at
least three developed ideas.
Case study questions REMEMBER THESE QUESTIONS ARE WORTH 9 MARKS EACH PLUS 3 MARKS EACH FOR SPaG!
ECONOMIC DEVELOPMENT Place/Example Key ideas/content
Case Study: An economic activity.
Name and locate an economic activity. Describe how this economic activity has caused
environmental damage. How has the conflict between economic development and the
environment been managed? Include at least three developed ideas.
Case Study: An aid project in an LEDC.
Name the LEDC and the type of aid project. Describe the main features of the aid project
and the reasons why it was implemented here. Explain and evaluate how sustainable the
project is. Include at least three developed ideas.
Case Study: The effects of economic development.
Name and locate an economic activity. Describe how this economic activity affected the
natural environment. What has been done to minimise damage to the environment?
Case Study: An economic activity in an LEDC
Name and locate an example of an economic activity you have studied in an LEDC.
Explain why this economic activity is located in this LEDC. What factors might influence
decisions about whether this economic activity remains at this location in the future?
Describe its effects on people in the local area. Include at least three developed ideas.
Case study: a multi-national company
Name a multi-national company and one country where it operates.
Explain how the multi-national company affects local people and the economy of that
country. Include at least three different ideas, with detail.
TECTONIC HAZARDS Place/Example Key ideas/content
Case Study – tectonic natural hazard.
Identify a type of tectonic hazard. Describe methods used to respond to the hazard.
Evaluate how successful these response methods were. Refer to specific event(s).
Case Study: Tectonic hazard event in an LEDC
Name and locate an example of a tectonic hazard event in an LEDC. Describe the
effects of the hazard and explain how successful attempts have been to reduce the
effects. Include at least three developed ideas.
Case Study: an example of a tectonic hazard event in an MEDC
Name the MEDC and state the type of tectonic hazard event. Explain the natural
processes which caused the tectonic hazard event and describe how people were
able to reduce the impact of the hazard. Include at least three developed ideas.

Case study questions REMEMBER THESE QUESTIONS ARE WORTH 9 MARKS EACH PLUS 3 MARKS EACH FOR SPaG!
CLIMATIC HAZARDS Place/Example Key ideas/content
Case Study – Climatic Hazards
Name a type of climatic hazard and the location where it took place. Explain the natural
processes which caused this event and how human activities affected the impact of the
natural hazard.
Case Study: Climatic hazard in an LEDC
Name and locate an example of a climatic hazard in an LEDC. Explain the natural
processes causing the hazard and describe its impact on people in the area. Include at
least three developed ideas.
Case Study: an example of a climatic hazard in an MEDC
Name the MEDC and state the type of climatic hazard. Describe and explain the methods
used to protect people and property from this climatic hazard, and explain how
sustainable these methods are. Include at least three developed ideas.
POPULATION & SETTLEMENT Place/Example Key ideas/content
Case study: an example of international migration.
Name two countries between which people have migrated. Explain the causes and
consequences of this migration, on the host country or country of origin or both. Include
at least three developed ideas.
Case study: land use change in an urban area
Name an urban area where land use has changed over time. Describe the land use
change in this urban area. Comment on the sustainability of the change. Include at least
three developed ideas.
Case study: population management strategies
Name a country in which management strategies have been used to influence natural
population change. Describe the strategies used and evaluate how successful these
strategies have been. Include at least three developed ideas.
Case study: changes in retail service provision
Name and locate an example of changes in retail service provision in an area. Describe
the recent changes which have taken place and explain why these changes have
occurred. Include at least three developed ideas.
Case study: an example of internal domestic migration
Name and locate an example of migration that has occurred within one country. Describe
the causes behind this migration, and the impact it has on the environment of the area of
migration. Include at least three developed ideas.
(e.g. rural-to-urban migration or counter-
urbanisation).

Example model answer: Coastal management
“For a coastal area you have studied, describe and explain the impacts of erosion. Explain how this erosion has been managed and comment on the sustainability of these.”
• Highcliffe is an area of coastline located in Dorset, with Barton-on-Sea in Hampshire next door. Both areas have the same mixed geology of soft, unresistant clays and sands that erode easily.
• At Highcliffe, cliff recession had been a problem throughout history. In the 1950s, Highcliffe was retreating inland at a rate of 2metres per year due to rotational slumping as a result of erosion and weathering. This resulted in damage to properties and pathways at the top of the cliffs. At Barton-on-Sea, the cliff line has retreated 80m inland since 1930 which has caused a loss of land but minimal damage to properties due to this area being largely uninhabited.
• The coastal management varies at each location, despite them being the same geology and same erosion processes. Highcliffe utilises the ‘hold the line’ method whereby Dorset council has introduced a range of hard and soft engineering to retain the cliff line in place and reduce further loss of land. There is rock armour at the base of the cliff to retain the strength, as well as rock armour groynes to reduce the impact of longshore drift transport. The cliffs have been reshaped and terraced to make them stronger and less likely to collapse. Additionally, the cliff terraces have now got cliff drainage and vegetation in order to drain excess water away and hold the soils together. These techniques combined help to retain the strength of the cliff, and are successfully reducing cliff recession.
• In terms of sustainability, the techniques employed are very costly and require long term maintenance and a commitment to fund. Highcliffe maintains coastal engineers to routinely check the management. This is very expensive (for example rock armour costs approximately £4000 per metre) however is sustainable when compared to the cost of potential damages and insurance claims in the area. Highcliffe has very expensive property values along the coast, for example retirement flats of over £300’000 each and detached homes of £1million value. The potential damages therefore outweigh the costs of management schemes. This makes the scheme also socially beneficial, since the area is protected for residential use and also for tourism with walkways being preserved. However, the solutions are not necessarily environmentally sustainable since the knock-on-consequences downcoast are severe. For example, rock groynes retain sediment that would normally be transported by longshore drift along coast. This means that Barton-on-Sea and other areas are starved of sediment and therefore more vulnerable to erosion such as hydraulic action where cliffs are exposed. Barton-on-Sea adopted managed retreat, where land is left unprotected and allowed to be eroded. Although short term this does lead to loss of land and appears unattractive with collapsed cliffs, the land here is considered less valuable since there is only a temporary campsite not permanent housing. Long term this method will be sustainable since the coastline will find a natural balance with the collapsed cliffs eventually forming a protective platform to reduce future erosion.

Example model answer : River flooding
“With reference to a river that has experienced flooding, describe the impacts of the flood event and evaluate how successful the methods to manage this flood were.”
• Brisbane in Australia suffered its worst flood event in 2011 after a series of events caused multiple rivers to burst their banks. Australia in 2010 suffered drought as a consequence of El Nino, and then the weather reversed during La Nina. Tropical storm Cyclone Tasha brought prolonged heavy rains with the wettest December ever and over 209mm rain and storm surges.
• Brisbane is a major commercial and residential city in Queensland, which is part of Australia which is an MEDC. As a result, the area has a range of infrastructure designed to respond to flood risk. The Murray-Darling river was managed using reservoirs, such as Wivenhoe reservoir in order to regulate the amount of water flowing through. However, this was poorly managed during the cyclone season which led to the dam filling to 190% of capacity and then breaching. This caused sudden flash floods downstream and destroyed many properties. Over 25’000 homes were flooded in the area, and an area larger than France and Germany combined was under water for some weeks. 43 people died as a result – however this is likely to have been much higher had the flood taken part in a less developed area where flood defences and warnings were not in place. The costs of damages in Australia were $30billion Australian dollars, and the country lost major wheat and coal exports.
• The methods to manage this flood were varied and included a military evacuation of thousands of people, with the Emergency Management Queensland organisation overseeing this. Flood barriers were closed to protect urban areas, and airports and ports were closed to prevent damage. Residents were evacuated and the government raised over $40million in aid within the first two weeks to provide supplies to those effected. This was all well organised and reduced the long-term implications, therefore can be considered successful. However, the unsuccessful management was the poor dam and reservoir control that led to the major flash flooding. This also led to some panic and looting when victims were stranded. Overall however, you can argue that the impacts long-term were not as severe as they could have been and that the worst impact was economic since the death toll remained low.

Example model answers: Settlement land use change
“For a settlement that has experienced land use change (redevelopment). Name and locate the settlement, describe how the land has changed. With reference to specific place detail, describe and explain the reasons for
land use change and the impacts these had.”• (you could use Portsmouth or London Olympic site)• Portsmouth, on the south coast of England, has experienced a lot of land use change. Originally the city
developed around the naval port, with the inner city of Fratton and Somerstown developing near the Commercial Road CBD. Over time the dockyard declined. This was due to a reduction in navy production, which meant the dockyard become derelict and abandoned. The area was very socially deprived with a lot of unemployment and few services in the Portsea area. The local council and businesses decided to invest in rebranding Portsmouth as a Waterfront City, and this involved redeveloping the brownfield area of the abandoned dockyard into the new Gunwharf Quays retail outlet. This is a discount retail and leisure and residential area which has been sustainably managed to redevelop the area. The redevelopment includes the Spinnaker tower which is part of the reason why 10million tourists every year visit Portsmouth.
• Other changes to the land use in Portsmouth include the changing CBD of Commercial Road. This had an old shopping centre the Tricorn which was redeveloped due to customer demand into the Cascades, which is still being redeveloped and improved with new shops. This is because retail is a big employer and provides services for residents and visitors. Because of the changing CBD, the inner city has also changed. Fawcett Road has seen its shops close down and go out of business due to lack of business, so the services provided here now are more like second hand shops and convenience stores. This is also because there is now a large out-of-town Tesco hypermarket at North Harbour which offers consumers easy access shopping. This area is in the suburbs and used to be a brownfield refuse site which was redeveloped to provide services for the area.
• Finally, in the inner city area of Fratton there has been land use change at Fratton Way near the football stadium. Brownfield sites here were redeveloped into the Etap hotel, subway and low cost apartment block. The reasons for this were to regenerate a derelict site, provide accommodation for visitors for the football, and provide affordable housing in the city.

Example model answers: Settlement retail service provision
“Name and locate an example of changes in retail service provision in an area. Describe the recent changes that have taken place and explain why these changes occurred.”
• Portsmouth, south coast of the UK, has seen a lot of retail change. The city has various retail districts such as the central business district (CBD) at Commercial Road, Gunwharf Quays, Palmerston Road, Ocean Park, and the North Harbour area.
• Traditionally Portsmouth had its CBD at Commercial Road with the main high street and a few other main shopping streets such as Fawcett Road, Palmerston Road and Albert Road. Portsmouth is an island and irregular shape which has led to zones within the city and the development of more than one shopping area. Over time, the CBD has declined and so the retail provision changed. Major stores such as Woolworths and Virgin lost business, especially when more people started shopping online (e-tailing). As a result, the local council decided to redevelop and rebrand Portsmouth and this involved changing retail provision. Gunwharf Quays was built on brownfield dockyard site. Due to public demand for retail and entertainment this site was built to mix discount shopping outlet stores with leisure facilities. Stores in Gunwharf are all discount brands or designer stores, this is so the area does not compete directly with the CBD or it would go into decline.
• Another change in Portsmouth was the development of out-of-town retail areas, such as North Harbour and Ocean Park. This is because of customer demand for larger brand stores, more variety, and more accessible shopping. North Harbour Tesco Extra hypermarket is part of a trend for supermarkets to offer more than just food but also clothing and more specialist goods like electronics. Ocean Park has stores like Curry's and Toys’R’Us which are specialist high order goods and the stores are very large, meaning they need to locate in suburbs where land is cheaper. So retail provision changed because customers want to be able to shop more easily and get more varied specialist goods like electronics and toys.
• Portsmouth and other urban retail areas have seen changes in retail because of town becoming ‘clone towns’. This is because customers like to feel ‘safe’ when shopping so they choose to buy from more well-known brands that they recognise, so these stores start to open on every high street until they all look the same. Stores like H&M or Starbucks can be found in Portsmouth high street just like Chichester high street. This means the retail provision becomes less unique, andthe smaller independent shops and boutiques cannot afford to locate in the CBD any more so they are found in less central areas like Albert Road, and Fawcett Road changed to provide mostly second hand or convenience stores.
• Retail provision has also changed because of the growth of ethical shopping. This means more stores offer more ethical goods like fair trade or organic products, like convenience stores selling organic and fair trade food, or high street stores like DPs selling organic clothing. This is happening across the country because of customer demand.
• Finally, Portsmouth has also seen retail provision change because of the growth of e-tailing (online shopping). More people now shop online because it is easier, can be done any time any day anywhere, is often cheaper, has more variety & technology has made it easier. As a result, some high street stores such as Woolworths lost business and closed down.

Example model answers: population management
“For an area that has experienced government controlled population management, describe the strategies that were used to influence the natural population growth. Evaluate how successful this management has been.”
• (You could use either China anti-natalist, or France pro-natalist here)
• France is an MEDC that is in Stage 5 of the demographic transition model, with a declining population and one that is generally ageing. The natural fertility rate had been in decline with more women choosing to have a career and have smaller families. The country has 36% of the population in the dependent category (either elderly or youthful dependents) which means the country’s economic is at risk of decline. As a result the government introduced population management to encourage an increase in birth rate (pro-natalist policy).
• The idea is to increase family size, so the more children a woman has the less tax she pays. Each family receives a monthly allowance of £180 as well as 30% cheaper prices on transport and some public services like swimming. This encourages families that they can afford to have more children and maintain a high quality of life.
• There is the ‘large family card’ which means that the more children a woman has, the longer her maternity leave will be each time – up to 3 years paid parental leave for either the father or mother. There is a cash incentive of £675 a month for a mother to stay off work for one year once she has had her third child, and subsidised day-care for children to be looked after – so it becomes more affordable to have more children.
• The policy has been successful – France has one of the highest fertility rates in Europe at 2.1 babies per woman now, which has risen due to the government benefits. Women have been able to have both a large family and a career, and families can afford to have more children. Over time this should continue to be of benefit –particularly once this baby boom generation reaches working age and can get paid employment.

Example model answers: population migration
“For a named example of migration, describe the causes behind the movement of people and the impact it has had on the environment and society of the areas affected.”
• One of the most famous and large-scale migrations in the world is between Mexico and the USA. There are various push factors that are encouraging Mexicans to migrate away from their country. For example, the $GDP per capita in Mexico is considerably lower than in the USA at only $12’030 compared to $42,296. This would be a clear incentive for a Mexican seeking to improve their life by earning more money. There is a ‘bright lights’ idea that if you migrate to the USA will get a better job, an education and improve your quality of life. Partly this is because the literacy rate in Mexico is lower, at just 91% - so some younger families hope that if they migrate to the USA their children can have an improved education and then go on to get a better paid job.
• The impacts of the migration are different for Mexico and the USA. In Mexico, there is a risk of ‘brain drain’ where many of the migrants moving to the USA are well qualified and skilled leaving less skilled and older workers back in Mexico who can contribute less to the country’s economic improvement. Many families in Mexico benefit from their migrant family in the USA who earn more money abroad and then send money home to their families. However there are problems of over-crowding in towns like Tijuana with short-term migrants before they move to the USA who then move and take their investment with them.
• In the USA, there are benefits such as having a larger workforce and be able to pay lower wages than for American citizens. Immigrants moving in bring investment to local services such as local shops. There are many issues with illegal migration as well which causes stress to border communities. 6million illegal Mexican immigrants are in the USA, which can lead to social divisions and discrimination. Illegal migrants do not pay taxes and send money back to Mexican families so the USA does not benefit in this way.
• Overall the impacts of migration vary from country to country, and are a mix of negative and positive.

Example model answers: tectonic hazards
“For a natural hazard event you have studied, state where the hazard is located. Describe the causes of the hazard and the effects. Using specific detail, describe the measures of hazard protection in this area and evaluate how successful these methods are.”
• Iceland is an MEDC located on the mid-Atlantic ridge north of the UK. It is a small volcanic island with a history of many volcanic eruptions at regular intervals. In 2010 there was an eruption at the Eyjafjallajokull (E-16) volcano under a glacier. The eruption was caused by this:
• The earth’s core is hot and needs to radiate out heat to cool down. This causes the mantle to convect or churn around under heat and pressure. As the mantle convects, it causes the tectonic plates of the earth’s crust to move and to collide or separate. As these plates move, they cause earthquakes and volcanic eruptions.
• Iceland is on the mid-Atlantic ridge which is a divergent plate. These means the tectonic plates are moving away from each other. The Eurasian and North American plates are moving apart and as they do this allows magma to come to the surface and be erupted. E-15 is a volcanic area located under a glacier on a divergent plate. As the plates moved apart, magma came to the surface and a fissure eruption of lava occurred in April 2010. The eruption was quite small in terms of lava produced, but because the lava mixed with the glacier melt water it caused a huge ash cloud column up to 30’000ft in the air. This ash mixed with the atmosphere and winds blew it south and across Europe.
• The effects in Iceland were minor. Nobody died, a few farm animals suffered respiratory problems. 150m thickness of ice was melted which caused a large jokulhlaup flood which destroyed some bridges on the main road Route 1 and made transport difficult. Homes were evacuated and covered in ash. 20 farms were destroyed which means a loss of income for local people. However, tourism to Iceland and within the eruption area increased as people travelled to see the eruption.
• The worst effects were felt in Europe and for businesses here. One of the secondary effects was the ash cloud as it spread across Europe and because of the height of the ash airports had to close and flights were cancelled. 95000 flights were cancelled with thousands of ‘volcano refugees’ stranded. Airlines lost $2billion due to cancellations, and London itself lost£102million in lost tourism. Many people missed holidays or social events and were forced to pay extra to get home. However, they used social sites like Twitter, Facebook and google search to actually find people and find their way home.
• Because Iceland has a lot of experience with hazards it is well prepared and has many measurement systems in place. The island has a huge network of seismometers to measure ground shaking, they also have satellite imagery and tiltmeters to measure the shape of volcanoes and see if magma is travelling to the surface. Gas chromatography is used to see if sulphur dioxide or CO2 isincreasing in soil and water as this shows volcanic activity. All of this can be used with computer modelling to predict eruptions. Icelandic people can sign up to receive text message alerts about eruptions, and there is a good network of radio, tv and internet warnings. Because it is an MEDC there is the infrastructure in place for evacuation plans and specialist services like the emergency services know what to do in the event. As a result, loss of life is minimal. In an LEDC (like Haiti during the 2010earthquake) this is not possible due to costs and so the warnings are less likely.

Example model answers: tectonic hazards
“For a natural hazard you have studied, explain the processes that caused this event and the effects of it. Explain how levels of development can affect the impact of a hazard.”
• In 2010 Haiti, in the Caribbean, suffered a 7.0 Richter earthquake. Haiti is an LEDC and one of the poorest countries in the world. The earthquake epicentre was only 25km from the capital city and because the tremor was shallow to ground it caused massive damage here.
• The earthquake was caused when the transform faults of the North American and Caribbean tectonic plates slipped past each other.Tectonic plates are slabs of the earth’s crust that are floating on the mantle. The mantle is constantly convecting (churning around) because of the heat radiating out from the core. As the mantle convects, the plates above it move and collide or move apart. Transform faults are when two plates are sliding past each other and they rub together, creating friction. This friction and pressure builds up stress between the plates until the stress is too great and the plates snap to release this pressure, one plate will jolt forward and this is the shaking we feel as earthquakes.
• The effects of the Haiti earthquake were very serious. Social effects included the destruction of 250’000 homes (with people losing property and possessions as well as valued homes). 230’000 people died, a huge number. This is because Haiti is an LEDC and so many housing areas are incredibly overpopulated and crowded with poor quality low strength buildings that collapse easily. Also, the earthquake resulted in lots of stagnant water with rats or dead bodies in it which led to the spread of diseases like cholera or dysentery and diarrhoea which killed more people, this is unusual in MEDCs because the emergency services remove stagnant water quickly and provide medicines. Haiti had to request $160million in aid, and received only $80million so could not afford a very effective response. Temporary shelters were provided and short term aid like food and water, but these shelters still had 1.5million refugees in them over a year later as so many people (500’000) were made homeless. When Japan, an MEDC, suffered a massive earthquake and tsunami in 2011 the government was slightlymore prepared, and responded to the event more effectively. Even though the tsunami and earthquake were huge, the seismometers in place gave some warnings. Also, Japanese people are drilled in how to respond to earthquakes and know how to evacuate. The emergency services are well organised and perform search and rescue practices so they were quicker at rescuing people. Also, the government provided more stable temporary housing (mobile homes) with electricity and services which stopped the spread of disease and other problems. 15’000 people did die, which is a very high number for an MEDC, but this was due to the sheer scale of the tsunami andearthquake. In Iceland, another MEDC, nobody died during the volcanic eruption of 2010 and this was helped by the fact that Iceland has a network of seismometers and computer modelling based on volcanic gas emissions or the shape of the volcano. This means that people are warned in advance (via tv, radio, internet and text message) to evacuate an area and this reduces loss of life.
• The level of development has a huge effect on the impact of a hazard. Generally, LEDCs suffer higher loss of life but lower loss of money and the buildings can be rebuilt more quickly. This is due to poor building quality, overcrowding in shanty towns, people being possibly of poorer health due to inadequate diet, the spread of disease in crowded areas with stagnant water and slower response by emergency services and government. In MEDCs, they have access to better infrastructure such as building quality. In Japan, there are strict regulations on earthquake proof buildings. These have features such as reinforced concrete foundations and roofs, TMB balance counterweights on the roof to counter the tremors and help the building sway safely, shatterproof glass with automatic window shutters, ball-bearing or rubber foundations to cushion the tremors, etc. All of these are successful but expensive, and not accessible for LEDCs like Haiti.

Example model answers: multinational companies
• “For a multinational company (MNC) you have studied, describe and explain how the company affects local people and the environment, and the overall economy.”
• Coca Cola is an MNC located in India. It is a secondary manufacturing industry, producing bottled Coca Cola drink. It is located in India due to cheap labour costs, skilled workforce and less restricted environmental law.
• Local people are affected by being given employment. Coca Cola employs over 125’000 people in India. India is an LEDC and employment from MNCs can help improve the development of the area because with more people in employment there is more tax being paid to the government and more money being spent on local services to support shops and farms etc. . Coca Cola also invested $1billion on infrastructure improvements like roads, electricity, healthcare and services. This is all useful for local people and improves their quality of life and standard of living.
• The environment is affected more negatively. Coca Cola uses 3litres of water for every 1litre of bottled drink produced. This water is extracted from underground in India. Because environmental laws are less strict in India Coca Cola is allowed to over extract too much water. As a result, Kerala village loses 100’000 litres of water a day. This is negative for the environment and local people who lose water they need to water crops and for everyday washing and cooking water. They cannot afford to pay for the water since Coca Cola can drive up prices. Also, in Rajahstan the water table has dropped over 10m because of too much water being extracted. This can lead to dry soils and desertification which makes growing crops difficult.
• The overall economy would improve in some ways because of Coca Cola employing local people who then earn more income which they can spend locally and on taxes which means there is more investment in the area. However, because Coca Cola is an MNC it has its headquarters overseas in the USA which means that most profits are sent here. India receives some benefits such as investment and improved infrastructure and employment, but most money is sent back to the USA.

Example model answers: Aid
“For an aid programme you have studied, describe the features of the aid programme and evaluate how sustainable it is.”
• Goat aid is an aid programme which has been used in Malawi, an LEDC in Africa. The project is run by Oxfam and people raise money for this charity to support goat aid. A family is given a pair of goats (or a small flock) as an aid investment. They can then use these goats to improve their quality of life and standard of living.
• Goats can be bred and the flock increased, this gives the family more status and the goats are valuable and can be used for trade. Goats can be used for their milk and meat which improves the diet of the family and can help improve their health. If they are healthier then they can work harder and longer on other jobs and improve their income. Goat fur and skin can also be used for clothing and for homes. Over time, by breeding the goats into a flock a family can then trade them and improve their income. This income can be used to support the children by providing money for clothing and education, this improves their chances of being able to learn skills for other paid employment and improve their future.
• As a by-product, goat manure can be used to fertilise the soils and improve the quality of soil for agriculture. This improves crop production which can also be sold for an income or used to improve the family diet.
• If goats are donated to young girls or families with young girls then this can help with the ‘girl effect’ – that girls will be more respected and have an income to support themselves and so not be forced into prostitution, so improving their chances in life and reducing the spread of disease or increased birth rate.
• One problem with goats is that they need a lot of food, and have a tendency to eat everything. This can lead to overgrazing where goats eat too many plants, this leaves soil exposed and it becomes eroded and windblown which causes desertification. Families need to ensure they can afford to pay to feed goats and pay for any medication they need.
• Overall, goat aid is one of the most sustainable types of aid because it is cyclical and can be maintained by breeding goats for sale, meat and milk. The money can be constantly reinvested to improve chances for children and by improving their health and education it means they will get a better job in future and keep reinvesting in the area.

Riv
ers
& C
oas
tsA river valley &
its landforms
River Derwent, England Upper course source in the mountains, forms V-shaped valleys, waterfalls and gorges. Waterfalls formed by
undercutting and vertical erosion, e.g. Shotley Bridge
Middle course meanders and floodplains. Meanders formed by lateral erosion and deposition.
Derwent Water lake in the lower course before flowing into Irish Sea at the mouth.
River flooding in
an MEDC –
causes, effect,
management
Queensland floods (Brisbane,
Australia)
2011. Caused by Tropical Storm Tasha and La Nina weather events (La Nina traps warm moist air near Australia =
leads to more evaporation and stormy weather).
209mm of rain. Wivenhoe Dam breached and burst. Storm surge
43 people died. 70 towns flooded.
$3billion in damages to property and possession, $30billion damages to country as a whole
Flash flooded and most killed from drowning.
Managed by police, military, fire brigade and volunteers.
Small businesses given grants to help rebuild.
A coastal area &
its landforms
Hengistbury Head, Dorset
OR
Swanage Bay, Old Harry Rocks
Mudeford spit – recurved spit formed by deposition and longshore drift along coast reaching out from the headland.
Used recreationally, has over 300 private beach huts of high value (£170’000 max or £600 rent per week)
Forms a protected lagoon and salt marsh (Site of Special Scientific Interest) within the shelter of the spit. Receives
approx. 1million tourists a year – risk of damage.
Managed with groynes and gabions to maintain the shape and depth of the beach and reduce beach starvation
(however, starves the beaches of Barton-on-Sea downcoast).
Caves, arches, stacks and stumps at Swanage Bay. Old Harry Rocks = stumps and stacks. Geology is resistant chalk
alternating with less resistant clays. The resistant chalk headland (Handfast Point), this has been eroded and
weathered through time to leave the stacks and stumps, whereas the clays have eroded to form Swanage Bay and
beaches.
Management of
a coastal area,
including
sustainability of
management
methods
Highcliffe & Barton-on-Sea Dorset / Hampshire coastline. Very soft geology of clay and sand layers. Dorset Highcliffe has higher land value
therefore coastal protection, whereas Barton-on-Sea is managed retreat as lower value land.
Highcliffe = ‘hold the line’ range of hard and soft management, e.g. sea wall, rock groynes, rock armour, cliff
reshaping, vegetation, cliff drainage, beach replenishment. In the 1950s Highcliffe was retreating at up to 2m a year,
this has been successfully reduced.
Barton-on-Sea = managed retreat. One rock groyne at Chewton Bunny. Cliff slumping / rotation and recession
evident. Has retreated 80m since 1930 – but under planned retreat.

Eco
no
mic
De
velo
pm
en
t
A case study of
a type of long
term aid (and
how
sustainable)
Water Aid, Mali or
Goat Aid, Tanzania
Water Aid: Mali = LEDC ($GDPpc $1251, HDI 0.3), Inhospitable climate (low precipitation, 65% country as desert, desertification
problems, only 50% of population has access to safe drinking water), WaterAid working here since 2000, Trying to provide clean
water + sanitation to the slums, education schemes, hygiene improvements, successful at reducing waterborne disease+ deaths
from diarrhoea by 65%. Clean water & sewage = sustainable as improves health / people can work more = more tax, etc.
Goat Aid: Tanzania, LEDC. Small goat herd provided for a family, provides milk, can be bred and then used for selling / meat / fur /
milk, produce manure which improves crops, owners health improves, more money = more investment locally, especially
successfully if given to young girls (the girl effect) as reduces chance of teenage pregnancy / prostitution / AIDS, etc. Goats may
overgraze though and can lead to desertification. Sustainable.
A case study of an economic activity in an LEDC or MEDC and factors affecting its location
LEDC: sulphur
mining, Kaweh Ijen
volcano Indonesia
(primary industry)
NIC: manufacturing
in South Korea (e.g.
Adidas clothing,
Samsung electrics)
(secondary)
MEDC:
retail/services in
Portsmouth
(tertiary) Gunwharf
Quays, Research &
development at
IBM Portsmouth or
Cambridge Science
Park
Kaweh Ijen – Indonesia, sulphur mining in volcano. Local men climb volcano to dig out solid sulphur, carry to nearby secondary
industries and sell for approx. $10 a day. Sulphur used to bleach sugar white, for making matches, etc. Leads to major health
problems, e.g. muscle distortion, rotting teeth, throat and lung cancer, etc.
Samsung electronics – South Korea. Cheap but skilled labour, produce electronics like TVs, mobile phones, etc. Government
supports MNCs. Good transport links and communications so encourages MNCs. Access to materials like steel, copper, etc. 41% all
employment here.
Gunwharf/Dockyard Portsmouth – UK. Tertiary retail and services. Easy access, tourist destination (10million per year), historic
sites, skilled workers. Navy service employs 21’000. Queen Alexandra hospital employs 30’000+. IBM quaternary also here because
of links to university, large green spaces on outer suburbs.
Cambridge Science parks – UK. Research and development, e.g. bio-science. Links to Cambridge university, good transport links on
motorways, close to London. Skilled workers. 1200 high tech science companies here with 4000 workers.
A case study of an MNC (multinational company)
Coca Cola in India
(LEDC)
Coca Cola locates secondary manufacturing (making the drink and bottling it) in LEDCs / NICs because of cheaper labour and
resources. In Rajahstan in India they bought up the local water supply leaving local agriculture to suffer, water table dropped 10m.
Uses pesticides 30x higher than recommended. Local pollution. Over-extracts water : it takes 3litres water to make 1litre of coke.
Kerala village loses 100’000 litres of water a day. However, employs 125’000 people in India and has invested $1billion in
infrastructure like roads, electricity, healthcare, services.
A case study of how economic activity affects the environment
Coca Cola in India
(LEDC) or
BP Oil spill, Gulf of
Mexico
Coca Cola, as above.
Gulf of Mexico BP Oil Spill. 2010. 200miles of oil slick. 11 workers killed. $10billion cost to clean up. $90billion cost to BP in losses &
compensation. Thousands of fish & marine birds and animals killed, beaches damaged, loss of tourism.

Nat
ura
l Haz
ard
s
An LEDC tectonic hazard
Haiti earthquake 2010. 7.0 richter scale. LEDC. Epicentre 25km from capital. 250’000 homes destroyed. 300’000 injured. 500’000
homeless. 230’000 died. Spread of diseases like cholera (stagnant water). Temporary shelter provided, $80million
foreign aid. Set back the economy + caused massive debt.
An MEDC tectonic hazard
Iceland volcano
OR
Japan earthquake / tsunami
2010. MEDC. Eyjafjallajokull volcano. Part of mid-Atlantic ridge. Fissure eruption. Ash cloud up to 30000ft in
atmosphere – caused air chaos. South coast of Iceland far from residential areas so low impact here. Subglacial –
melted 150m thick ice cap. Major floods – destroyed roads. 20farms destroyed. No deaths. Air chaos – 95000 flights
cancelled, passengers stranded, $2billion losses for airlines, London lost £102million in lost tourism.
2011. 9.0 Richter. MEDC. Japan v well prepared for EQs (have earthquake-proof buildings, preparation days, etc.) but
followed by tsunami up to 10m high as far as Tokyo. Moved Honshu island by 6feet. 15’000 dead and still rising –
mostly from tsunami / drowning. Caused nuclear powerplant explosions – radiation leak, radiation sickness,
quarantine zone, homelessness.
An LEDC climatic hazard
Typhoon Haiyan
OR
Ethiopia drought
November 2013. Category 5. Philippines.
Death toll 6’300 in Philippines, 28’000 injured Highest winds 195mph (strongest recorded)281mm rainfall in 12hours, storm surge 6m (main loss of life was from flood/surge)Damages $3billion, 1.9million homeless
Drought conditions in Ethiopia since 1985. Between 1984-85 1million deaths.
Natural climatic causes of low unreliable precipitation, plus human causes of deforestation, desertification,
overpopulation. 2006 drought affected 2.7million people. $50 million donated to WaterAid projects by UNICEF. 46%
of cattle died. Effect of debt for an LDC. Spread of desertification across Sahel desert area.An MEDC climatic hazard
Hurricane Katrina, USA
(tropical storm)
OR
Australia floods
2005. Mostly Louisiana, Florida. New Orleans worst hit. Category 3, 175mph winds. Storm surge floods of 3-10m,
broke levee defences. 1200 died – 600 from disease. Stagnant water = typhoid. 80% city evacuated but too late. Slow
sending in response (government blamed). 40% city still uninhabited a year later. Hit poorest areas worst. Most
costly disaster in US history - $191 billion. 1million homeless.
See Queensland floods section. Caused by Tropical Cyclone Tasha and La Nina.

Sett
lem
en
t &
Po
pu
lati
on
A case study of urban change to illustrate social, economic and environmental planning and its sustainability.
Gunwharf Quays,
Portsmouth
Or
Olympic Site, Stratford
, London
Gunwharf – brownfield ex-military/industrial site, change to mix land use from 1999 with Gunwharf Quays (mix
residential, leisure, entertainment, commercial). Sustainable? S.E.E.
Olympics – unsustainable? Improved residential, commercial opportunities through hotels/shops/restaurants – short
term. Short term 5000 employment. Longer term improved facilities / environment. Reused brownfield site.
Improvement to derelict / deprived area.
Docklands – regeneration of brownfield site. Area had been in decline since 1960s when docks closed. Redeveloped in
1980s and continues to be. Has purpose-built trade centre in Canary Wharf (includes shopping and entertainment), Excel
arena (trade and entertainment), creation of DLR (Docklands Light Railway) to connect to main city centre, reclaimed and
cleaned toxic waterways to create scenic canals, new entertainment area with bars and restaurants and hotels. Now
brings in A case study to illustrate how retail service provision changes over time.
Portsmouth Decline of local goods retail around Fawcett Road, area now offers discount goods or low-order consumer goods (e.g.
Mack & sons discount).
Decline of old town centre Tricorn shopping centre, redeveloped into Cascades. Cascades continues to be improved (e.g.
recent development of mall to include TK Maxx, etc.)
Change of retail provision from CBD toward Gunwharf – so less competition for high street the Quays offers discount
brands / designer/ outlet prices. However decline of Port Solent.
Move towards out-of-town supermarkets + retail outlets, e.g. hypermarkets, Ocean Retail park, etc. .
Also remember e-tailing, clone towns, ethical shopping, etc,.
A case study of
population
management
Anti-natalist China
AND
Pro-natalist France
Overpopulation, growth of 1.9% in 1950s so population would double after 50 years.
1979 One Child Policy: prohibited more than one child.
Incentives = free education, free healthcare, cheap rent, increase pay, priority housing
Disincentives = lose job, lose all benefits, pay for all healthcare and education. Granny policy. Forced abortions.
Success in that population growth slowed to 0.7% and will reach 0 in 2030, but now elderly dependent.
Fertility rate low at 1.6 child per woman, now increased to 2.1. More women in careers than family.
Introduced Code de la Grande Famille to encourage bigger families.
Incentives: increased maternity leave, £675 per month cash for third child, reduced public transport costs
A case study of
migrationInternal : rural-to-urban
migration in Rio de
Janeiro Brazil
AND
International: Mexico to
USA
Rural poverty and lack of employment. Many, especially young male workers, migrate to city seeking work.
Led to growth of favela shanty towns, e.g. Rocinha.
Issues of rural loss of educated and skilled workers, and overpopulation, crowding, disease in favelas.
Mexico GDP$ lower than USA at $12030, also literacy rate only 91%. Bright lights syndrome of seeking better life in USA.
Illegal and legal migrations. Now have +11million Mexican migrants in USA.
Issues of brain drain in Mexico, especially rural areas, and loss of young workers. Elderly dependents remain.
Mexican workers in USA often send money home to families so benefit, but taxes paid to USA if legal so less investment
for Mexican government. Benefit for USA of flexible cheaper labour supply and skilled workers. But social tensions,
inequality, discrimination and some pressure on services and education.