Embed Size (px)
Citation preview
Luis E. Rodríguez, Alain Tamayo, Arturo Beltrán, Joaquín Huerta
Universidad Jaume I
15th AGILE International Conference in Geographic Information Science

Virtual Globes◦ More realistic vision of the
earth (satellite and aircraft imagery).
◦ Show geographic features, elevations, seafloor, buildings, roads.
◦ Allow the representation of different types of content: geometries (points, polygons, shapes), images, live content (video, sounds, HTML), KML.
◦ APIs for Java, JavaScript, etc.
2
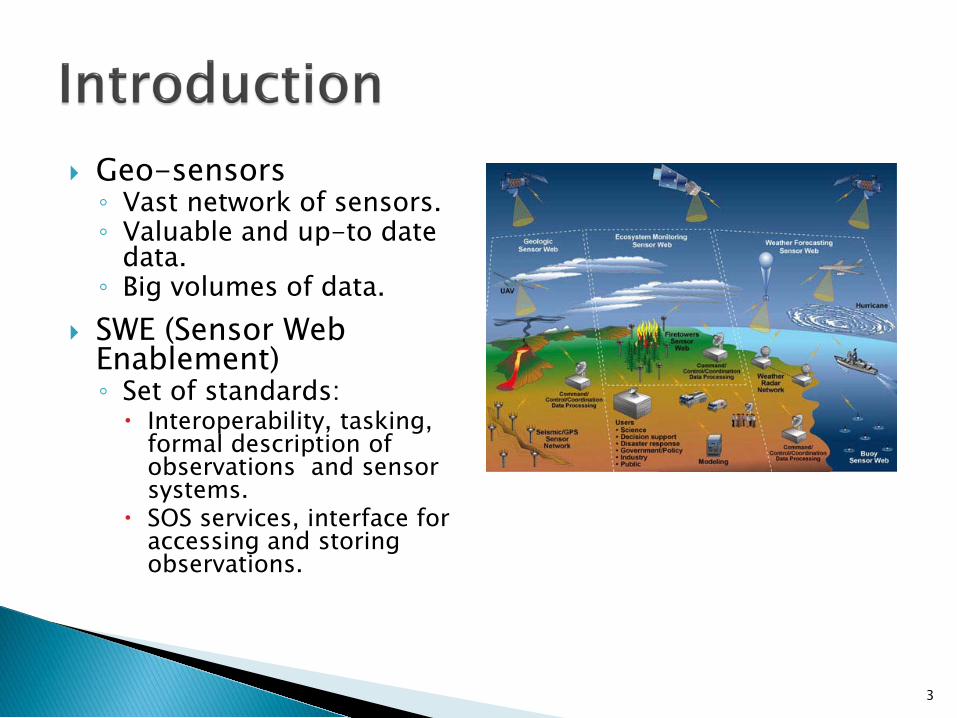
Geo-sensors◦ Vast network of sensors.◦ Valuable and up-to date
data.◦ Big volumes of data.
SWE (Sensor Web Enablement)◦ Set of standards: Interoperability, tasking,
formal description of observations and sensor systems.
SOS services, interface for accessing and storing observations.
3
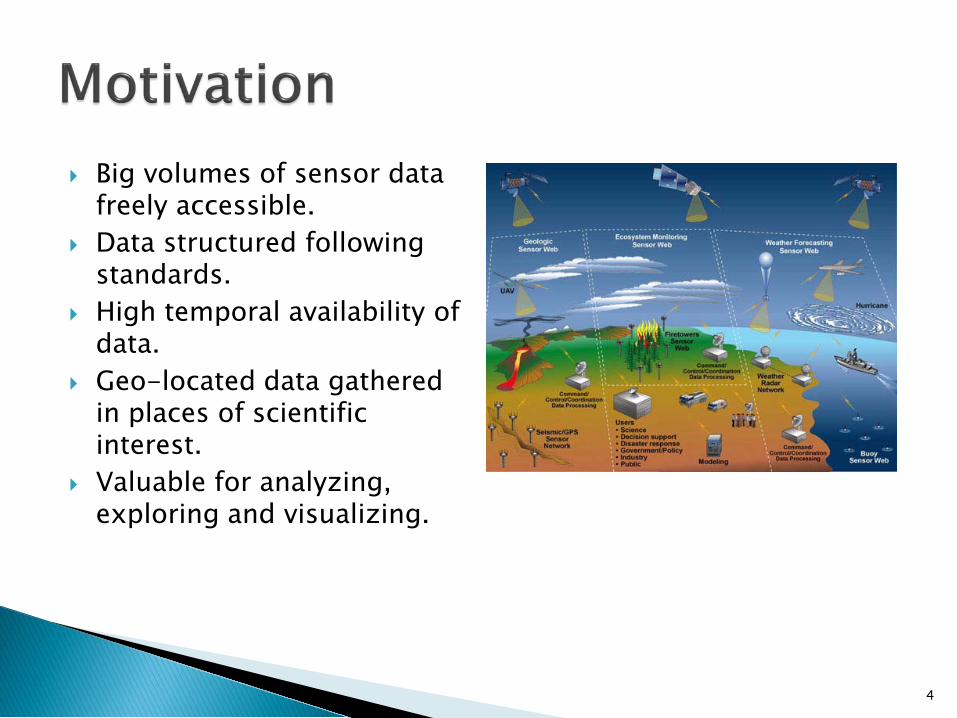
Big volumes of sensor data freely accessible.
Data structured following standards.
High temporal availability of data.
Geo-located data gathered in places of scientific interest.
Valuable for analyzing, exploring and visualizing.
4
Classification of sensor data for finding appropriate visualization methods for each class.
Implementation of prototype to visualize SOS-published sensor data on a Virtual Globe.
Integration of the SEXTANTE library to add spatial data analysis capabilities to the prototype.
5

At a high level the observations can be classified in:
I. Observations for which the result of a single observation do not vary with either spatial position or time.
II. Observations for which the result of a single observation contains multiple values that vary with spatial position, time, or both.
6
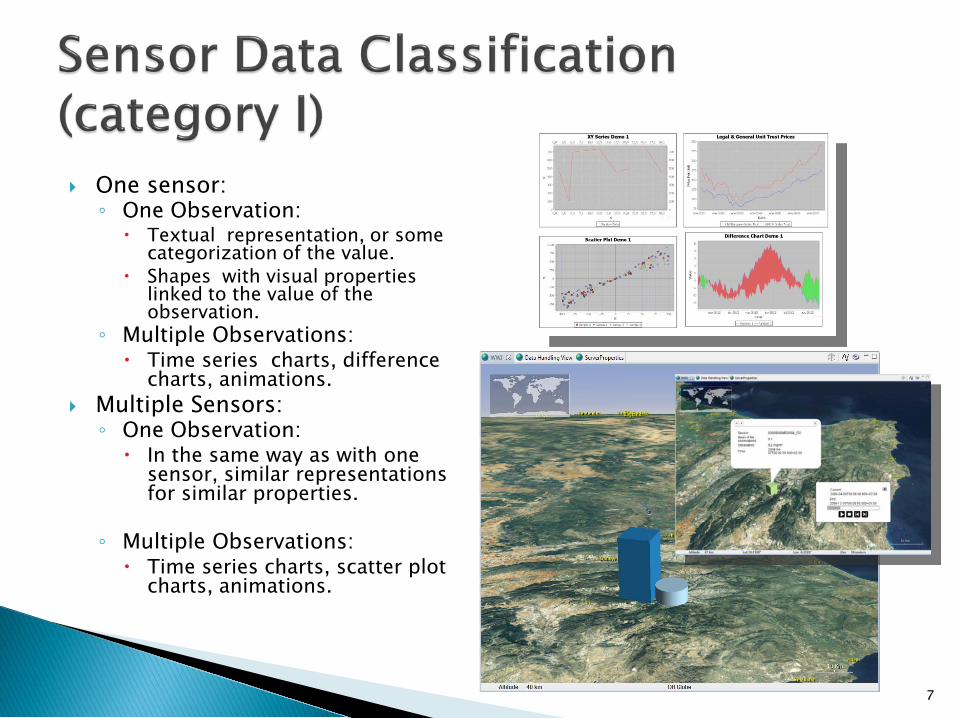
One sensor:◦ One Observation: Textual representation, or some
categorization of the value. Shapes with visual properties
linked to the value of the observation.
◦ Multiple Observations: Time series charts, difference
charts, animations. Multiple Sensors:◦ One Observation: In the same way as with one
sensor, similar representations for similar properties.
◦ Multiple Observations: Time series charts, scatter plot
charts, animations.
7
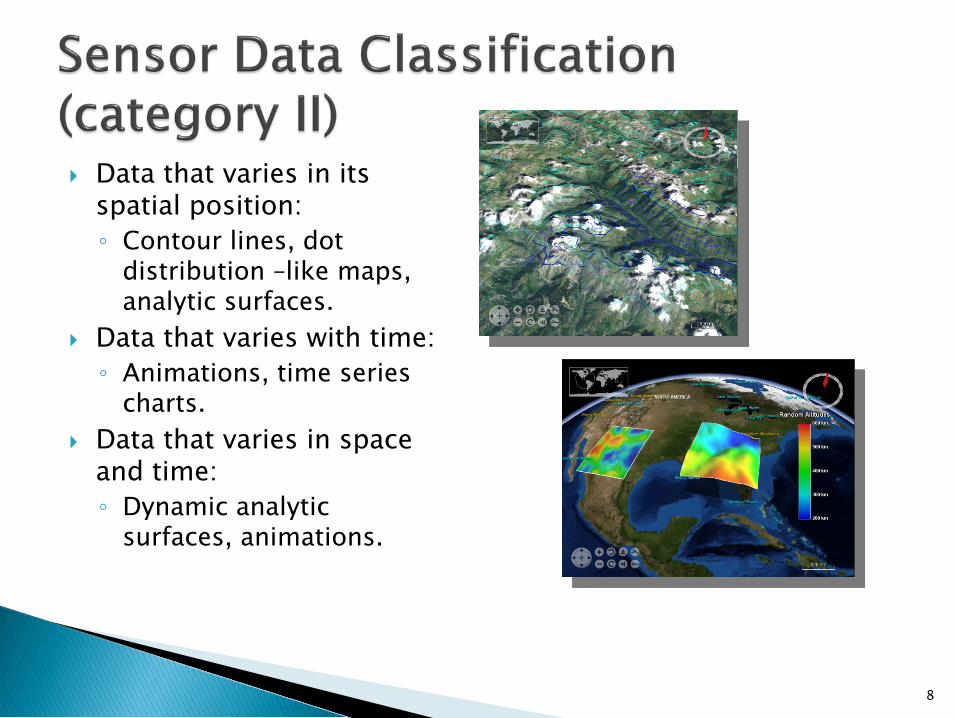
Data that varies in its spatial position:◦ Contour lines, dot
distribution –like maps, analytic surfaces.
Data that varies with time:◦ Animations, time series
charts. Data that varies in space
and time: ◦ Dynamic analytic
surfaces, animations.
8
Requirements: Generic tool enabling the interaction with SOS
compliant servers. To ease the access and retrieval of sensor data. Include data handling capabilities. Different visualization methods. Integration with SEXTANTE. Use the NASA World Wind for Java virtual globe.
9
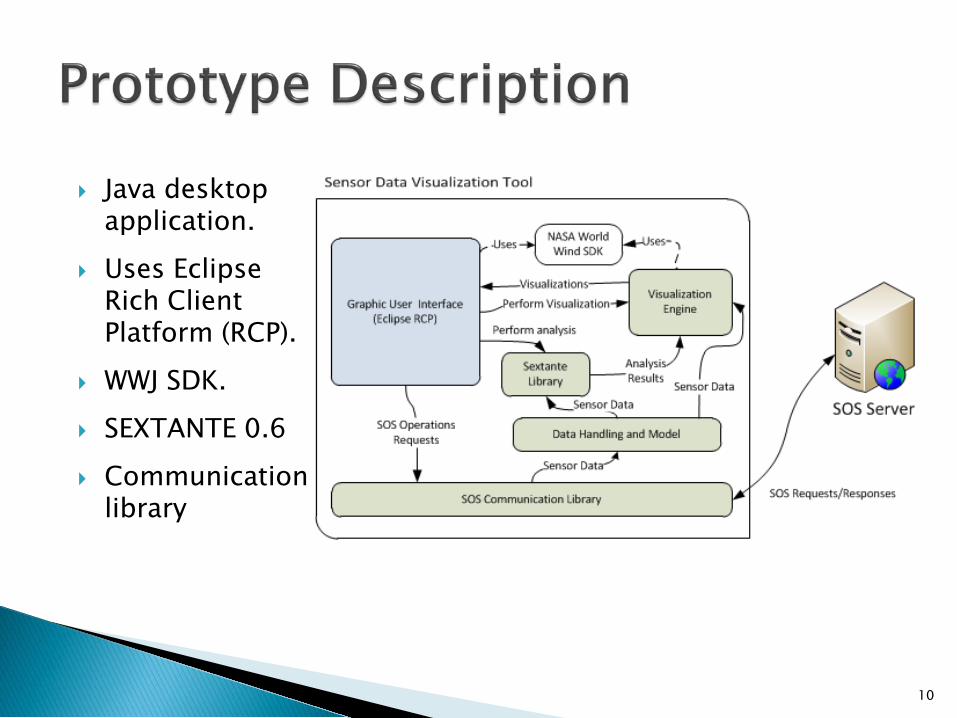
Java desktop application.
Uses Eclipse Rich Client Platform (RCP).
WWJ SDK. SEXTANTE 0.6 Communication
library
10
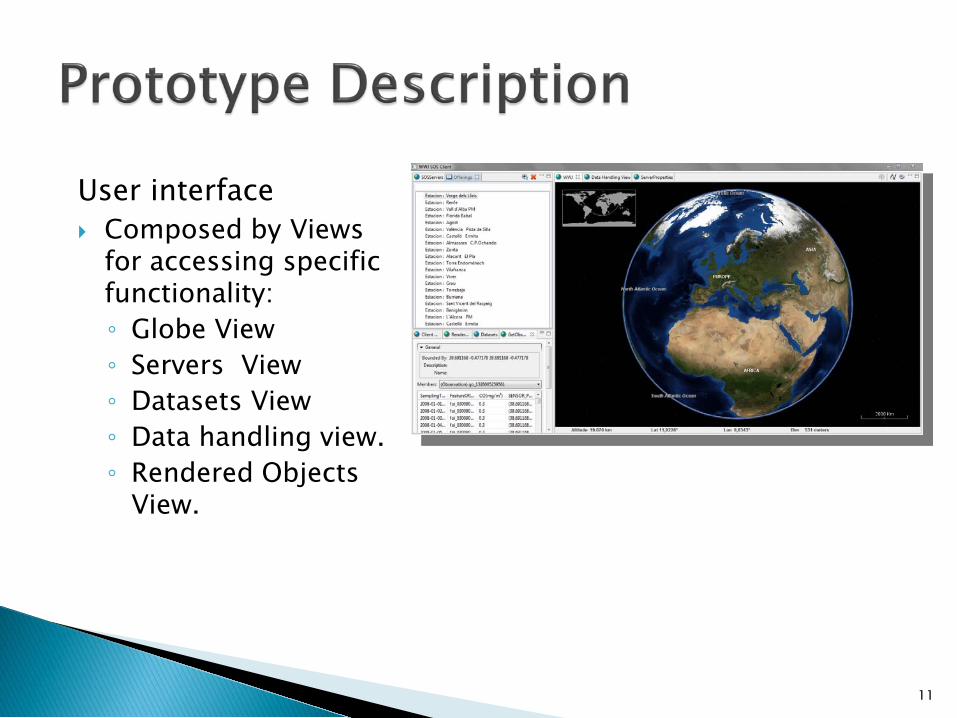
User interface Composed by Views
for accessing specific functionality:◦ Globe View◦ Servers View ◦ Datasets View◦ Data handling view.◦ Rendered Objects
View.
11
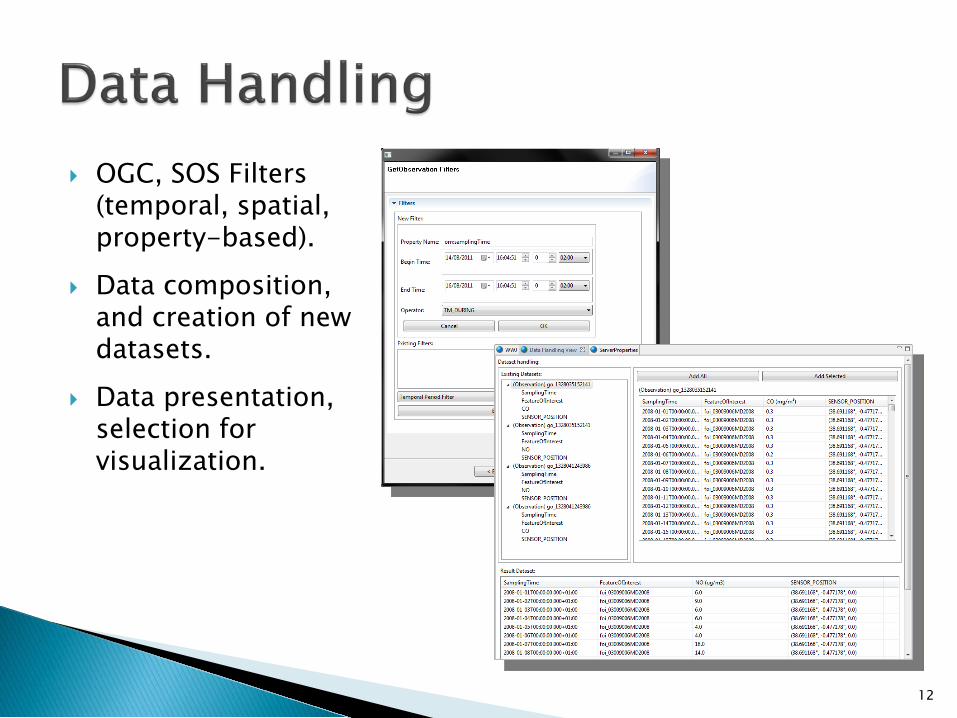
OGC, SOS Filters (temporal, spatial, property-based).
Data composition, and creation of new datasets.
Data presentation, selection for visualization.
12
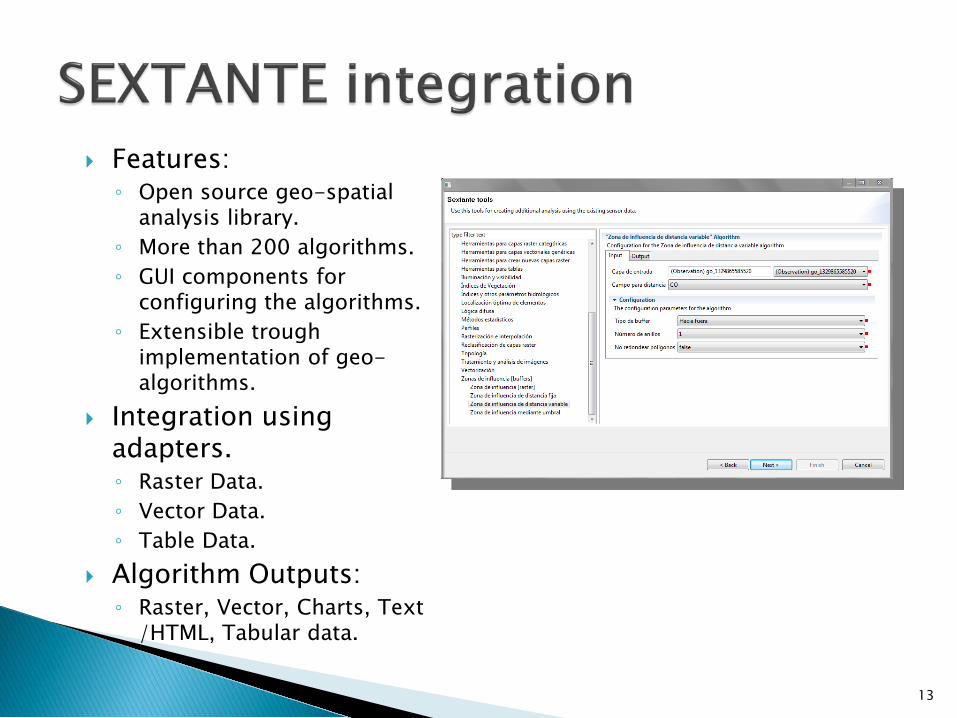
Features:◦ Open source geo-spatial
analysis library.◦ More than 200 algorithms.◦ GUI components for
configuring the algorithms. ◦ Extensible trough
implementation of geo-algorithms.
Integration using adapters. ◦ Raster Data.◦ Vector Data.◦ Table Data.
Algorithm Outputs:◦ Raster, Vector, Charts, Text
/HTML, Tabular data.
13
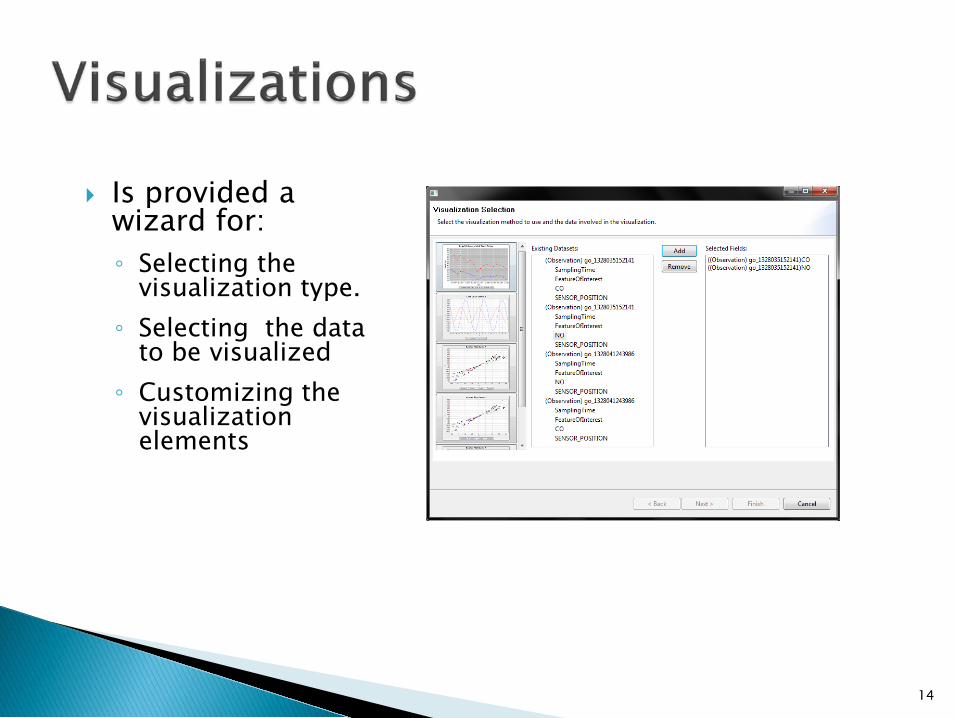
Is provided a wizard for:◦ Selecting the
visualization type. ◦ Selecting the data
to be visualized◦ Customizing the
visualization elements
14
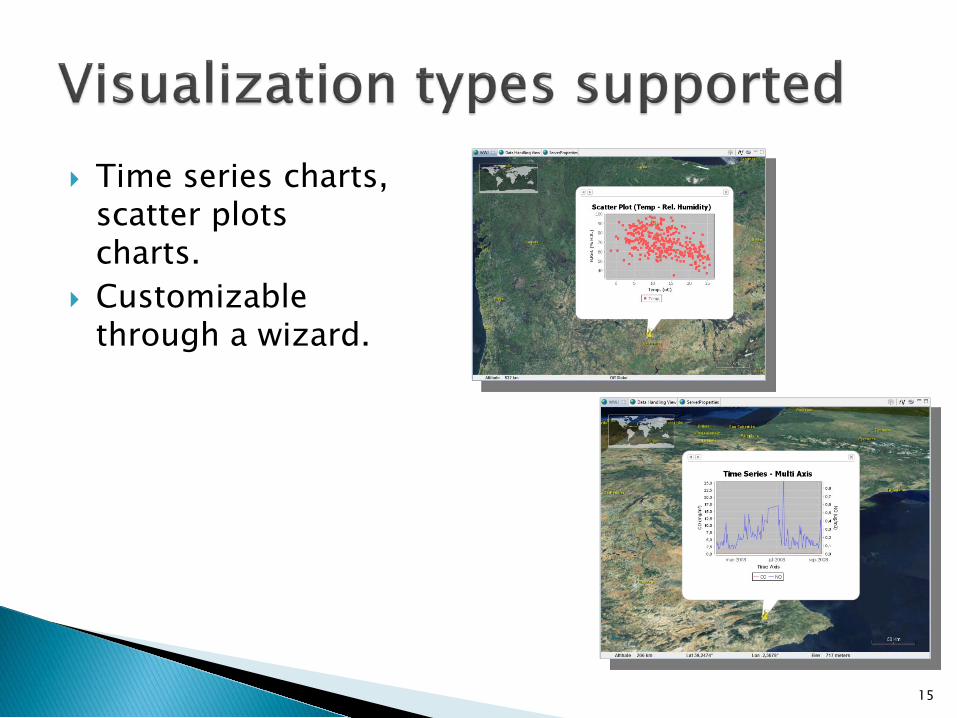
Time series charts, scatter plots charts.
Customizable through a wizard.
15
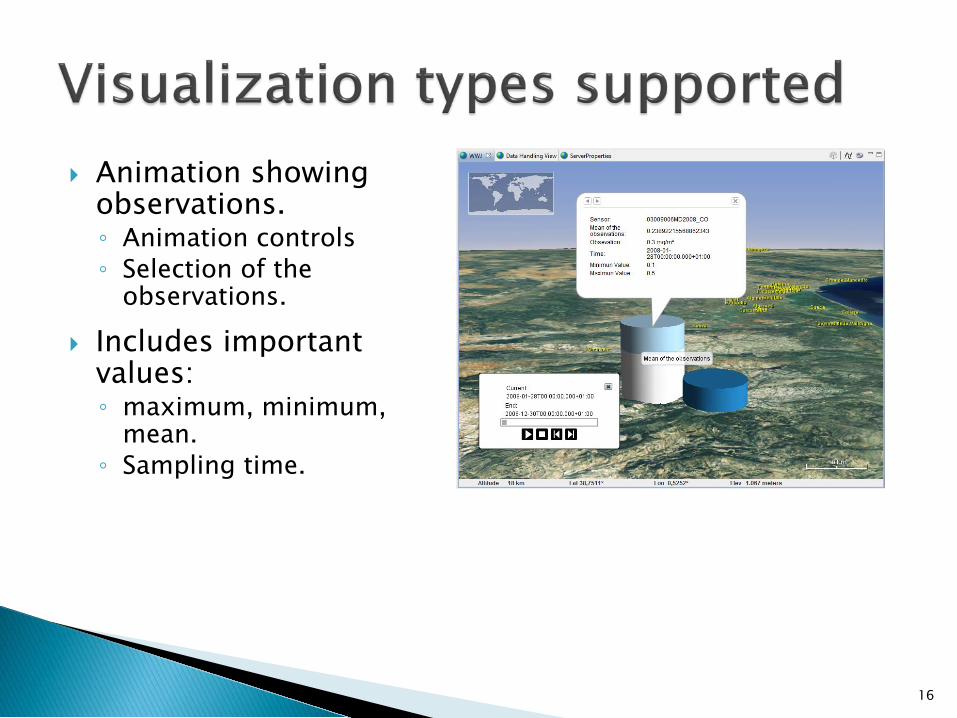
Animation showing observations.◦ Animation controls◦ Selection of the
observations.
Includes important values: ◦ maximum, minimum,
mean.◦ Sampling time.
16

SEXTANTE Results:◦ Charts.◦ HTML content◦ Vectors.◦ Tabular data.
Some examples:• Histogram • Statistics• Buffers generated with tree observations (radius depends on the observation)
17
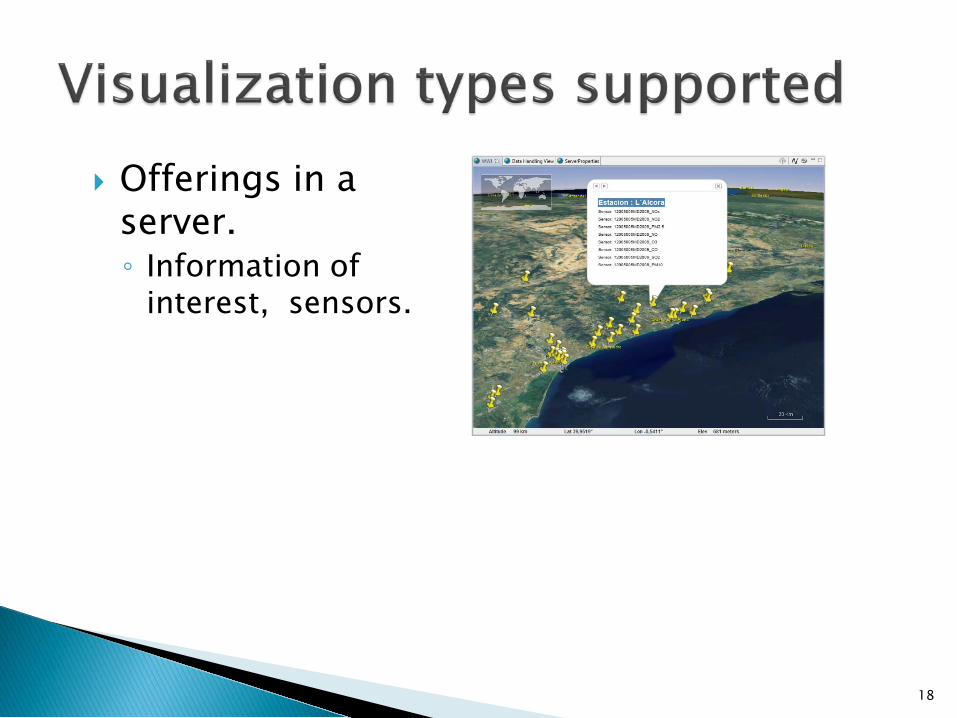
Offerings in a server.◦ Information of
interest, sensors.
18
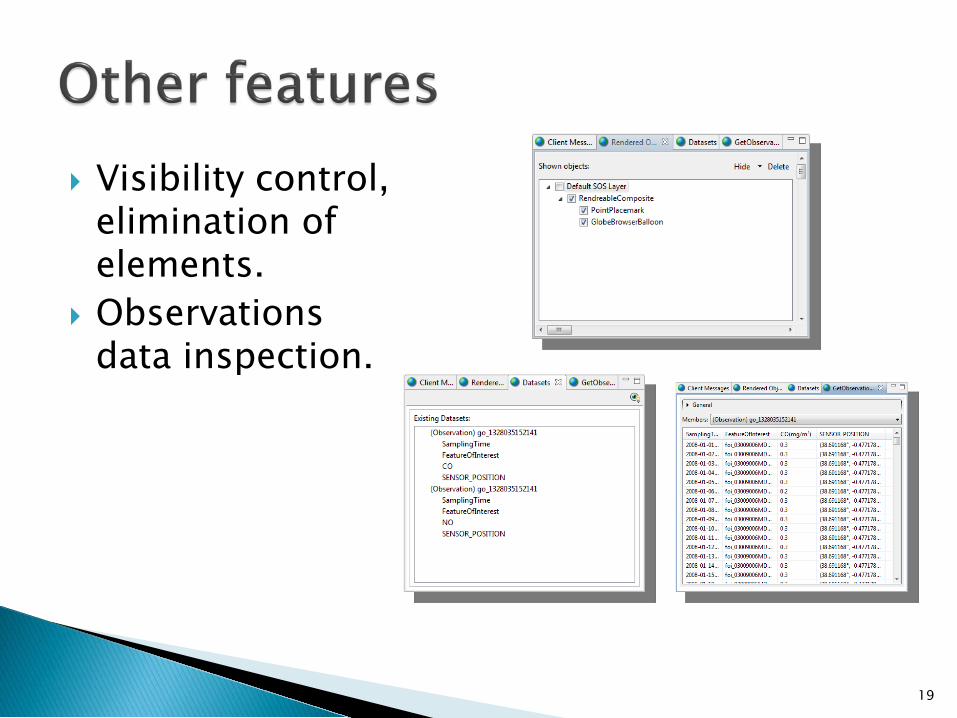
Visibility control, elimination of elements.
Observations data inspection.
19
The prototype application allows consuming, combining and analyzing sensor data from different sources.
The visualization types help the data exploration, comparability and discovery of relations.
The integration with SEXTANTE enhances the possibilities of performing analysis using sensor data.
Future work:◦ Inclusion of other visualization types.◦ Improve the interaction with the visualized content.◦ Work in ways of sharing the visualizations.◦ Improve the use of metadata.
20
Questions?
21