Embed Size (px)
Citation preview

NSF I-CorpsThe Lean LaunchPad
Lecture 6: Revenue Streams
How Do You Make Money?
Version 7/22/12

Revenue Streams
How do you Make Money?

© 2012 Steve Blank
Common Mistakes
• A Revenue Stream is the price I charge customers• I set the price of the product based on how much it
costs me to make it• My price has to be less than my competitors price

The Two Key Questions• What’s my revenue Streams?• Within the revenue streams– how do I
price the product?

Revenue Stream =
the strategy the company uses to generate cash from each customer
segment

Pricing Model =
the tactics you use to set the price in each customer segment

Revenue Stream
The strategy

What value are customers willing to pay for?

How do customers pay For products today?

How are they currently paying?
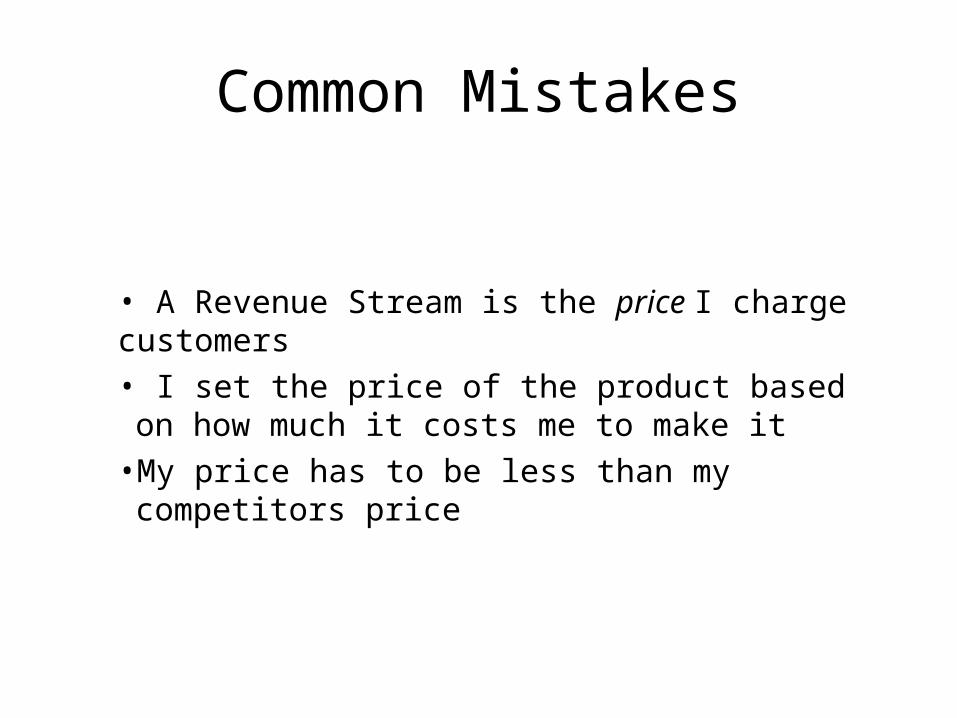
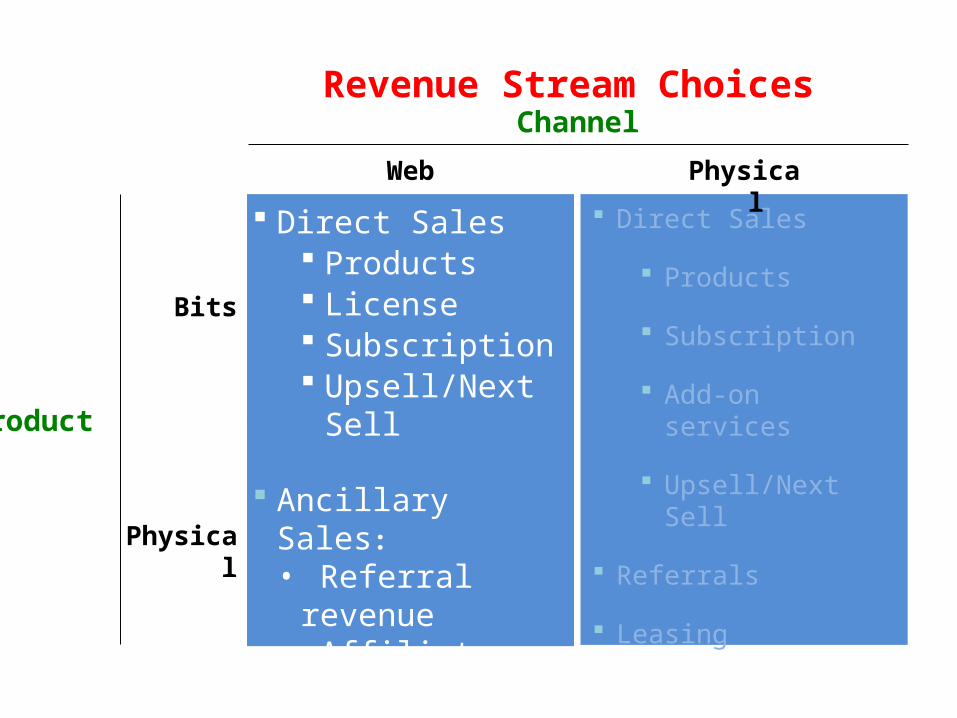
Revenue Stream Choices
Bits
Physical
Product
Web Physical
Channel
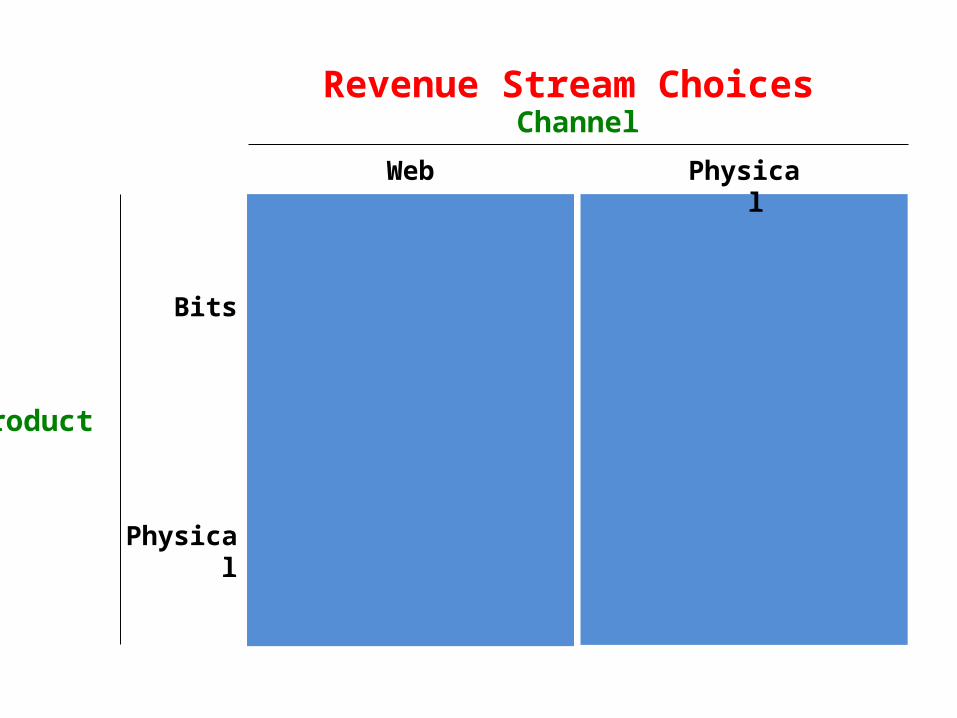
Revenue Stream Choices
Direct Sales
Products
Subscription
Add-on services
Upsell/Next Sell
Referrals
Leasing
Bits
Physical
Product
Web Physical
Channel
Revenue Stream Choices
Bits
Physical
Product
Web Physical
Channel
Direct Sales Products License Subscription Upsell/Next Sell
Ancillary Sales:• Referral revenue • Affiliate revenue• E-mail list rentals• Back-end offers
Direct Sales
Products
Subscription
Add-on services
Upsell/Next Sell
Referrals
Leasing

Common categories of revenue models
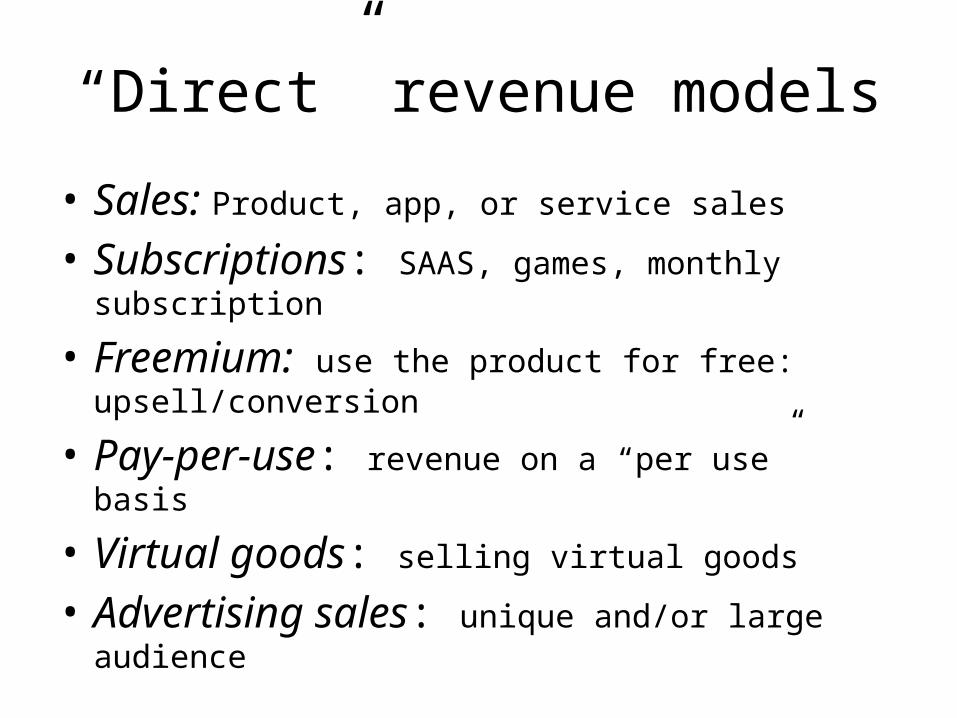
“Direct” revenue models
• Sales: Product, app, or service sales
• Subscriptions: SAAS, games, monthly subscription
• Freemium: use the product for free: upsell/conversion
• Pay-per-use: revenue on a “per use” basis
• Virtual goods: selling virtual goods
• Advertising sales: unique and/or large audience

“Ancillary” revenue models
• Referral revenue: pay for referring traffic/customers to other web or mobile sites or products.
• Affiliate revenue: finder’s fees/commissions from other sites for directing customers to make purchases at the affiliated site
• E-mail list rentals: rent your customer email lists to advertiser partners
• Back-end offers: add-on sales items from other companies as part of their registration or purchase confirmation processes, or “sell” their existing traffic to a company that strives to monetize it and share the resulting revenu3
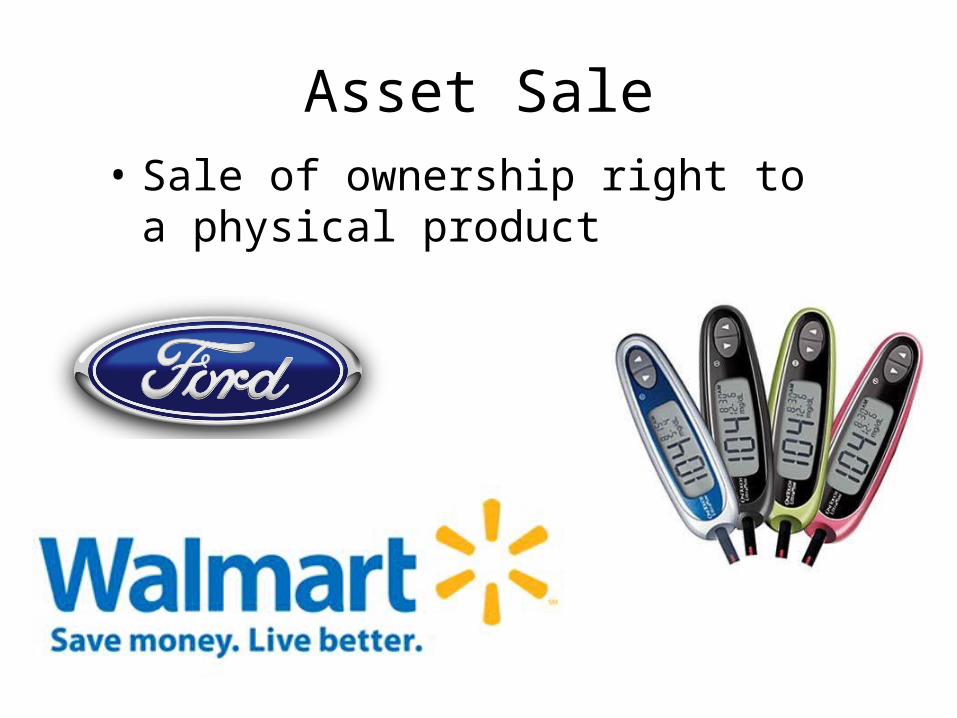
Asset Sale• Sale of ownership right to a physical
product

Usage Fee• Usage of service. Fee is proportional to
the usage of the service.

Subscription Fee
• Fee for continuous access to a service

Renting
• Fee for temporary access to a good or service

Licensing
• Fee for use of some IP (including software)
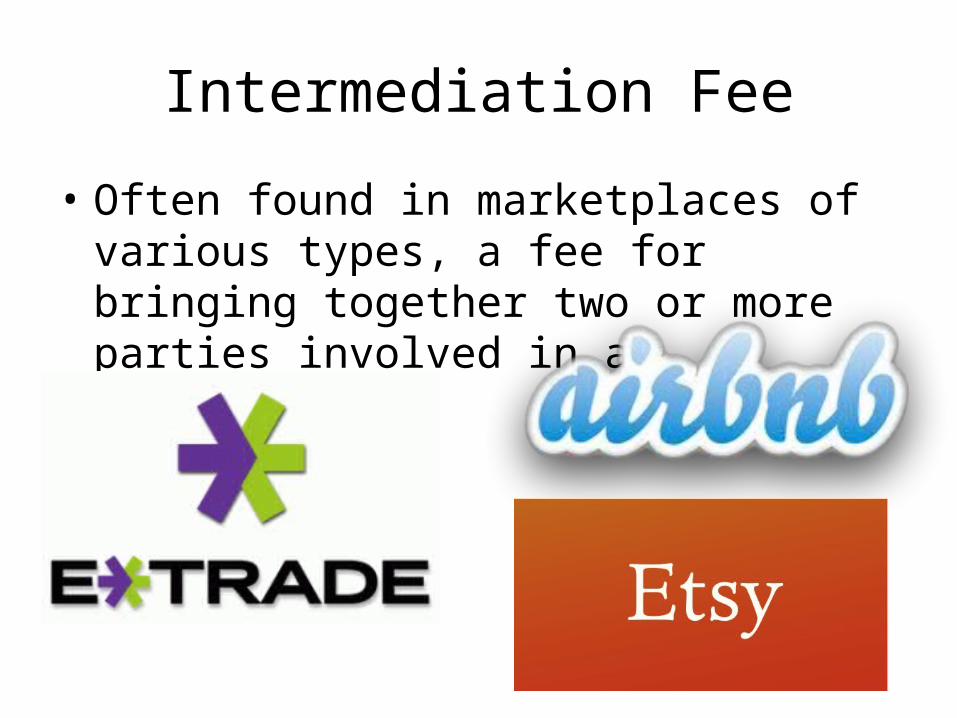
Intermediation Fee
• Often found in marketplaces of various types, a fee for bringing together two or more parties involved in a transaction

Advertising
• Fee paid by brands and companies to get in front of potential customers
Each Revenue Stream may have different pricing tactics

Pricing Model
the tactics
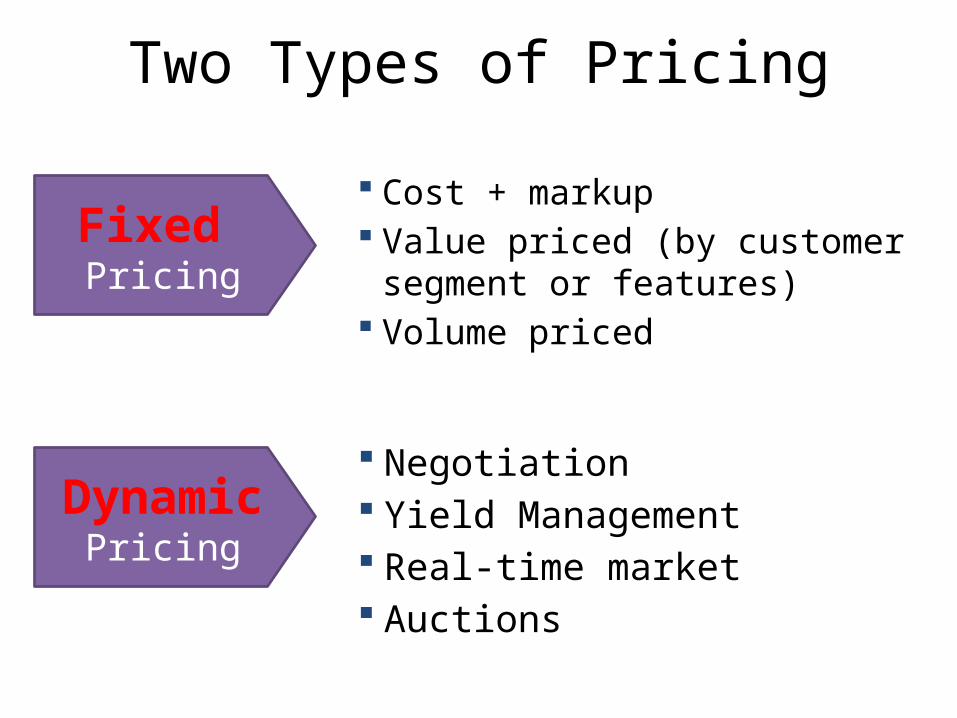
Two Types of Pricing
Cost + markup Value priced (by customer segment
or features) Volume priced
Fixed Pricing
Dynamic Pricing
Negotiation Yield Management Real-time market Auctions
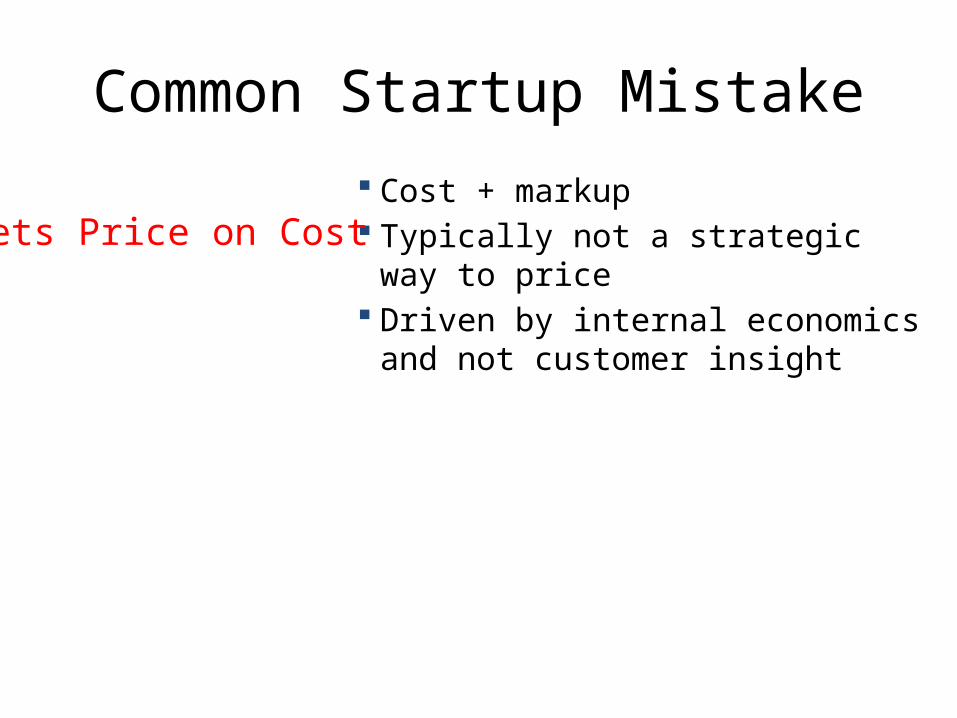
Common Startup Mistake Cost + markup Typically not a strategic way to price Driven by internal economics and not
customer insight
Lets Price on Cost

Common Startup Mistake Cost + markup Typically not a strategic way to price Driven by internal economics and not
customer insight
Based on buyer’s perception of value (e.g. time saved, new efficiency created, etc.)
Customers don’t necessarily feel that they want to pay this way
Lets Price on Cost
Price on Value

Market-Type Affects Pricing
• Pure competition• Oligopoly• Monopoly
Nature of Existing Market
How they will react?
What is their product? What are their costs and prices? “What pricing will make them feel
the worst?”

Single versus Multi-sided Markets
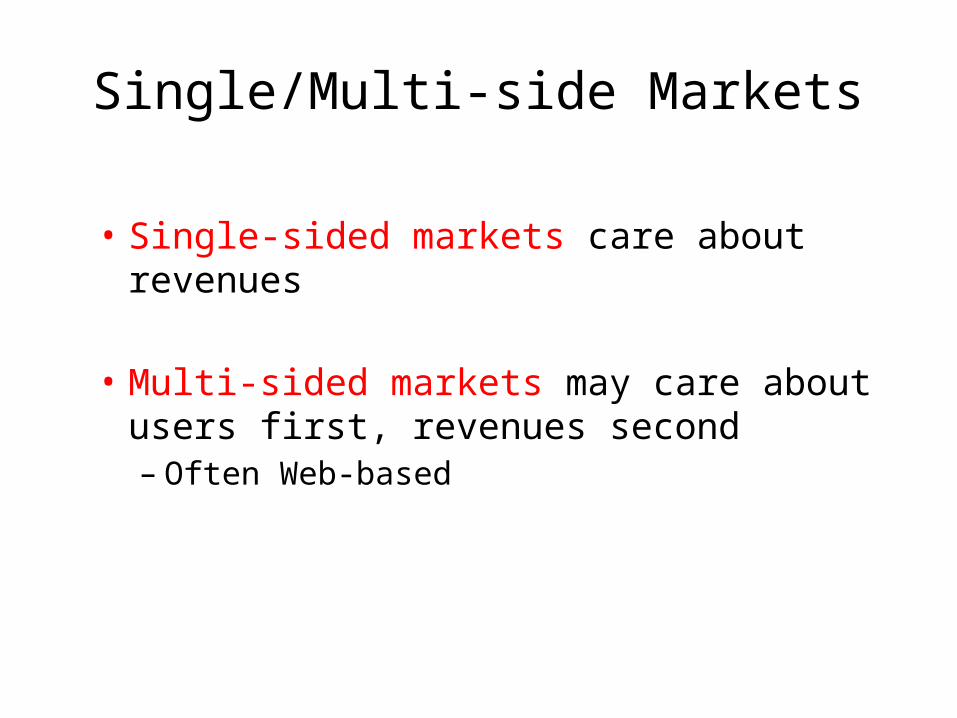
Single/Multi-side Markets
• Single-sided markets care about revenues
• Multi-sided markets may care about users first, revenues second– Often Web-based
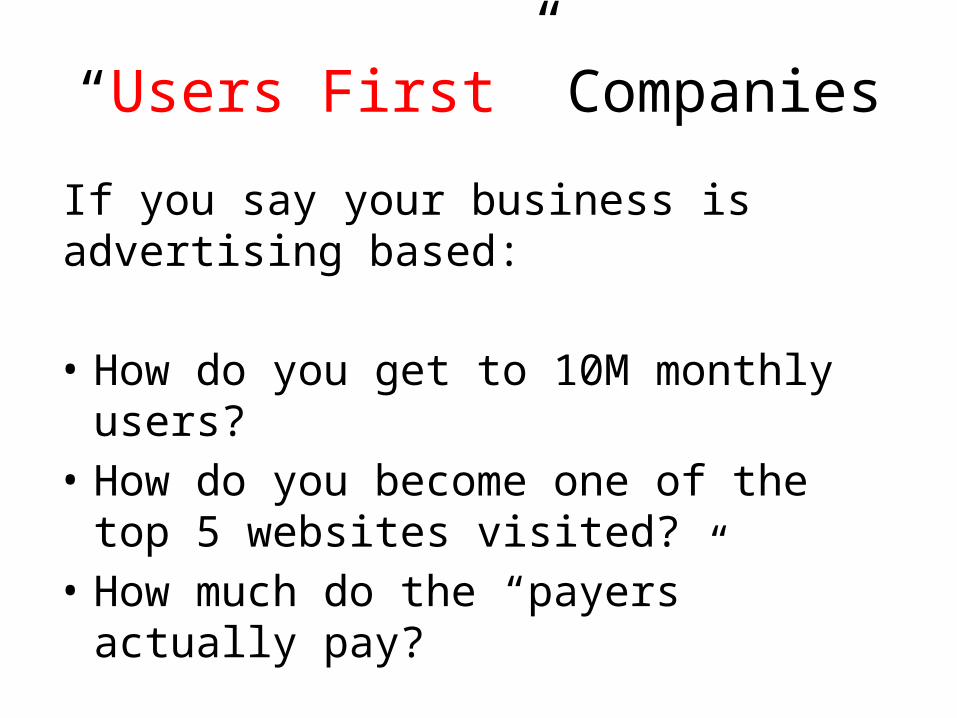
“Users First” Companies
If you say your business is advertising based:
• How do you get to 10M monthly users?• How do you become one of the top 5 websites
visited?• How much do the “payers” actually pay?
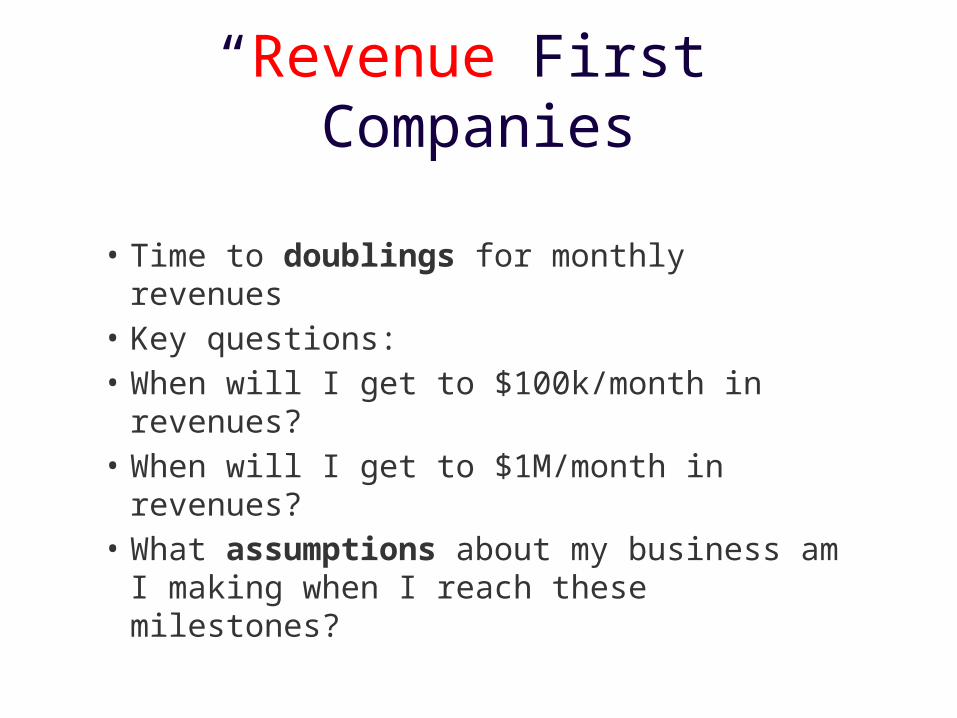
“Revenue First” Companies
• Time to doublings for monthly revenues• Key questions:• When will I get to $100k/month in revenues?• When will I get to $1M/month in revenues?• What assumptions about my business am I
making when I reach these milestones?

Market Type and Revenue
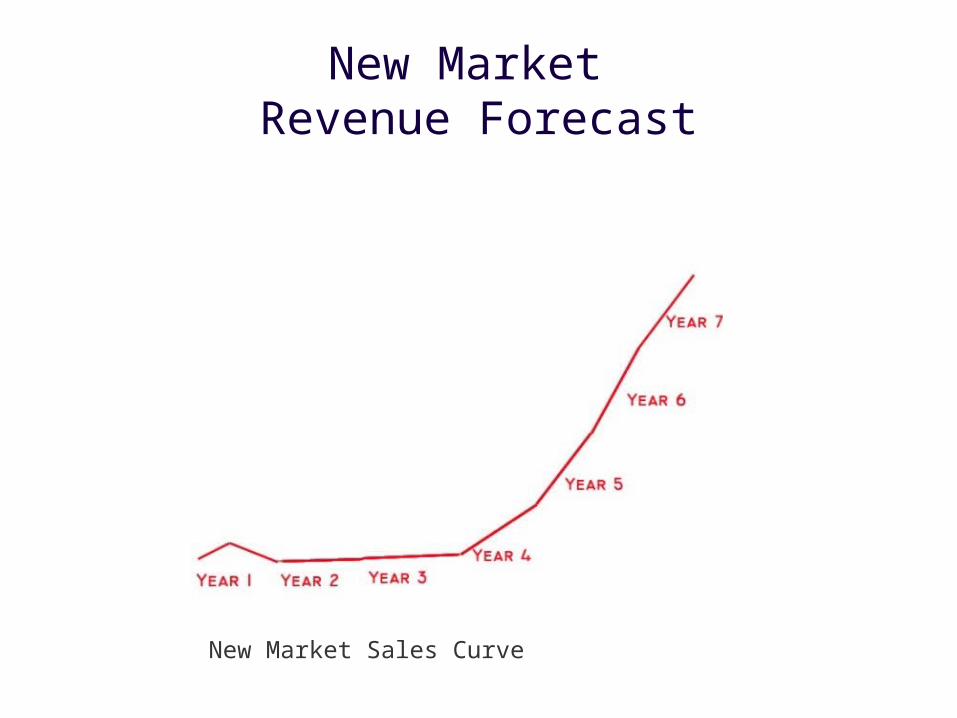
New Market Revenue Forecast
New Market Sales Curve

Existing Market Revenue Forecast
Existing Market

Resegmented Market Revenue Forecast
Revenue Model Summary
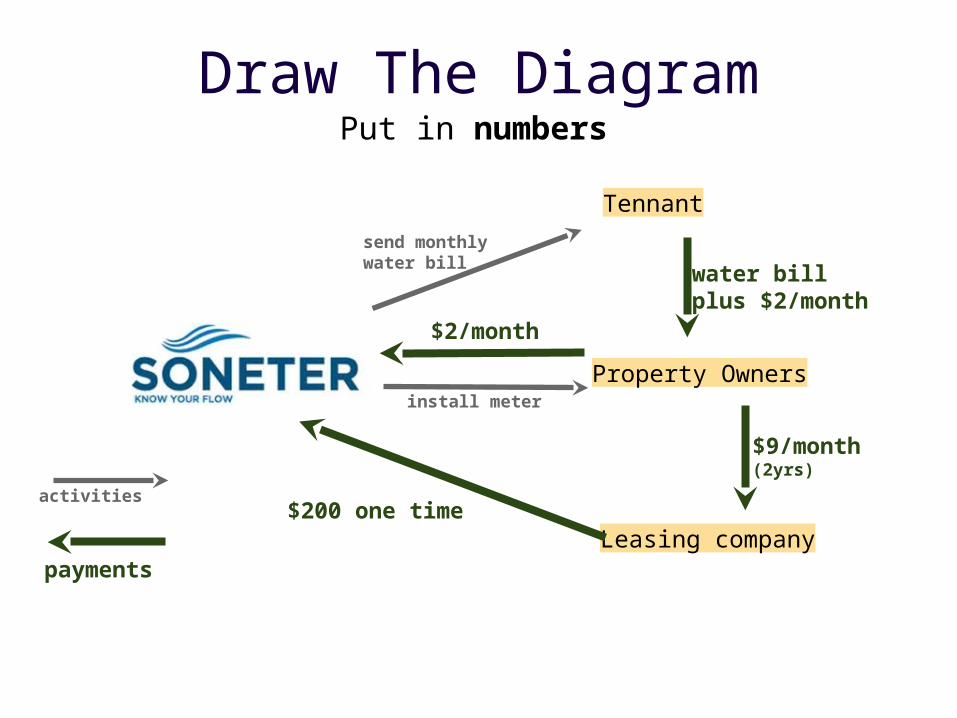
Draw The Diagram
Leasing company
Tennant
Property Ownersinstall meter
send monthlywater bill
$9/month(2yrs)
$200 one time
water billplus $2/month
$2/month
activities
payments
Put in numbers
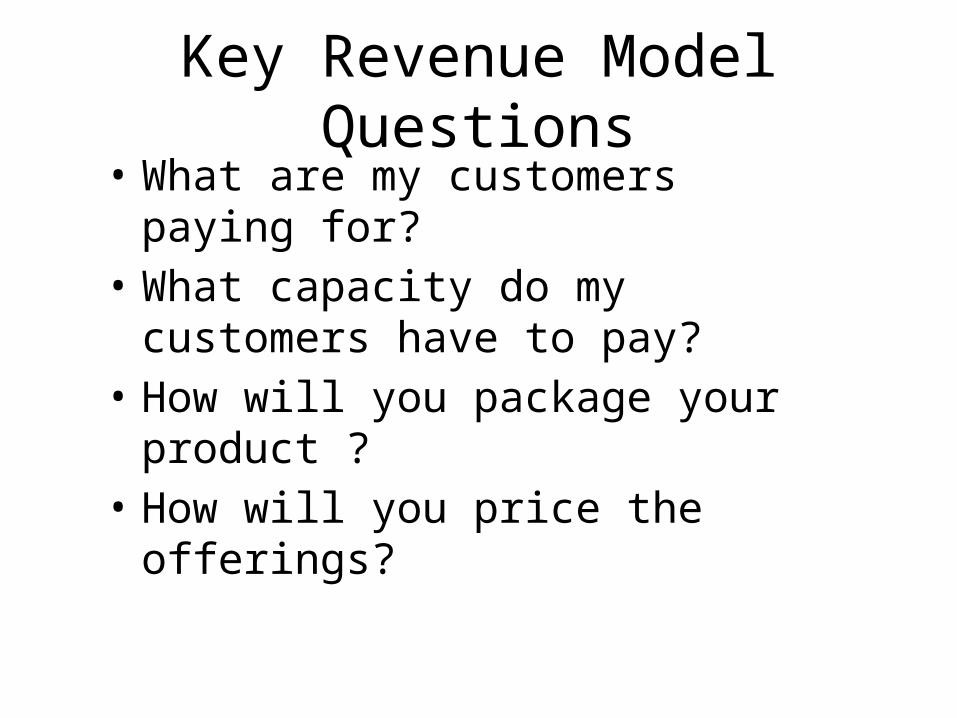
Key Revenue Model Questions• What are my customers paying for?• What capacity do my customers have to
pay?• How will you package your product ?• How will you price the offerings?
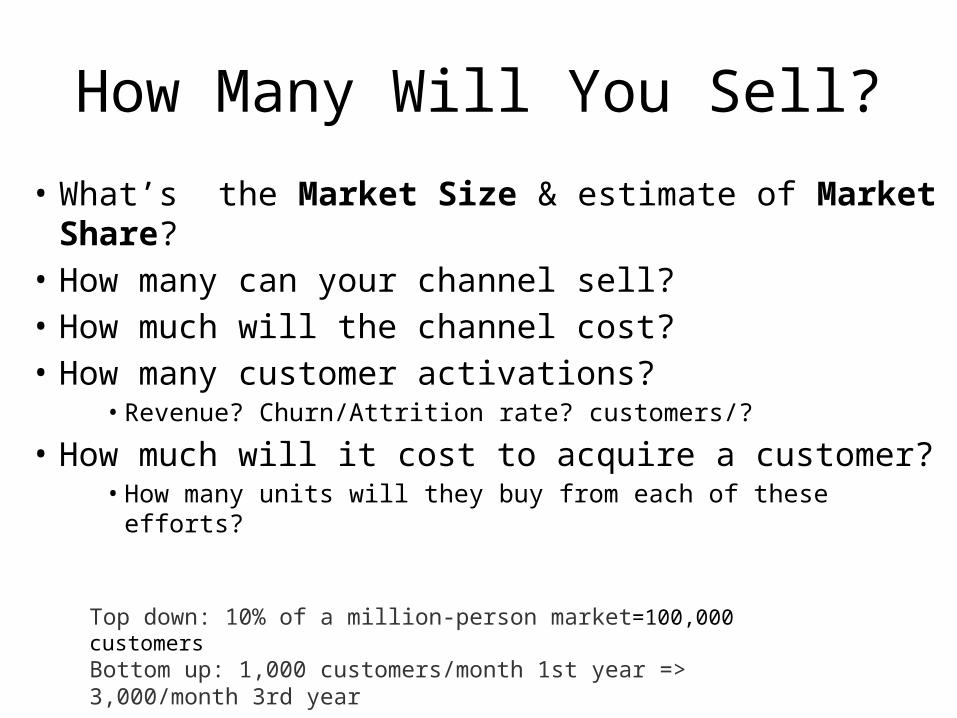
How Many Will You Sell?
• What’s the Market Size & estimate of Market Share?
• How many can your channel sell?• How much will the channel cost?• How many customer activations?
• Revenue? Churn/Attrition rate? customers/?
• How much will it cost to acquire a customer?• How many units will they buy from each of these efforts?
Top down: 10% of a million-person market=100,000 customersBottom up: 1,000 customers/month 1st year => 3,000/month 3rd year
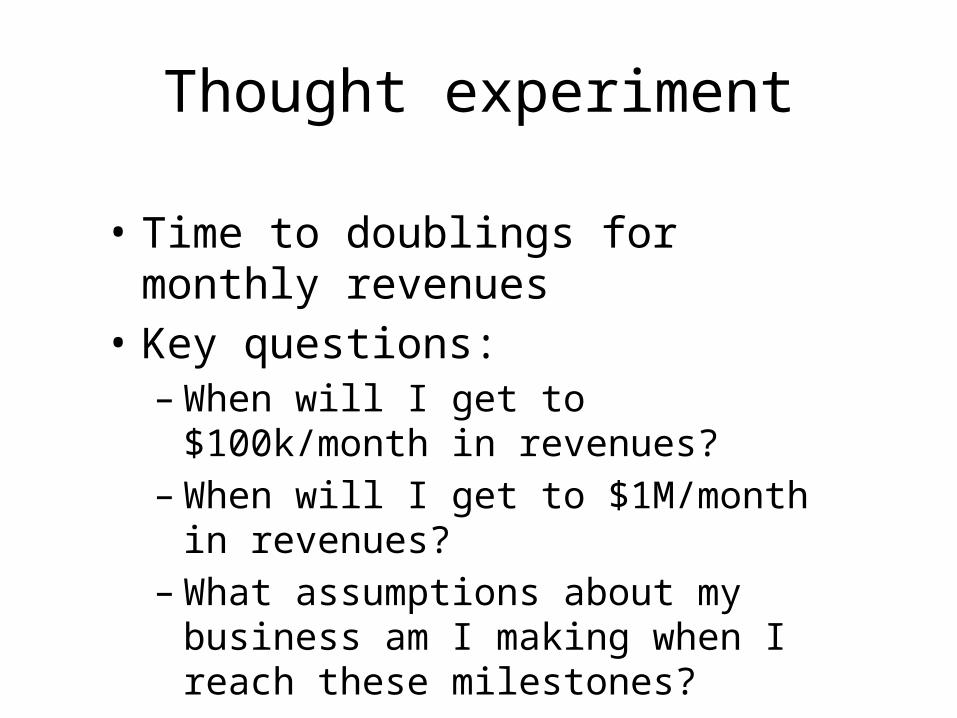
Thought experiment
• Time to doublings for monthly revenues• Key questions:
– When will I get to $100k/month in revenues?
– When will I get to $1M/month in revenues?– What assumptions about my business am I
making when I reach these milestones?
Reading For Next Week
• Startup Owners Manual– pages 176-179 partners 257-270 and 429-459
Optical Equipment Revenue Model Example
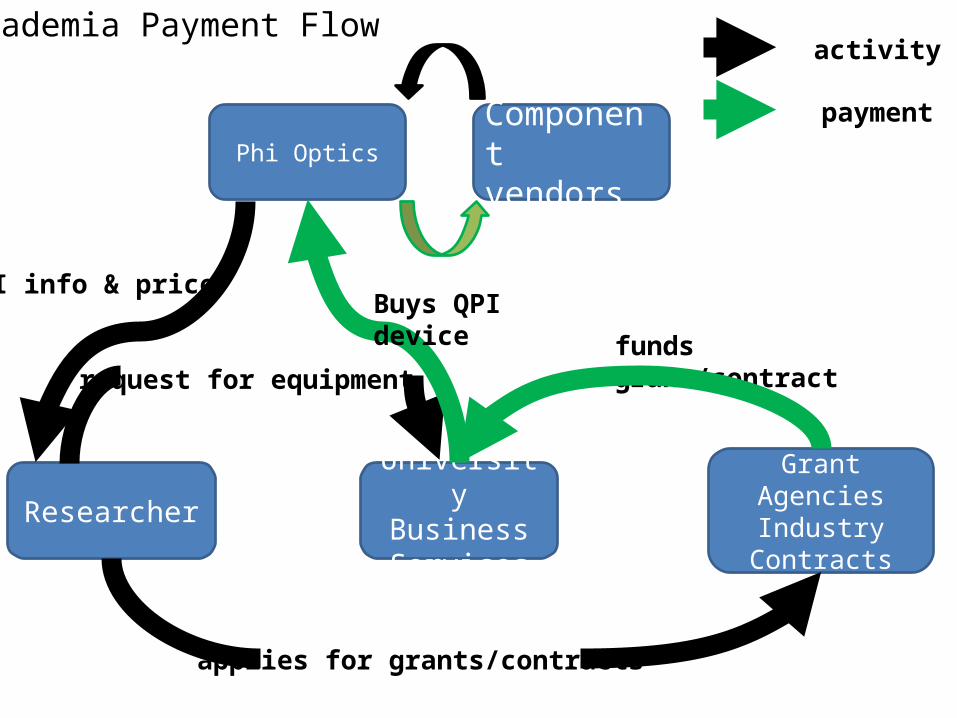
Phi OpticsComponent vendors
University Business Services
Researcher Grant AgenciesIndustry Contracts
applies for grants/contracts
funds grant/contractrequest for equipment
QPI info & price
activity
payment
Academia Payment Flow
Buys QPI device
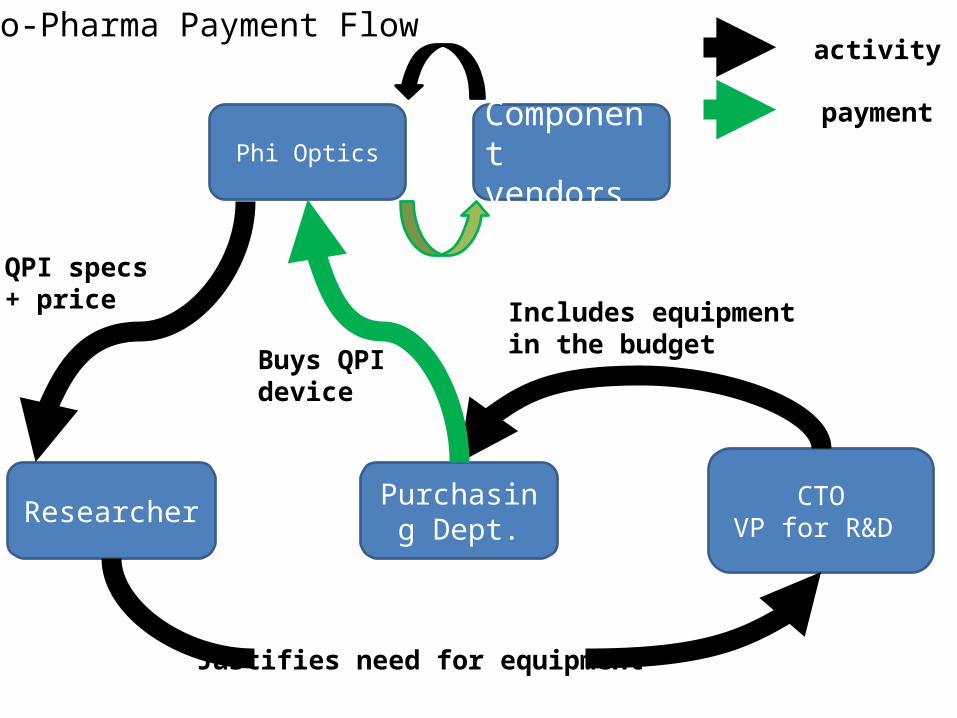
Phi OpticsComponent vendors
Purchasing Dept.Researcher CTO
VP for R&D
Justifies need for equipment
Includes equipment in the budget
QPI specs + price
activity
payment
Bio-Pharma Payment Flow
Buys QPI device

Phi OpticsEquipment suppliers
Accounting Dept.
Product Dev Engineers +
Business Dev ($) + Legal Dept (royalties)
CTOVP for R&D
Justifies QPI integration in OEM systemSuggests co-development deal
Allocates funds in the budget
QPI specs + price+ SOW
activity
payment
OEM Payment Flow
Funds SOWPays royalties/sub-licensing/other recurring fees

Nitrate SensorRevenue Model Example
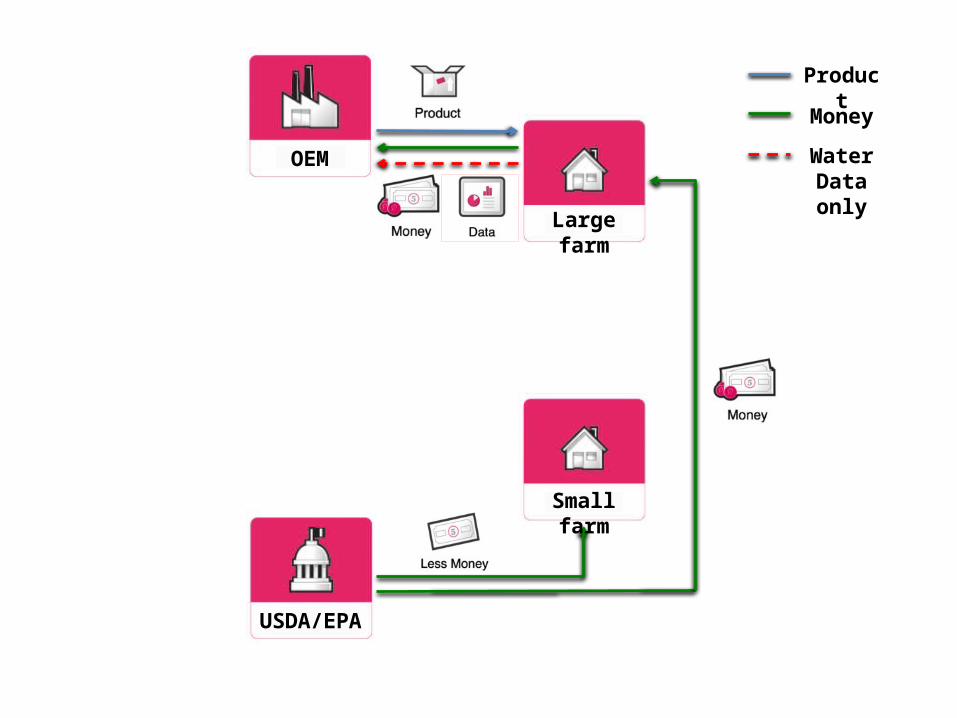
OEM
Large farm
USDA/EPA
Small farm
Product
Money
Water Data only

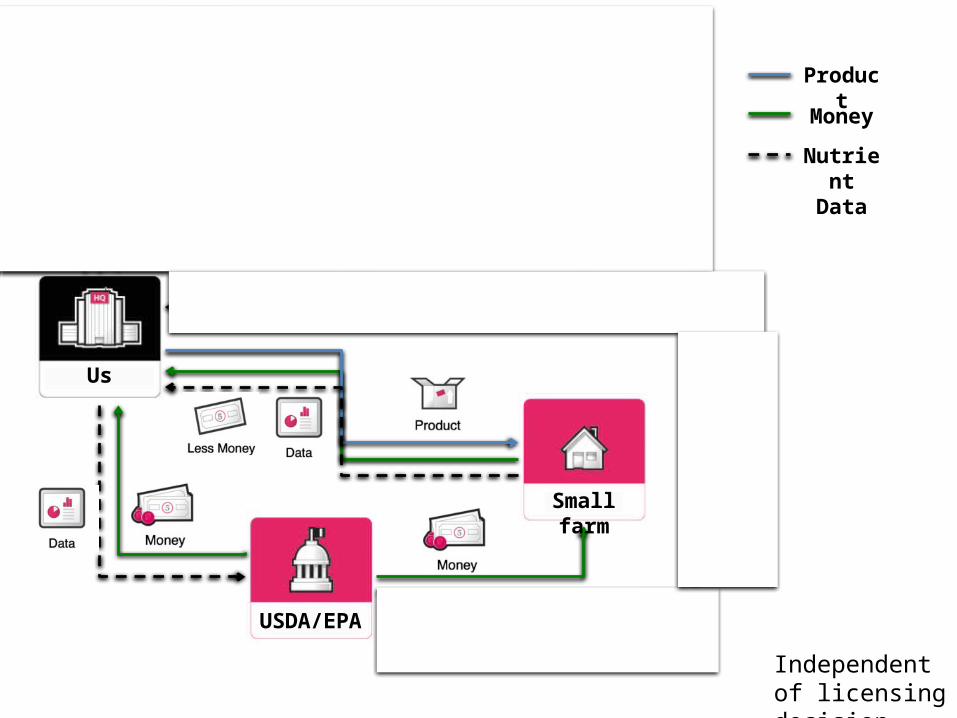
OEM
Us
Large farm
USDA/EPA
Small farm
Product
Money
Nutrient Data
Product sales

OEM
Us
Large farm
USDA/EPA
Small farm
Product
Money
Nutrient Data
Licensing/sales
OEM
Us
Large farm
USDA/EPA
Small farm
Product
Money
Nutrient Data
Independent of licensing decision
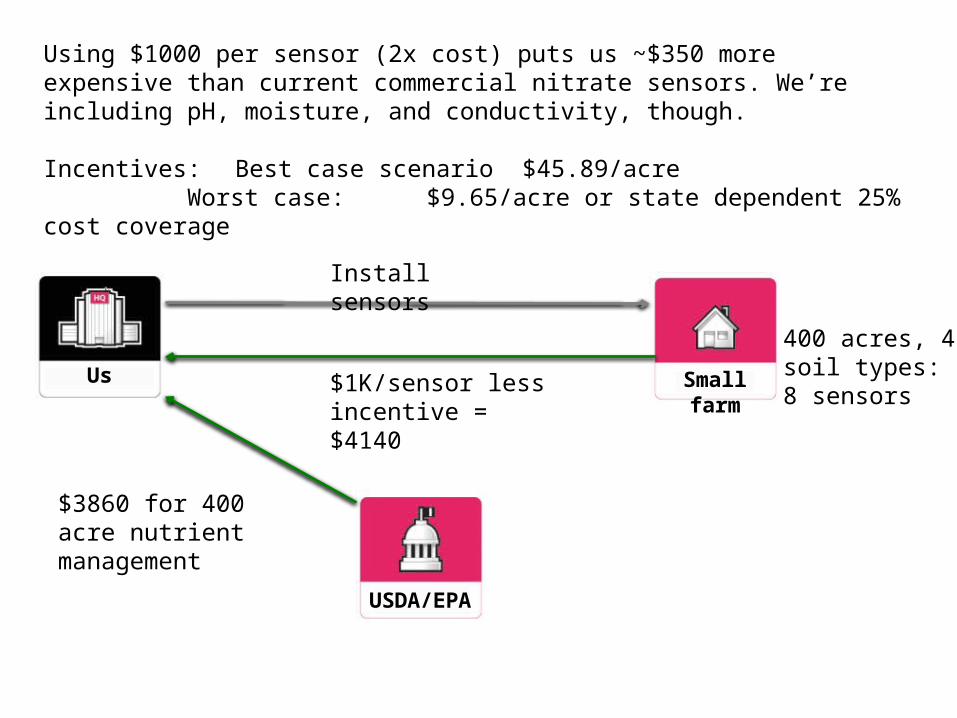
Us
USDA/EPA
Small farm
400 acres, 4 soil types: 8 sensors
Install sensors
$1K/sensor less incentive = $4140
Using $1000 per sensor (2x cost) puts us ~$350 more expensive than current commercial nitrate sensors. We’re including pH, moisture, and conductivity, though.
Incentives: Best case scenario $45.89/acreWorst case: $9.65/acre or state dependent
25% cost coverage
$3860 for 400 acre nutrient management
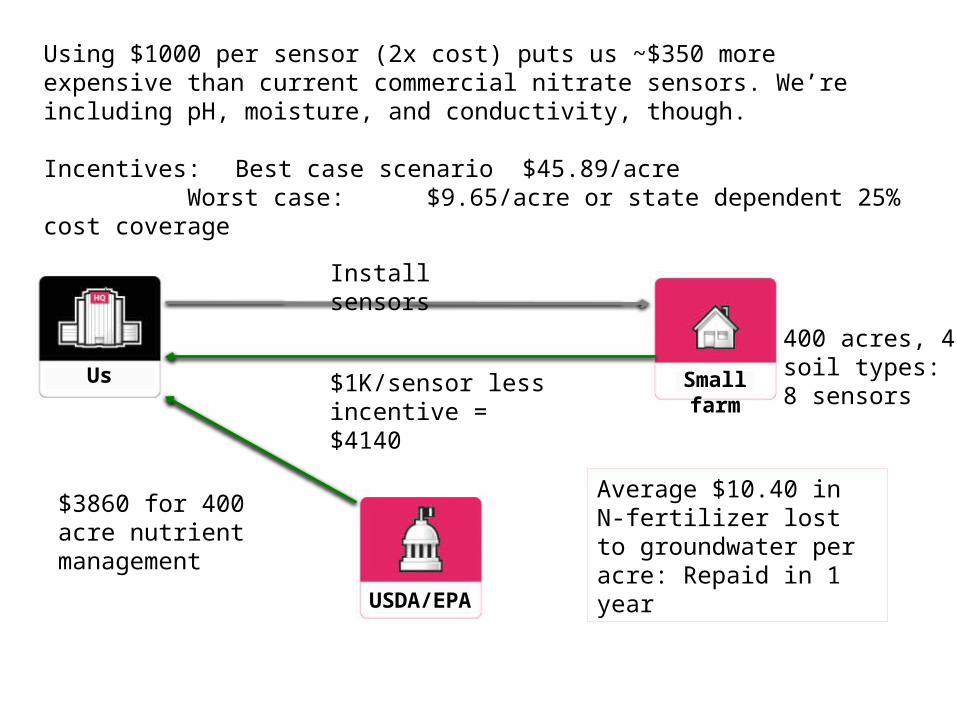
Average $10.40 in N-fertilizer lost to groundwater per acre: Repaid in 1 year

Bio-Based Chemical IntermediatesRevenue Model Example
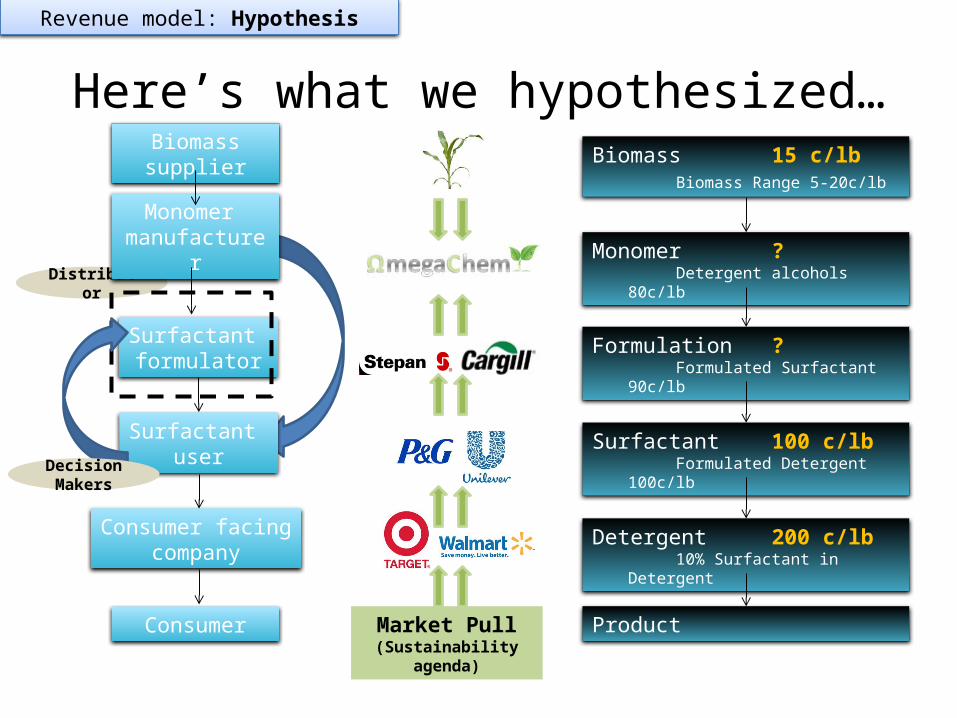
Here’s what we hypothesized…
Distributor
Monomer manufacturer
Surfactant formulator
Surfactant user
Consumer facingcompany
Consumer Market Pull(Sustainability agenda)
Revenue model: Hypothesis
Biomass supplier Biomass 15 c/lbBiomass Range 5-20c/lb
Monomer ?Detergent alcohols 80c/lb
Formulation ?Formulated Surfactant
90c/lb
Surfactant 100 c/lbFormulated Detergent
100c/lb
Detergent 200 c/lb10% Surfactant in
Detergent
Product
Decision Makers
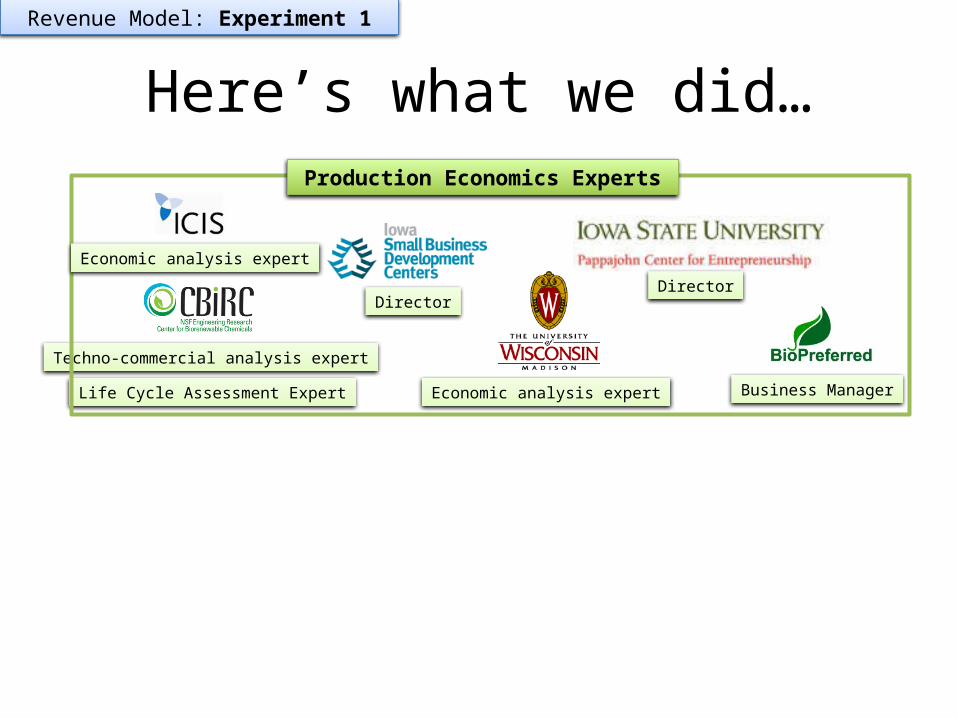
Here’s what we did…
Techno-commercial analysis expert
Revenue Model: Experiment 1
Life Cycle Assessment Expert Economic analysis expert
DirectorDirector
Production Economics Experts
Business Manager
Economic analysis expert

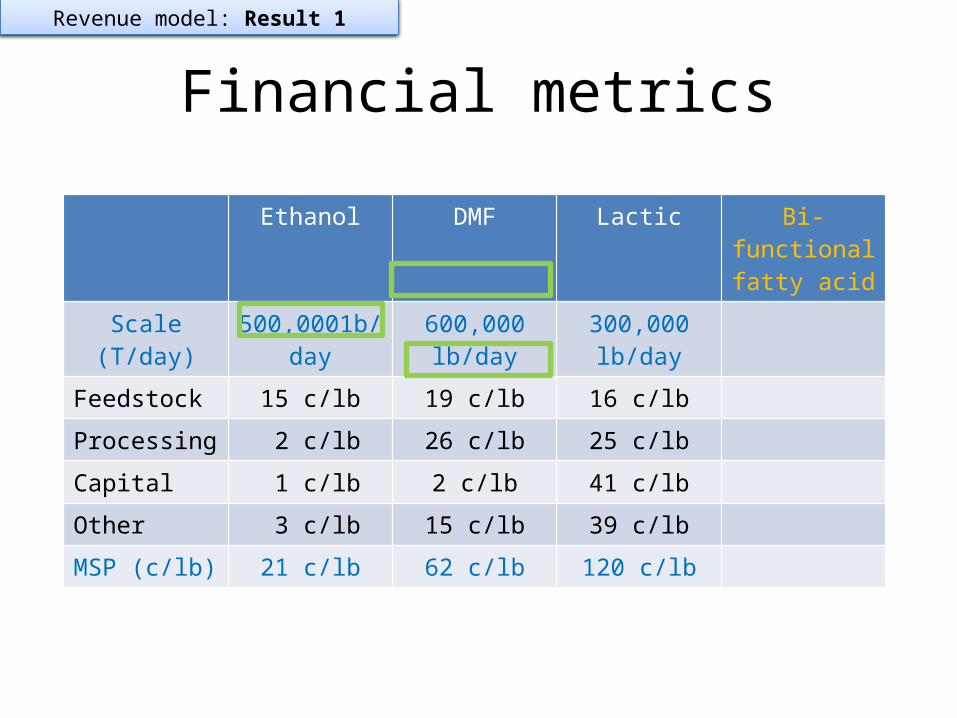
Financial metrics
Ethanol DMF Lactic Bi-functional fatty acid
Scale (T/day) 500,0001b/day
600,000 lb/day
300,000 lb/day
Feedstock 15 c/lb 19 c/lb 16 c/lb
Processing 2 c/lb 26 c/lb 25 c/lb
Capital 1 c/lb 2 c/lb 41 c/lb
Other 3 c/lb 15 c/lb 39 c/lb
MSP (c/lb) 21 c/lb 62 c/lb 120 c/lb
Revenue model: Result 1
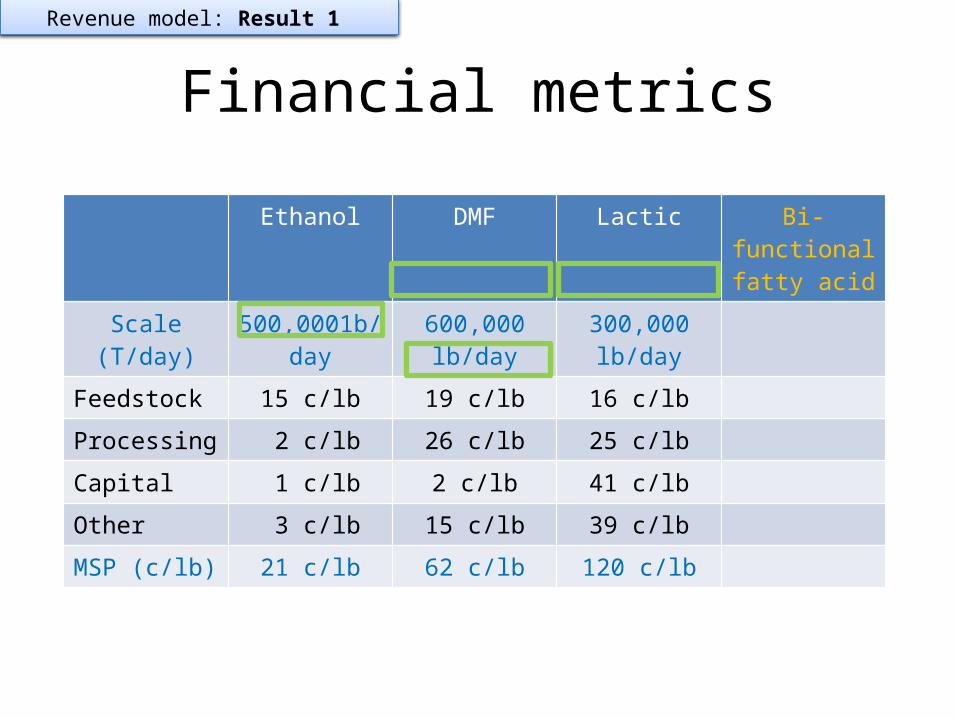
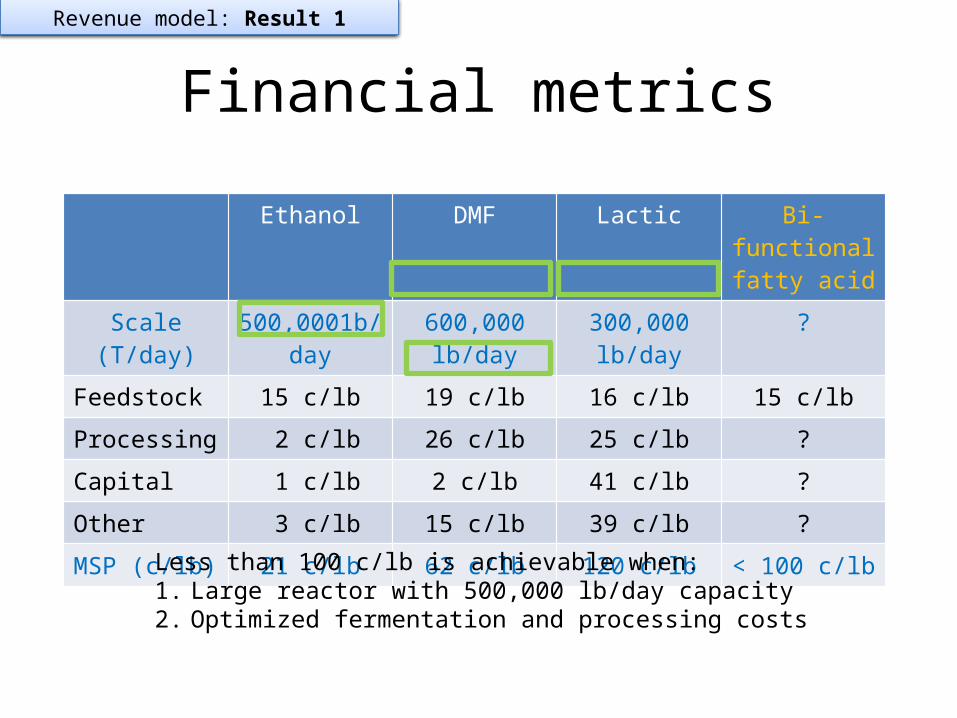
Financial metrics
Ethanol DMF Lactic Bi-functional fatty acid
Scale (T/day) 500,0001b/day
600,000 lb/day
300,000 lb/day
?
Feedstock 15 c/lb 19 c/lb 16 c/lb 15 c/lb
Processing 2 c/lb 26 c/lb 25 c/lb ?
Capital 1 c/lb 2 c/lb 41 c/lb ?
Other 3 c/lb 15 c/lb 39 c/lb ?
MSP (c/lb) 21 c/lb 62 c/lb 120 c/lb < 100 c/lb
Revenue model: Result 1
Less than 100 c/lb is achievable when:1. Large reactor with 500,000 lb/day capacity2. Optimized fermentation and processing costs

Payment Flow
Distributor
Monomer manufacturer
Surfactant formulator
Surfactant user
Consumer facingcompany
Consumer Market Pull(Sustainability agenda)
Revenue model: Result 2
Biomass supplier Biomass 15 c/lbBiomass Range 5-20c/lb
Monomer 80 c/lbDetergent alcohols 80c/lb
Formulation 90 c/lbFormulated Surfactant
90c/lb
Surfactant 100 c/lbFormulated Detergent
100c/lb
Detergent 200 c/lb10% Surfactant in
Detergent
Product
Decision Makers
Disposal WasteRegulations

Payment Flows Example

CanScan Payment Flows
Class 6 - Update 3.5.2012
CanScan
Hospital / Clinic
Oncologist
Private payer/MAC
Pathologist/ billing
Sales/orderPaymentService
Services rendered
$$
$$
Clinical Diagnostic Services
CanScan
Pharmaceutical Company
Researchers
Sales/orderPaymentService
$$
Pharmaceutical Products
Instr. /Kits
Medical DevicePricing Example
MammOpticsPricing Strategy
Equipment Lease model
Per-use model
Consumable
Cost of the device
Service per year
Per-use fee
Consumable
$50,000
$3,000
0
0
$5,000
$10,000
0
0
$5,000
0
$50
0
$25,000
0
0
$20
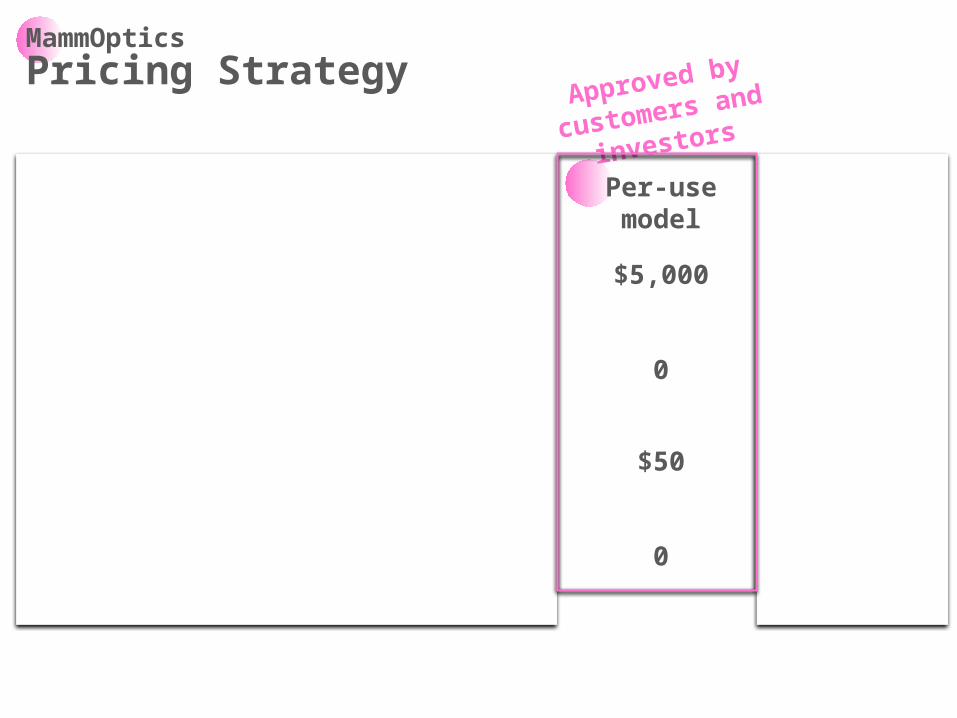
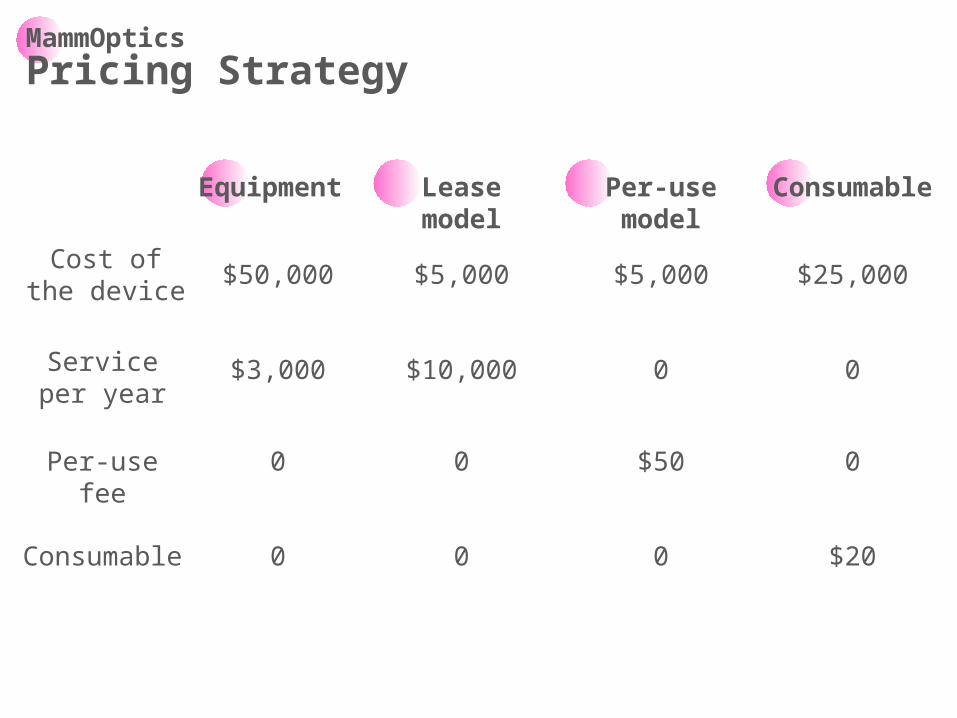
MammOpticsPricing Strategy
Equipment Lease model
Per-use model
Consumable
Cost of the device
Service per year
Per-use fee
Consumable
$50,000
$3,000
0
0
$5,000
$10,000
0
0
$5,000
0
$50
0
$25,000
0
0
$20
Approved by
customers and
investors
GrapheneRevenue Model Example
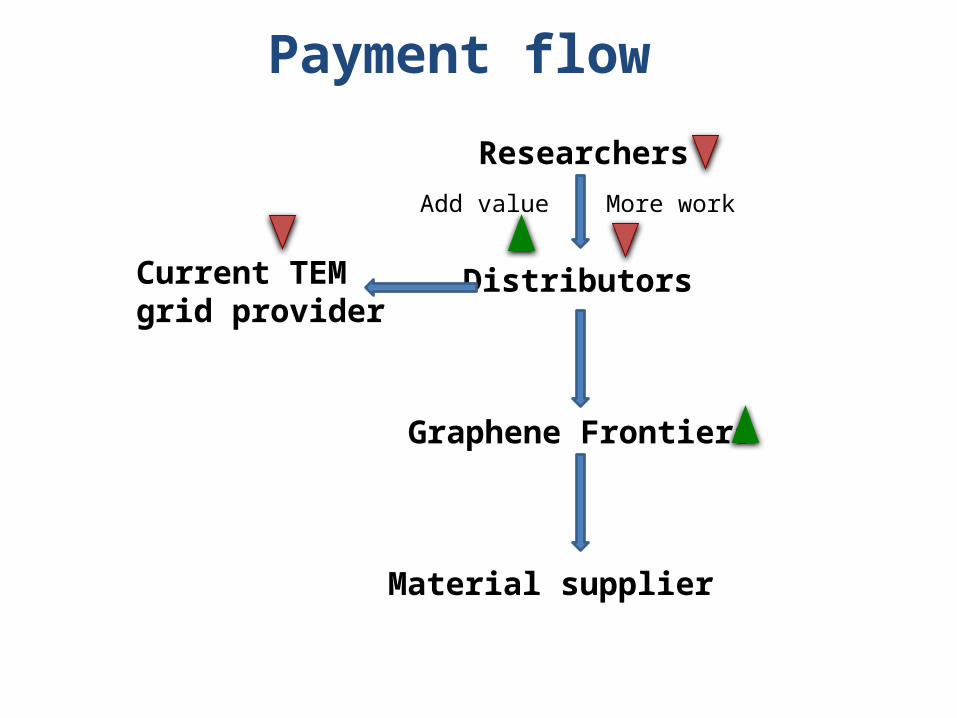
Distributors
Researchers
Graphene Frontiers
Current TEM grid provider
More workAdd value
Material supplier
Payment flow
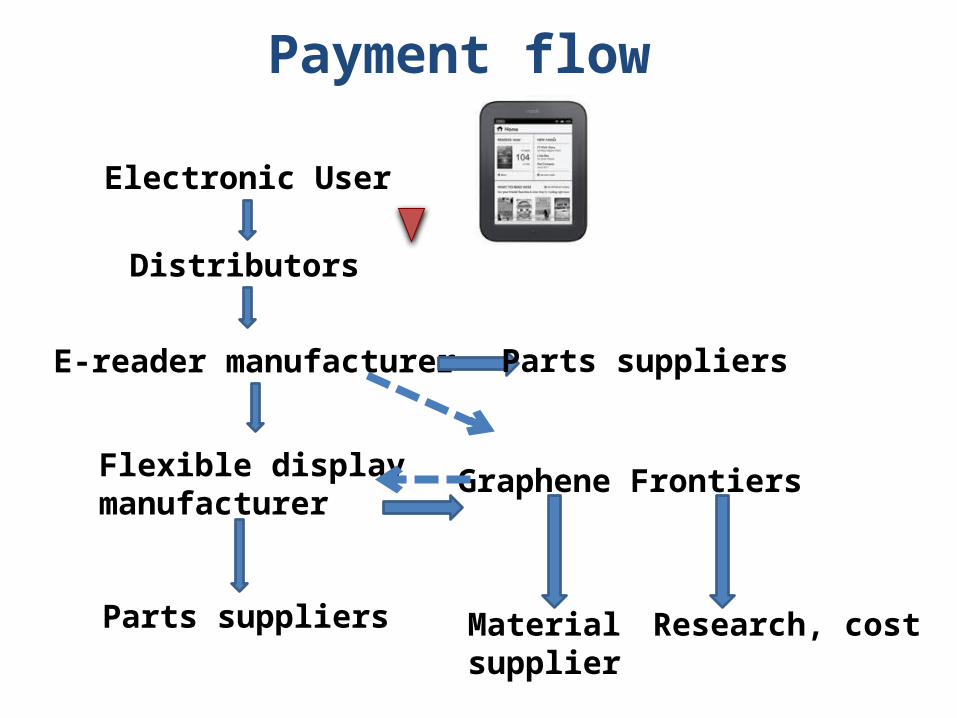
Distributors
Graphene Frontiers
Material supplier
Flexible display manufacturer
Electronic User
Research, cost
E-reader manufacturer Parts suppliers
Parts suppliers
Payment flow

Direct Cost Estimates: Scale Matters• Cost per in2 – 1” Furnace = $.80
• Cost per in2 – 2” Furnace = $.45
• Cost per in2 – 4” Furnace = $.20
If we can move to N (replacing Ar, key direct cost driver)
• Cost per in2 – 1” Furnace = $.50
• Cost per in2 – 2” Furnace = $.25
• Cost per in2 – 4” Furnace = $.10
“Holy Grail”: 4” or larger continuous production w/Nitrogen
Cost per in2 – 4” Furnace, Batch/Continuous = … $.05
SensorPricing Tactics Example

Technology Supplier
Industrial Plants
Plant #1
Plant #2
Plant #3
Understand Economics of Plant + Sensors
Understand Economics of Technology Supplier
Value pricingWho does this?

75Diaphragm Membrane
$240/MT Cl2
Cost of damages + downtime per incident per year
Operational conditions Capital cost per incident Downtime per incident # of cells protected Time between incidents Number of cells, US and worldwide
Diaphragm Membrane Membrane Header
$2,500 $270 $10,600
Value per unit per year
76
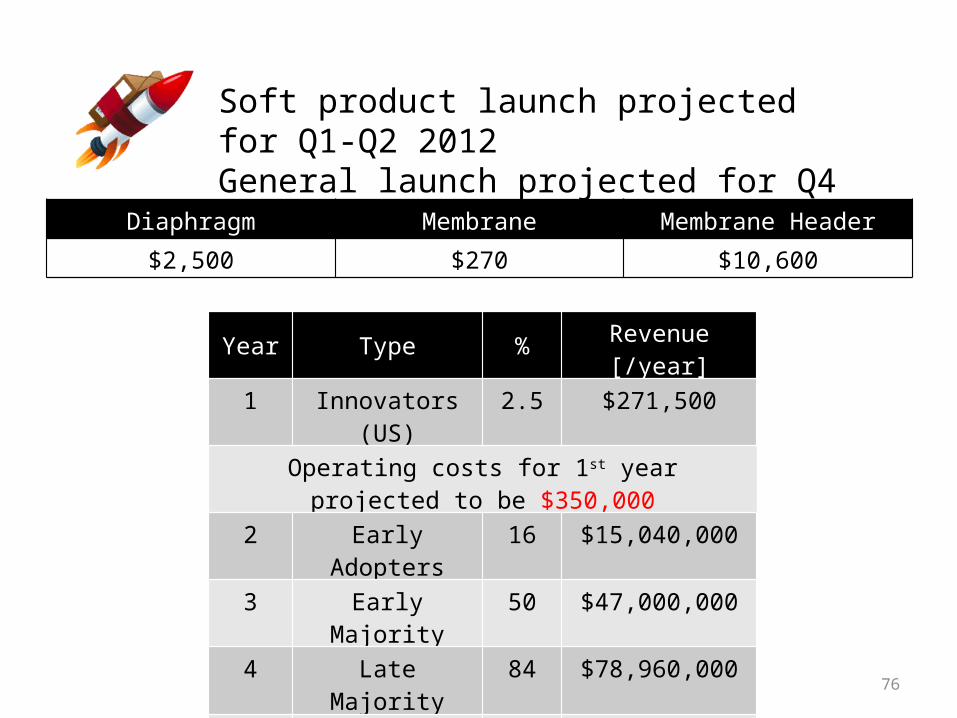
Soft product launch projected for Q1-Q2 2012General launch projected for Q4 2012
Year Type % Revenue [/year]1 Innovators (US) 2.5 $271,500
Operating costs for 1st year projected to be $350,000
2 Early Adopters 16 $15,040,000
3 Early Majority 50 $47,000,000
4 Late Majority 84 $78,960,000
Full Penetration 100 $94,000,000
Diaphragm Membrane Membrane Header
$2,500 $270 $10,600
Medical DeviceRevenue Model Example

What we make
DentistDentalOptics
~$2000
Device cost (one time)
~$2.50 per patient
Disposables
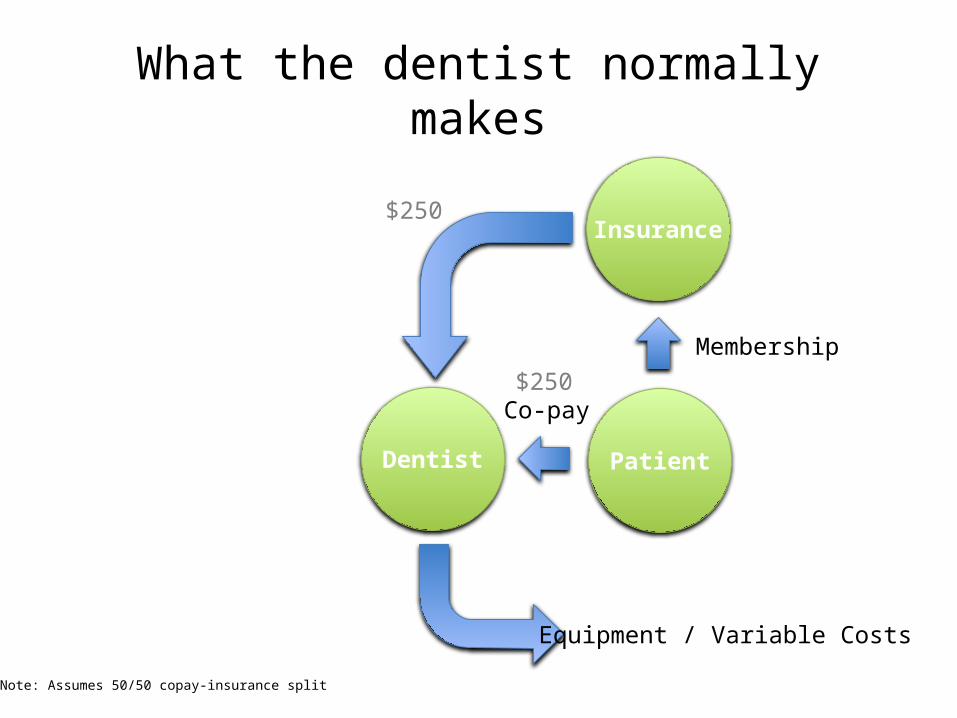
What the dentist normally makes
Dentist Patient
Insurance
Co-pay
Membership
$250
$250
Equipment / Variable Costs
Note: Assumes 50/50 copay-insurance split
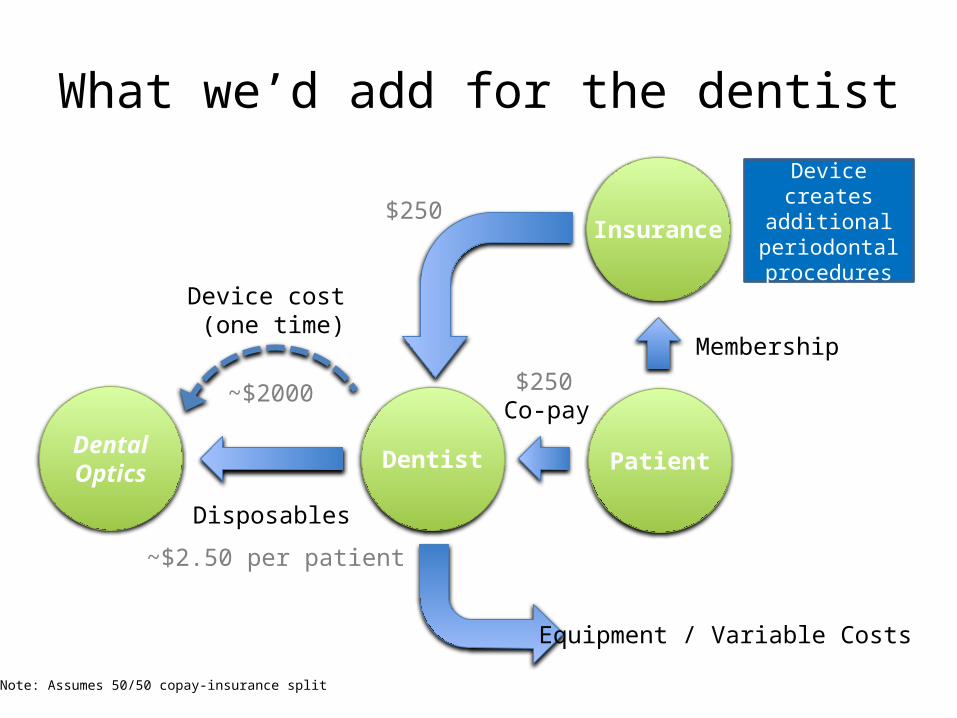
What we’d add for the dentist
Dentist PatientDentalOptics
Insurance
Co-pay
Membership
~$2000
$250
Device cost (one time)
$250
~$2.50 per patient
Disposables
Equipment / Variable Costs
Device creates
additional periodontal procedures
Note: Assumes 50/50 copay-insurance split

Farm Nitrate SensorRevenue Model Example

Us
USDA/EPA
Small farm
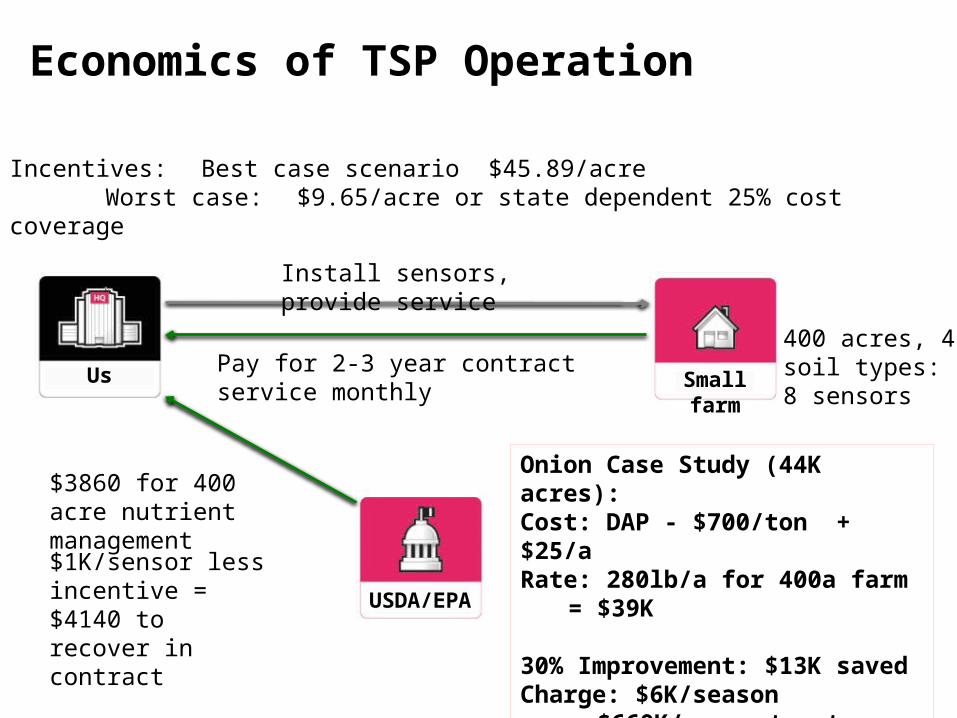
400 acres, 4 soil types: 8 sensors
Install sensors, provide service
$1K/sensor less incentive = $4140 to recover in contract
Incentives: Best case scenario $45.89/acreWorst case: $9.65/acre or state dependent 25% cost coverage
$3860 for 400 acre nutrient management
Average $10.40 in N-fertilizer lost to groundwater per acre
Pay for 2-3 year contract service monthly
Economics of TSP Operation
Us
USDA/EPA
Small farm
400 acres, 4 soil types: 8 sensors
Install sensors, provide service
$1K/sensor less incentive = $4140 to recover in contract
Incentives: Best case scenario $45.89/acreWorst case: $9.65/acre or state dependent 25% cost coverage
$3860 for 400 acre nutrient management
Onion Case Study (44K acres): Cost: DAP - $700/ton + $25/aRate: 280lb/a for 400a farm
= $39K
30% Improvement: $13K savedCharge: $6K/season
= $660K/yr contract revenue
Pay for 2-3 year contract service monthly
Economics of TSP Operation
Biofactories for TherapeuticsRevenue Model Example

Revenue Model
= money= information
= relationship
Large Pharma
INFLUENCER
Hospital/Clinic
Physicians
Patient
Employer
Government
Taxpayer
Government Payor
Private Payor
Pulmonary Function Lab
Wholesalers
= AAT

Optics Design CompanyRevenue Model Example
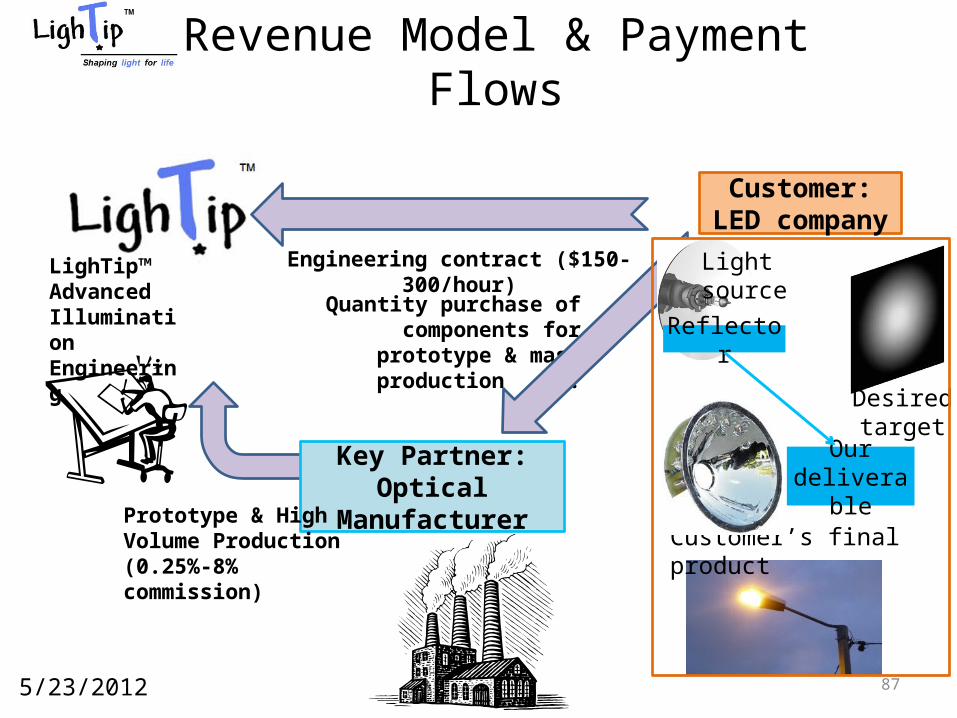
Quantity purchase of components for prototype &
mass production .
Revenue Model & Payment Flows
87
LighTip™ Advanced Illumination Engineering
™
Reflector
Desired target
Light source
Customer:LED company
Key Partner:Optical Manufacturer
Customer’s final product
Our deliverabl
ePrototype & High Volume Production (0.25%-8% commission)
Engineering contract ($150-300/hour)
5/23/2012

Complex Sensor NetworksRevenue Model Example
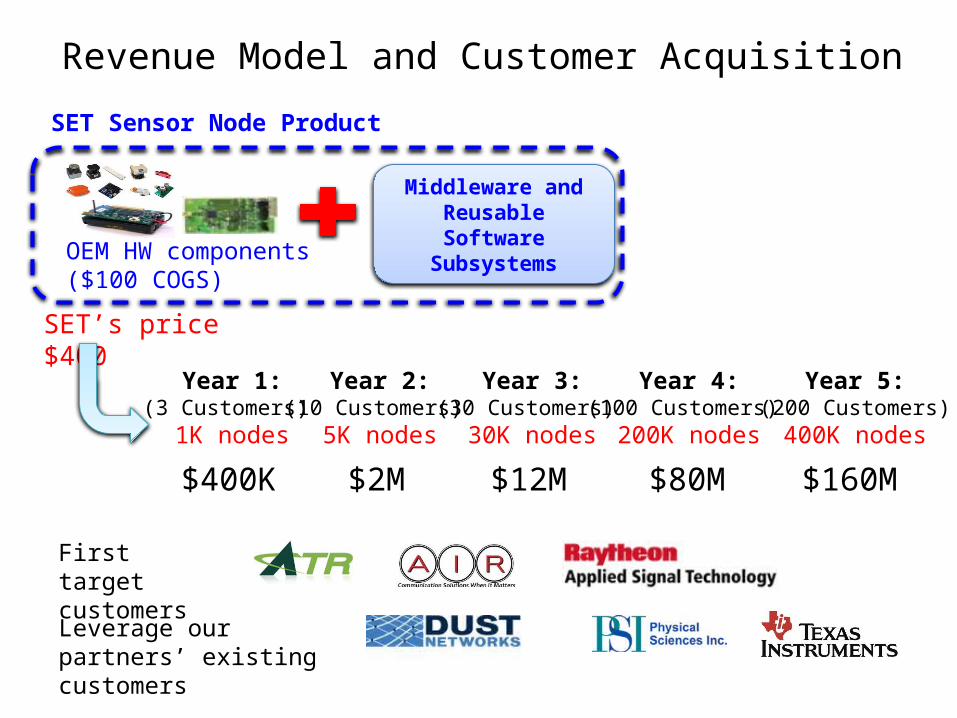
Revenue Model and Customer Acquisition
Year 1:(3 Customers)
1K nodes
Year 3:(30 Customers)
30K nodes
Year 4:(100 Customers)
200K nodes
SET’s price $400
$400K $12M $80M
Year 5:(200 Customers)
400K nodes
$160M
Middleware and Reusable Software
Subsystems
SET Sensor Node Product
OEM HW components ($100 COGS)
Year 2:(10 Customers)
5K nodes
$2M
First target customers
Leverage our partners’ existing customers
Healthcare SoftwareRevenue Model Example
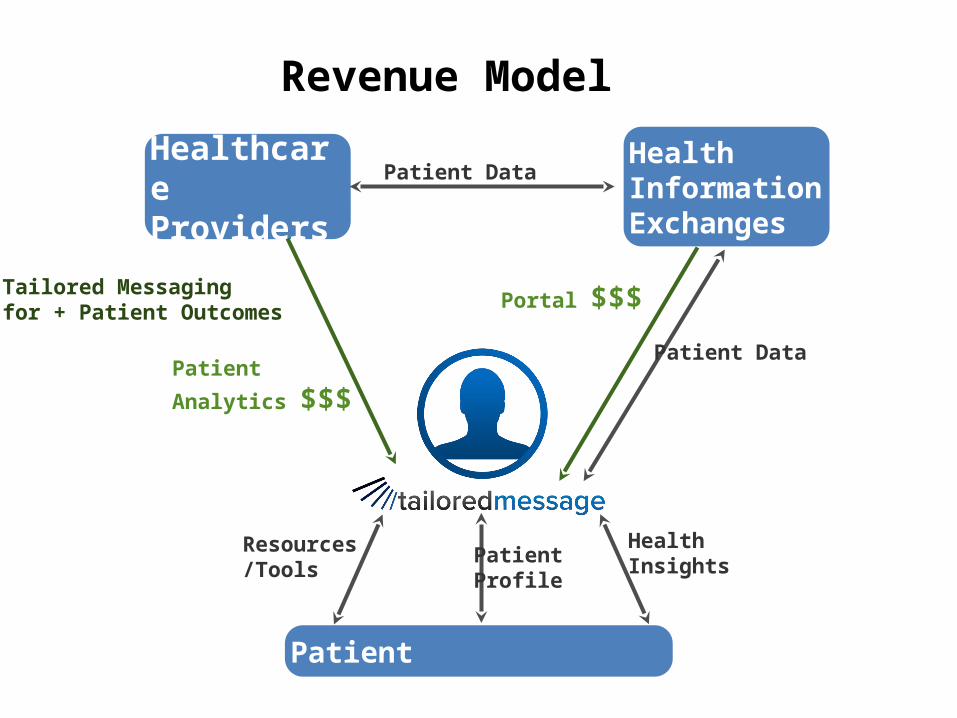
Revenue Model
Healthcare Providers
Health Information Exchanges
Patient
Patient Data
Patient Data
Portal $$$Tailored Messagingfor + Patient Outcomes
Patient Analytics $$$
Health Insights
Resources/Tools Patient Profile
![Cozad Workshop: Revenue Models, Pricing and Projectionsillinois.edu/cms/6414/cozad_financials_presentation_reduced[1].pdf · Cozad Workshop: Revenue Models, Pricing and Projections](https://img.dokumen.tips/doc/110x75/5b167f8c7f8b9a5e6d8c49d2/cozad-workshop-revenue-models-pricing-and-1pdf-cozad-workshop-revenue-models.jpg)