Embed Size (px)
Citation preview

NOVEL DATA ANALYSIS TECHNIQUE USED TO EVALUATE NOX ANDCO2 CONTINUOUS EMISSIONS DATAAWMA 106th Annual Conference, June 27, 2013
Sergio A. Guerra - Wenck Associates, Inc.Dennis D. Lane, Norman A. Slade, Ray E. Carter, Edward Peltier, Glen Marotz -University of Kansas
BACKGROUND• Society depends heavily on diesel engines• Diesel engines are more durable and fuel efficient than
gasoline ones• At full load diesel engine use ~70% of the fuel a
comparable gasoline engine consumes (Lloyd et al., 2001)• Off-road diesel vehicles not well studied

BACKGROUND- Off-road Emissions

OBJECTIVES1.Collect real-world NOx and CO2 emission profiles from an
off-road diesel vehicle2.Evaluate NOx and CO2 emission profiles for a diesel off-
road vehicle running on diesel, B20 and ULSD fuels to determine potential emission reductions
3.Evaluate the effect that temporal factors exert on NOx and CO2 emission profiles

Methodology - Test Vehicle• 2002 Terex CMI Trashmaster 3-90E. • Cummins Model QSK-19, 525-hp diesel engine.• Operated from ~ 7 AM to 5:30 PM M-F• Average fuel use of over 200 gallons per day.

PEMSPortable Emission Monitoring Systems1.Increasingly more common2.Affordable3.Small size and ease of installation4.Increasingly more accurate

Sampling System
• Simple, Portable, On-vehicle, Testing (SPOT) system.
• Capable of measuring at 1Hz:• NOx and O2 emissions • Exhaust mass flow • Relative humidity • Ambient temperature • Engine speed • Calculated CO2
• Composed of:• main console • alternator sensor • battery connections • exhaust probe

Sampling Site
Sanitary landfill
Analysis of PEMS Data•Autocorrelation• Frequent successive observations tend to be positively
correlated• Issue in PEMS generated data•Binning Approach Frey et al. (2002) and EPA (2002 C,D)• Driving modes are defined to segregate data• Produces discontinuous time series to reduce
autocorrelation • Each “bin” is analyzed separately
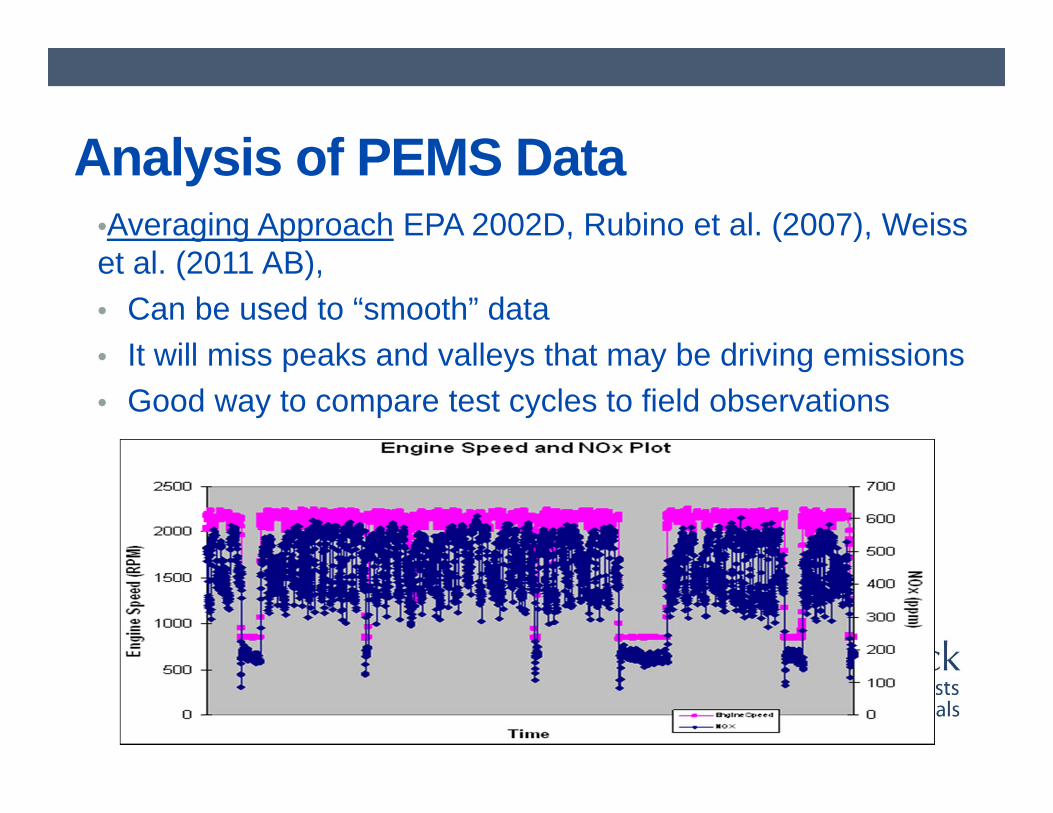
Analysis of PEMS Data•Averaging Approach EPA 2002D, Rubino et al. (2007), Weiss et al. (2011 AB), • Can be used to “smooth” data• It will miss peaks and valleys that may be driving emissions• Good way to compare test cycles to field observations

RESULTS
RESULTS FUEL ANALYSIS
NOxANALYSIS
CO2ANALYSIS

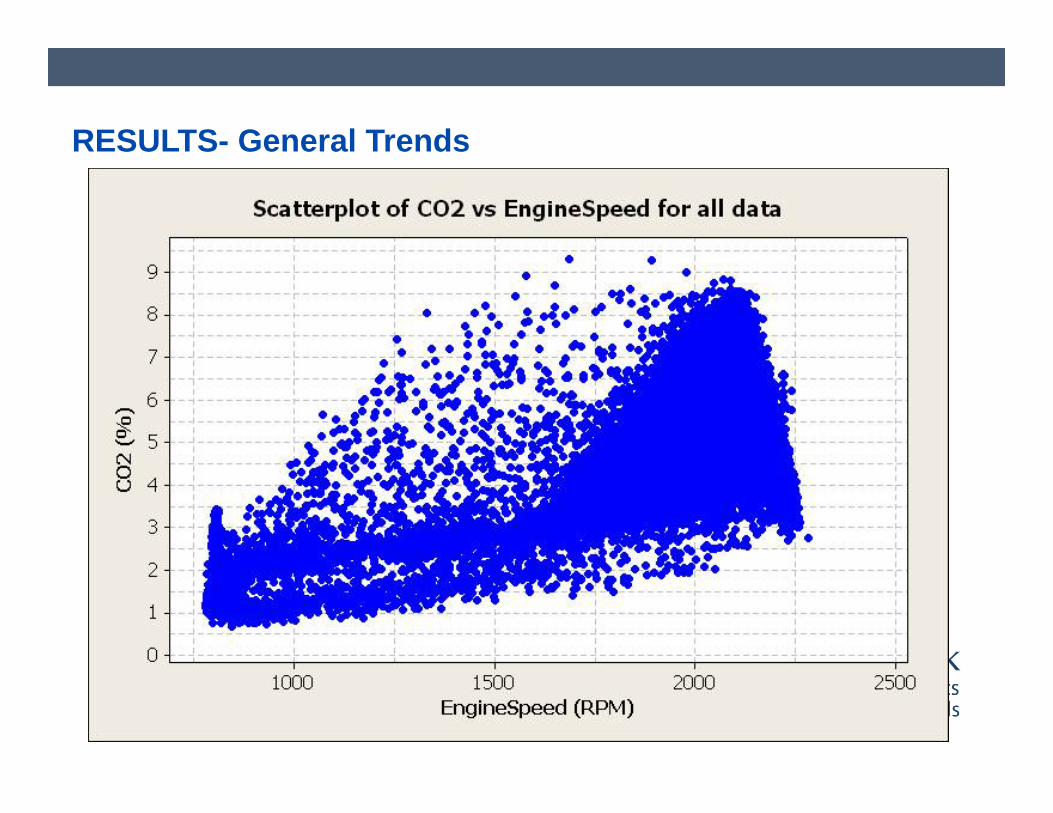
RESULTS- General Trends
Day Fuel type
Start time End time Total
timeTotal data
points08/29/2005 Diesel 7:07 AM 5:10 PM 10:03 3615808/30/2005 Diesel 7:10 AM 5:57 PM 10:47 3887308/31/2005 Diesel 7:08 AM 5:21 PM 10:13 3673809/01/2005 Diesel 7:08 AM 4:29 PM 9:21 3238309/12/2005 B20 7:07 AM 5:10 PM 10:03 3570409/13/2005 B20 7:21 AM 5:11 PM 9:50 3228709/14/2005 ULSD 7:22 AM 5:02 PM 9:40 3344109/15/2005 ULSD 7:21 AM 5:00 PM 9:39 30906

RESULTS- General Trends

RESULTS- General Trends
RESULTS- General Trends

RESULTS- General Trends

Statistical Analysis•General Linear Model (GLM) with Engine Speed as a covariate term. Evaluated the following questions:1.Are there statistically significant differences in NOx and CO2concentrations from a diesel compactor running on no. 2 diesel, ULSD and B20 fuel types? 2.Are there statistically significant differences in NOx and CO2 concentrations due to temporal factors?

Factor N DF F P-value
Engine Speed
276485
1 655115.01 0.000
Fuel Type 2 610.58 0.000
Fuel type*Engine Speed
2 781.41 0.000
RESULTS- Tested Fuel Type factor on NOx Concentrations
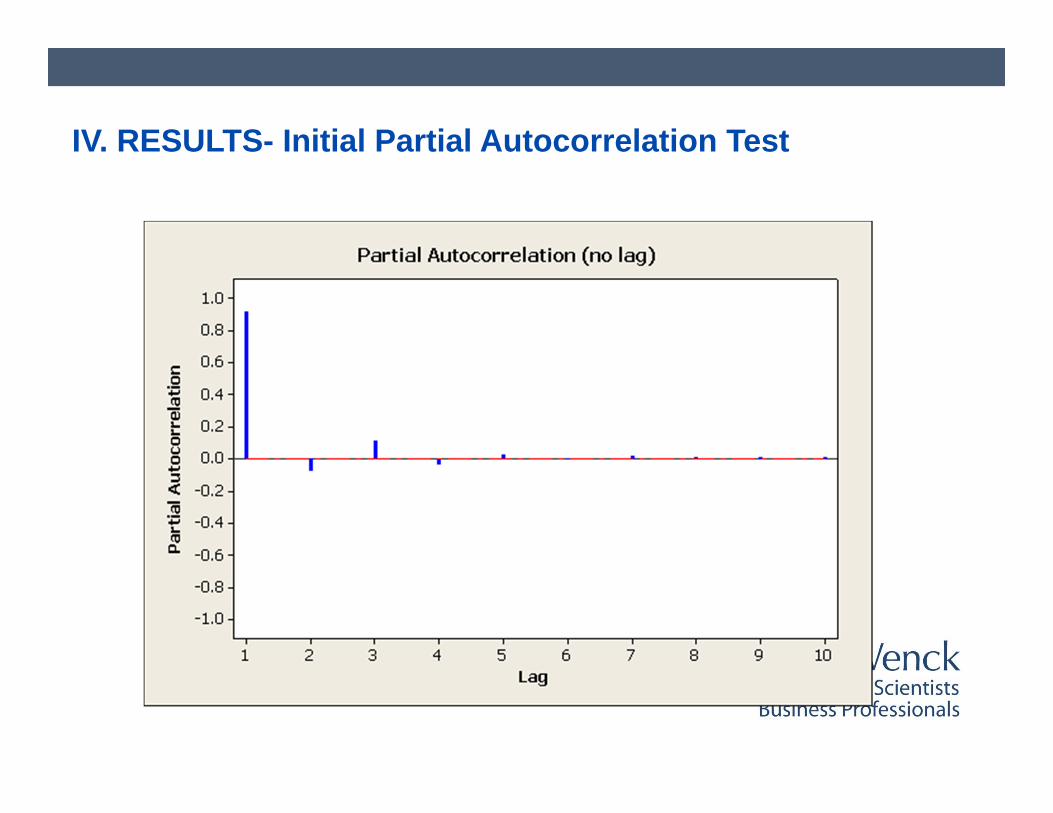
IV. RESULTS- Initial Partial Autocorrelation Test

RESULTS- Time to Independence Method
•Swihart, R. K., and N. A. Slade. (1985). “Testing for independence of observations in animal movements.” Ecology 66: 1176-1184.• Developed a procedure for determining the time interval at which
autocorrelation becomes negligible by using location data of a radio-tagged adult female cotton rat
• Study showed that if a fixed interval separates successive observations in an autocorrelated data set, the dependency can be removed by using observations separated by several intervals
•Method was adapted to emission data and different intervals were evaluated •Interval of 800 seconds per observation was selected to produce quasi-independent observations

RESULTS- GLM for Reduced Data Set
Factor N DF F P-value
Engine Speed
346
1 824.72 0.000Fuel Type 2 0.52 0.595
Fuel type * Engine Speed 2 0.44 0.645

RESULTS- Partial Autocorrelation Test

RESULTS- Fuel Analysis
Pollutant Factor N DF F P-value
Difference Significant?
NOxEngine Speed
3461 824.72 0.000 YES
Fuel Type 2 0.52 0.595 NOFuel Type* Engine Speed 2 0.44 0.645 NO
CO2Engine Speed
3461 1454.71 0.000 YES
Fuel Type 2 0.95 0.389 NOFuel Type* Engine Speed 2 0.34 0.714 NO

RESULTS- Temporal Analysis
Pollutant Factor N DF F P-value
Difference Significant?
NOxEngine Speed
3461 921.77 0.000 YES
Day 7 0.28 0.960 NODay* Engine Speed 7 0.51 0.823 NO
CO2Engine Speed
3461 1555.83 0.000 YES
Day 2 0.38 0.914 NODay* Engine Speed 2 0.25 0.972 NO
CONCLUSIONS
1.Raise awareness about autocorrelation and spuriousstatistical significance in continuous emission data
2.Development of a data handling technique to deal with autocorrelation in continuous data
3.Finding that NOx and CO2 emissions are unaffected from the use of ULSD and B20 fuel

QUESTIONS…
Sergio A. Guerra, PhDEnvironmental EngineerPhone: (651) [email protected]
www.sergioaguerra.com