Embed Size (px)
Citation preview

MATH 533 WEEK 6 - MORE HELP
B. HeardThese charts may not be posted or shared without my permission. Students may download a copy for personal use.

MATH 533 WEEK 6 - MORE HELP Example 1 – The results for the output of a certain component are tracked consistently to make sure that that the component performs as advertised. Suppose the component’s manufacturer wants to use simple linear regression to predict the output in volts (y) from the setting on one of it’s machines (x). Find a 90% confidence interval for the true slope of the line and interpret what the results mean.
Data on following page.
Also, remember the general form of the equation is
y = β0 + β1x + ε

MATH 533 WEEK 6 - MORE HELPBatch
Output/Volts
Setting
1 3.3 1002 3.6 1083 4.1 1384 4 905 3.9 1046 4.1 957 3.9 1138 3.7 1499 3.7 119
10 4 9211 3.5 29012 3.7 13613 4 18414 3.6 13915 3.4 16416 3.4 26317 3.9 15118 3.6 14419 3.8 10820 3.4 14321 4 11322 3.9 10023 3.9 12524 4 12125 3.6 137
Remember the output in volts is (y) and the setting is (x).

MATH 533 WEEK 6 - MORE HELP First copy and paste data into Minitab…

MATH 533 WEEK 6 - MORE HELP Now go to Stat >> Regression >> Regression (remembering which one is x and which one is y)

MATH 533 WEEK 6 - MORE HELP I get my results in the session window…

MATH 533 WEEK 6 - MORE HELP What I will need now are the following two things…
The slope (β1) and the standard error (sβ1)… I have them both as seen below

MATH 533 WEEK 6 - MORE HELP Now I will need my value for tα/2, Go to Graph >> Probability Distribution Plot, click View Probability, then Ok

MATH 533 WEEK 6 - MORE HELP Set distribution to t and your degrees of freedom to your sample size minus 2. (In this case 25-2 = 23
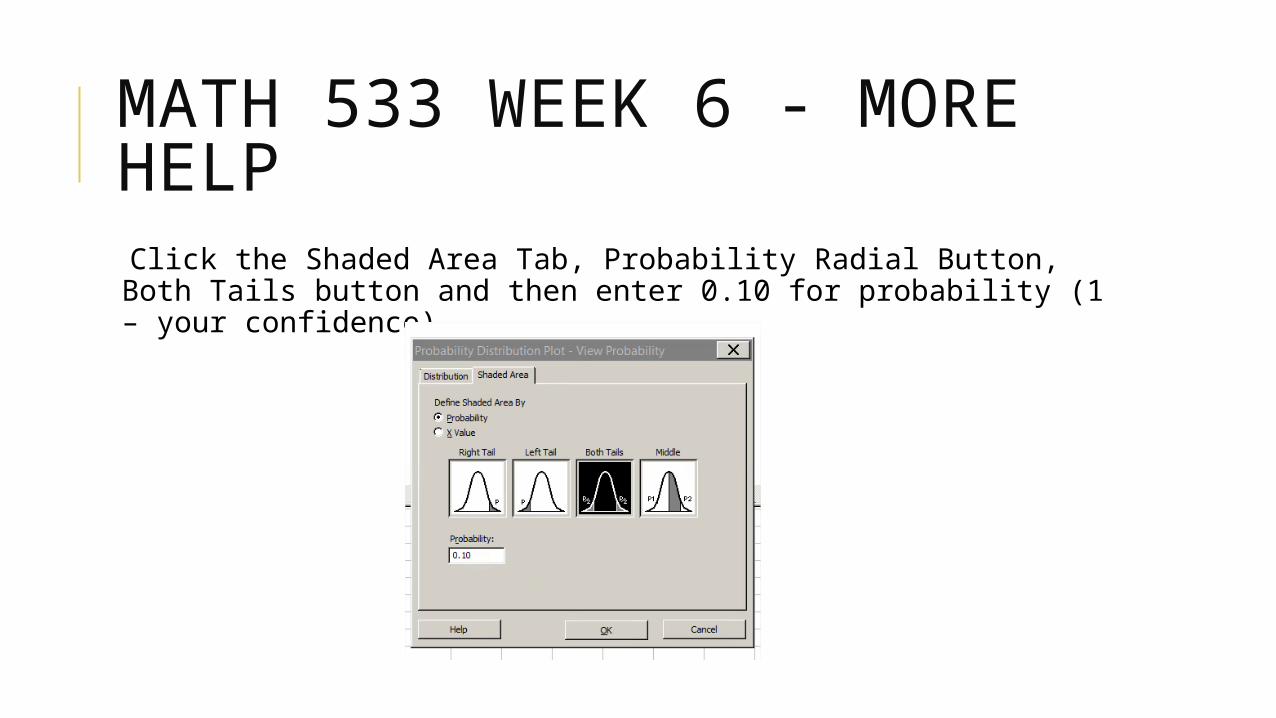
MATH 533 WEEK 6 - MORE HELP Click the Shaded Area Tab, Probability Radial Button, Both Tails button and then enter 0.10 for probability (1 – your confidence)

MATH 533 WEEK 6 - MORE HELP After clicking OK, you will see that your t value is 1.714
0.4
0.3
0.2
0.1
0.0
X
Densi
ty
-1.714
0.05
1.714
0.05
0
Distribution PlotT, df=23

MATH 533 WEEK 6 - MORE HELP Now I can easily get my confidence interval by using…
(β1) +/- (tα/2)(sβ1) (My Betas should have rooftops on them)
Let’s look at the results…

MATH 533 WEEK 6 - MORE HELP (β1) +/- (tα/2)(sβ1)
(-0.00223) +/- (1.714)(0.0009321) = (-0.0038, -0.0006) Rounded to 4 Decimals
0.4
0.3
0.2
0.1
0.0
X
Densi
ty
-1.714
0.05
1.714
0.05
0
Distribution PlotT, df=23

MATH 533 WEEK 6 - MORE HELP Interpret results
The y-intercept would have no practical interpretation because a machine setting of 0 is outside the range of the sample data.
However, the slope does have meaning, because for each additional unit in setting, the output in volts is estimated to change by the value of the slope.

MATH 533 WEEK 6 - MORE HELP Example 2 – A study was done on the results of students quiz grades based on the number of hours studied. 8 Different students were examined. Based on the given data find the least squares line relating score (y) to hours studied (x).
Student ScoreHours Studied
1 88.5 302 88.3 27.63 86.3 25.34 76.9 23.45 87.2 28.96 90.4 34.87 75.6 21.88 85.7 26.1

MATH 533 WEEK 6 - MORE HELP Copy Data into Minitab, then Go to Stat >> Regression >> Regression

MATH 533 WEEK 6 - MORE HELP Regression Equation is y = 53.627+1.147x ( to three decimals)
Note I used the coefficients circled because they gave me the accuracy I needed.

MATH 533 WEEK 6 - MORE HELP Interpretations
The y intercept has no meaning since 0 is not in the observed range of study hours.
However, the slope does have meaning. For each hour increase in study hours, the score is estimated to increase by the slope.
Remember that β0 is your y-intercept and β0 is your slope. My β’s should have “rooftops” on them – You know a “^”…
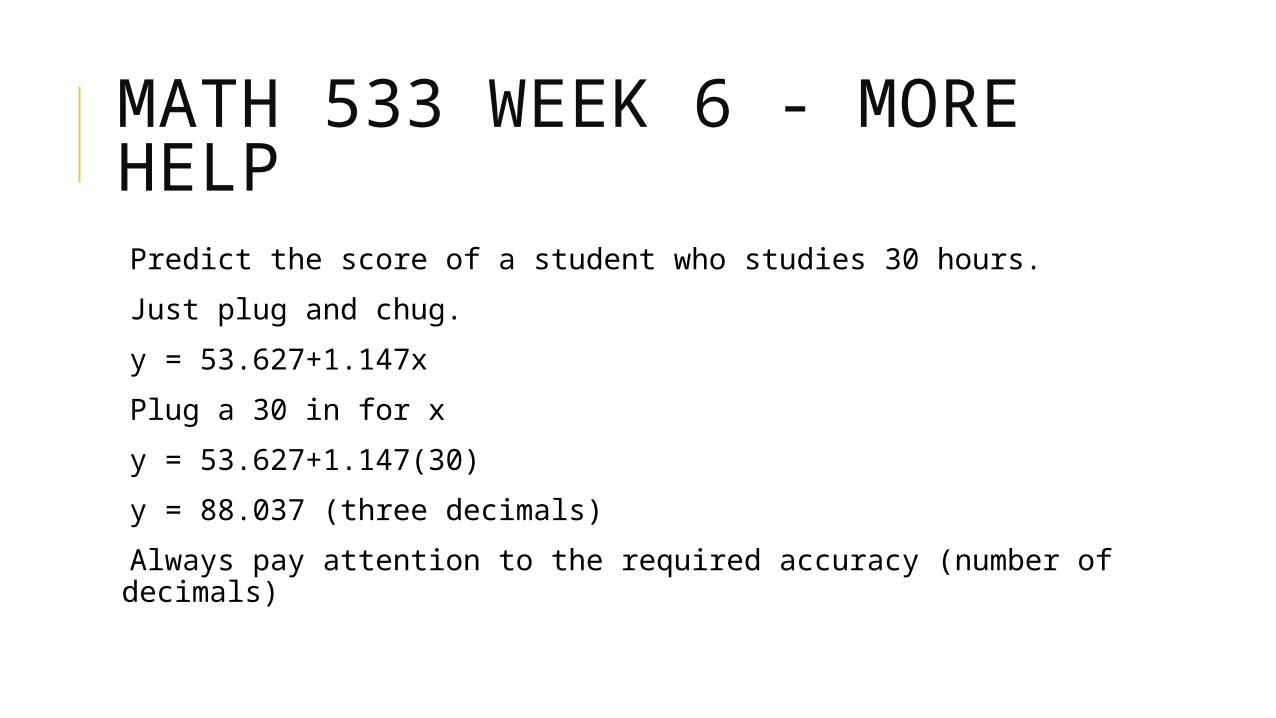
MATH 533 WEEK 6 - MORE HELP Predict the score of a student who studies 30 hours.
Just plug and chug.
y = 53.627+1.147x
Plug a 30 in for x
y = 53.627+1.147(30)
y = 88.037 (three decimals)
Always pay attention to the required accuracy (number of decimals)

MATH 533 WEEK 6 - MORE HELP Example 3 – A study was done on ranking the total driving performance of some really bad golfers like me. The method required knowing the golfer’s average driving distance and driving accuracy (shots in the fairway). In the study, they constructed a straight line model relating driving accuracy (y) to driving distance (x). A Minitab printout with prediction and confidence intervals for a driving distance of x = 200 is shown below.Minitab
Output
Predicted Values For New Observations
New Obs Fit SE Fit 95% CI 95% PI
1 68.253 0.426(42.265, 45.362)
(38.258, 49.956)
Values of Predictors for New Observations
New Obs
Distance
1 200

MATH 533 WEEK 6 - MORE HELP What is a practical interpretation of the results on the printout?
Well, we would say we are 95% confident that the actual driving accuracy for a golfer driving the ball 200 yards is between the limits of the prediction interval.
Key words: One golfer or in this case, “a golfer” goes with the Prediction Interval
“All golfers” goes with the confidence interval. Don’t let them fool you.

MATH 533 WEEK 6 - MORE HELP What is the 95% confidence interval? 95% prediction interval?
Minitab Output
Predicted Values For New ObservationsNew Obs Fit SE Fit 95% CI 95% PI
1 68.253 0.426(42.265, 45.362)
(38.258, 49.956)
Values of Predictors for New Observations
New Obs
Distance
1 200

MATH 533 WEEK 6 - MORE HELP Again, if you are interested in knowing the average driving distance of
“All golfers” - Use confidence interval (You would be 95% confident in this case)
“A single golfer” – Use prediction interval (You would be 95% confident in this case)

MATH 533 WEEK 6 - MORE HELP Example 4 – A study on the effect of jelly beans on working crossword puzzles measured the crossword puzzle success (on a 30 point scale) and the number of jelly beans consumed before doing the puzzle. On the basis of the information provided, the data shown in the table on the next chart were obtained for 15 people who participated in the study. Conduct a test to determine if the crossword puzzle success (y) is linearly related to the number of jelly beans consumed (x). Use α = 0.10

MATH 533 WEEK 6 - MORE HELP Data for Example 3 Crossword Puzzle
SuccessJelly Beans Consumed
18.8 4919.3 4919.8 5219.1 5320 53
20.3 5319.2 5617.4 5818.7 5820.3 5820.8 5921 60
20.9 6221.3 6220.5 61

MATH 533 WEEK 6 - MORE HELP What would the correct null and alternative hypotheses be?
We are testing to see if they are linearly related, so they would be
H0: β1 = 0
Ha: β1 ≠ 0

MATH 533 WEEK 6 - MORE HELP Find the test statistic and p value.
These can be tricky when you are not sure the number of decimals (accuracy) you will need. I’m going to show you how to get more accuracy if you need it.

MATH 533 WEEK 6 - MORE HELP Get your data into Minitab

MATH 533 WEEK 6 - MORE HELP Use Stat >> Regression >> Regression

MATH 533 WEEK 6 - MORE HELP Session Window
Here is the test statistic t, andthe p value.BUTBUT BUTGo to next chart…

MATH 533 WEEK 6 - MORE HELP What if they want the t value to three decimal places? Easy, watch…
t is given as 1.93 which is correct, but to only two decimal places. The testing software should be such that a little tolerance is there, but to get more accuracy just divide the Coef by the SE Coef. In other words, look just to the left of the 1.93 and divide 0.11414 by 0.058990.11414/0.05899 = 1.93490422105 blah blahSo, if they wanted three decimals, I would note the answer as 1.935

MATH 533 WEEK 6 - MORE HELP So what is the appropriate conclusion?
Compare the p value 0.075 to alpha of 0.10.
If p is less Pless or Please Reject the null hypothesis, so we accept the null that
β1 ≠ 0, so if it’s not zero, THEY MUST BE LINEARLY RELATED AT AN ALPHA OF 0.10

MATH 533 WEEK 6 - MORE HELP This covers the hard stuff I think you will see on the quiz. Be prepared…