Embed Size (px)
Citation preview

For info about the proprietary technology used in comScore products, refer to http://comscore.com/About_comScore/Patents
Lessons Learned
In a Digital Marketing WorldJanuary 25, 2016
Gian Fulgoni
Co-Founder & Chairman

© comScore, Inc. Proprietary. 2© comScore, Inc. Proprietary.
Digital Marketing: Five Key Lessons
The Click
Search & Display Advertising
Mobile
Targeting, Viewability, Brand Safety & Invalid Traffic
Cross-Platform

© comScore, Inc. Proprietary. 3
Data sourced from comScore’s global panel of 2 million Internet users
2 Million Person Panel
360°View of Person Behavior
CENSUS
Unified Digital Measurement™ (UDM)
Patent-Pending Methodology
1 Million Domains ParticipatingAdopted by 90% of Top 100 U.S. Media Properties
PANEL
PERSON-Centric Panel with
WEBSITE-Census Measurement
Web Visiting & Search
Behavior Online AdvertisingExposure
AdvertisingEffectiveness
Demographics,Lifestyles& Attitudes
Media & VideoConsumption
Transactions
Online& Offline
Buying
Mobile InternetUsage & Behavior
PANEL
V0411Plus 5 Million TV Set Top Boxes for 3-Screen Measurement

© comScore, Inc. Proprietary. 4Percent of Time Spent

© comScore, Inc. Proprietary. 5
Digital advertising is forecast to become the #1 U.S. Media category in 2016, but
TV not expected to decline

© comScore, Inc. Proprietary. 66© comScore, Inc. Proprietary.
Clicks on ads are at best an incomplete –and at worst a misleading – effectiveness metric.
Measure attitudinal and behavioral lifts instead.
© comScore, Inc. Proprietary.
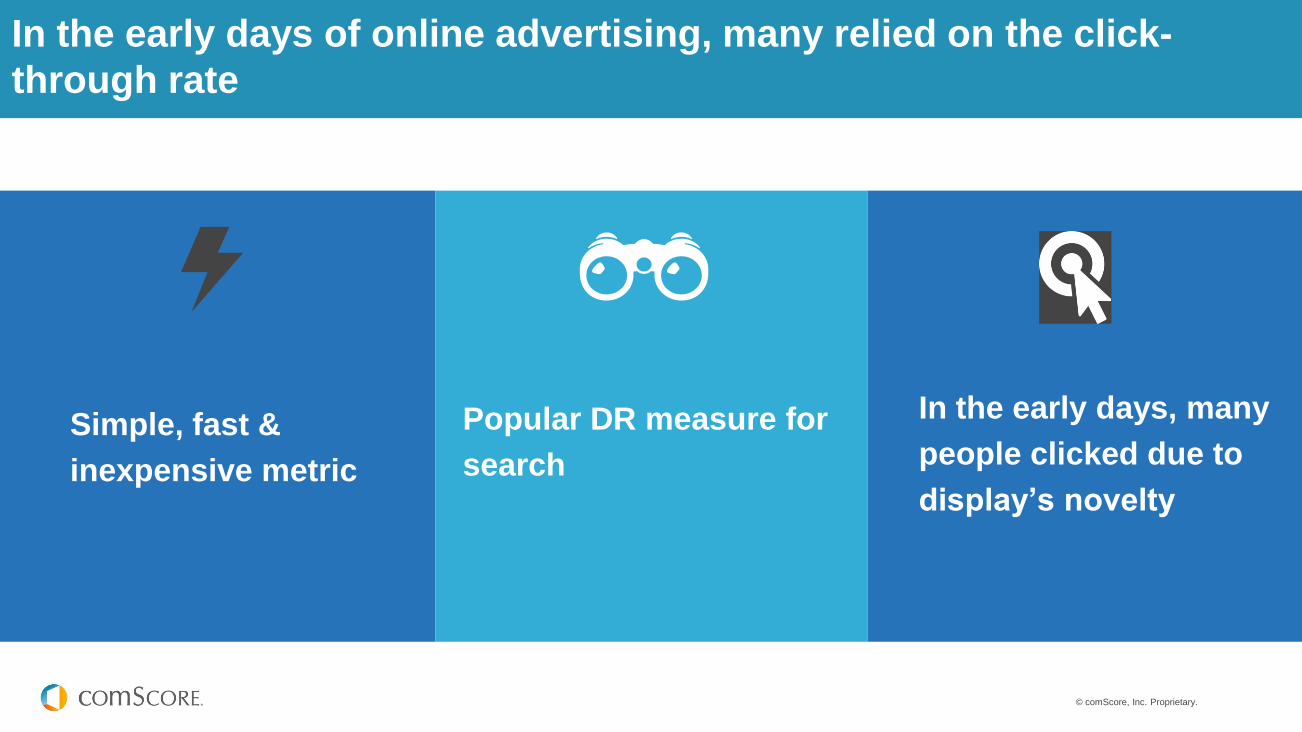
In the early days of online advertising, many relied on the click-
through rate
Simple, fast &
inexpensive metric
Popular DR measure for
search
In the early days, many
people clicked due to
display’s novelty

© comScore, Inc. Proprietary. 8
G
U
Whither the Click?
Only 1 to 3 clicks per one thousand impressions!
But today, very few people click on display ads ….
Source: Google DoubleClick
Click-through rates across static image, flash and rich media formats
0.14% 0.15% 0.32% 0.16% 0.10%
8© comScore, Inc. Proprietary.
U.K. U.S.Germany France Spain

© comScore, Inc. Proprietary.
comScore research has shown that clicks don’t reflect sales impact
$-
$0.100
$0.200
$0.300
$0.400
$0.500
$0.600
0.00% 0.10% 0.20% 0.30% 0.40% 0.50% 0.60% 0.70% 0.80%
Sale
s L
ift/
HH
in
$
CTR
A negative pattern exists between Sales
Lift per Household and Click Through
Rate (i.e., as CTR increases, sales
decrease)
R2 = -0.039
A regression analysis shows there is no
statistically significant relationship
between CTR and Sales
Sale
s L
ift/
HH
in
$
Click-through Rate

© comScore, Inc. Proprietary. 10
27% 31% 32%
9%15% 10%
36%46% 42%
Agency(n=135)
Advertiser/ Marketer/Manufacturer/ Retailer
(n=80)
Publisher/ Ad Network(n=149)
Always
Most of the time
% Indicating Organization Relies on CTR
But, approximately four-in-ten industry professionals still
rely on CTRs to measure display ad effectiveness!
Question: How often does your organization rely on Click Through Rate (CTR) as a measure of the effectiveness of display
advertising campaigns? (Excluding ‘don’t know/NA’)
© comScore, Inc. Proprietary. 11
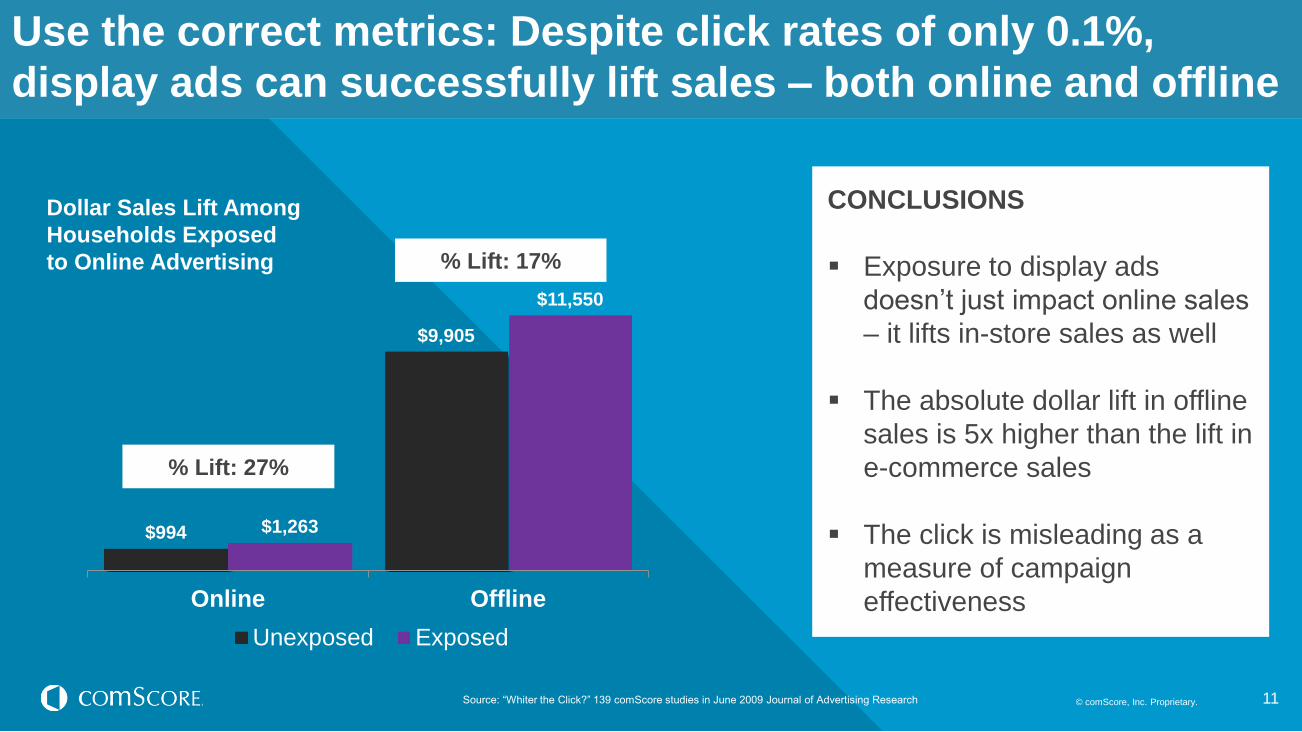
Use the correct metrics: Despite click rates of only 0.1%,
display ads can successfully lift sales – both online and offline
11© comScore, Inc. Proprietary.
$994
$9,905
$1,263
$11,550
Online Offline
Unexposed Exposed
Dollar Sales Lift Among
Households Exposed
to Online Advertising % Lift: 17%
% Lift: 27%
CONCLUSIONS
Exposure to display ads
doesn’t just impact online sales
– it lifts in-store sales as well
The absolute dollar lift in offline
sales is 5x higher than the lift in
e-commerce sales
The click is misleading as a
measure of campaign
effectiveness
Source: “Whiter the Click?” 139 comScore studies in June 2009 Journal of Advertising Research

© comScore, Inc. Proprietary. 1212© comScore, Inc. Proprietary.
Forget Last-Click Attribution: Synergy Gains Can Be Obtained by Overlaying Display
Campaigns on Search
© comScore, Inc. Proprietary.
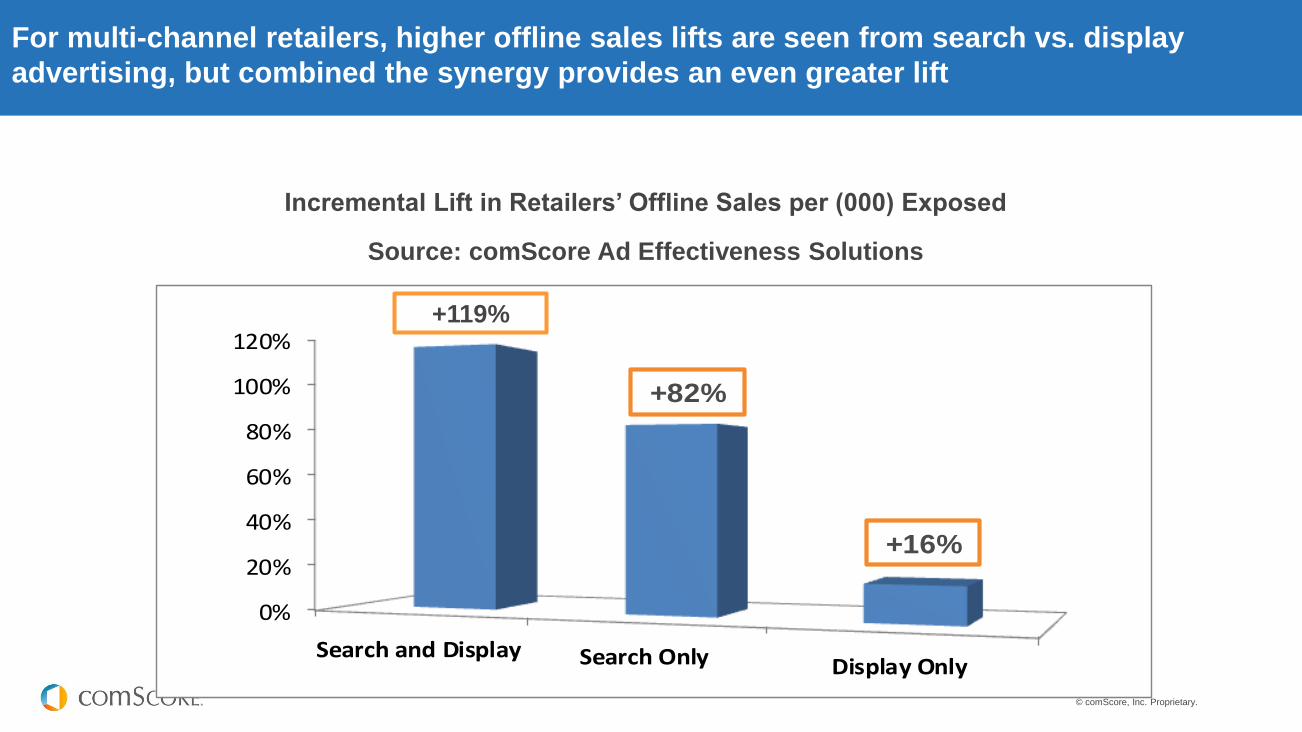
For multi-channel retailers, higher offline sales lifts are seen from search vs. display
advertising, but combined the synergy provides an even greater lift
0%
20%
40%
60%
80%
100%
120%
Search and Display Search Only Display Only
+82%
+16%
+119%
Incremental Lift in Retailers’ Offline Sales per (000) Exposed
Source: comScore Ad Effectiveness Solutions

© comScore, Inc. Proprietary.
For multi-channel retailers, the higher reach of display ads often helps lift TOTAL offline sales more
than does search. But, synergy gains can be obtained by using display overlaid on a search
campaign
Source: comScore Ad Effectiveness Solutions
+11%
% of Households Reached Incremental Impact on
Offline Sales per (000) Exposed
198
Total Sales Volume Lift Index
• The overall number of people reached by display ads is typically much higher than
search
• As a result, even though the sales lift among those exposed to a search ad is
higher, the total dollar sales gained from display ads is often larger than search
due to the smaller lift acting on a larger base
Note: 0 equals par in above chart.

© comScore, Inc. Proprietary. 1515© comScore, Inc. Proprietary.
The power of mobile advertising

© comScore, Inc. Proprietary. 16
0
50
100
150
200
250
2000 2001 2002 2003 2004 2005 2006 2007 2008 2009 2010 2011 2012 2013 2014 Oct-2015
Mil
lio
ns
Nu
mb
er
of
De
vic
e O
wn
ers
Source: comScore MobiLens and TabLens, U.S., 2000-2015
Continuing adoption of smartphones and tablets has led to a dramatic use of mobile
devices but growth rates beginning to slow, especially for tablets
194 MILLION78% PENETRATION
103 MILLION41% PENETRATION
Number of U.S. Smartphone and Tablet Owners
+10%
vs. YA
+8%
vs. YA

© comScore, Inc. Proprietary. 17Source: comScore Media Metrix Multi-Platform & Mobile Metrix, U.S.
It’s not a zero sum game. Digital media usage time has been surging, predominantly
driven by smartphones, but desktop time has not declined
Growth in Digital Media Time Spent
519 497 528
409622
772117
178
168
Sep-2013 Sep-2014 Sep-2015
To
tal M
inu
tes
(B
illi
on
s)
1,044
1,297
1,469
+44%
+89%
+2%
+41%vs. 2013
Tablet
Smartphone
Desktop
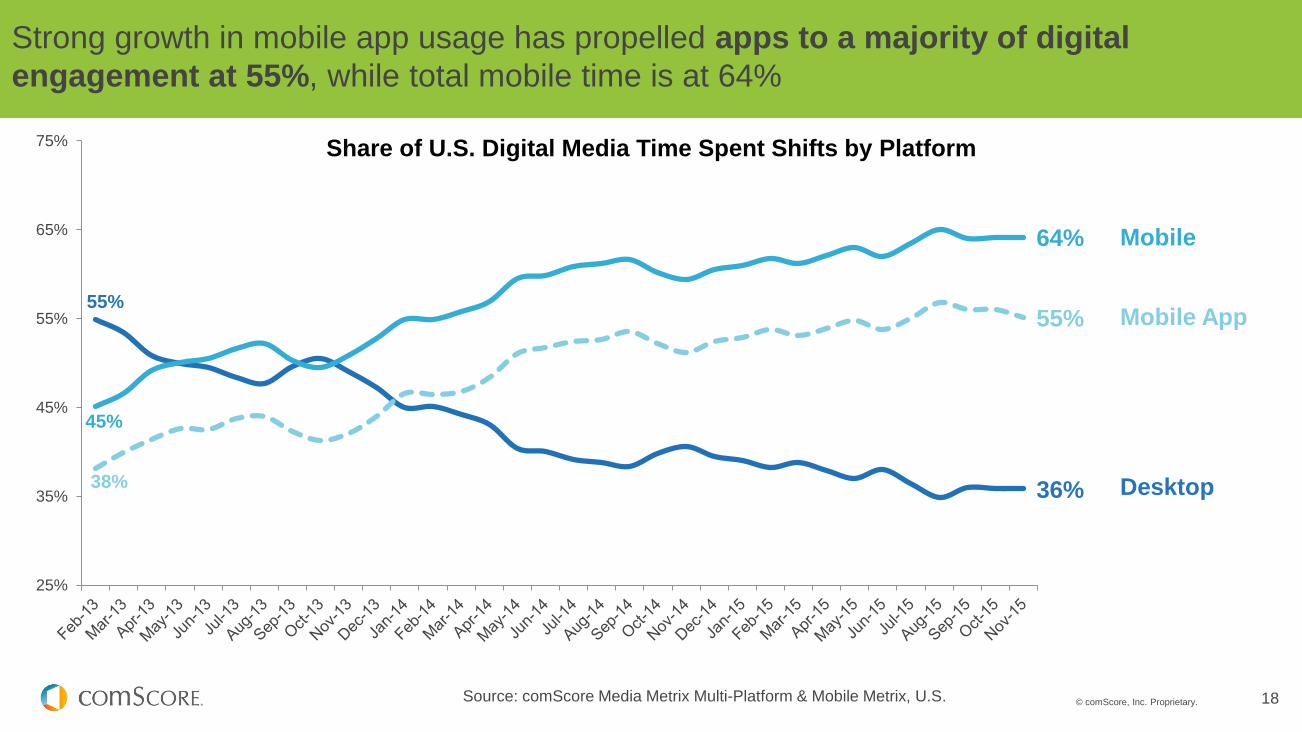
© comScore, Inc. Proprietary. 18
55%
36%38%
55%
45%
64%
25%
35%
45%
55%
65%
75%
Source: comScore Media Metrix Multi-Platform & Mobile Metrix, U.S.
Strong growth in mobile app usage has propelled apps to a majority of digital
engagement at 55%, while total mobile time is at 64%
Share of U.S. Digital Media Time Spent Shifts by Platform
Mobile
Mobile App
Desktop

© comScore, Inc. Proprietary. 19
50%
18%
10%
6%4% 3% 2% 2% 1% 1%
4%
59%
19%
9%
5%3% 2% 1% 1% 0% 0% 1%
1 2 3 4 5 6 7 8 9 10 11+
Sh
are
of T
ime
Sp
en
t o
n A
pp
s
Individuals’ Top Ranked App by Usage
Smartphone Tablet
Half of all time spent on smartphone apps occurs on the individual’s single most used
app, and it’s almost 85% on top four apps0% on tablets
Share of Time Spent on Apps Across Ranks
Source: comScore Custom Analytics, U.S., Age 18+, June 2015

© comScore, Inc. Proprietary. 20Left, Source: comScore BSL and Mobile BSL Benchmarks, U.S., 2015
Right, Source: comScore Media Metrix MP, July 2015
Mobile Ad Effectiveness Outpaces Desktop
Lifts From Mobile vs. Desktop Ads
0.6
1.2
1.3
1.4
1.4
1.3
1.1
3.2
2.5
10.2
3
4.3
4.3
3.2
Top-Of-MindAwareness
AidedAwareness
Ad Recall
Favorability
Likelihood toRecommend
PurchaseIntent
MessageAssociation
Desktop Norms
Mobile Norms
Mobile88%
Desktop12%
Mobile78%
Desktop22%
Mobile99%
Desktop1%
Share of Time Spent
on Desktop vs. Mobile

© comScore, Inc. Proprietary. 2121© comScore, Inc. Proprietary.
The accuracy of cookie-based targeting
leaves a lot to be desired. .

© comScore, Inc. Proprietary. 22
Cookie deletion can wreak havoc on measurement
30% of Internet users delete their cookies each
month at a rate of 5X per month.
Using only cookie-based measurement can…
• Overstate monthly unique visitors to a site by a
factor of 2.4X
• Overstate campaign reach by 3.5X and
understate frequency to the same degree.
Source: comScore Custom Analysis, June 2014
© comScore, Inc. Proprietary. 23
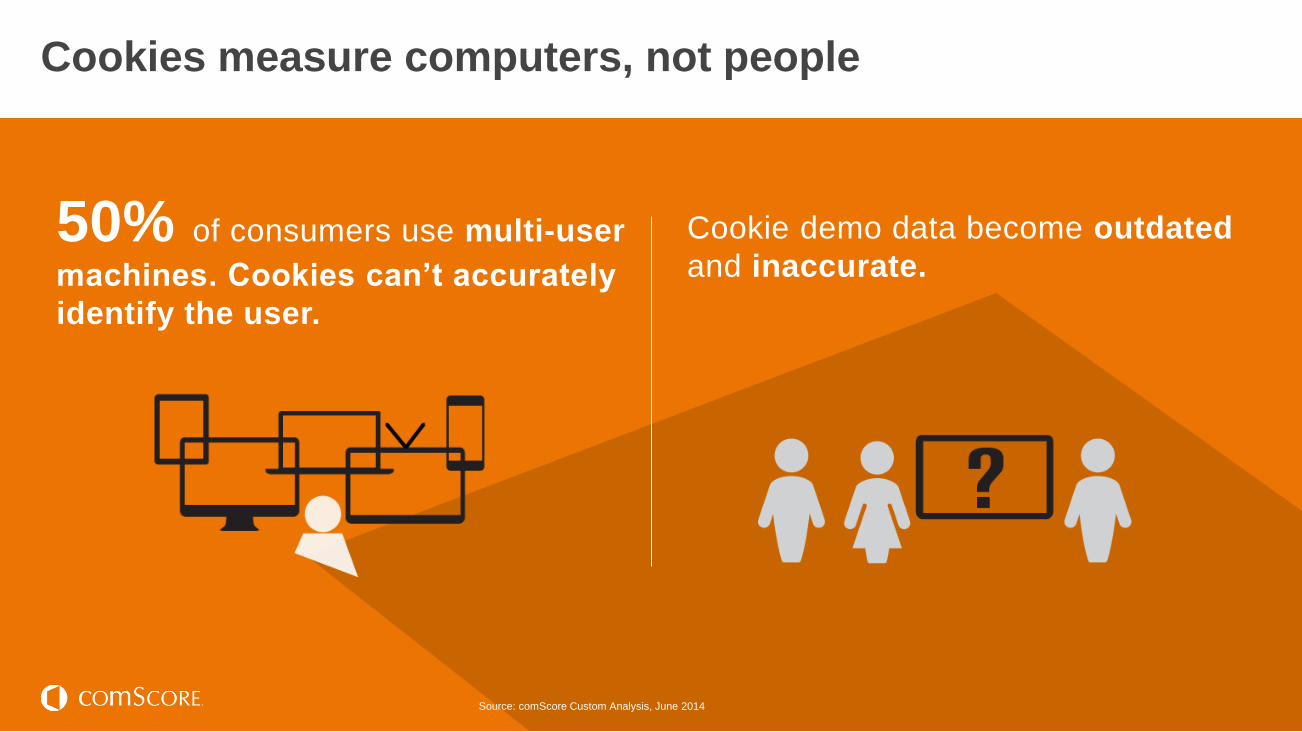
Cookies measure computers, not people
50% of consumers use multi-user
machines. Cookies can’t accurately
identify the user.
Cookie demo data become outdated
and inaccurate.
Source: comScore Custom Analysis, June 2014

© comScore, Inc. Proprietary. 24
Because of inaccuracies associated with cookies, demographic in-target rates are
low and vary significantly across industry verticals
*The Overall Norm comprises data from more than 200 billion impressions over the course of a 12-month rolling period. This includes campaigns that go beyond the select Advertiser / Product categories listed above to also include additional Advertiser / Product categories as well as studies
run directly by publishers and ad networks.
**Target audience is categorized based on the primary target selection in vCE, which is self-designated during campaign set-up.
***The Health / Wellness category includes campaigns for brands, products and/or services in the following sectors: health associations, health insurance, hospitals, over-the-counter, pharmaceutical, public health and wellness
% In-Target: Overall* and by Select Advertiser / Product Category**Source: comScore vCE Benchmarks

© comScore, Inc. Proprietary. 25
Industry benchmarks can help media
buyers and sellers set campaign delivery
expectations.
25© comScore, Inc. Proprietary.
Measurement of Viewability, Brand Safety and Invalid Traffic provides much-needed transparency in an increasingly opaque, programmatic world …. and substantially
improves campaign performance.
© comScore, Inc. Proprietary. 2626© comScore, Inc. Proprietary.
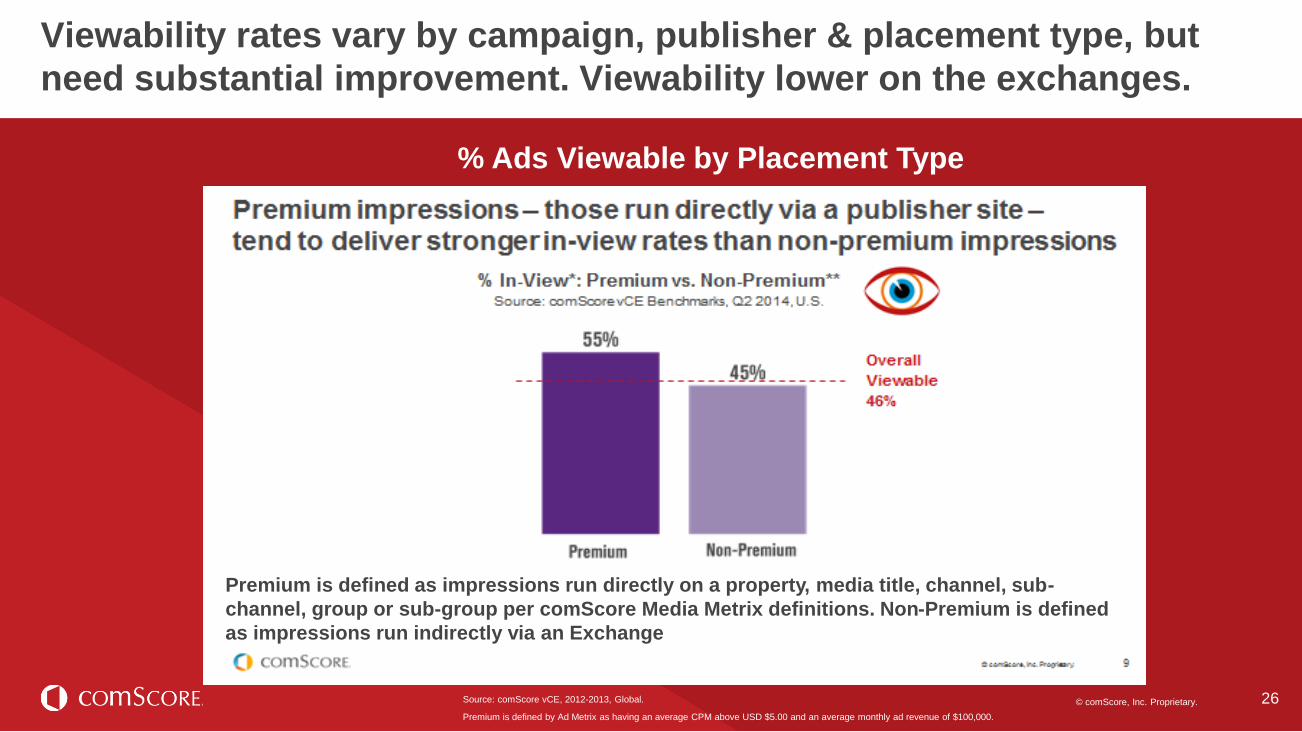
Viewability rates vary by campaign, publisher & placement type, but
need substantial improvement. Viewability lower on the exchanges.
% Ads Viewable by Placement Type
Source: comScore vCE, 2012-2013, Global.
Premium is defined by Ad Metrix as having an average CPM above USD $5.00 and an average monthly ad revenue of $100,000.
Premium is defined as impressions run directly on a property, media title, channel, sub-
channel, group or sub-group per comScore Media Metrix definitions. Non-Premium is defined
as impressions run indirectly via an Exchange
© comScore, Inc. Proprietary. 2727© comScore, Inc. Proprietary.
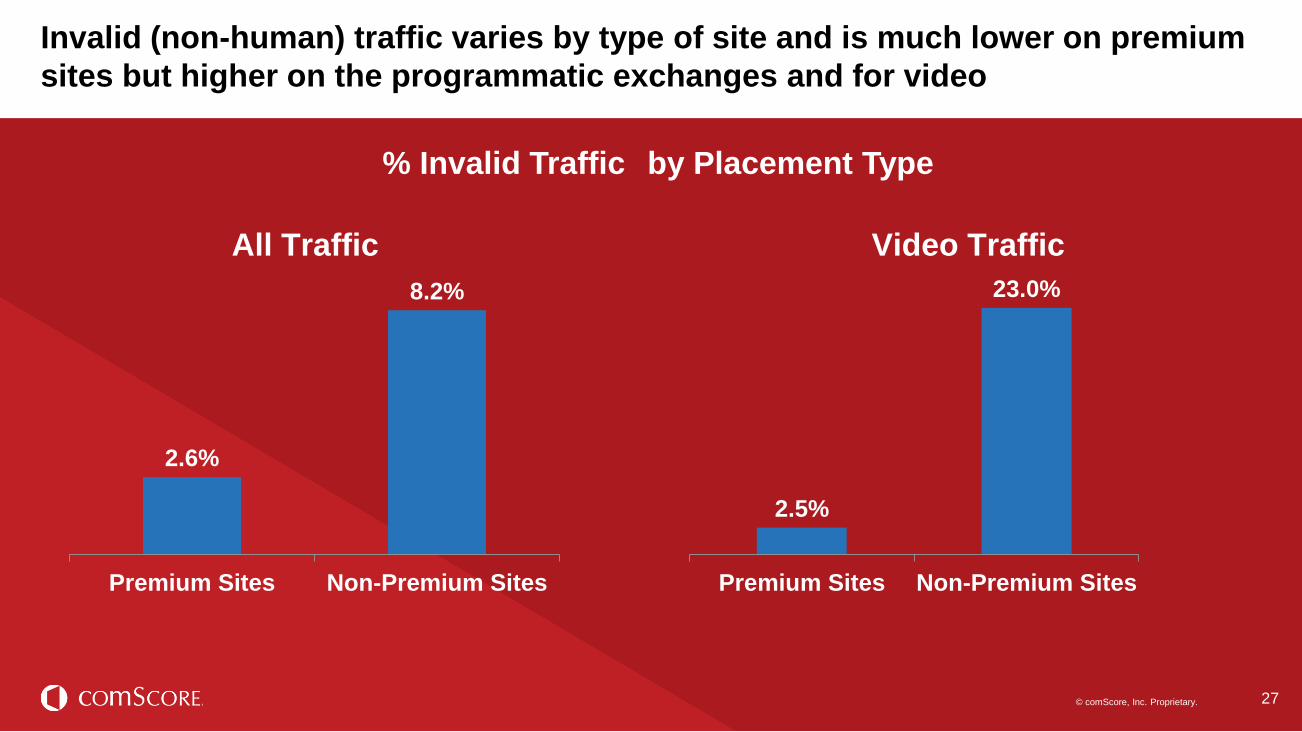
% Invalid Traffic by Placement Type
Invalid (non-human) traffic varies by type of site and is much lower on premium
sites but higher on the programmatic exchanges and for video
2.6%
8.2%
Premium Sites Non-Premium Sites
All Traffic Video Traffic
2.5%
23.0%
Premium Sites Non-Premium Sites

© comScore, Inc. Proprietary. 2828© comScore, Inc. Proprietary.
The Importance of Viewability: sales lift increases with improved viewability – and
the effects do not appear to be linear
Impact of Viewability on Sales Lift

© comScore, Inc. Proprietary. 2929© comScore, Inc. Proprietary.
As media consumption fragments, audience
measurement and media planning must adopt
a unified Cross-Platform view of the consumer.

© comScore, Inc. Proprietary. 30
Cross-Platform
Measurement
Is All About
THIS
Live TV
DVR
Desktop
Smartphone
Tablet
OTT
TV VOD

© comScore, Inc. Proprietary.© comScore, Inc. Proprietary. 31
De-Duplication Reach Expansion

© comScore, Inc. Proprietary. 32
comScore cross-platform data shows that digital significantly
increases the unduplicated daily reach of ESPN TV by 21%
To take advantage of
ESPN’s TV/Digital
reach, an advertiser
needs to place
messages across all
platforms
25.0
5.0
1.2
Men 18+31 million total Reach
ESPN Daily Reach Build (Millions)
Added Reach-PC
Added Reach-Mobile
TV
Source: comScore Project Blueprint January 2015

© comScore, Inc. Proprietary. 33
Parks & Recreation Finale: Millennials show much greater
Time Shifted Viewing (TSV) and Digital consumption
Source: comScore Xmedia, February 2015
All Persons P18-34
Digital Only
Live + 7
Live + SD
Live
+21%
+3%+24%
+35%
+8%
+43%
Parks & Recreation Incremental Audience from TSV and Digital

© comScore, Inc. Proprietary. 34
Hulu’s audience grows by 95% when measuring mobile,
OTT and co-viewing on top of desktop
Source: comScore Hulu Total Audience Report, March 2015
0
5
10
15
20
25
30
Desktop Plus Mobile Plus OTT TV Plus Co-Viewing
Total Audience
Un
iqu
e V
iew
ers
(M
M)
13.2
6.3
4.51.8
25.8 MM
12.6 MM incremental unique viewers, or nearly half of Hulu’s Total Audience
% Share ofVideos
OTTTV
54%
Desktop34%
Mobile12%

© comScore, Inc. Proprietary. 35
“We have to get better at cross-platform measurement. Better at
deduplication. We need to understand how much reach we obtain on
a campaign across devices.
With the availability of cross-platform data that allows improved
media planning, I believe ad spending will increase across all
platforms.”
Irwin Gotlieb
Chairman, GroupM
comScore Client Summit, Sept 2015

© comScore, Inc. Proprietary.© comScore, Inc. Proprietary. 36
Cross-Platform Campaign Effectiveness
Outpaces Single-Platform Approach

© comScore, Inc. Proprietary. 37
Cross-Platform Data Allows MEDIA-PLANNING EFFICIENCY
* Effective Reach is defined as 3+ impressions delivered
Media Plan GRPs Cost Total Reach Effective Reach*
TV Only 1,000 $10,000 85.1% 67.8%
TV + Digital Combination
TV (90%) 900 $9,000 83.7% 65.8%
Digital (10%) 500 $1,000 63.8% 44.0%
TV + Digital 1,400 $10,000 90.2% 83.7%
TV Only vs.
90% TV/10% Digital400 $0 5.1% 15.9%
Impact of a 90/10 TV/Digital Budget Allocation

© comScore, Inc. Proprietary. 38
A cross platform plan that includes TV & digital can be expected to generate a higher ROI

© comScore, Inc. Proprietary. 39
Sales lift per media dollar spent varies according to
brand, target segment, creative, platform and media
plan … putting increased importance on accurate
audience and attribution measurement
A general conclusion ….

© comScore, Inc. Proprietary. 40© comScore, Inc. Proprietary.
Digital Marketing: Five Key Lessons
Forget the Click
Measure attitudinal and brand-related behavioral changes instead
Drop last-click attribution
Display advertising overlaid on search produces synergy and increases sales lift
Mobile advertising can be even more effective than desktop
Less clutter and lower funnel impact
Targeting, Viewability, Brand Safety & Invalid Traffic need to be monitored
Demand audience guarantees
Cross-Platform media plans offer great promise

For info about the proprietary technology used in comScore products, refer to http://comscore.com/About_comScore/Patents
www.comscore.com @comScore www.linkedin.com/company/comscore www.facebook.com/comscoreinc
Thank You!For copy of slides please email: