Embed Size (px)
Citation preview

1
For Institutional and Professional Investors OnlyFor Information OnlyNot For Further Distribution or Distribution to Retail Investors
Barclays Capital Fund SolutionsProviding investors with truly value-added investment solutions
April 2010
Income Plus (EUR) StrategyEnhanced real return in changing markets
For Institutional and Professional Investors OnlyFor Information OnlyNot For Further Distribution or Distribution to Retail Investors

2
For Institutional and Professional Investors OnlyFor Information OnlyNot For Further Distribution or Distribution to Retail InvestorsContents
BCFS Overview
Income Plus (EUR) Overview
Investment Methodology
Distinctive Performance in Different Market Conditions
Points to Note

3
For Institutional and Professional Investors OnlyFor Information OnlyNot For Further Distribution or Distribution to Retail Investors
Value Proposition
Barclays Capital Fund Solutions About us
Multiple sources of excess returns
Active strategiesStructured strategies
Negligible key man risk
Investment Performance
Bespoke portfolio construction
Tailored delivery structuring
Customized solutions
Fiduciary duty
Strict governance
Chinese walled from all other Barclays businesses
Operating under investor-protective regulatory framework
Segregated assets with best of breed administration and auditing
Security
Providing investors with
truly value-added investment solutions
by combining the strengths of asset management and investment banking
Mission
Barclays Capital Fund Solutions is the
asset management business of Barclays Capital, the investment banking division of Barclays Bank PLC, offering investors a full range of standard and tailor-made investments

4
For Institutional and Professional Investors OnlyFor Information OnlyNot For Further Distribution or Distribution to Retail Investors
Applying…
Distinctive Alpha Generation
Combining fundamental analysis with technical analysis and having discretionary management oversight
Monetizing on award-winning research
Effective portfolio liquidity management – realizable gains
Making use of liquid underlyings
Drawing on the extensive derivatives trading expertise
Unique downside risk management and active diversification management
Applying proprietary Distribution Mapping approach
Bringing into play dynamic risk management
Applying proprietary Correlation Optimization model
Barclays Capital Fund Solutions BCFS alpha generation –
investment philosophy
… to achieve
A proven track record of delivering liquid excess returns and minimizing downside volatility in all market conditions
Delivering distinctive returns with low downside volatility
Generating positively skewed returns with limited correlation with traditional and alternative assets – positive returns across strategies in 2008
Shifting the efficient frontier outwards improving the risk/return profile of the investors
Identifying and extracting returns by combining thorough fundamental analysis with technical analysis and having discretionary management oversight
Creating highly liquid investment strategies
Reducing downside and diversifying across a broad range of assets
BCFS Alpha Generation Investment Philosophy

5
For Institutional and Professional Investors OnlyFor Information OnlyNot For Further Distribution or Distribution to Retail Investors
Barclays Capital Fund Solutions Facts and Figures
Where BCFS utilises Barclays Capital this is always at an arms length basis.As of March 2010Source: Barclays Capital
AUM by asset classAssets Under Management
Investment ProfessionalsDedicated team of 34 peopleLeveraging 200 structuring professionalsAccessing 800 in-house research analysts
TechnologyUniquely flexible platformWorld-class banking risk managementCutting-edge asset management technology
OperationsFive locations (London, New York, Singapore, Tokyo, Sydney)Dedicated team of 50 people in infrastructureLeveraging the full infrastructure of the bankThird-party auditing and reconciliation
A global asset manager offering a platform that can distribute domestic funds into all major jurisdictions
Geographic footprintResources
14%
23%
2%
5%
56%
Equities Commodities Fixed Income Other Multi Asset
814
2,505
3,500
3,931 4,224
0
500
1000
1500
2000
2500
3000
3500
4000
4500
2006 2007 2008 2009 2010
GB
P (m
illio
ns)

6
For Institutional and Professional Investors OnlyFor Information OnlyNot For Further Distribution or Distribution to Retail Investors
Algorithmic Strategies
Barclays Capital Fund Solutions Summary of Flagship Strategies
Performance data from Jan 05 to Mar 10 for all strategies except
RADAR (USD) which is from Jan 06 to Mar 10 (when the first GAA report was published). Includes back-testing for period prior to inception. CAR L/S (EUR) live since Aug 07, Income Plus (EUR) live since Oct 06, Income Plus (USD) live since Feb 07, CORALS (USD) since Feb 08, TAP4 (EUR) since Mar 08, RADAR (USD) since Mar 09, EMERALDS (USD) since Nov 09, FX Elements (EUR) since Jan 09, GEMS (USD) since Jul 06, Pure Beta (USD) live since Nov 07 and GSART (EUR) since Jan 07.DJUBSCI TR is a service mark of Dow Jones & Company, Inc. and UBS AGSource: Barclays Capital, based on data available on Bloomberg, as of Mar 10Any prediction or data on past performance, modelling or back-testing contained herein is not indication as to future performance.
TAP4
Active Strategies
Target Return
Multi asset
Outperform Money Market
Absolute Return
Outperform Inflation
CAR L/S Income Plus (EUR)
RADAR
Commodities CORALS
S&P 500 stocks EMERALDS
Outperform Beta index
Emerging Markets
Foreign Exchange
Commodities
FX Elements
GEMS
Pure Beta
Income Plus (USD)
TAP4
RADAR
CORALS
Income Plus (EUR)EMERALDS
iBoxx
CAR L/S
Eurostoxx
50
S&P 500
GS ART (EUR)
HFRX DJUBSCI TR
EU Govt infl
RICI
S&P GSCI
EUR 1M Libor
CS Tremont HF
FX Elements
-5%
0%
5%
10%
15%
20%
0% 5% 10% 15% 20% 25% 30%
Volatility %Re
turn
%
BCFS Active strategies
Market Benchmarks
Sharpe ratio =1
Pure Beta
Income Plus (USD)
GEMS

7
For Institutional and Professional Investors OnlyFor Information OnlyNot For Further Distribution or Distribution to Retail InvestorsContents
BCFS Overview
Income Plus (EUR) Overview
Investment Methodology
Distinctive Performance in Different Market Conditions
Points to Note
8
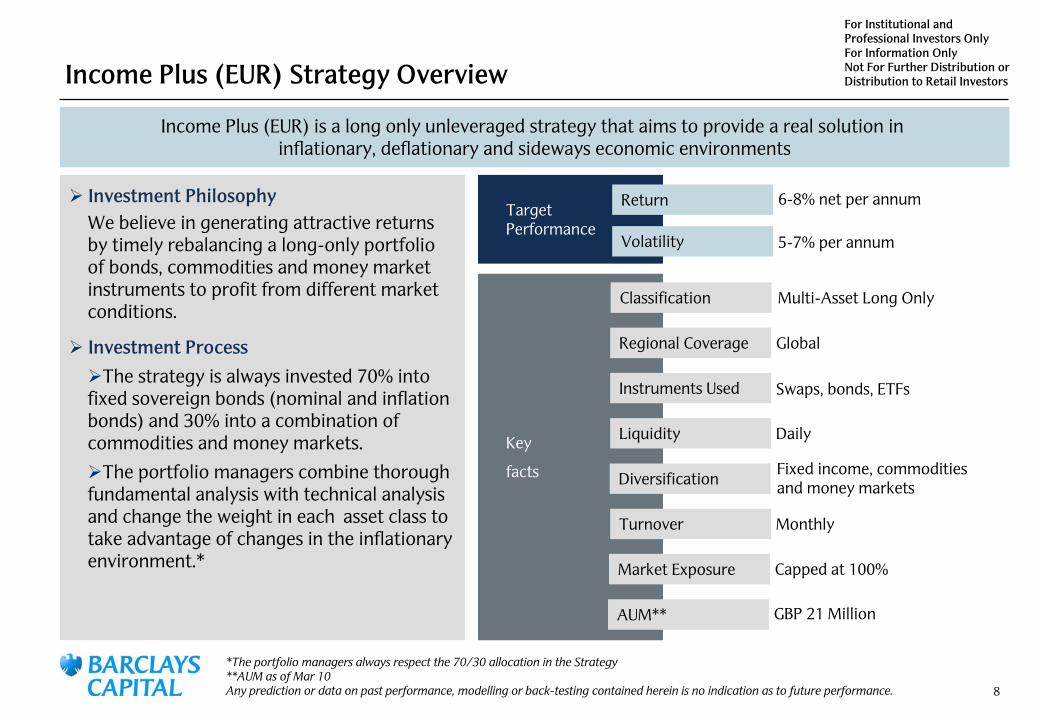
For Institutional and Professional Investors OnlyFor Information OnlyNot For Further Distribution or Distribution to Retail InvestorsIncome Plus (EUR) Strategy Overview
*The portfolio managers always respect the 70/30 allocation in the Strategy**AUM as of Mar 10Any prediction or data on past performance, modelling or back-testing contained herein is no indication as to future performance.
Income Plus (EUR) is a long only unleveraged strategy that aims to provide a real solution in inflationary, deflationary and sideways economic environments
Key
facts
6-8% net per annum
5-7% per annum
Target
Performance
Return
Volatility
Investment PhilosophyWe believe in generating attractive returns by timely rebalancing a long-only portfolio of bonds, commodities and money market instruments to profit from different market conditions.
Investment ProcessThe strategy is always invested 70% into
fixed sovereign bonds (nominal and inflation bonds) and 30% into a combination of commodities and money markets.
The portfolio managers combine thorough fundamental analysis with technical analysis and change the weight in each asset class to take advantage of changes in the inflationary environment.*
Global
Swaps, bonds, ETFs
Daily
Monthly
Capped at 100%
Regional Coverage
Instruments Used
Liquidity
Turnover
Market Exposure
Multi-Asset Long Only Classification
Fixed income, commodities and money marketsDiversification
GBP 21 MillionAUM**

9
For Institutional and Professional Investors OnlyFor Information OnlyNot For Further Distribution or Distribution to Retail Investors
Income Plus (EUR) has shown a solid performance with an annualised return of 9%, out-performing EU Government Inflation Linked Bonds by 5%.
At the same time, Income Plus (EUR) managed to maintain relatively low risk with a volatility of 7% for the whole period.
Income Plus (EUR) Performance from Jan 2005 to Mar 2010
Pro-forma data Jan 05 –
Sep 06, live performance since Oct 06 to Mar 10.Source: Barclays Capital, based on data available on Bloomberg, as of Mar 10.DJUBSCI TR is a service mark of Dow Jones & Company, Inc. and UBS AG
Any prediction or data on past performance, modelling or back-testing contained herein is no indication as to future performance.
Income Plus (EUR) Strategy Overview Compelling Performance
Monthly
Annualised Volatility
Annualised Return
LivePro Forma
70
90
110
130
150
170
190
Dec-0
4M
ar-0
5Jun-0
5Sep
-05
Dec-0
5M
ar-0
6Jun-0
6Sep
-06
Dec-0
6M
ar-0
7Jun-0
7Sep
-07
Dec-0
7M
ar-0
8Jun-0
8Sep
-08
Dec-0
8M
ar-0
9Jun-0
9Sep
-09
Dec-0
9M
ar-1
0
Income Plus (EUR)
DJUBSCI TR
EU Govt Inflation linked Bonds
iBoxx
Eur
Sov
All Mat 9% 7%
4% 4%4% 5%
1% 20%

10
For Institutional and Professional Investors OnlyFor Information OnlyNot For Further Distribution or Distribution to Retail InvestorsContents
BCFS Overview
Income Plus (EUR) Overview
Investment Methodology
Distinctive Performance in Different Market Conditions
Points to Note

11
For Institutional and Professional Investors OnlyFor Information OnlyNot For Further Distribution or Distribution to Retail Investors
Fundamental
Analysis
Technical
Analysis
Barclays Alpha
Variance
Investment Methodology Combining Fundamental & Technical Analysis

12
For Institutional and Professional Investors OnlyFor Information OnlyNot For Further Distribution or Distribution to Retail Investors
0%
100%
200%
300%
400%
500%
Dec-00
Jun-0
1
Dec-01
Jun-0
2
Dec-02
Jun-0
3
Dec-03
Jun-0
4
Dec-04
Jun-0
5
Dec-05
Jun-0
6
Dec-06
Jun-0
7
Dec-07
Jun-0
8
Dec-08
Crude Investment
Crude Inflation Strategy
Demonstrated potential of Inflation Gap as fundamental indicator of crude price
Strategy: if Inflation Gap (Difference of 1Y and 10Y ahead inflation expectation released by Philadelphia Fed each month) is positive, invest in crude, else don’t
Outcome: strategy outperforms buy and hold strategy in crude by over 17% per annum
Macro signals identify “Unsystematic”
crises
Macro signals identify fundamental value
Source: Barclays Capital, based on data available on Bloomberg, as of Mar 10.Any prediction or data on past performance, modelling or back-testing contained herein is no indication as to future performance.
Investment Methodology Combining Fundamental & Technical Analysis

13
For Institutional and Professional Investors OnlyFor Information OnlyNot For Further Distribution or Distribution to Retail Investors
The importance of momentum investing: Fundamental analysis is rarely sufficient by itself
Source: Bloomberg
*The recommendations used are for illustration purposes only, and may not be representative of all historical recommendationsAny prediction or data on past performance, modelling or back-testing contained herein is no indication as to future performance.
“Buy”
recommendations based
on fundamentals when
the market is being sold*
Investment Methodology Combining Fundamental & Technical Analysis

14
For Institutional and Professional Investors OnlyFor Information OnlyNot For Further Distribution or Distribution to Retail Investors
The importance of momentum investing: Technical Analysis of peaks, troughs and turning points is key to
consolidating performance
Source: BloombergAny prediction or data on past performance, modelling or back-testing contained herein is no indication as to future performance.
The Relative Strength Index is one out of many indicators that help validating such turning points.
The Relative Strength Index
Investment Methodology Combining Fundamental & Technical Analysis

15
For Institutional and Professional Investors OnlyFor Information OnlyNot For Further Distribution or Distribution to Retail Investors
The strategy factors in global growth, momentum, mean reversion and fundamental attributes to forecast the expected performance of individual assets for the forthcoming month.
The optimisation model seeks to maximise returns per unit of risk of the overall portfolio
Investment Methodology Combining Fundamental & Technical Analysis
The strategy factors in global growth, momentum, mean reversion and fundamental attributes to forecast the expected performance of individual assets for the forthcoming month.
The optimisation model seeks to maximise returns per unit of risk of the overall portfolio
Fundamental
Analysis
Technical
Analysis
The portfolio managers collect data on fundamental and technical indicators that drive asset returns (over 6,000 indicators in total)
Step 1 Step 2
The portfolio managers thoroughly analyse the indicators and indentify key drivers of market trends and expected returns for each asset
Key Fundamental Drivers
Key Technical
Drivers
Step 3
The portfolio managers build a diversified portfolio that maximizes risk-weighted returns based on expected returns and correlation.
Portfolio composition Fundamental and Technical Indicators

16
For Institutional and Professional Investors OnlyFor Information OnlyNot For Further Distribution or Distribution to Retail Investors
Example of indicators used in the Fundamental Analysis
Forward-looking fundamental forecast is calculated based on the regression model using
the selected indicators
Example of indicators used in the Technical Analysis
Expected market direction is generated from the regression model using the selected indicators
•
Inflation •
GDP Data•
Employment
MACRO•
Yield Curve Steepness
•
Commodities Roll Yield
•
PE ratio
Market Data
•
PMI•
Consumer Confidence
•
Investor Sentiment
Survey Data
•
Yield Forecast•
Earning Forecast
Leading Factor
•
Hedge Funds’
Position•
Exchange-total position
Position
•
LME Inventory•
OPEC Production•
DOE strategic reserves
Fundamental
•
Relative Strength Index
•
Moving Average
Trend
•
Trade Volume•
Open Interest
Demand-Supply
•
10-day Volatility•
Implied Volatility
Risk Aversion
•
Oscillator•
MACD*
Mean Reversion
*Moving Average Convergence/Divergence
Investment Methodology Combining Fundamental & Technical Analysis
17
For Institutional and Professional Investors OnlyFor Information OnlyNot For Further Distribution or Distribution to Retail Investors
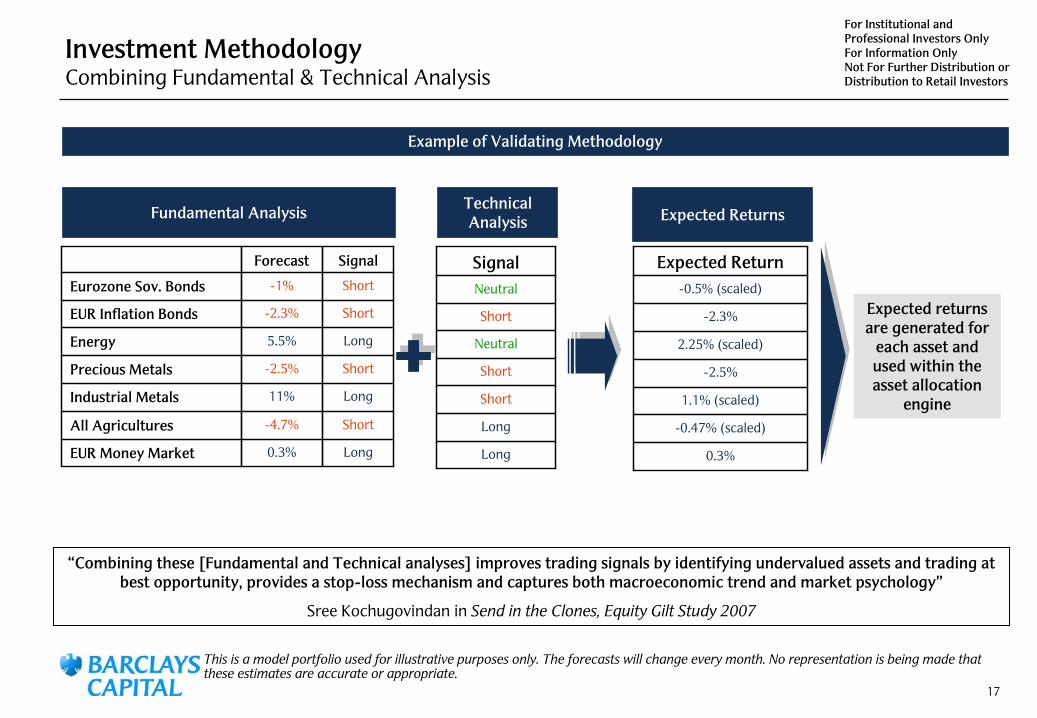
Fundamental Analysis
Forecast Signal
Eurozone Sov. Bonds -1% Short
EUR Inflation Bonds -2.3% Short
Energy 5.5% Long
Precious Metals -2.5% Short
Industrial Metals 11% Long
All Agricultures -4.7% Short
EUR Money Market 0.3% Long
Expected Return-0.5% (scaled)
-2.3%
2.25% (scaled)
-2.5%
1.1% (scaled)
-0.47% (scaled)
0.3%
SignalNeutral
Short
Neutral
Short
Short
Long
Long
Technical Analysis Expected Returns
Expected returns are generated for
each asset and used within the asset allocation
engine
“Combining these [Fundamental and Technical analyses] improves trading signals by identifying undervalued assets and trading at best opportunity, provides a stop-loss mechanism and captures both macroeconomic trend and market psychology”
Sree
Kochugovindan in Send in the Clones, Equity Gilt Study 2007
Example of Validating Methodology
This is a model portfolio used for illustrative purposes only. The forecasts will change every month. No representation is being
made that these estimates are accurate or appropriate.
Investment Methodology Combining Fundamental & Technical Analysis
18
For Institutional and Professional Investors OnlyFor Information OnlyNot For Further Distribution or Distribution to Retail Investors
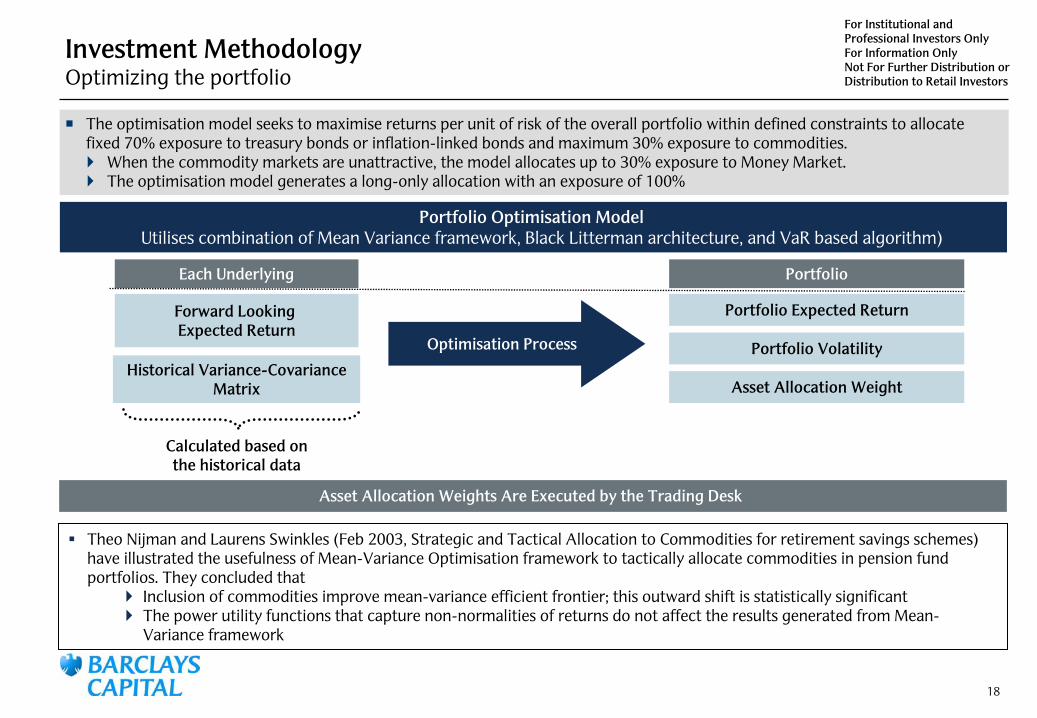
Theo Nijman and Laurens Swinkles (Feb 2003, Strategic and Tactical Allocation to Commodities for retirement savings schemes)have illustrated the usefulness of Mean-Variance Optimisation framework to tactically allocate commodities in pension fund portfolios. They concluded that
Inclusion of commodities improve mean-variance efficient frontier; this outward shift is statistically significantThe power utility functions that capture non-normalities of returns do not affect the results generated from Mean-Variance framework
Portfolio Optimisation
Model
Utilises
combination of Mean Variance framework, Black Litterman
architecture, and VaR
based algorithm)
Asset Allocation Weight
Forward Looking Expected Return
Historical Variance-Covariance Matrix
Calculated based on
the historical data
Each Underlying Portfolio
Portfolio Volatility
Portfolio Expected Return
Optimisation ProcessOptimisation Process
Asset Allocation Weights Are Executed by the Trading Desk
Investment Methodology Optimizing the portfolio
The optimisation model seeks to maximise returns per unit of risk of the overall portfolio within defined constraints to allocate fixed 70% exposure to treasury bonds or inflation-linked bonds and maximum 30% exposure to commodities.
When the commodity markets are unattractive, the model allocates up to 30% exposure to Money Market.The optimisation model generates a long-only allocation with an exposure of 100%

19
For Institutional and Professional Investors OnlyFor Information OnlyNot For Further Distribution or Distribution to Retail Investors
The process is simple and repeated monthly
As of today it is a unique model that combines Fundamental Economic data with Technical data
The latter doesn’t govern the direction of the investment, but does affects the size
of the allocation
Forward Looking Expected Return
Var-Covariance Matrix
Optimal Allocation
AllocationConstraints
HistoricalData
FundamentalIndicators
TechnicalIndicators
Long \ Short
Daily Downside Risk
Control
Investment Methodology Summary

20
For Institutional and Professional Investors OnlyFor Information OnlyNot For Further Distribution or Distribution to Retail Investors
The Income Plus (EUR) Strategy provides a real solution in inflationary, deflationary and sideways moving markets.
It combines investment in EU government bonds, inflation linked bonds, commodities and cash and extracts value by switching between these asset classes to maximise risk-adjusted returns.
The Income Plus (EUR) Strategy rebalances on a monthly basis
Through its allocation methodology the strategy seeks to avoid the risks of negative real yield and minimises the impact of commodity volatility
Investment Methodology Income Plus (EUR) asset classes
70% 30%
Fixed Income Commodities and Money Market
Take advantage of inflation
Gain protection to deflation Reduce Volatility
EU Inflation Linked Bonds
EU Sovereign Bonds Money Market
EnergyPrecious MetalsIndustrial MetalsAll Agricultures
Take advantage of commodity price increases

21
For Institutional and Professional Investors OnlyFor Information OnlyNot For Further Distribution or Distribution to Retail Investors
Assets Category Min Weight Max Weight
Eurozone
Sov Bonds All Mat TR Fixed Income 0% 50%
EU Inflation Bonds All Mat Fixed Income 0% 50%
Total Fixed Income 70% 70%
Energy Commodities 0% 30%
Precious Metals Commodities 0% 30%
Industrial Metals Commodities 0% 30%
All Agricultures Commodities 0% 30%
EUR Money Market Money Market 0% 30%
Total Commodities and Money Market 30% 30%
Investment Methodology Income Plus (EUR) assets and weightings
22
For Institutional and Professional Investors OnlyFor Information OnlyNot For Further Distribution or Distribution to Retail InvestorsContents
BCFS Overview
Income Plus (EUR) Overview
Investment Methodology
Distinctive Performance in Different Market Conditions
Points to Note

23
For Institutional and Professional Investors OnlyFor Information OnlyNot For Further Distribution or Distribution to Retail Investors
Performance (Jan 05 –
Mar 10) Key Performance Indicators (as
of Mar 10)
LivePro Forma
Key Performance Indicators (as of March 2010)
Income Plus
(EUR)DJUBSCI
TR
EU Govt Inflation linked Bonds
iBoxx
Eur
Sov
All Mat
Annualised net return since Jan 05 9.3% 0.9% 3.7% 4.3%
Monthly annualised volatility since Jan 05 6.6% 20.2% 5.1% 3.5%
Sharpe Ratio since Jan 05 1.0 -0.1 0.3 0.5
1-Month 99% VaR
since Jan 05 -4.0% -14.4% -3.3% -2.2%
Distinctive Performance in Different Market Conditions Performance overview
Over the period Jan 2005 – Mar 2010, Income Plus (EUR) has shown a distinctive risk return profile.
With a Sharpe ratio of 1.0, it greatly out-performs EU Government Inflation Linked Bonds that has a Sharpe ratio of 0.3
Pro-forma data Jan 05 –
Sep 06, live performance since Oct 06 to Mar 10.Source: Barclays Capital, based on data available on Bloomberg, as of Mar 10.DJUBSCI TR is a service mark of Dow Jones & Company, Inc. and UBS AG
Any prediction or data on past performance, modelling or back-testing contained herein is no indication as to future performance.
70
90
110
130
150
170
190
Dec-0
4M
ar-0
5Jun-0
5Sep
-05
Dec-0
5M
ar-0
6Jun-0
6Sep
-06
Dec-0
6M
ar-0
7Jun-0
7Sep
-07
Dec-0
7M
ar-0
8Jun-0
8Sep
-08
Dec-0
8M
ar-0
9Jun-0
9Sep
-09
Dec-0
9M
ar-1
0
Income Plus (EUR)
DJUBSCI TR
EU Govt Inflation linked Bonds
iBoxx
Eur
Sov
All Mat

24
For Institutional and Professional Investors OnlyFor Information OnlyNot For Further Distribution or Distribution to Retail Investors
Distinctive Performance in Different Market Conditions Commodities bear markets
Commodities Bear Market in Jan 2001 to Dec 2001
80
85
90
95
100
105
110
Dec-00 Mar-01 Jun-01 Sep-01 Dec-01
Income Plus (EUR)
DJUBSCI TR
iBoxx
Euro Sov
All Maturities
Commodities Bear Market
DJUBSCI TR
iBoxx Euro Sov All
Maturities TR
Income Plus (EUR)
Key Performance Indicators (Jan 01 –
Dec 01)
-19.1%6.1%7.0%Accumulated return
9.7%3.5%3.9%Annualized Volatility
The Income Plus (EUR) Strategy shows steady performance during the commodities bear market in 2001.
The Income Plus (EUR) Strategy would have protected investors from a big drawdown in volatile commodities markets, outperforming the DJUBSCI TR by 26.1%. It also outperformed sovereign bonds.
Pro-forma data Jan 05 –
Sep 06, live performance since Oct 06 to Mar 10.Source: Barclays Capital, based on data available on Bloomberg, as of Mar 10.DJUBSCI TR is a service mark of Dow Jones & Company, Inc. and UBS AG
Any prediction or data on past performance, modelling or back-testing contained herein is no indication as to future performance.

25
For Institutional and Professional Investors OnlyFor Information OnlyNot For Further Distribution or Distribution to Retail Investors
95
100
105
110
115
120
Jul-05 Oct-05 Jan-06 Apr-06 Jul-06
Income Plus (EUR)EU Govt Inflation-linked bondDJUBSCI TR
Distinctive Performance in Different Market Conditions Weak bear markets
Inflation Bonds Bear Market in July 2005 to July 2006
DJUBSCI TR
EU Govt Inflation
Linked Bond
Income Plus (EUR)
Key Performance Indicators (Jul 05 –
Jul 06)
16.6%-1.0%18.1%Accumulated return
14.6%4.0%7.3%Annualized Volatility
For the period of July 2005 to July 2006, the Income Plus (EUR) generated a return of 18.1% while EU Government Inflation-linked bonds returned -1.0%
Income Plus (EUR) out-performed inflation bonds by 19.1% and even outperformed commodities by 1.5%, with half the volatility
Pro-forma data Jan 05 –
Sep 06, live performance since Oct 06 to Mar 10.Source: Barclays Capital, based on data available on Bloomberg, as of Mar 10.DJUBSCI TR is a service mark of Dow Jones & Company, Inc. and UBS AG
Any prediction or data on past performance, modelling or back-testing contained herein is no indication as to future performance.

26
For Institutional and Professional Investors OnlyFor Information OnlyNot For Further Distribution or Distribution to Retail Investors
Distinctive Performance in Different Market Conditions Market crisis
Market Crisis in June 07 to Mar 09
DJ Euro Stoxx
50
CSFB Tremont
Investable HF
Income Plus (EUR)
Key Performance Indicators(Jun 07 –
Mar 09)
-53.9%-16.1%16.4%Accumulated return
20.3%8.7%7.4%Annualized Volatility
Pro-forma data Jan 05 –
Sep 06, live performance since Oct 06 to Mar 10.Source: Barclays Capital, based on data available on Bloomberg, as of Mar 10.Any prediction or data on past performance, modelling or back-testing contained herein is no indication as to future performance.
During the market crisis (June 2007 to Mar 2009), Income Plus (EUR) generated stable live performance through its allocation to sovereign bonds. Sovereign bonds are generally regarded as “safe havens” during global slowdown and market uncertainties.
The Income Plus (EUR) Strategy generated a cumulative return of 16.4% return
40
50
60
70
80
90
100
110
120
Jun-07 Sep-07 Dec-07 Mar-08 Jun-08 Sep-08 Dec-08 Mar-09
Income Plus (EUR)
iBoxx
Euro Sov
All Maturities
DJ EURO Stoxx
50
CS Tremont Hedge Fund

27
For Institutional and Professional Investors OnlyFor Information OnlyNot For Further Distribution or Distribution to Retail Investors
Live Performance (Oct
06 –
Mar 10) Key Performance Indicators (as
of Mar 10)
Key Performance Indicators (as of March 2010)
Income Plus
(EUR)DJUBSCI
TR
EU Govt Inflation linked Bonds
iBoxx
Eur
Sov
All Mat
Net return last 12 months 9.4% 20.5% 9.2% 5.8%
Annualised return since inception 7.6% -3.3% 4.2% 4.9%
Monthly annualised volatility since inception 6.8% 22.4% 5.5% 3.7%
Sharpe ratio since inception 0.7 -0.2 0.3 0.61-Month 99% VaR
since inception -4.3% -16.2% -3.6% -2.3%
Return 2006 (Oct-Dec) 3.0% 5.4% -0.9% -0.5%
Return 2007 6.1% 16.2% 1.9% 1.9%
Return 2008 6.3% -35.6% 3.8% 9.1%
Return 2009 11.5% 18.9% 8.1% 4.3%
Return 2010 -0.1% -5.0% 1.7% 2.3%
Since the launch of the strategy in October 2006, Income Plus (EUR) has generated stable returns, offering an effective and solid protection against inflation.
Income Plus (EUR) shows higher annualised returns than commodities, inflation-linked bonds and sovereign bonds since inception, with lower volatility at the same time.
Distinctive Performance in Different Market Environments Live Performance
Pro-forma data Jan 05 –
Sep 06, live performance since Oct 06 to Mar 10.Source: Barclays Capital, based on data available on Bloomberg, as of Mar 10.DJUBSCI TR is a service mark of Dow Jones & Company, Inc. and UBS AG
Any prediction or data on past performance, modelling or back-testing contained herein is no indication as to future performance.
70
80
90
100
110
120
130
140
150
160
170
Sep-0
6Dec
-06
Mar
-07
Jun-07
Sep-0
7Dec
-07
Mar
-08
Jun-08
Sep-0
8Dec
-08
Mar
-09
Jun-09
Sep-0
9Dec
-09
Mar
-10
Income Plus (EUR)
DJUBSCI TR
EU Govt Inflation linked Bonds
iBoxx
Eur
Sov
All Mat

28
For Institutional and Professional Investors OnlyFor Information OnlyNot For Further Distribution or Distribution to Retail Investors
Distinctive Performance in Different Market Conditions Decorrelation
Correlation (Jan 2005 –
Mar 2010)
Income Plus (EUR)
DJUBSCI TR EU Govt Inflation linked Bonds
iBoxx
Eur
Sov
All Mat
DJ Euro Stoxx S&P 500 HFRX
Income Plus (EUR) 1.00 0.57 0.45 0.21 0.15 0.25 0.29
DJUBSCI TR 1.00 0.31 -0.24 0.34 0.45 0.69
EU Govt Inflation linked Bonds 1.00 0.55 0.29 0.37 0.23
iBoxx
Eur
Sov
All Mat 1.00 -0.16 -0.15 -0.37
DJ Euro Stoxx 1.00 0.90 0.66
S&P 500 1.00 0.71
HFRX 1.00
The strategy creates correlation benefits by decoupling from both traditional and alternative investments.
Adding the strategy to existing portfolios shifts the efficient frontier outwards and thereby improves the risk return profile of the overall portfolio.
Pro-forma data Jan 05 –
Sep 06, live performance since Oct 06 to Mar 10.Source: Barclays Capital, based on data available on Bloomberg, as of Mar 10.DJUBSCI TR is a service mark of Dow Jones & Company, Inc. and UBS AG
Any prediction or data on past performance, modelling or back-testing contained herein is no indication as to future performance.

29
For Institutional and Professional Investors OnlyFor Information OnlyNot For Further Distribution or Distribution to Retail Investors
Income Plus (EUR) pro-forma and live performance from January 2005 to March 2010
Jan Feb Mar Apr May Jun Jul Aug Sep Oct Nov Dec Total
2005 -0.17% 2.38% 1.07% -0.32% 0.75% 0.77% -0.66% 6.76% 2.35% 0.31% 2.41% 3.26% 20.36%
2006 2.74% -1.01% 0.82% -0.90% 0.24% -0.10% 0.66% -0.64% 0.44% 3.02% 2.17% -2.18% 5.26%
2007 -1.69% 0.65% 1.21% 2.53% -1.51% -1.65% 1.90% 2.27% 3.31% -1.90% -0.57% 1.61% 6.11%
2008 3.89% 3.42% -3.53% 0.68% 2.75% 1.02% -1.82% -1.59% -0.87% -2.65% 2.21% 2.96% 6.29%
2009 0.12% -0.54% 2.28% 0.61% 1.25% 0.72% 3.01% 1.83% 0.35% 0.62% 2.25% -1.44% 11.52%
2010 -2.90% 1.31% 1.57% -0.08%
Live Performance
Best Performing Months
Worst Performing Months
Income Plus (EUR) Monthly Performance
Pro-forma data Jan 05 –
Sep 06, live performance since Oct 06 to Mar 10.Source: Barclays Capital, based on data available on Bloomberg, as of Mar 10.Any prediction or data on past performance, modelling or back-testing contained herein is no indication as to future performance.

30
For Institutional and Professional Investors OnlyFor Information OnlyNot For Further Distribution or Distribution to Retail Investors
Key Performance Indicators
(Jan 05 –
Mar 10)
Income Plus (EUR) DJUBSCI TR EU Govt Inflation linked
BondsiBoxx
Eur
Sov
All MatDJ Euro Stoxx S&P 500 HFRX
Return
Annualized Monthly Return
9.3% 0.9% 3.7% 4.3% 2.7% 1.4% 0.6%
Best performing 12 months
23.9% 41.6% 13.9% 11.6% 46.6% 53.6% 14.5%
Worst performing 12 months
-1.5% -50.3% -2.1% -2.5% -45.0% -43.3% -23.3%
Risk Factors
Annualized Monthly Volatility
6.6% 20.2% 5.1% 3.5% 18.7% 16.0% 7.3%
Sharpe Ratio 1.0 -0.1 0.3 0.5 0.0 -0.1 -0.3
Annualized Monthly Downside Volatility
3.3% 15.2% 3.3% 1.7% 13.8% 12.3% 6.0%
Sortino
Ratio 2.1 -0.1 0.4 1.0 0.0 -0.1 -0.4
1 Month 99% VaR -4.0% -14.4% -3.3% -2.2% -13.1% -11.3% -5.2%
Distinctive Performance in Different Market Conditions Performance analysis versus reference indices
The strategy has had a better risk profile than most of its reference indices with a downside volatility of only 3.3%, a 1-month VaR of -4.0% and a Sortino ratio of 2.1.
Even in terms of worst performing 12 months, the strategy still returned -1.5%.
Pro-forma data Jan 05 –
Sep 06, live performance since Oct 06 to Mar 10.Source: Barclays Capital, based on data available on Bloomberg, as of Mar 10.DJUBSCI TR is a service mark of Dow Jones & Company, Inc. and UBS AG
Any prediction or data on past performance, modelling or back-testing contained herein is no indication as to future performance.
31
For Institutional and Professional Investors OnlyFor Information OnlyNot For Further Distribution or Distribution to Retail Investors
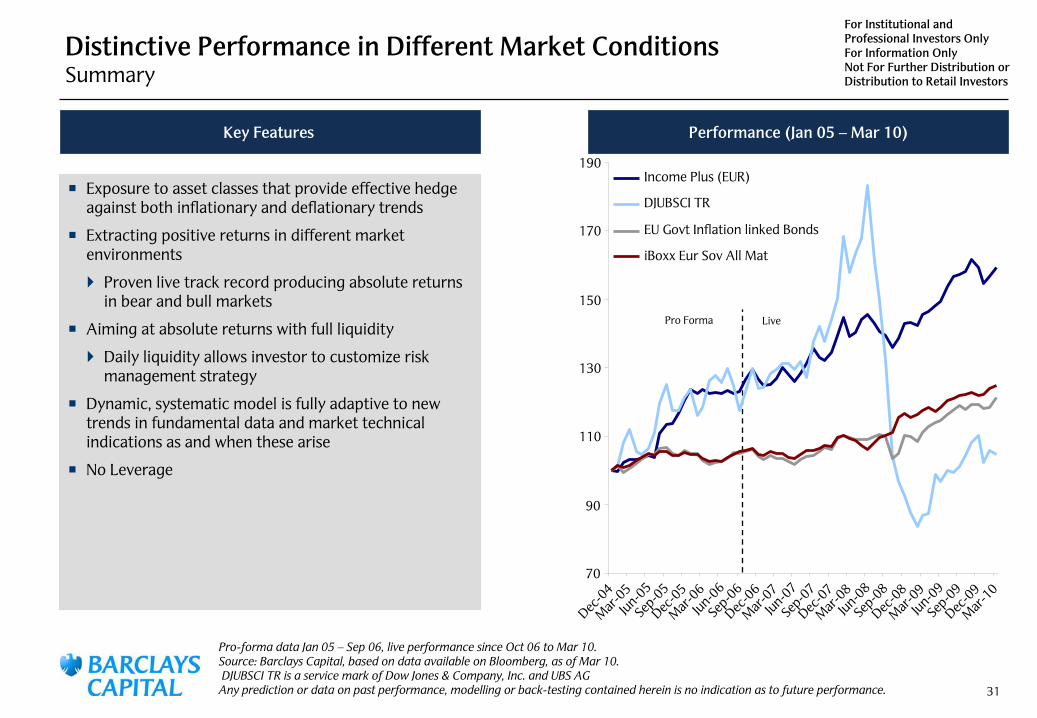
Distinctive Performance in Different Market Conditions Summary
Performance (Jan 05 –
Mar 10)Key Features
LivePro Forma
Exposure to asset classes that provide effective hedge against both inflationary and deflationary trends
Extracting positive returns in different market environments
Proven live track record producing absolute returns in bear and bull markets
Aiming at absolute returns with full liquidity
Daily liquidity allows investor to customize risk management strategy
Dynamic, systematic model is fully adaptive to new trends in fundamental data and market technical indications as and when these arise
No Leverage
Pro-forma data Jan 05 –
Sep 06, live performance since Oct 06 to Mar 10.Source: Barclays Capital, based on data available on Bloomberg, as of Mar 10.DJUBSCI TR is a service mark of Dow Jones & Company, Inc. and UBS AG
Any prediction or data on past performance, modelling or back-testing contained herein is no indication as to future performance.
70
90
110
130
150
170
190
Dec-0
4M
ar-0
5Jun-0
5Se
p-05
Dec-0
5M
ar-0
6Jun-0
6Se
p-06
Dec-0
6M
ar-0
7Jun-0
7Se
p-07
Dec-0
7M
ar-0
8Jun-0
8Se
p-08
Dec-0
8M
ar-0
9Jun-0
9Se
p-09
Dec-0
9M
ar-1
0
Income Plus (EUR)
DJUBSCI TR
EU Govt Inflation linked Bonds
iBoxx
Eur
Sov
All Mat

32
For Institutional and Professional Investors OnlyFor Information OnlyNot For Further Distribution or Distribution to Retail InvestorsContents
BCFS Overview
Income Plus (EUR) Overview
Investment Methodology
Distinctive Performance in Different Market Conditions
Points to Note

33
For Institutional and Professional Investors OnlyFor Information OnlyNot For Further Distribution or Distribution to Retail InvestorsDisclaimer
This document has been prepared by Barclays Capital, the investment banking division of Barclays Bank PLC ("Barclays"), for information purposes only. This document is an indicative summary of the terms and conditions of the securities/transaction described herein and may be amended, superseded or replaced by subsequent summaries. The final terms and conditions of the securities/transaction will be set out in full in the applicable offering document(s) or binding transaction document(s).
This document shall not constitute an underwriting commitment, an offer of financing, an offer to sell, or the solicitation of an offer to buy any securities described herein, which shall be subject to Barclays’
internal approvals. No transaction or service related thereto is contemplated without Barclays' subsequent formal agreement. Barclays is acting solely as principal and not as advisor or fiduciary. Accordingly you must independently determine, with your own advisors, the appropriateness for you of the securities/transaction before investing or transacting. Barclays accepts no liability whatsoever for any consequential losses arising from the use of this document or reliance on the information contained herein.
Barclays does not guarantee the accuracy or completeness of information which is contained in this document and which is stated to have been obtained from or is based upon trade and statistical services or other third party sources. Any
data on past performance, modelling or back-testing contained herein is no indication as to future performance. No representation is made as to the reasonableness of the assumptions made within or the accuracy or completeness of any modelling or back-testing. All opinions and estimates are given as of the date hereof and are subject to change. The value
of any investment may fluctuate as a result of market changes. The information in this document is not intended to predict actual results and no assurances are given with respect thereto.
Barclays, its affiliates and the individuals associated therewith may (in various capacities) have positions or deal in transactions or securities (or related derivatives) identical or similar to those described herein.
This document is being made available in the UK to persons who are investment professionals as defined in Article 19 of the FSMA
2000 (Financial Promotion Order) 2005. Outside of the UK, it is directed at persons who have professional experience in matters relating to investments. Any investments to which this document relates will be entered into only with such persons. Clients should contract and execute transactions through a Barclays Bank PLC branch or affiliate in their home jurisdiction unless local regulations permit otherwise. This document is not for distribution to retail customers.
NO ACTION HAS BEEN MADE OR WILL BE TAKEN THAT WOULD PERMIT A PUBLIC OFFERING OF THE SECURITIES DESCRIBED HEREIN IN ANY JURISDICTION IN WHICH ACTION FOR THAT PURPOSE IS REQUIRED. NO OFFERS, SALES, RESALES OR DELIVERY OF THE SECURITIES DESCRIBED HEREIN OR DISTRIBUTION OF ANY OFFERING MATERIAL RELATING TO SUCH SECURITIES MAY BE MADE IN OR FROM ANY JURISDICTION EXCEPT IN CIRCUMSTANCES WHICH WILL RESULT IN COMPLIANCE WITH ANY APPLICABLE LAWS AND REGULATIONS AND WHICH WILL NOT IMPOSE ANY OBLIGATION ON BARCLAYS
OR ANY OF ITS AFFILIATES.
THIS DOCUMENT DOES NOT DISCLOSE ALL THE RISKS AND OTHER SIGNIFICANT ISSUES RELATED TO AN INVESTMENT IN THE SECURITIES/TRANSACTION. PRIOR TO TRANSACTING, POTENTIAL INVESTORS SHOULD ENSURE THAT THEY FULLY UNDERSTAND THE TERMS OF THE SECURITIES/TRANSACTION AND ANY APPLICABLE RISKS. THIS DOCUMENT IS NOT A PROSPECTUS FOR ANY SECURITIES DESCRIBED HEREIN. INVESTORS SHOULD ONLY SUBSCRIBE FOR ANY TRANSFERABLE SECURITIES DESCRIBED HEREIN ON THE BASIS OF INFORMATION IN THE RELEVANT PROSPECTUS (WHICH HAS BEEN OR WILL BE PUBLISHED AND MAY BE OBTAINED FROM BARCLAYS), AND NOT ON THE BASIS OF ANY INFORMATION PROVIDED HEREIN.
Barclays Bank PLC is registered in England No. 1026167. Registered Office: 1 Churchill Place, London E14 5HP. Copyright Barclays
Bank PLC, 2010 (all rights optimal). This document is confidential, and no part of it may be reproduced, distributed or transmitted without the prior written permission of Barclays.
Barclays Capital is the investment banking division of Barclays Bank PLC, which is authorised and regulated by the UK Financial Services Authority and a member of the London Stock Exchange.