Embed Size (px)
Citation preview

DONG WOOK KIM, MDSeoul, S. Korea
• Professor, Seoul ST. Mary Hospital, Seoul, S. Korea
• Dr. Kim the Head of Cancer Research Institute at the Catholi
c University of Korea, a chairman of Asia CML Study Allian
ce (ACSA) that is an Asian hematologist network and the pu
rpose is to improve the quality and standardization of CML t
herapy and research in Asian countries on the basis of unders
tanding the current situation. And also ACSA seeks collabor
ation in CML studies and sharing information for new medic
al discoveries in CML and ELN (European Leukemia Net) P
anel for CML recommendation 2013.

Imatinib vs. 2G TKI
in newly diagnosed CP-CML
Prof. Dong-Wook Kim MD, PhD
Seoul St. Mary’s Hospital
The Catholic University of Korea

• ENESTnd: MMR, Nil vs IM, approved
• DASISION: cCCyR, Das vs IM, approved
• BELA: cCCyR, Bos vs IM, fail to achieve primary endpoint
• EPIC: MMR, Pon vs IM, suspended due to serious VEs
• RE-RISE: MMR, Rad vs IM, ongoing in Asian countries
• BFORE: MMR, Bos vs IM, ongoing in Global
Clinical trials with IM vs 2 or 3 G TKI
in new CML patients

Treatment strategy recommendation,
chronic phase, firstline
Baseline (firstline treatment)
- Imatinib 400 mg once daily, or
- Nilotinib 300 mg twice daily, or
- Dasatinib 100 mg once daily
In case of intolerance, switch to another TKI
In case of failure, switch to another TKI
In case of warning, do not switch, until the warning is confirmed or
becomes a failure
Baccarani M., et al. Blood 2013, 122(6):872-884

Characteristics of registered patients (n=3,717)
- Type of 1st TKI -
by 1-DEC-2014 7th ACSA-ASH 2014 in San Francisco
Asia Collaboration of CML Research
IM3420 (92%)
Nil92 (3%)
Das120 (3%)
Bos20 (1%)
Rad54 (1%)
Pon11 (0%)
Asia CML Registry (ACR)
- 10 Asian countries
- 17 major hospitals

DASISION (CA180-056) Study Design
Primary end point: confirmed CCyR by 12 months
– 77% dasatinib vs. 66% imatinib (P=0.007)1
Database lock of 24-Mar-2014
5-year
final resultsRandomizeda
Imatinib 400 mg QD (n=260)
Dasatinib 100 mg QD (n=259)
Treatment-naïve
CML-CP patients
(N=519)
108 centers
26 countries
Enrollment:
September 2007–
December 2008
aStratified by EURO (Hasford) risk score.1. Kantarjian H et al. N Engl J Med 2010;362:2260–70.

ENESTnd 5-Year Update
Data cutoff: May 22, 2013
KR1401170300
ENESTnd Study Design
N = 846
217 centers
35 countries
Imatinib 400 mg QD (n = 283)
Nilotinib 300 mg BID (n = 282)
RANDOMIZE
Nilotinib 400 mg BID (n = 281)
Follow-up: 5 years; extended to 10 years
after protocol amendment
Primary end point: MMR at 12 months
Patients were stratified according to Sokal risk score at diagnosis
BID, twice daily; QD, once daily. Saglio G, et al. Blood. 2013:[abstract 92].

Patient Disposition at 5 Years
At 5 years (study end), 61% and 63% in dasatinib and imatinib are still on
initial therapy
Treated Patients, n (%)
Dasatinib 100 mg QD
(n=258)
Imatinib 400 mg QD
(n=258)
On initial therapy at study end 158 (61) 162 (63)
Discontinued
Progression or treatment failure 28 (11) 36 (14)
AE related to study treatmenta 42 (16) 17 (7)
AE unrelated to study treatmenta 12 (5) 4 (2)
Poor/nonadherence 1 (<1) 7 (3)
Other 17 (7)b 31 (12)c
aAEs defined by investigator.
bIncludes withdrawal of consent and patient request (4 each), insufficient molecular response (3), pregnancy (2), and lost to follow-up, loss of CCyR, increased BCR-ABL, and relocation to the US (1 each).
cIncludes patient request (10), no molecular response/loss of molecular response (4), withdrawal of consent and suboptimal response (3 each), lost to follow-up, insufficient cytogenetic response, and investigator request (2 each), and pregnancy, recurrence of blasts in bone marrow,no CMR, no MMR, and appearance of mutation (1 each).

ENESTnd 5-Year Update
Data cutoff: May 22, 2013
KR1401170300
Patient Disposition at 5 Years
Few patients have discontinued treatment since the 4-year data cutoff
• 3.5% (n = 10) on nilotinib 300 mg BID; 4.3% (n = 12) on nilotinib 400 mg BID; 6.0% (n = 17) on imatinib
– Of 17 imatinib discontinuations, 5 (vs 0 nilotinib discontinuations) were due to suboptimal response/treatment failure
Median time on core treatment comparable and median dose intensity close to intended dose for all
treatment armsa Patients are either on study drug or in post-treatment follow-up after discontinuation of study drug.b Patients with suboptimal response or treatment failure on nilotinib 300 mg BID or imatinib core treatment were eligible to
discontinue the core study and enter an extension study to receive nilotinib 400 mg BID.
Nilotinib
300 mg BID
(n = 282)
Nilotinib
400 mg BID
(n = 281)
Imatinib
400 mg QD
(n = 283)
Still on study, %a 85.5 87.9 83.4
Still on core treatment, % 62.4 65.1 51.2
Discontinued core treatment and entered extension study, %b 8.5 1.1 15.2
Still on extension treatment, % 5.3 0.7 8.8
Discontinued core treatment without entering extension study, % 29.1 33.8 33.6
Adverse events/laboratory abnormalities 11.0 18.1 12.7
Suboptimal response/treatment failure 3.2 3.6 6.4
Disease progression 0.7 1.4 3.5
Death 2.1 0.4 0.4
Other reason 12.1 10.3 10.6
Saglio G, et al. Blood. 2013:[abstract 92].

Cumulative MMR Rates Over Time
Months Since Randomization
% W
ith
MM
R
Dasatinib 100 mg QD
N
Imatinib 400 mg QD 260259
By 1 year
By 2 years
By 3 years
By 4 years
By 5 years
28%
46%
55%
60%64%
46%
64% 67%
73% 76%
0 6 12 18 24 30 36 42 48 54 60
100
90
80
70
60
50
40
30
20
10
0
p=0.0022
MMR rates have significantly increased in dasatinib arm
ENESTnd 5-Year Update
Data cutoff: May 22, 2013
KR1401170300
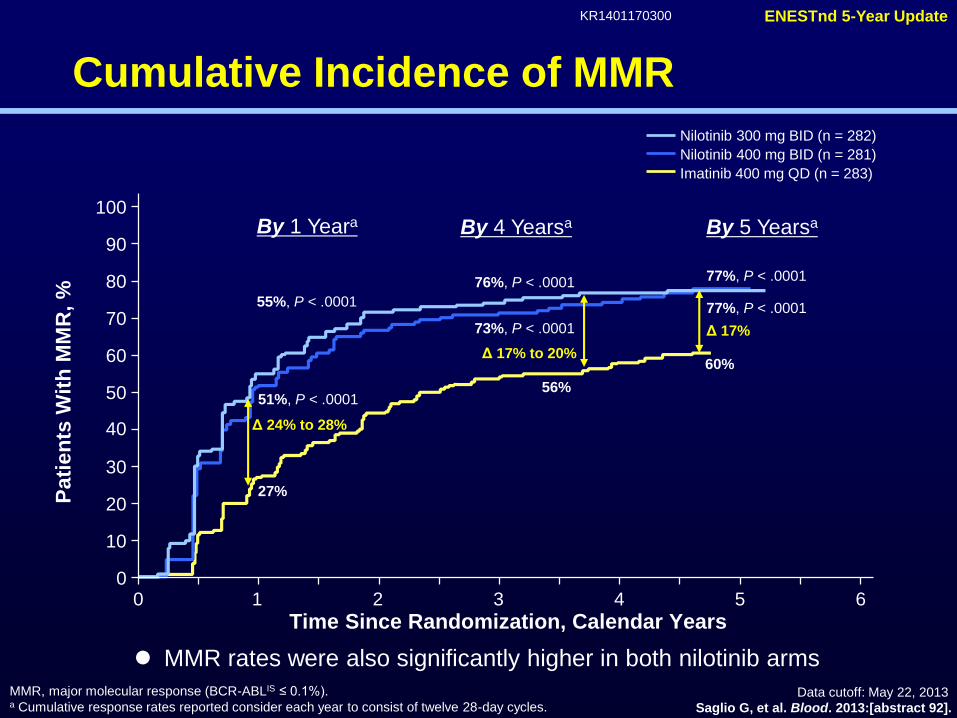
Cumulative Incidence of MMR
MMR, major molecular response (BCR-ABLIS ≤ 0.1%).a Cumulative response rates reported consider each year to consist of twelve 28-day cycles.
By 1 Yeara By 5 Yearsa
55%, P < .0001
51%, P < .0001
27%
Δ 24% to 28%
60%
77%, P < .0001
77%, P < .0001
Δ 17%
By 4 Yearsa
76%, P < .0001
73%, P < .0001
56%
Δ 17% to 20%
100
0 2 6
90
80
70
60
50
40
30
20
10
0
Pati
en
ts W
ith
MM
R,
%
Time Since Randomization, Calendar Years31
Nilotinib 300 mg BID (n = 282)
Nilotinib 400 mg BID (n = 281)
Imatinib 400 mg QD (n = 283)
4 5
Saglio G, et al. Blood. 2013:[abstract 92].
MMR rates were also significantly higher in both nilotinib arms

0 6 12 18 24 30 36 42 48 54 60
100
90
80
70
60
50
40
30
20
10
0
Cumulative MR4.5 Rates Over Time
By 1 year
By 2 years
By 3 years
By 4 years
By 5 years
3%
8%
13%
23%
33%
5%
19%
24%
34%
42%
p=0.0251
Months Since Randomization
% W
ith
MR
4.5
Dasatinib 100 mg QD
N
Imatinib 400 mg QD 260259
MR4.5, BCR-ABL (IS) ≤0.0032% (for subjects with B2a2 and B3A2 transcripts).
Cumulative rate of MR4.5 was also significantly higher in dasatinib arm

ENESTnd 5-Year Update
Data cutoff: May 22, 2013
KR1401170300
Cumulative Incidence of MR4.5
MR4.5, molecular response ≥ 4.5-logs (BCR-ABLIS ≤ 0.0032%).a Cumulative response rates reported consider each year to consist of twelve 28-day cycles.
By 5 Yearsa
11%, P < .0001
7%, P < .0001
1%
Δ 6% to 10%
31%
52%, P < .0001
54%, P < .0001
Δ 21% to 23%
By 4 Yearsa
40%, P < .0001
37%, P = .0002
23%
Δ 14% to 17%
100
0 2 6
90
80
70
60
50
40
30
20
10
0
Pati
en
ts W
ith
MR
4.5
, %
Time Since Randomization, Calendar Years
31
Nilotinib 300 mg BID (n = 282)
Nilotinib 400 mg BID (n = 281)
Imatinib 400 mg QD (n = 283)
4 5
By 1 Yeara
Saglio G, et al. Blood. 2013:[abstract 92].
By 5 yrs, more than half of nilotinib-treated patients had achieved MR4.5

Dasatinib 100 mg QD
(n=259)
Imatinib 400 mg QD
(n=260)
BCR-ABL at 3 Monthsa≤10%
n=198
>10%
n=37
≤10%
n=154
>10%
n=85
Transformation to AP/BPb, n (%) 6 (3) 5 (14) 5 (3) 13 (15)
0
5
10
15
20
Pati
en
ts,
n12
(4.6%)
19
(7.3%)
Dasatinib
n=259
Imatinib
n=260
On study During follow-up beyond discontinuation
Transformation to AP/BP CML by 5 Years
One imatinib patient and no dasatinib patients transformed between 4 and 5 yearsaOne dasatinib and one imatinib patient transformed but did not have 3-month molecular assessments.
bIncluding follow-up beyond discontinuation (intent to treat).
4.6% (12 pts) progressed to AP/BC in dasatinib arm comparing with 7.3% in IM arm
An achievement of EMR at 3 mos was able to decrease dis. progression by 5 yrs.

ENESTnd 5-Year Update
Data cutoff: May 22, 2013
KR1401170300
20
10
0
5
10
15
20
25
Progressions on Study
Pati
en
ts,
nProgression to AP/BC on Studya
(Including After Treatment Discontinuation)
a Includes progression to AP/BC (excluding clonal evolution) or deaths in patients with advanced CML occurring on study (on
core or extension treatment or during follow-up after treatment discontinuation).
P = .0588
P = .0047
6
Nilotinib 300 mg BID (n = 282) Nilotinib 400 mg BID (n = 281)
The progression rates were lower in both nilotinib arms and two new progressions on study in year 5
(1 in the nilotinib 300 mg BID arm and 1 in the imatinib arm)
Both patients had BCR-ABL > 10% at 3 months
New events
in year 5
7.1% 3.5% 2.1%
Imatinib 400 mg QD (n = 283)
Saglio G, et al. Blood. 2013:[abstract 92].

Progression-Free Survival
and Overall Survival
However, no difference of survivals demonstrated between dasatinib and imatinib arm
Causes of death were cardiovascular disease (2 dasatinib, 1 imatinib); disease
progression (9 dasatinib, 17 imatinib); infection (11 dasatinib, 1 imatinib); other
malignancy, septic shock and cardiac failure, multi-organ failure, and whole body swelling
(1 each dasatinib); stem cell transplantation complications and unknown (2 each
imatinib); severe chest pain, clinical deterioration and decrease in performance status,
and fatal bleeding (1 each imatinib)
Dasatinib100 mg QD
(n=259)
Imatinib400 mg QD
(n=260)
Hazard ratio
(95% CI)
Total number of deaths, n 26 26 –
Estimated 5-year OS, % (95% CI) 91 (87–94) 90 (85–93) 1.01 (0.58–1.73)
Estimated 5-year PFS, % (95% CI) 85 (80–89) 86 (80–89) 1.06 (0.68–1.66)
On-study treatment and in follow-up after discontinuation of randomized treatment.
CI, confidence interval; OS, overall survival; PFS, progression-free survival.

ENESTnd 5-Year Update
Data cutoff: May 22, 2013
KR1401170300
PFS and OS on Study
(Including After Treatment Discontinuation)a
a Includes events occurring on core or extension treatment or during follow-up after treatment discontinuation.b Patients for whom the principle cause of death was either “study indication” or “unknown” or not reported but occurred
subsequent to a documented progression to AP/BC.
Imatinib
400 mg QD
(n = 283)
Nilotinib
300 mg BID
(n = 282)
Nilotinib
400 mg BID
(n = 281)
Estimated 5-year PFS, % 91.1 92.0 95.3
Progressions and deaths, n 23 22 11
Hazard ratio (95% CI) — 0.92 (0.51-1.65) 0.46 (0.23-0.95)
P value .77 .03
Estimated 5-year OS, % 91.6 93.6 96.0
Total deaths, n 21 18 10
Deaths in patients with
advanced CML, nb 15 6 4
Hazard ratio (95% CI) — 0.84 (0.45-1.58) 0.46 (0.22-0.98)
P value — .58 .04
At 5 yrs of FU, PFS and OS were higher in patients treated with nilotinib 400mg BID than with IM
There were 6 newly reported deaths in year 5
Imatinib (n = 2): both due to study indication
Nilotinib 300 mg BID (n = 3): study indication, rectal cancer, and pneumonia
Nilotinib 400 mg BID (n = 1): sepsis
Saglio G, et al. Blood. 2013:[abstract 92].

Treated patients, n (%)
Dasatinib 100 mg QD (n=258) Imatinib 400 mg QD (n=258)
Any grade Grade 3/4 Grade 5 Any grade Grade 3/4 Grade 5
Any ischemic event 12 (5) 7 (3) 2 (1) 6 (2) 3 (1) 1 (<1)
Cardiovasculara 10 (4) 5 (2) 2 (1) 4 (2) 2 (1) 1 (<1)
TIA 2 (1) 2 (1) 0 0 0 0
PAD 0 0 0 2 (1) 1 (<1) 0
Total24
(9.3%)14 (5.4) 4 (1.6)
12
(4.7%) 6 (2.3) 2 (<1)
Arterial Ischemic Events Regardless
of Relationship to Study Therapy
All grades of VEs developed twice higher in dasatinib arm and 7 of 10 cardiovascular
ischemic events occurred within 1 year of dasatinib initiation
However, most dasatinib patients restarted therapy without a recurrent event
aIncludes myocardial infarction, angina pectoris, coronary artery disease, and acute coronary syndrome.

ENESTnd 5-Year Update
Data cutoff: May 22, 2013
KR1401170300
Selected Cardiovascular Events by 5 Years
(All Cause*, All Grades)
All grades of VEs were 3-6 times higher in both nilotinib arms
Approximately 85% of patients with a cardiovascular event had at least 1 risk factor
and were not optimally managed for hyperglycemia and hypercholesterolemia
suggesting importance of treatment of risk factors
*All cause indicates all events, not only those deemed study drug-related by the investigator.
IHD, ischemic heart disease; ICVE, ischemic cerebrovascular events; PAD, peripheral arterial disease.
Patients With an Event, n
Nilotinib
300 mg BID
n = 279
Nilotinib
400 mg BID
n = 277
Imatinib
400 mg QD
n = 280
Total, n
Y1-4, n
Y5, n
Total, n
Y1-4, n
Y5, n
Total, n
Y1-4, n
Y5, n
IHD 11 11 0 21 14 7 5 3 2
ICVE 4 3 1 8 5 3 1 1 0
PAD 4 4 0 6 5 1 0 0 0
Total19
(6.8%) 18 1 35(12.6%) 24 11 6
(2.1%) 4 2
Saglio G, et al. Blood. 2013:[abstract 92].

Dasatinib n (%)
TotalGrade 1–2Grade 3–4
73 (28)66 (26)
7 (3)
Discontinuation due to pleural effusion 15 (6)
Dose interruptions due to pleural effusionMedian duration of dose interruption, d (range)
45 (62)14 (2–63)
Dose reductions due to pleural effusionMedian duration of dose reduction, d (range)
30 (41)50 (7–751)
Median time to first grade 1–2 pleural effusion, wk (range) 114 (4–299)
Characteristics and Management
of Pleural Effusion
At 5 years, 28% (73 pts) of dasatinib treated patients had PE and 46 out of 73 patients
had recurrent pleural effusions
Although 62% of patients with pleural effusion had dose interruption (median, 14 d),
this did not impair the ability of patients to obtain a response
• Of patients with pleural effusion, 96% had cCCyR, 82% had MMR,
and 50% had MR4.5
cCCyR, confirmed complete cytogenetic response.

EMR (< 10%) of Bcr-Abl1) at 3 months
91%
67%
84%
64%
0
10
20
30
40
50
60
70
80
90
100
Nilotinib Imatinib Dasatinib Imatinib
ENESTnd DASISION
P<0.0001
At 3 months, both 2 G TKIs achieved higher EMR rates than imatinib arm

Landmark Analysis: Improved Rates of
BCR-ABLIS ≤ 10% at 3 Months Regardless of Sokal Risk Score
79
70
44
93 9286
0
10
20
30
40
50
60
70
80
90
100
Low Risk Intermediate Risk High Risk
Pati
en
ts,
%
Imatinib 400 mg QD Nilotinib 300 mg BID
n = 102 97 92 91 70 70
Saglio G, et al. Blood. 2013:[abstract 92].
In high risk Sokal group, an achievement of EMR was higher in nilotinib
300mg BID than imatinib arm suggesting upfront 2G TKIs therapy may be
more beneficial in these patients

PFS (AP/BC or Death) on Study
by BCR-ABL Levels at 3 Months
Nilotinib 300 mg BID Imatinib 400 mg QD
BCR-ABL Level
≤ 1%
> 1% to ≤ 10%
> 10%
Censored
Observations
Pts Evt Cen
145 7 138
89 4 85
24 6 18
P = .9814
P = .0010
PFS by 5 Yearsa
94.6%95.3%
78.3%
100
90
80
70
60
50
40
30
20
10
00 1 2 3 4 5 6
Pa
tie
nts
Witho
ut P
rog
ressio
n, %
Time Since Randomization, Calendar Years
100
90
80
70
60
50
40
30
20
10
00 1 2 3 4 5 6
Pa
tie
nts
Witho
ut P
rog
ressio
n, %
Time Since Randomization, Calendar Years
PFS by 5 Yearsa
P = .2338P < .0001
98.5%95.3%
80.1%
BCR-ABL Level
≤ 1%
> 1% to ≤ 10%
> 10%
Censored
Observations
Pts Evt Cen
43 2 41
133 2 131
88 16 72
EMR Failure EMR Failure
Cen, censored; EMR, early molecular response; Evt, events; Pts, patients.a PFS rates reported consider each year to consist of twelve 28-day cycles.
Patients with EMR failure (BCR-ABL > 10% at 3 months) have
significantly worse 5-year PFS
Rates of EMR failure are lower on nilotinib 300 mg BID vs imatinib
Saglio G, et al. Blood. 2013:[abstract 92].

OS by BCR-ABL Levels at 3 Months
Nilotinib 300 mg BID Imatinib 400 mg QD
P = .4871
P = .0007
OS by 5 Yearsa
BCR-ABL Level
≤ 1%
> 1% to ≤ 10%
> 10%
Censored
Observations
Pts Evt Cen
145 6 139
89 2 87
24 5 19
100
90
80
70
60
50
40
30
20
10
0
0 1 2 3 4 5 6
Pa
tie
nts
Aliv
e,
%
Time Since Randomization, Calendar Years
100
90
80
70
60
50
40
30
20
10
0
0 1 2 3 4 5 6
Time Since Randomization, Calendar Years
OS by 5 Yearsa
P < .0001
P = .087399.2%95.3%
BCR-ABL Level
≤ 1%
> 1% to ≤ 10%
> 10%
Censored
Observations
Pts Evt Cen
43 2 41
133 1 132
88 16 72
Cen, censored; EMR, early molecular response; Evt, events; Pts, patients.a OS rates reported consider each year to consist of twelve 28-day cycles.
Patients with EMR failure (BCR-ABL > 10% at 3 months) have
significantly worse 5-year OS
Rates of EMR failure are lower on nilotinib 300 mg BID vs imatinib
79.5%
95.7%97.6%
81.9%
Pa
tie
nts
Aliv
e,
%
EMR Failure:
9% of pts
EMR Failure:
33% of pts
Saglio G, et al. Blood. 2013:[abstract 92].

Proportion of Patients With MR4.5
by BCR-ABL Levels at 3 Months
58%
28%
4%
P = .0001
P = .0135
70%
52%
8%
P = .0046
P = .0001
MR4.5 by 4 Yearsa
MR4.5 by 5 YearsaBCR-ABL Level
≤ 1%
> 1% to ≤ 10%
> 10%
Pts
144
89
24
100
90
80
70
60
50
40
30
20
10
0
0 1 2 3 4 5 6
Pa
tie
nts
With M
R4
.5,
%
Time Since Randomization, Calendar Years
MR4.5 by 4 Yearsa
MR4.5 by 5 Yearsa
65%
24%
5%
P < .0001
P =
.0001
67%
34%
15%
P = .0001
P = .0016
BCR-ABL Level
≤ 1%
> 1% to ≤ 10%
> 10%
Pts
43
133
88
100
90
80
70
60
50
40
30
20
10
0
0 1 2 3 4 5 6P
atie
nts
With M
R4
.5,
%
Time Since Randomization, Calendar Years
a Cumulative response rates reported consider each year to consist of twelve 28-day cycles.
BCR-ABLIS ≤ 1%:
16% of ptsBCR-ABLIS ≤ 1%:
56% of pts
Nilotinib 300 mg BID Imatinib 400 mg QD
Patients with BCR-ABL ≤ 1% at 3 months have significantly higher rates of MR4.5 by 5 years
More patients achieve BCR-ABL ≤ 1% at 3 months on nilotinib 300 mg BID vs imatinib
Saglio G, et al. Blood. 2013:[abstract 92].

Parameters deciding EMR
• Recently, patient and treatment characteristics associated with EMR
in ENESTnd study (Blood 2014:123:1353)
– High Sokal risk score was associated with a high rate of EMR
failure on imatinib, but not on nilotinib
– In contrast, reduced dose intensity and dose interruptions were
strongly associated with EMR failure in nilotinib-treated, but not
imatinib-treated, patients
• Our study with 286 new CP-CML patients treated with imtinib found
various clinical parameters on achieving EMR
Hughes TM et al., Blood 2014:123:1353
Lee SE et al., Leukemia Research 2015 (in press; http://dx.doi.org/10.1016/j.leukres.2015.01.011)

0
10
20
30
40
50
60
70
80
1 2
0
20
40
60
80
100
120
140
160
180
1 2 Q1
(≤ 958.2 ng/mL)
Q2, Q3, Q4
(> 958.2 ng/mL)
No
of p
atie
nts
with
ava
ilable
data
No
of p
atie
nts
with
ava
ilable
data
Blast ≤ 1% Blast > 1%
Percentage of blast at diagnosis Plasma IM level on day 29
> 10% at 3 months
≤ 10% at 3 months
BCR-ABL1
135/160
(84.4%)
25/160
(15.6%)
22/78
(28.2%)
56/78
(71.8%) 16/24
(66.7%)
8/24
(33.3%)
8/71
(11.3%)
63/71
(88.7%)
P=0.052 P=0.015
Predictive factors for an achievement of 3mo EMR
Blast count at diagnosis and IM trough level on day 29 were significantly
associated with an achievement of 3-month EMR.
Lee SE et al., Leukemia Research 2015 (in press; http://dx.doi.org/10.1016/j.leukres.2015.01.011)

7/35
(20.0%)
Predictive factors for an achievement of 6mo EMR
0
20
40
60
80
100
120
140
160
180
1 20
20
40
60
80
100
120
140
160
180
200
220
240
1 2
0
20
40
60
80
100
120
140
1 2
No
of p
atie
nts
with
ava
ilable
data
Low Intermediate/High> 350 mg/day≤ 350 mg/day
Log reduction from
individual baseline to 3 mos
≥ 1-log reduction< 1-log reduction
Mean daily dose by 6 mosSokal risk
> 1% at 6 months
≤ 1% at 6 months
BCR-ABL1
74/101
(73.3%)
27/101
(26.7%)
72/155
(46.5%)
83/155
(53.5%)
13/34
(38.2%)
21/34
(61.8%)
81/229
(35.4%)
148/229
(64.6%)
37/130
(28.5%)
93/130
(71.5%)28/35
(80.0%)
Lee SE et al., Leukemia Research 2015 (in press; http://dx.doi.org/10.1016/j.leukres.2015.01.011)
P=0.013 P=0.076 P<0.001
Early decline of BCR-ABL1 transcript, low Sokal risk, and mean daily dose (≥350
mg/day) by 6 months were associated with an achievement of 6-month EMR

Summary and Conclusion
At 5 years of follow-up, rates of PFS and OS were higher in patients
treated with nilotinib 400mg BID than with imatinib
2G TKIs demonstrated higher rates of early and deeper molecular
response, including MR4.5, and a reduced risk of progression
More cardiovascular events were reported in 2G TKIs, especially nilotinib
than in the imatinib
An achievement of EMR was higher in frontline 2 G TKIs suggesting better
long-term responses and survival than with imatinib
Some biological factors were associated with achievement of EMR and can be
modifiable
Continuing the optimal dose intensity is important for better outcomes
These long-term data confirm 2 G TKIs as a standard-of-care in patients
with newly diagnosed CML-CP

Acknowledgement
KCIA members
CCRI colleagues