Embed Size (px)
Citation preview

Manoharan & Isaiarasu 2016 823
Volume: 2; Issue: 8; August -2016; pp 823-847. ISSN: 2454-5422
Observation of the seasonal changes in the physical, chemical and nutrient parameters of
three temple ponds at Thirupparankundram near Madurai, Tamilnadu, India.
D.Manoharan1 and L. Isaiarasu2
1TVS Lakshmi School, Madurai, India.2PG and Research Department of Zoology, Ayya Nadar Janaki Ammal College (Autonomous), Sivakasi, India.1Corresponding Author E-mail: [email protected].
Abstract
Monthly changes in 15 surface water physical, chemical and nutrient parameters of three
freshwater temple ponds at Thirupparankundram, Madurai. Tamil Nadu, India were recorded for
a period of three years from September 2009 to August 2012. The values recorded for most of
these parameters were within the permissible limits and were found to be influenced mainly by
the seasonal changes and altitudinal variations.
Keywords: Physical, chemical and nutrient parameters, Temple pond, Thirupparankundram.
Introduction
Fresh water has become a scarce commodity due to over exploitation and pollution of water.
Increasing population and its necessities have lead to the deterioration of surface and sub surface
water. Limnology plays an important role in decision making processes for problems like dam
construction, pollution control and aquaculture practices (Muley and Gaikwad, 1999).
Freshwaters of the world are collectively experiencing markedly accelerating rates of qualitative
and quantitative degradation (Carpenter et al., 2011). Stagnant water bodies have more complex
and fragile ecosystems in comparison to running water bodies as they lack self cleaning ability
and hence, readily accumulate greater quantities of pollutants. Increased anthropogenic activities
in and around the water bodies damage the aquatic systems and ultimately properties of water.
Human populations continue to abuse water resources at a large scale. So efforts to conserve

Volume: 2; Issue: 8; August-2016. ISSN: 2454-5422
Manoharan & Isaiarasu 2016 824
these resources are a present and urgent need. Several limnological studies on freshwater temple
ponds have been made in India in recent times by Thirugnanamoorthy and Selvaraju (2009),
Jemi and Balasingh (2011), Tidame and Shinde (2012), (Banita et al., 2013) and (Padate et al.,
2014). The present study, in these lines makes an attempt to find out the seasonal changes in the
physical, chemical and nutrient parameters in the surface water of the three tropical perennial
freshwater temple ponds in Thirupparankundram with the focus on the effect of size, altitude and
human interference on their water quality.
Study Area
Thirupparankundram, is a town located about six kilometers south-east of Madurai. It is a
historical holy place known for the famous temple of Lord Subramanya situated at the base of
the hillock and has a heavy inflow of pilgrims regularly for worship from all over the state and
tourists from other states of India and abroad. There are three ponds associated with this temple,
one on the top of the hillock named Kasi theertham, the second one within the temple, Lakshmi
theertham and the third one outside the temple, Saravana poigai. Geographically, these ponds are
associated with a hillock located at 9°54’N; 78°7’E from the base at 131MSL measuring a total
height of 1056 feet. All the three ponds receive rain water which drains out from hillock and this
is the only source of water in these ponds. The ponds are used for bathing, washing and
recreational activities by pilgrims. Interestingly, these three ponds which are at the same
geographical location and fed by rain water during the monsoon showers differ in their size,
altitude and human impact. This provides a unique opportunity to study the seasonal changes in
the physical, chemical and nutrient parameters in the surface water of the three ponds.
Materials and Methods
Sampling of water was done for every month and analyzed on the day of sampling. Samples
were collected between 6 and 8 a.m. on all days with the view of ensuring uniformity.
Observations were made for the temperature of air and surface water using centigrade
thermometer, humidity using hygrometer and pH using pH paper on the spot itself. The physical
parameters are the non-living components in an ecosystem concerned with the medium and
climate. The following are the physical parameters observed in the present study. The colour of
the pond water was noted down by simple visual observation both in field and in the filtered
Volume: 2; Issue: 8; August-2016. ISSN: 2454-5422
Manoharan & Isaiarasu 2016 825
water sample. The special odour of the water sample, if any, was noted down by the smell at the
time of observation in the vicinity of the pond. The temperature of the water and air were
recorded with the help of standard centigrade thermometer at °C at the time of visits. pH of the
water sample was recorded with the help of standard pH papers on the spot. Later it was also
measured in the laboratory by using pH meter (ELICO; L1120, India) following the method of
APHA (1995). The total suspended material in the water samples was estimated gravimetrically
in mg/l. and considered as an indirect measure of the turbidity. This was done by filtering 100ml
of well mixed water sample through pre-weighed (w1) filter paper and weighing (w2) the same
in an electronic balance at 0.01 mg accuracy after drying it in hot air oven adjusted at 103°C
overnight for evaporation. This is then considered to represent the Total suspended solids (TSS)
in mg/l= (w2-w1) and may be taken as an indirect measure of turbidity of the water (Kodarkar,
1992). The total suspended material in the water samples was estimated gravimetrically in mg/l.
and considered as an indirect measure of the turbidity (Kodarkar, 1992). The following chemical
parameters were observed in the present study following standard procedures. The dissolved
oxygen content of the water sample was estimated by the modified Winkler’s method of
Strickland and Parsons (1972) in APHA (1995). The free CO2 content of samples was
determined following (Mackereth et al., 1978). The carbonate and bicarbonate alkalinity of
water sample was found out by neutralizing the sample with Std. H2SO4 following (Adoni et al.,
1985). The salinity of the sample was estimated by titrating a known volume of the sample
against the standard Harvey’s Silver nitrate (0.014N) using 0.5ml of Potassium chromate as the
indicator (Adoni et al.,1985). The total Hardness of water sample was estimated titrimetrically
using standard EDTA solution as the titrant and Erichrome Black – T as indicator. The calcium
hardness in water sample was also found out titrimetrically using the standards EDTA (0.01N)
solution. The magnesium hardness in the water sample was calculated by subtracting calcium
hardness from total hardness. The nutrient parameters are those chemicals that serve as nutrients
to the living components in the ecosystem. The following nutrient parameters were considered in
this study. The chlorides in water samples were estimated titrimetrically following (Mackereth et
al., 1978). Phosphates as the orthophosphate content in water was calculated
spectrophotometrically following the Ammonium molybdate method as described in (Adoni et
al., 1985). The sulphate content in water sample was calculated by turbidimetric method as

Volume: 2; Issue: 8; August-2016. ISSN: 2454-5422
Manoharan & Isaiarasu 2016 826
described in (Adoni et al., 1985). Nitrate content was estimated following the Phenol di-
sulphonic acid method (Wilcox and Hatcher, 1950).
Result and Discussion
The observations made on the seasonal changes in the physical, chemical and nutrient parameters
in the water samples collected from the three ponds for the present study revealed significant
variations both with reference to the seasons and human impact. The month wise analysis of the
rainfall data for this region enabled the recognition of three distinct seasons for the interpretation
of the observations in the present study as Monsoon (September-December), Post-monsoon
(January-April) and Pre-monsoon (May-August) seasons respectively. In any aquatic ecosystem,
the abiotic physico-chemical environment has profound influence on its biotic components. It
controls biodiversity, biomass and distribution of biotic communities. The observations made on
the seasonal changes in the physical, chemical and nutrient parameters in the water samples
collected from the three ponds for the present study revealed significant variations both with
reference to the seasons and human impact. In the present observation, the pond water was
apparently colourless during monsoon and post-monsoon seasons but was slightly greenish
during the pre-monsoon season. With regard to odour, the water in all the three ponds was not
having any obnoxious smell throughout the study period. (Rameshbabu and Selvanayagam,
2013) observed the appearance of water samples as clean and clear throughout the study period
except at two locations where they appeared turbid and green during post-monsoon and summer.
The physical parameters revealed that the pond waters were apparently colourless and slightly
greenish but not having any obnoxious smell throughout the study period. The air temperature
ranged from 25.6˚C to 38.8˚C in Kasi theertham, from 21.4˚C to 39.5˚C in Lakshmi theertham
and from 21˚C to 40.3˚C in Saravana poigai. The surface water temperature ranged from 21.6˚C
to 33˚C in Kasi theertham, from 19.3˚C to 37.7˚C in Lakshmi theertham and from 16.5˚C to
37.7˚C in Saravana poigai (Fig.1-9). The high temperature during day time is due to high solar
radiation. The low temperature in winter months is because of the cool conditions prevailing
throughout the day when compared to summer season (Ayyanna and Narayudu, 2013). Sharma
et al., 2013 reported that in the temple pond in Birpur the water temperature varied in accordance
with the air temperature and it ranged from 11.63˚C (December) to 33.0˚C (May). The pH
ranged from 6.7 to 8.7 in Kasi theertham, from 6.9 and 9.1 in Lakshmi theertham and from 7.1 to

Volume: 2; Issue: 8; August-2016. ISSN: 2454-5422
Manoharan & Isaiarasu 2016 827
9.5 in Saravana poigai (Fig.10-12). The pH of lake water that ranged between 7.2 and 7.8 was
alkaline and hence favourable for the growth of the planktons and fishes (Lendhe and Yeragi,
2004). The Total Filterable Residue (TFR) present in the surface water of the ponds ranged from
243mg/l to 811mg/l in Kasi theertham, from 462mg/l to 682mg/l in Lakshmi theertham and from
230mg/l to 521mg/l in Saravana poigai (Fig.13-15). (Jemi and Balasingh, 2011) observed the
total dissolved solids to be more during summer and less during monsoon. Similarly the total
filterable residue was reported to range from 316mg/l to 646mg/l with the highest value of TFR
(646mg/l) recorded during summer in the study carried out by (Rameshbabu and Selvanayagam,
2013).
The chemical parameters showed that the alkalinity observed in the surface waters of the ponds
during the study period ranged from 5mg/l to 32mg/l in Kasi theertham, from 14mg/l to 87mg/l
in Lakshmi theertham and from 23mg/l to 188mg/l in Saravana poigai (Fig.16-18). Jemi and
Balasingh, 2011 observed the total alkalinity to range from 85.25 to 139.75mg/l
(Padmanapapuram temple pond) and 68.75 to 114.50mg/l (Parvathipuram temple pond) during
summer and monsoon season respectively. (Amshadevi et al., 2013) noticed the total alkalinity
to range from 92.5 to 255ppm in a pond. The water bodies having total alkalinity above 50mg/l
can be considered productive and this present finding showed that all the three ponds as
productive during most part of the year (Moyle, 1946). The free carbon di-oxide ranged from
1.6mg/l to 27.6mg/l in Kasi theertham, from 6.9mg/l to 61.6mg/l in Lakshmi theertham and from
7.7mg/l to 73.7mg/l in Saravana poigai (Fig.19-21). Jemi and Balasingh, 2011 noticed ponds to
exhibit maximum carbon di-oxide as 6.33mg/l (Padmanapapuram temple pond) during summer
and low concentration of 3.95mg/l (Parvathipuram temple pond) during monsoon season.
Carbonates showed their absence in November and January and this was due to the presence of
free carbon dioxide during this period. An increase in the values of bicarbonates was recorded in
summer and monsoon seasons (Sharma et al., 2013). Aquatic vegetation and phytoplankton
require carbon di-oxide for photosynthetic activity. The dissolved oxygen ranged from 2.12mg/l
to 4.9mg/l in Kasi theertham, from 3.12mg/l to 6.82mg/l in Lakshmi theertham and from
0.41mg/l to 6.84mg/l in Saravana poigai (Fig.22-24). Joshi and Bhalla, 2012 observed the
reduction of dissolved oxygen (DO) as a result of sewage outfall in to the river. Rameshbabu and
Selvanayagam, 2013 reported DO values to range from to 10.2mg/l. The highest value of

Volume: 2; Issue: 8; August-2016. ISSN: 2454-5422
Manoharan & Isaiarasu 2016 828
DO (10.2mg/l) was recorded during premonsoon and lowest value (7.8mg/l) was recorded during
post-monsoon. The salinity ranged from 1mg/l to 19mg/l in Kasi theertham, from 14mg/l to
39mg/l Lakshmi theertham and from 19mg/l to 51mg/l in Saravana poigai (Fig.25-27). Ayyanna
and Narayudu, 2013 reported that in winter months due to low temperature the salinity is less
(0.31mg/l) Land during spring season. When the temperature is high, the salinity is more
(0.42mg/l). This is due to evaporation of water during hot seasons. The total hardness ranged
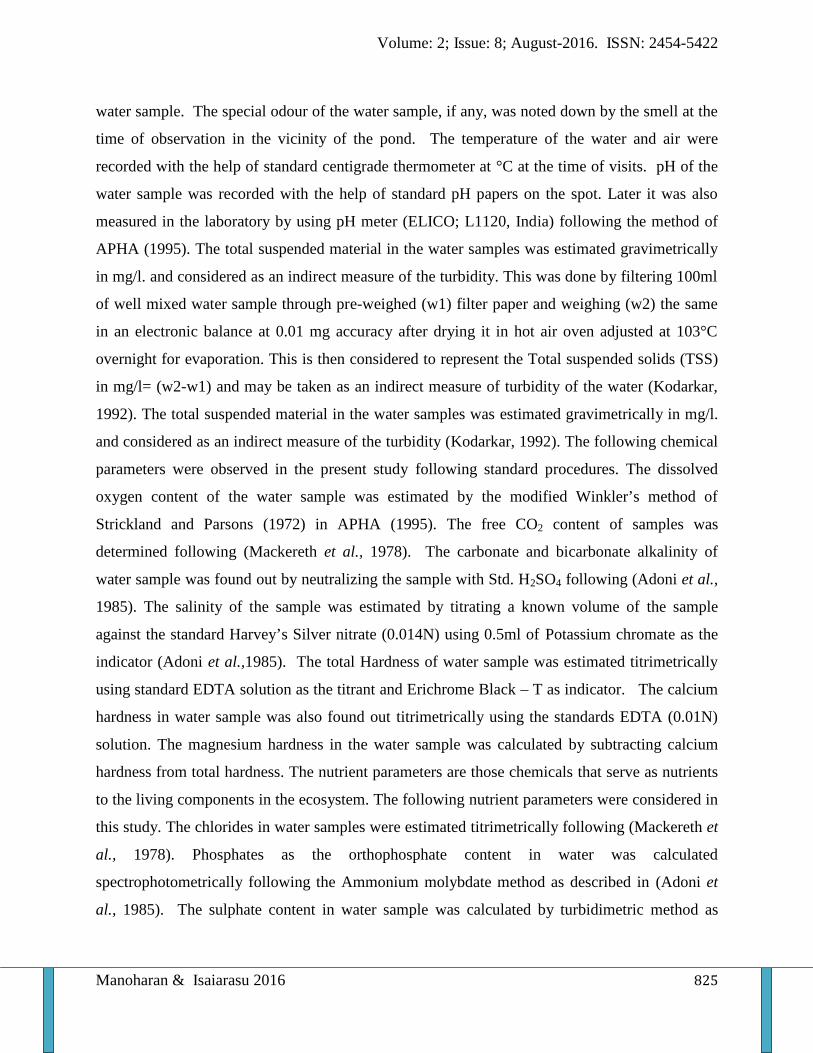
from 20mg/l to 98mg/l in Kasi theertham, from 110mg/l to 198mg/l in Lakshmi theertham and
from 77mg/ to 247mg/l in Saravana poigai (Fig.28-30). Uchchariya and Saksena, 2012 reported
the average total hardness of water in their study at Tighra Reservoir to be as 50.10±1.92mg l-1.
The calcium hardness ranged from 4mg/l to 25mg/l in Kasi theertham, from 37mg/l to 107mg/l
in Lakshmi theertham and from 83mg/l to 157mg/l in Saravana poigai (Fig.31-33). Sharma et al.,
2013 had observed the calcium content in the temple pond in Birpur to show a maximum of
40.90mg/l and a minimum of 16.43mg/l in the months of November and February respectively.
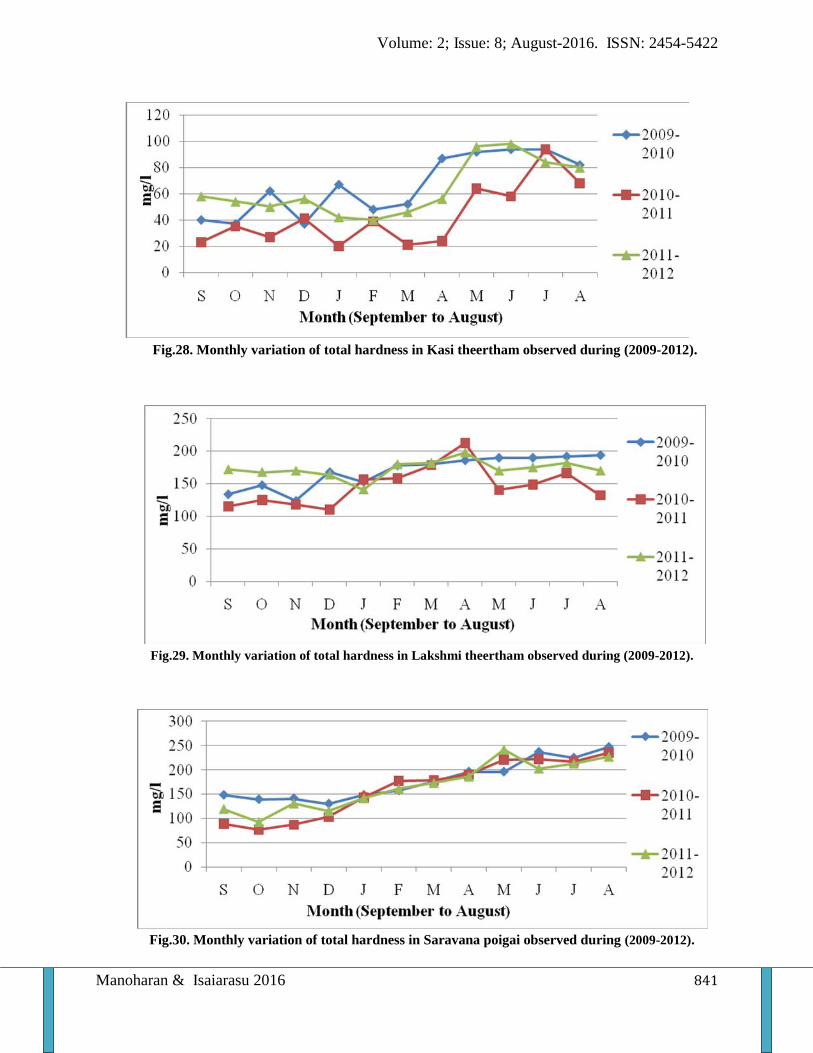
The magnesium hardness ranged from 0.41mg/l to 17mg/l in Kasi theertham, from 12mg/l to
34mg/l in Lakshmi theertham and from 3mg/l to 18mg/l in Saravana poigai (Fig.34-36).
Rameshbabu and Selvanayagam, 2013 observed the highest value of magnesium as 25mg/l and
lowest value as 12mg/l in monsoon season at Kolavoi Lake.
The nutrient parameters showed that the chloride level ranged from 1mg/l to 9mg/l in Kasi
theertham, from 5mg/l to 27mg/l in Lakshmi theertham and from 5mg/l to 31mg/l in Saravana
poigai (Fig.37-39). Rameshbabu and Selvanayagam, 2013 observed the chloride ions to range
from 21mg/l to 162mg/l at Kolavoi Lake. The phosphate level ranged from 0.1mg/l to 0.9mg/l in
Kasi theertham, from 0.3mg/l to 3.1mg/l in Lakshmi theertham and from 2.8mg/l to 9.7mg/l in
Saravana poigai (Fig.40-42). Narayana et al., 2008 recorded the phosphate to range between
0.004mg/l to 0.014 mg/l in Anjanapuram reservoir near Shikaripur, Shimoga District, Karnataka.
The sulphate content ranged from 1mg/l to 5mg/l in Kasi theertham, from 1mg/l to 5.9mg/l in
Lakshmi theertham and from 2.1mg/l to 7.9mg/l in Saravana poigai (Fig.43-45). Harney et al.,
2013 observed the values of sulphate recorded as1.0 mg/l to 3.80 mg/l in Kanhala pond, 0.84
mg/l to 2.10 mg/l in Pindavani pond and 1.00 mg/l to 1.82 mg/l in Malhara pond. The nitrate
ranged from 10mg/l to 30mg/l in Kasi theertham, from 19mg/l to 39mg/l in Lakshmi theertham
and from 31mg/l to 79mg/l in Saravana poigai (Fig.46-48). The values of nitrate range between

Volume: 2; Issue: 8; August-2016. ISSN: 2454-5422
Manoharan & Isaiarasu 2016 829
0.11mg/l to 0.59mg/l in Kanhala pond, 0.08mg/l to 0.41mg/l in Pindavani pond and 0.05mg/l to
0.80mg/l in Malhara pond (Harney et al., 2013). The interrelationships noticed among various
parameters seemed to indicate the cultural eutrophication as the major reason for the changes in
characteristics of the physical, chemical and nutrient characteristics of water in these ponds.
Besides the influence of seasonal changes also seem to accelerate this eutrophication that get
reflected in the zooplankton counts. At the same time, the altitudinal differences in the location
of these ponds influence the changes in physical, chemical and nutrient parameters of these
ponds by curtailing the human interferences.
Acknowledgement
The laboratory facilities provided at the Department of Zoology of Ayya Nadar Janaki Ammal
College (Autonomous), Sivakasi and TVS Lakshmi School, Madurai are gratefully
acknowledged.
References
Adoni AD; Joshi G; Gosh, K, Chowasia. S. K, Vaishya, A. K, Yadav, M and Verma, H, G 1985
Work book on Limnology. Prathibha Publishers, Sagar, India
Amshadevi V; Baskaran S and Sureshkumar R 2013 Physico-chemical parameters and
zooplankton diversity of a temple pond in Virudhunagar, Tamilnadu. Inter. J. Sci., Envir. &
Tech. 2(2): 250-257
APHA 1995 Standard Method for the Examination of water, sewage and Industrial water,
American Public Health Association. New York. pp 1193
Ayyanna Y and Narayudu Y 2013 Hydrological study of Fresh Water Pond at Kakinada Rural
Village, P.Venkatapuram, E.G.Dist, Andhrapradesh. IOSR J. Appli. Chem. (IOSR-JAC) 3(6): 1-5
Banita DM; Tapati D and Susmita G 2013 Limnological Studies of Temple Ponds in Cachar
District, Assam, North East India. Int. Res. J. Envi. Sci. 2(10): 49-57

Volume: 2; Issue: 8; August-2016. ISSN: 2454-5422
Manoharan & Isaiarasu 2016 830
Carpenter SR; Stanley EH and Vander Zanden MJ 2011 State of the world’s freshwater
ecosystems: physical, chemical and biological changes. In: Annual Review of Environment and
Resources. pp. 75-99
Harney NV; AA Dhamani and RJ Andrew 2013 Seasonal variations in the Physico-chemical
parameters of Pindavani Pond of Central India. Science Weekly, 1(6): 1-8
Jemi RJ and Balasingh GSR 2011 Studies on physico chemical Characteristics of fresh water
Temple ponds in Kanyakumari District (South Tamilnadu). Int. J. Geology, Earth & Envi. Sci.
1(1): 59-62
Joshi AS and R Bhalla 2012 Assessment of water quality of Girna River at Chanakapur area of
Kalwan (M.S). PDFARDIJ [PRINT] 5(12): 79-85
Kodarkar MS 1992 Methodology for water analysis IAAB publication No.2, Hyderabad: 1-26
Lendhe RS and Yeragi SG 2004 Physico-chemical parameters and zooplankton diversity of
Phirange-Kharbav Lake, district Thane, Maharastra. J. Aqua. Biol. 19(1): 49-52
Mackereth FJ; Haron J and Talling JF 1978 Water analysis. Freshwater Biol. Assoc. Sci. Publ.
No. 36
Moyle JB 1946 Some indices of lake productivity trends. Ameri. Fish. Soc. 76: 322-334
Muley DV and P T Gaikwad 1999 Limnological studies of Shiroli reservoir - A case study.
Freshwater ecosystem of India. Ed. K. Vijaykumar, Daya Publi. House, Delhi. pp 109-132
Munawar M 1970 Limnological studies on freshwater ponds of Hyderabad, India. II. The
biocenose distribution of unicellular and colonial phytoplankton in polluted and unpolluted
environments. Hydrobiol. 36(1): 105-128
Narayana J and Puttaiah ET and Basavaraja D 2008 Water quality characteristics of
Anjanapuram reservoir near Shikaripur, District Shimoga, Karnataka. J. Aqua. Biol. 23(1): 59-63

Volume: 2; Issue: 8; August-2016. ISSN: 2454-5422
Manoharan & Isaiarasu 2016 831
Padate GS; Ekhande AP and Patil JV 2014 Seasonal variations in density and species richness of
Microcrustacea of high altitude Lotus Lake, Toranmal Maharashtra. Weekly Sci. Res. J. 1(30): 1-
9
Rameshbabu K and Selvanayagam M 2013 Seasonal variations in physico-chemical parameters
and heavy metals concentration in water and sediment of Kolavoi Lake, Chengalpet, India. Int. J.
Chem. Tech. Res. 5(1): 532-549
Sharma KK; Devi A; Sharma A and Neha A 2013 Zooplankton Diversity and Physico-Chemical
Conditions of a Temple Pond in Birpur (J & K, India). Int. Res. J. Environment Sci. 2(5): 25-30
Strickland JP and Parsons TR 1972 A practical book of sea water analysis. Ottawa. Bull. Fish
Res. Cananda. pp 167
Thirugnanamoorthy K and Selvaraju M 2009 Phytoplankton diversity in relation to Physico-
chemical parameters of Gnanaprakasam Temple Pond of Chidambaram in Tamilnadu, India,
Recent Res. in Sci. & Tech. 27: 449-451
Tidame SK and Shinde SS 2012 Report on correlation of zooplankton with physico- chemical
factors from freshwater temple pond. J. Experi. Sci. 3(7): 13-16
Uchchariya DK and Saksena DN 2012 Study of Nutrients and Trophic Status of Tighra
Reservoir, Gwalior (Madhya Pradesh), India. J. Nat. Sci. Res. 2(8): 97-110
Wilcox and Hatcher 1950 Phenol-disulphonic method. In: Methodology for water analysis.
M.S.Kodarkar IAAB publication No.2. pp19
IJCSR Specialities
$ Impact Factor – GIF – 0.676 & SIF – 0.54
$ Indexed over 39 databases
$ Monthly Issue
http://www.drbgrpublications.in/ijcsr.php

Volume: 2; Issue: 8; August-2016. ISSN: 2454-5422
Manoharan & Isaiarasu 2016 832
Fig.1. Monthly variation of air and surface water temperature in Kasi theertham (2009-10).
Fig.2. Monthly variation of air and surface water temperature in Kasi theertham (2010-11).
Fig.3. Monthly variation of air and surface water temperature in Kasi theertham (2011-12).

Volume: 2; Issue: 8; August-2016. ISSN: 2454-5422
Manoharan & Isaiarasu 2016 833
Fig.4. Monthly variation of air and surface water temperature in Lakshmi theertham (2009-10).
Fig.5.Monthly variation of air and surface water temperature in Lakshmi theertham (2010-11).
Fig.6. Monthly variation of air and surface water temperature in Lakshmi theertham (2011-12).

Volume: 2; Issue: 8; August-2016. ISSN: 2454-5422
Manoharan & Isaiarasu 2016 834
Fig.7. Monthly variation of air and water temperature in Saravana poigai (2009-10).
Fig.8. Monthly variation of air and water temperature in Saravana poigai (2010-11).
Fig.9. Monthly variation of air and water temperature in Saravana poigai (2011-12).

Volume: 2; Issue: 8; August-2016. ISSN: 2454-5422
Manoharan & Isaiarasu 2016 835
Fig.10. Monthly variation of pH in Kasi theertham observed during (2009-2012).
Fig.11. Monthly variation of pH in Lakshmi theertham observed during (2009-2012).
Fig.12. Monthly variation of pH in Saravana poigai observed during (2009-2012).

Volume: 2; Issue: 8; August-2016. ISSN: 2454-5422
Manoharan & Isaiarasu 2016 836
Fig.13. Monthly variation of TFR in Kasi theertham observed during (2009-2012).
Fig.14.Monthly variation of TFR in Lakshmi theertham observed during (2009-2012).
Fig.15. Monthly variation of TFR in Saravana poigai observed during (2009-2012).

Volume: 2; Issue: 8; August-2016. ISSN: 2454-5422
Manoharan & Isaiarasu 2016 837
Fig.16. Monthly variation of alkalinity in Kasi theertham observed during (2009-2012).
Fig.17. Monthly variation of alkalinity in Lakshmi theertham observed during (2009-2012).
Fig.18. Monthly variation of alkalinity in Saravana poigai observed during (2009-2012).

Volume: 2; Issue: 8; August-2016. ISSN: 2454-5422
Manoharan & Isaiarasu 2016 838
Fig.19.Monthly variation of free CO2 in Kasi theertham observed during (2009-2012).
Fig.20. Monthly variation of free CO2 in Lakshmi theertham observed during (2009-2012).
Fig.21. Monthly variation of free CO2 in Saravana poigai observed during (2009-2012).

Volume: 2; Issue: 8; August-2016. ISSN: 2454-5422
Manoharan & Isaiarasu 2016 839
Fig.22. Monthly variation of dissolved O2 in Kasi theertham observed during (2009-2012).
Fig.23. Monthly variation of dissolved O2 in Lakshmi theertham observed during (2009-2012).
Fig.24. Monthly variation of dissolved O2 in Saravana poigai observed during (2009-2012).

Volume: 2; Issue: 8; August-2016. ISSN: 2454-5422
Manoharan & Isaiarasu 2016 840
Fig.25. Monthly variation of salinity in Kasi theertham observed during (2009-2012).
Fig.26. Monthly variation of salinity in Lakshmi theertham observed during (2009-2012).
Fig.27. Monthly variation of salinity in Saravana poigai observed during (2009-2012).
Volume: 2; Issue: 8; August-2016. ISSN: 2454-5422
Manoharan & Isaiarasu 2016 841
Fig.28. Monthly variation of total hardness in Kasi theertham observed during (2009-2012).
Fig.29. Monthly variation of total hardness in Lakshmi theertham observed during (2009-2012).
Fig.30. Monthly variation of total hardness in Saravana poigai observed during (2009-2012).

Volume: 2; Issue: 8; August-2016. ISSN: 2454-5422
Manoharan & Isaiarasu 2016 842
Fig.31. Monthly variation of calcium in Kasi theertham observed during (2009-2012).
Fig.32. Monthly variation of calcium in Lakshmi theertham observed during (2009-2012).
Fig.33. Monthly variation of calcium in Saravana poigai observed during (2009-2012).
Volume: 2; Issue: 8; August-2016. ISSN: 2454-5422
Manoharan & Isaiarasu 2016 843
Fig.34. Monthly variation of magnesium in Kasi theertham observed during (2009-2012).
Fig.35. Monthly variation of magnesium in Saravana poigai observed during (2009-2012).
Fig.36.Monthly variation of magnesium in Lakshmi theertham observed during (2009-2012).

Volume: 2; Issue: 8; August-2016. ISSN: 2454-5422
Manoharan & Isaiarasu 2016 844
Fig.37. Monthly variation of chloride in Kasi theertham observed during (2009-2012).
Fig.38. Monthly variation of chloride in Lakshmi theertham observed during (2009-2012).
Fig.39. Monthly variation of chloride in Saravana poigai observed during (2009-2012).

Volume: 2; Issue: 8; August-2016. ISSN: 2454-5422
Manoharan & Isaiarasu 2016 845
Fig.40. Monthly variation of phosphate in Kasi theertham observed during (2009-2012).
Fig.41. Monthly variation of phosphate in Lakshmi theertham observed during (2009-2012).
Fig.42. Monthly variation of phosphate in Saravana poigai observed during (2009-2012).

Volume: 2; Issue: 8; August-2016. ISSN: 2454-5422
Manoharan & Isaiarasu 2016 846
Fig.43. Monthly variation of sulphate in Kasi theertham observed during (2009-2012).
Fig.44. Monthly variation of sulphate in Lakshmi theertham observed during (2009-2012).
Fig.45. Monthly variation of sulphate in Saravana poigai observed during (2009-2012).

Volume: 2; Issue: 8; August-2016. ISSN: 2454-5422
Manoharan & Isaiarasu 2016 847
Fig.46. Monthly variation of nitrate in Kasi theertham observed during (2009-2012).
Fig.47. Monthly variation of nitrate in Lakshmi theertham observed during (2009-2012).
Fig.48. Monthly variation of nitrate in Saravana poigai observed during (2009-2012).


![Ocala Evening Star. (Ocala, Florida) 1901-01-25 [p ].ufdcimages.uflib.ufl.edu/UF/00/07/59/08/02695/00086.pdfreformatory Unequalled Mouopo1y Dyspepsia BALTIMORE lifegiving generations](https://img.dokumen.tips/doc/110x75/5abacb337f8b9a567c8be5c2/ocala-evening-star-ocala-florida-1901-01-25-p-unequalled-mouopo1y-dyspepsia.jpg)