Embed Size (px)
Citation preview
How Legacy Nutrients Affect Farm
Conservation Measures
Andrew SharpleyCrop, Soil,& Environmental
Sciences
Water to Worth 2015Advancing
Sustainability in Animal Agriculture
Seattle, WA
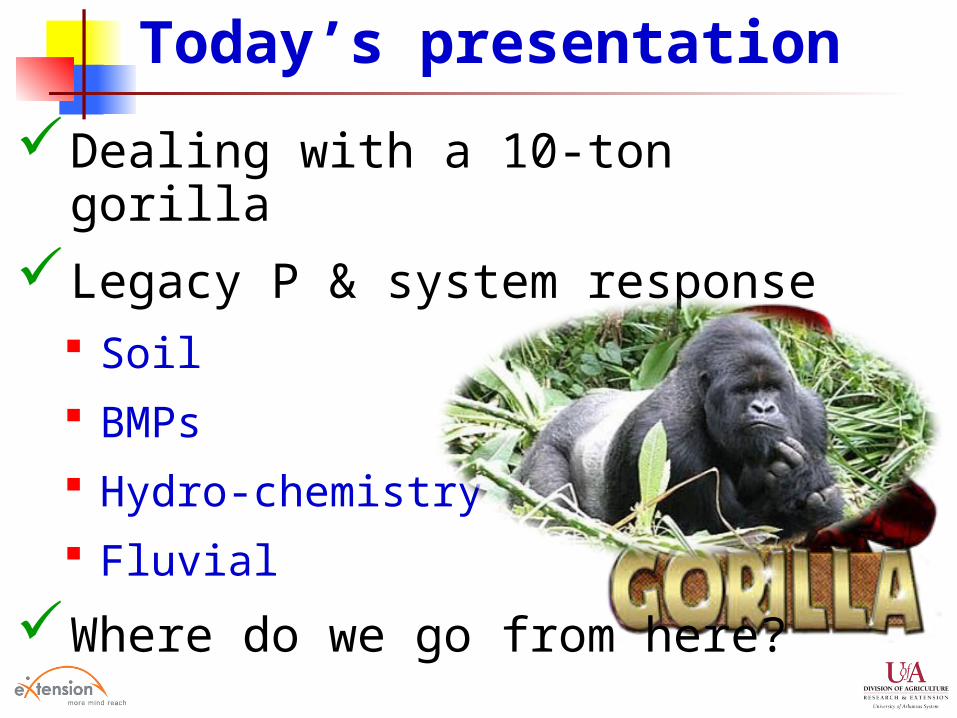
Today’s presentation
Dealing with a 10-ton gorilla
Legacy P & system response Soil
BMPs
Hydro-chemistry
Fluvial
Where do we go from here?
Soil
Hydro-chem
BMPs
System
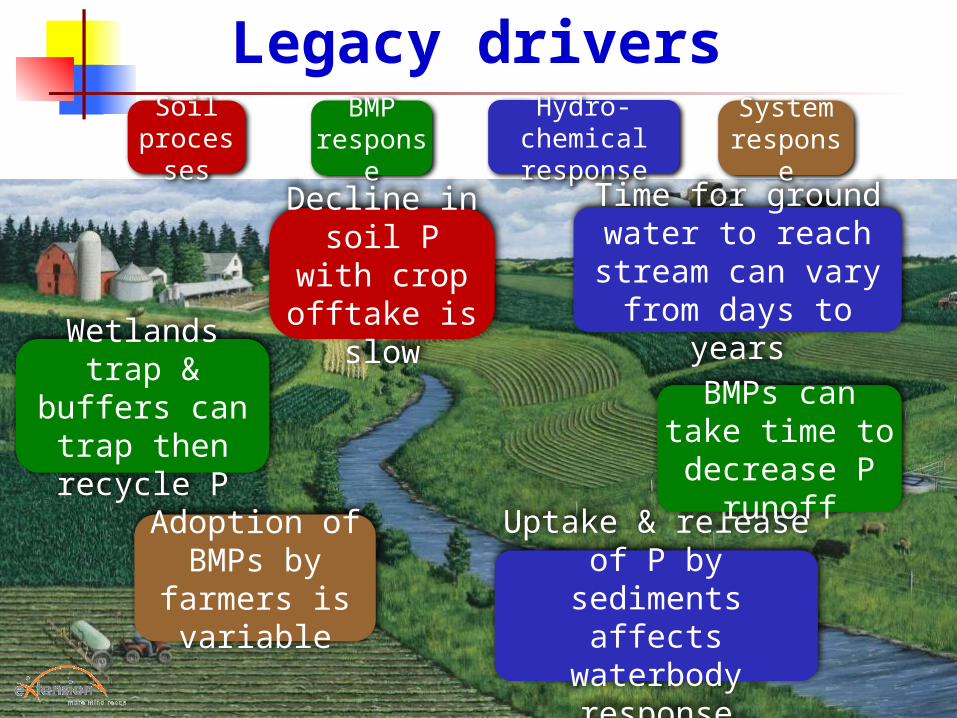
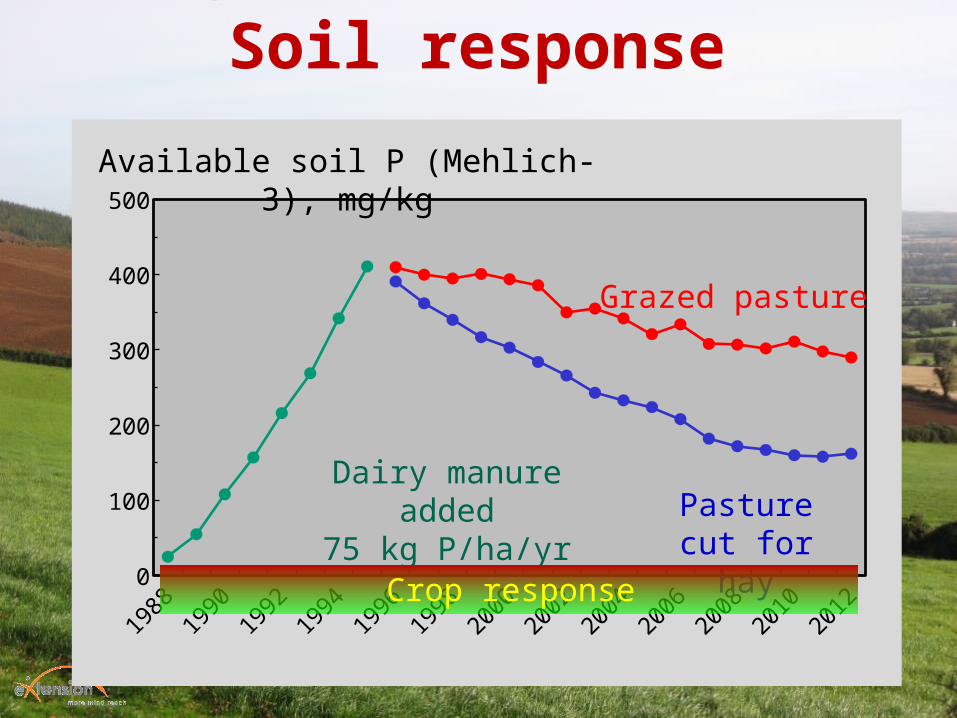
Uptake & release of P by sediments affects waterbody response
Decline in soil P with crop
offtake is slow
Adoption of BMPs by farmers
is variable
BMPs can take time to decrease
P runoff
Soil processes
Hydro-chemical response
System response
BMP response
Wetlands trap & buffers can trap then recycle P
Legacy drivers
Time for ground water to reach stream can
vary from days to years
1988
1990
1992
1994
1996
1998
2000
2002
2004
2006
2008
2010
2012
0
100
200
300
400
500
Available soil P (Mehlich-3), mg/kg
Grazed pasture
Dairy manure added
75 kg P/ha/yrPasture cut
for hay
Crop response
Soil response
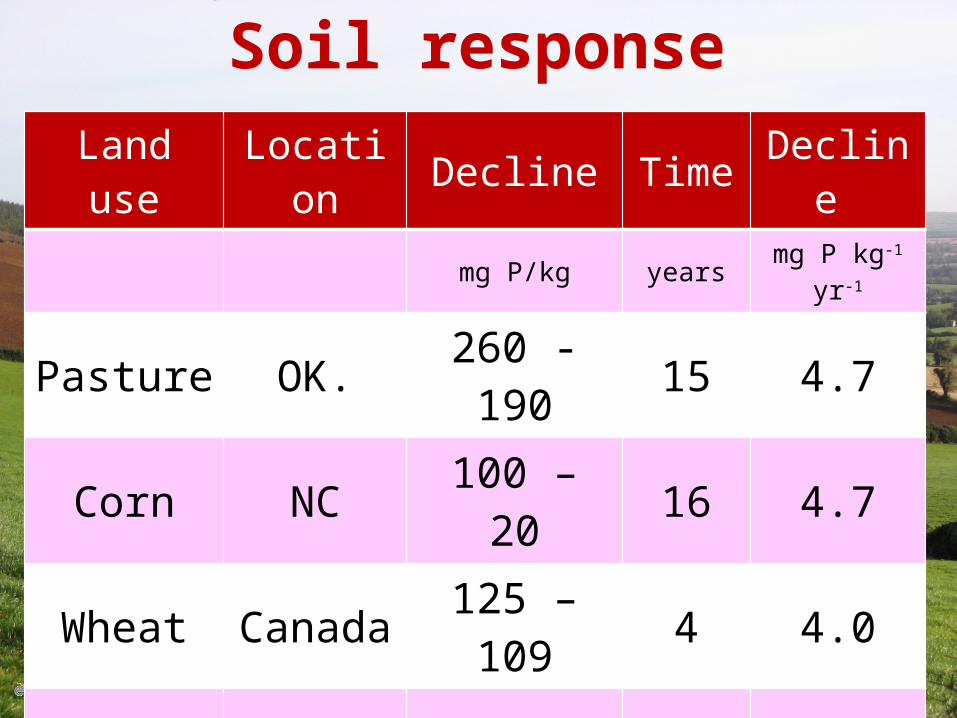
Land use
Location
Decline Time Decline
mg P/kg yearsmg P kg-1
yr-1
Pasture OK.260 - 190
15 4.7
Corn NC 100 – 20 16 4.7
Wheat Canada125 – 109
4 4.0
Soybean
IA 95 - 10 27 3.2
Soil response
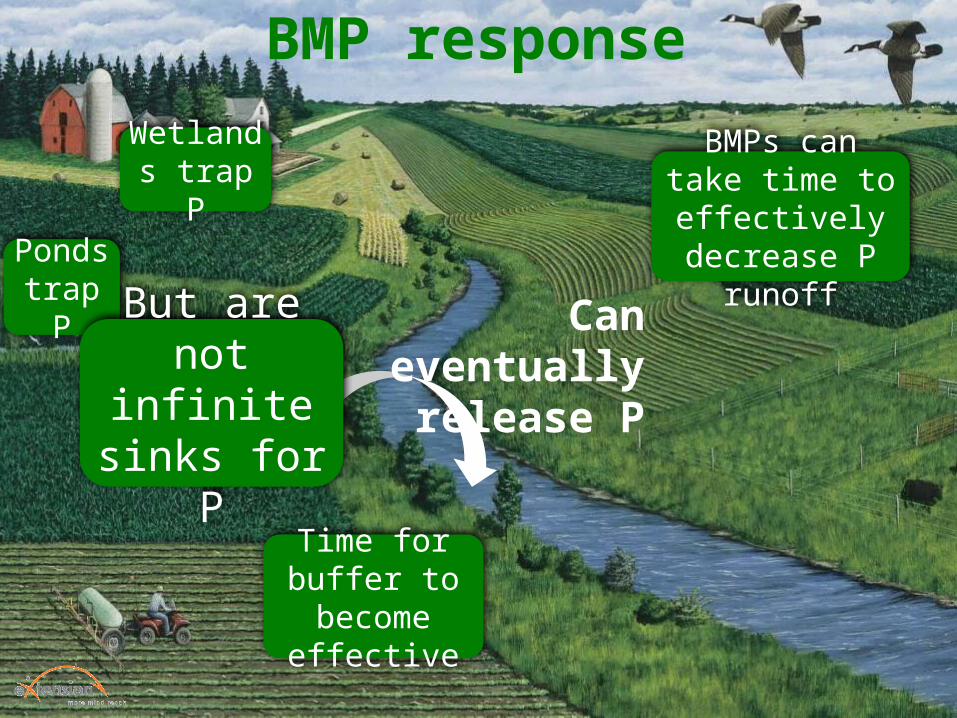
BMPs can take time to effectively decrease P runoffPonds
trap P
BMP response
Time for buffer to become effective
Wetlands trap P
But are not infinite sinks
for P
Can eventually
release P
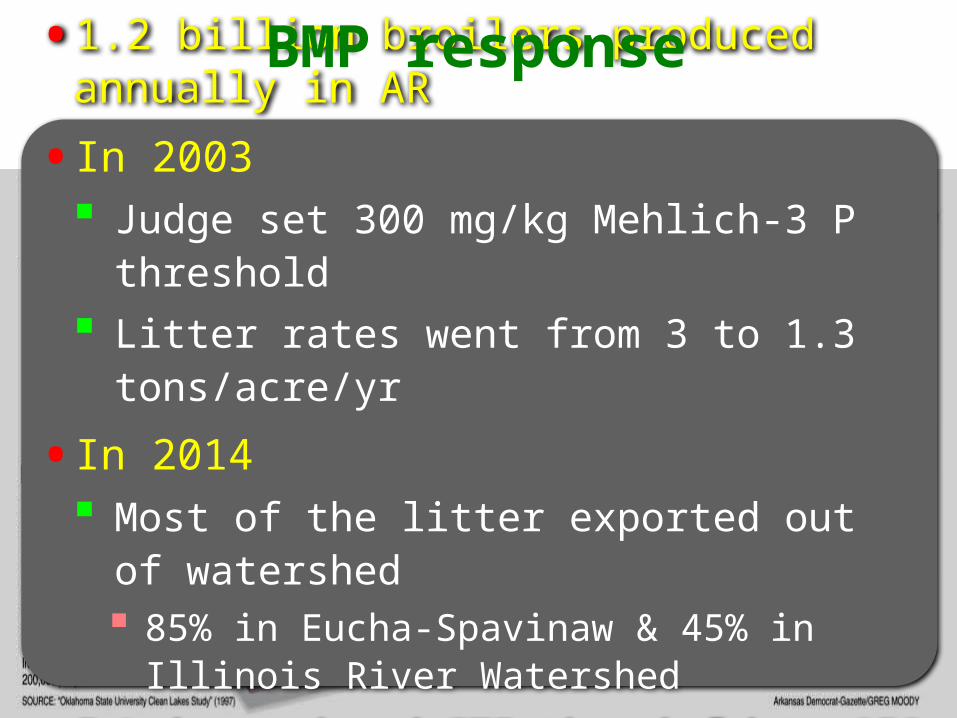
• 1.2 billion broilers produced annually in AR
• In 2003 Judge set 300 mg/kg Mehlich-3 P
threshold Litter rates went from 3 to 1.3
tons/acre/yr
• In 2014 Most of the litter exported out of
watershed 85% in Eucha-Spavinaw & 45% in Illinois
River Watershed
Judge reduced STP threshold to 150 mg/kg
BMP response
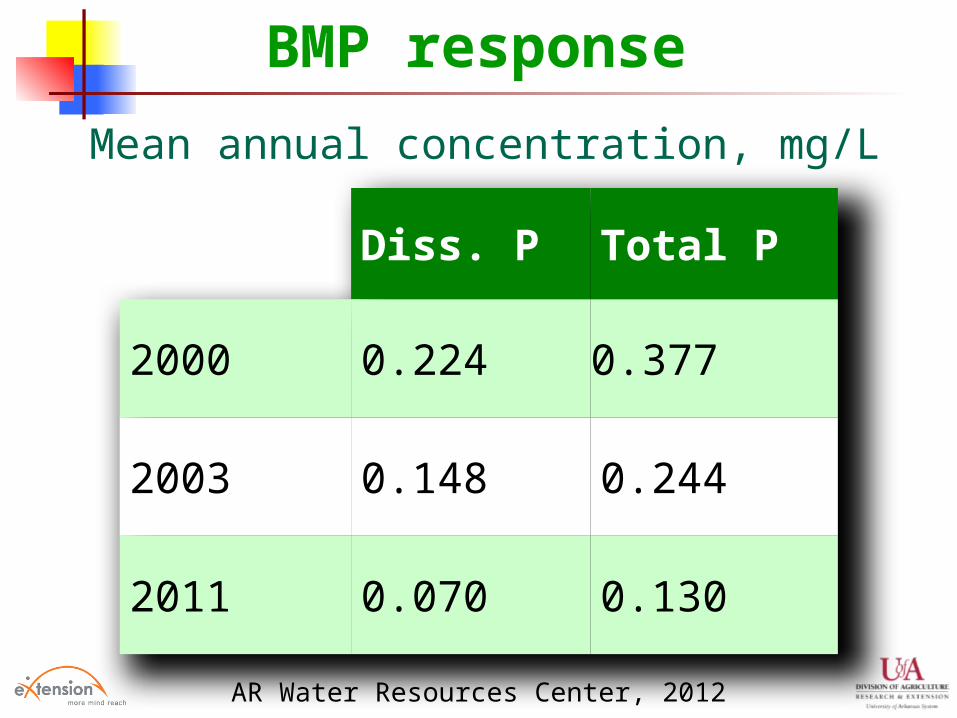
AR Water Resources Center, 2012
Diss. P Total P
2000 0.224 0.377
2003 0.148 0.244
2011 0.070 0.130
Mean annual concentration, mg/L
BMP response
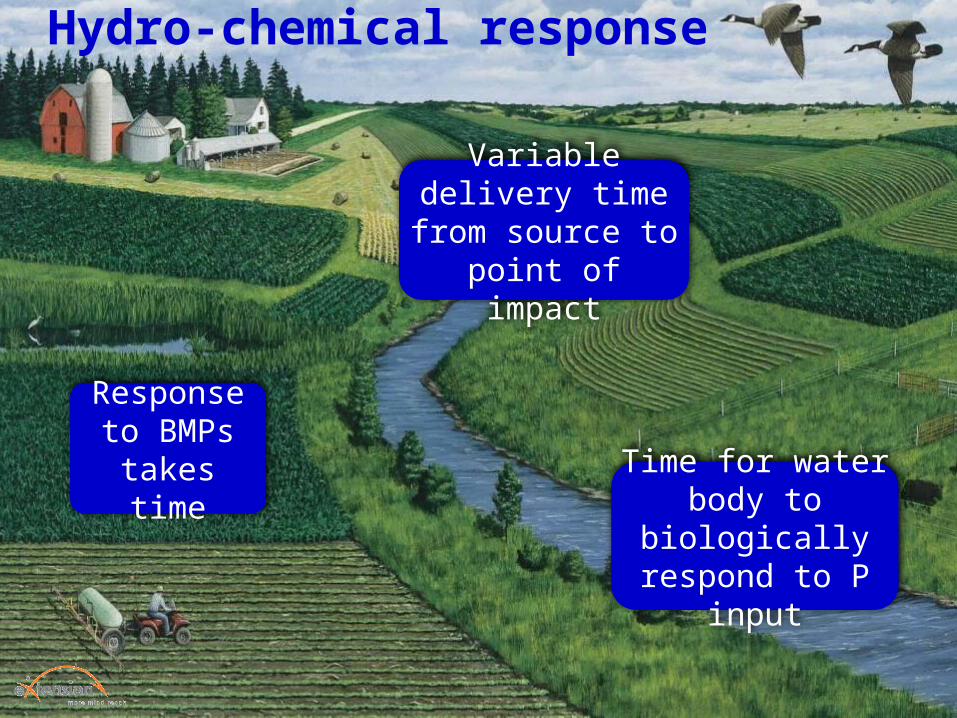
Time for water body to biologically
respond to P input
Response to BMPs takes
time
Variable delivery time from source to
point of impact
Hydro-chemical response
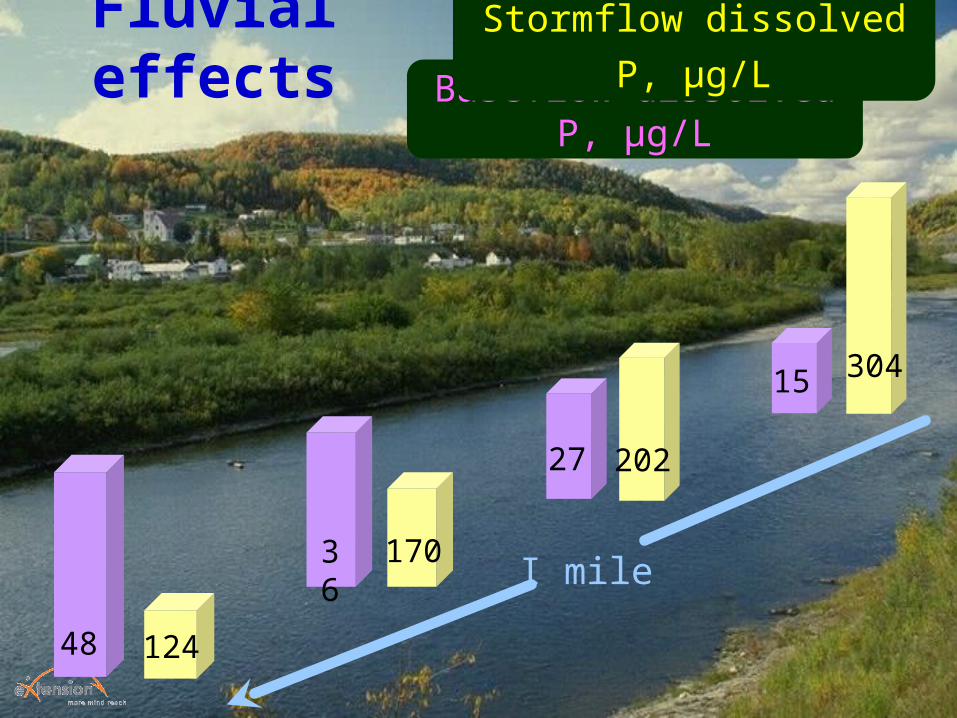
36
48
15
Baseflow dissolved P, µg/L
27
Stormflow dissolved P,
µg/L
170
124
304
202
I mile
Fluvial effects
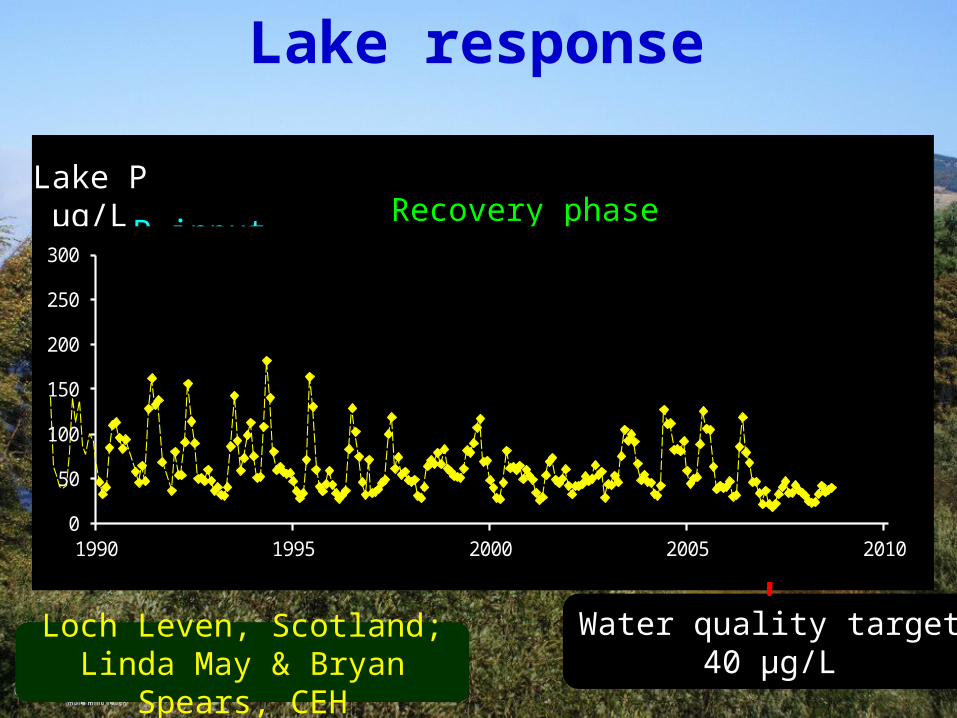
0
50
100
150
200
250
300
1990 1995 2000 2005 2010
Lake Pµg/L Recovery phase
Internal recycling of ‘legacy’ P (10-15 y)
Water quality target met
P inputreduced 60%
Water quality target
40 µg/L
Lake response
Loch Leven, Scotland;Linda May & Bryan Spears,
CEH
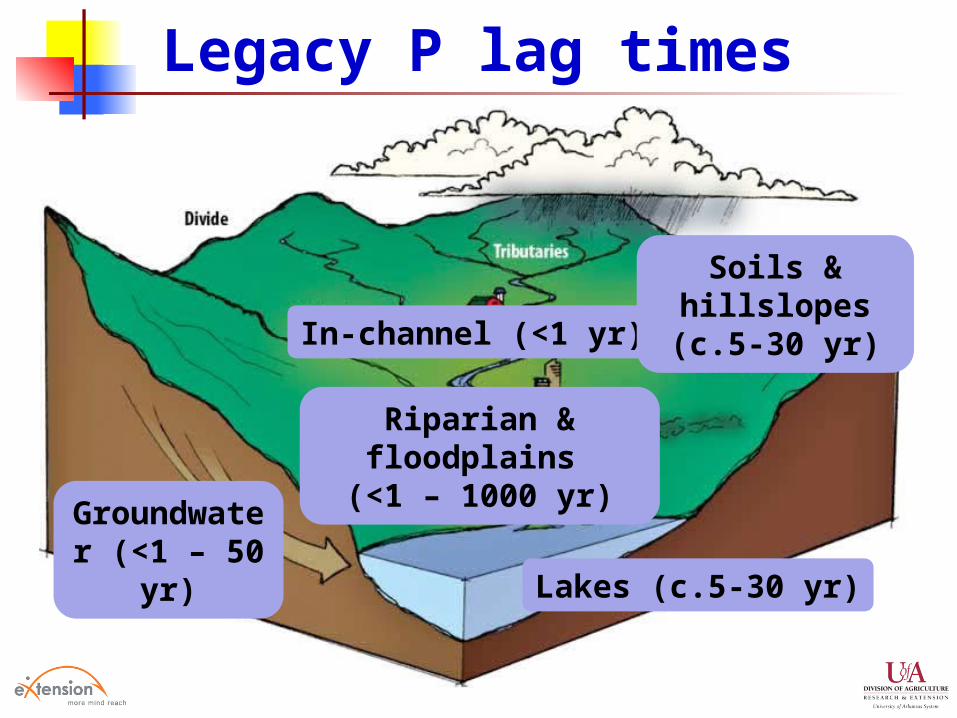
Lakes (c.5-30 yr)
Groundwater (<1 –
50 yr)
In-channel (<1 yr)
Riparian & floodplains
(<1 – 1000 yr)
Soils & hillslopes (c.5-30 yr)
Legacy P lag times
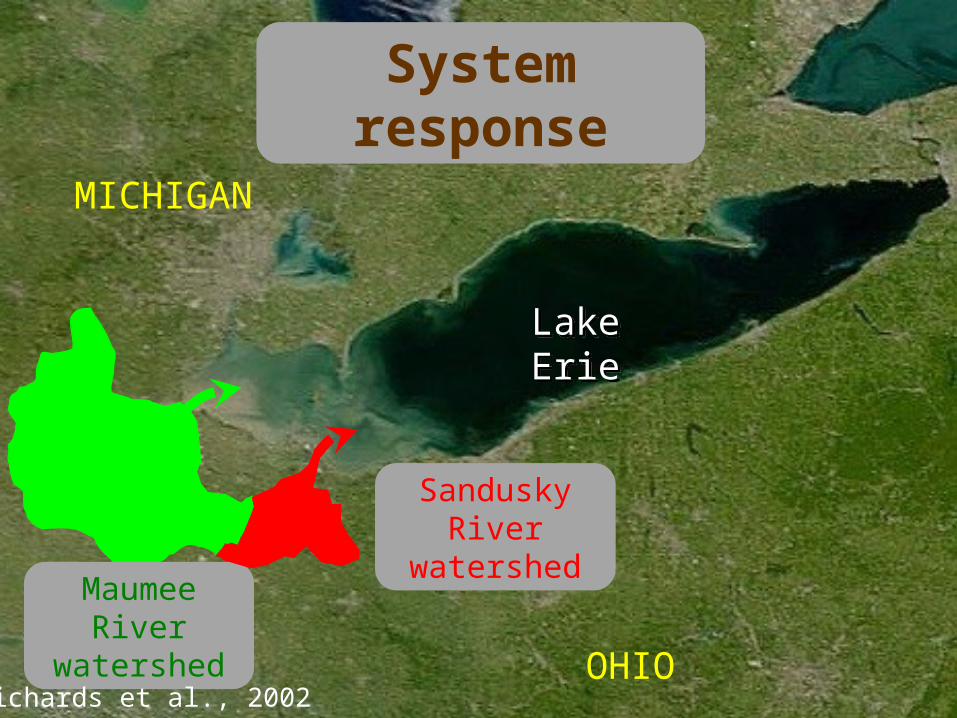
Maumee River
watershed
Sandusky River
watershed
MICHIGAN
Lake ErieLake Erie
OHIORichards et al., 2002
System response
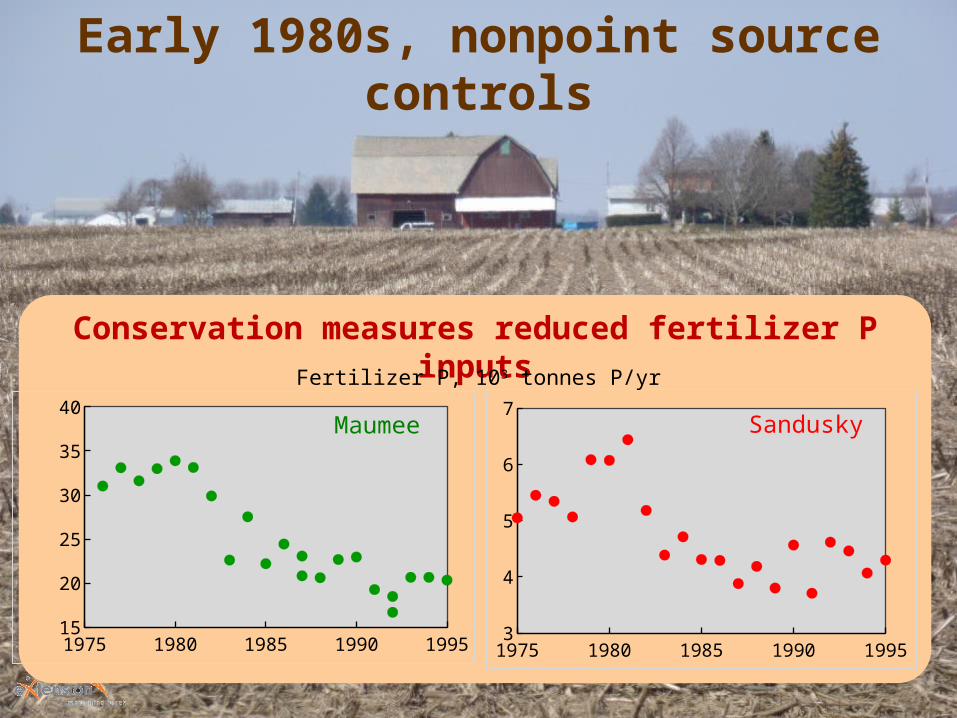
Early 1980s, nonpoint source controls
1975 1980 1985 1990 19953
4
5
6
7
1975 1980 1985 1990 199515
20
25
30
35
40
Conservation measures reduced fertilizer P inputs
Maumee Sandusky
Fertilizer P, 103 tonnes P/yr
1975 1980 1985 1990 1995 2000 2005 20100.00
0.02
0.04
0.06
0.08
0.10
0.12
0.14 Maumee River
1975 1980 1985 1990 1995 2000 2005 20100.00
0.02
0.04
0.06
0.08
0.10
0.12
0.14 Sandusky River
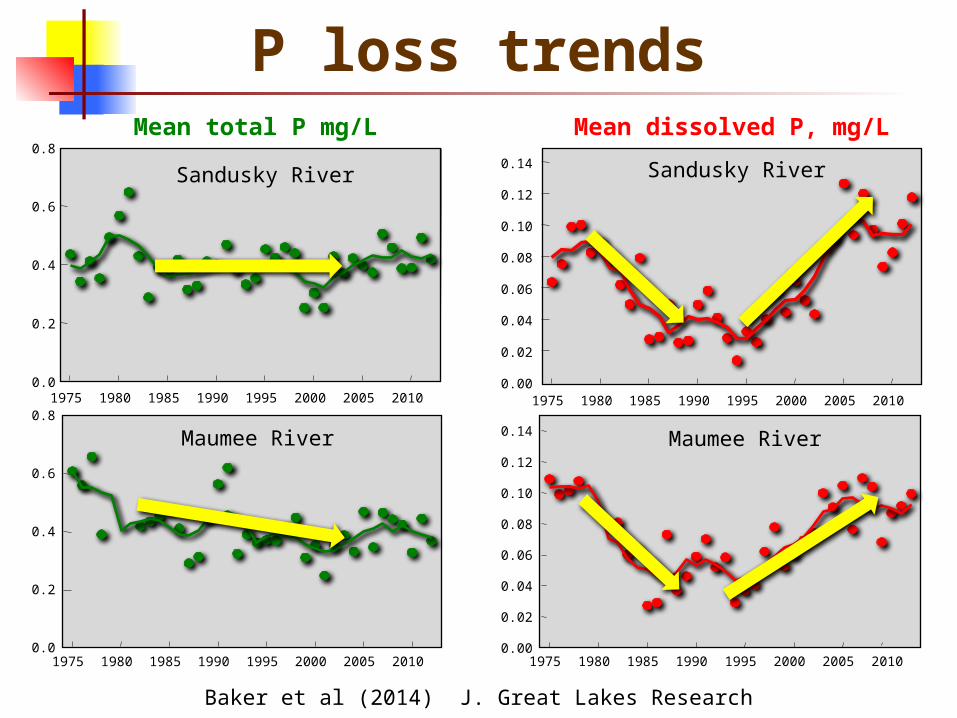
Baker et al (2014) J. Great Lakes Research
P loss trendsMean total P mg/L
1975 1980 1985 1990 1995 2000 2005 20100.0
0.2
0.4
0.6
0.8
Maumee River
1975 1980 1985 1990 1995 2000 2005 20100.0
0.2
0.4
0.6
0.8
Sandusky River
Mean dissolved P, mg/L
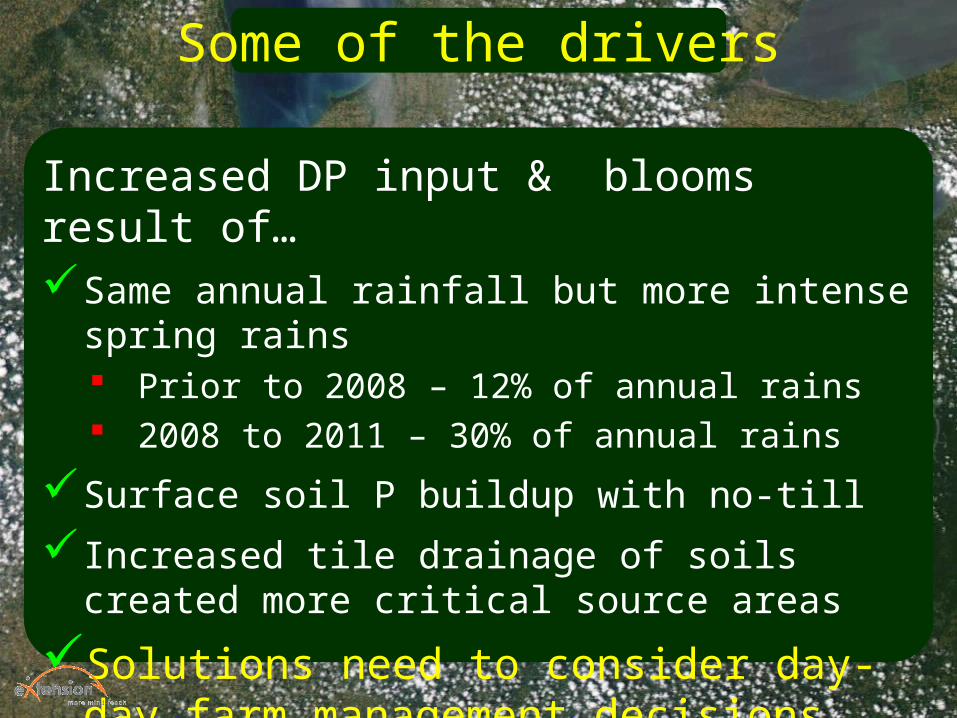
Some of the drivers
Increased DP input & blooms result of…Same annual rainfall but more intense spring
rains Prior to 2008 – 12% of annual rains 2008 to 2011 – 30% of annual rains
Surface soil P buildup with no-till
Increased tile drainage of soils created more critical source areas
Solutions need to consider day-day farm management decisions

What can we do?
Conservation initiatives, metrics, & outcomes should account for & adapt to legacy impacts Legacies mask/delay water quality
improvements Some practices will transition from sinks to
sources of P – no-till soils & buffers
Model fluvial processing of P Move from delivery coefficients &
distance functions to process-based model
What can we do?
Legacy P will likely become a resource As costs of fertilizer production
increase Market forces & govt. intervention will
determine how quickly legacy P stores are tackled
What can we do?
Need better understanding of Spatial & temporal aspects of watershed
response to nutrient load reductions Scale at which responses may occur in a
more timely fashion
Local water quality & quantity benefits evident more quickly at a smaller scale
Important to demonstrate change & foster accountability & ultimately wider adoption of conservation practices
In conclusion
Thank youQuestions?


![static-curis.ku.dk · Nutrients 2018, 10, 1489 2 of 18 higher densities of potentially pathogenic bacteria [5–7]. This disturbed colonization pattern may affect intestinal development](https://img.dokumen.tips/doc/110x75/5e0c69c82134da0d9f4cc5b3/static-curiskudk-nutrients-2018-10-1489-2-of-18-higher-densities-of-potentially.jpg)