Embed Size (px)
Citation preview

Dr. Mohit GoelJR 221/03/14
HEPATIC DOPPLER
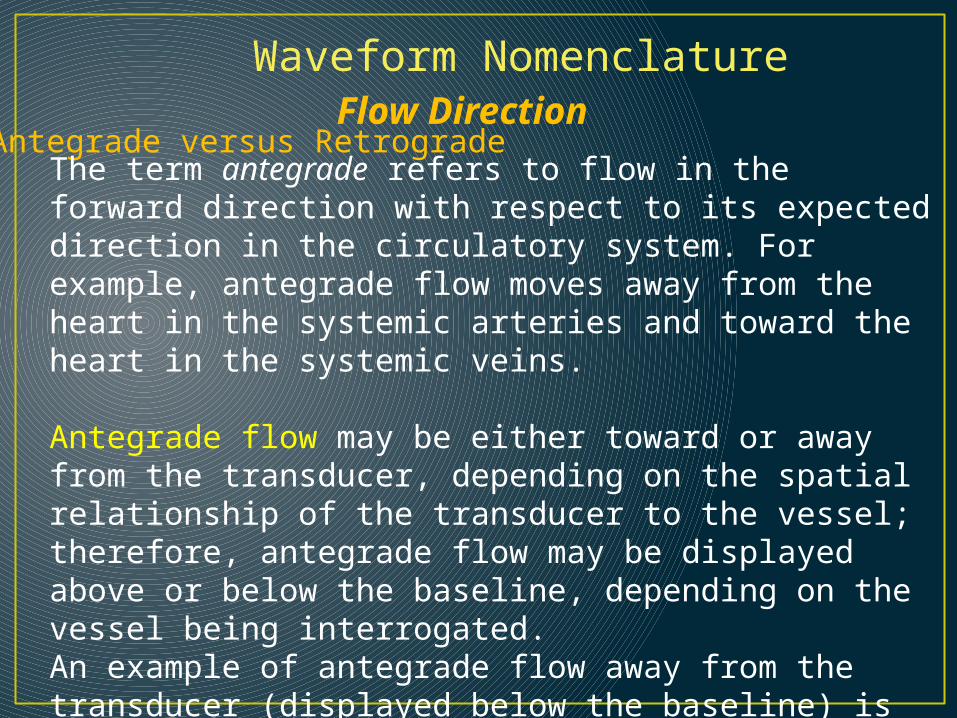
Flow DirectionAntegrade versus Retrograde
The term antegrade refers to flow in the forward direction with respect to its expected direction in the circulatory system. For example, antegrade flow moves away from the heart in the systemic arteries and toward the heart in the systemic veins.
Antegrade flow may be either toward or away from the transducer, depending on the spatial relationship of the transducer to the vessel; therefore, antegrade flow may be displayed above or below the baseline, depending on the vessel being interrogated.An example of antegrade flow away from the transducer (displayed below the baseline) is seen in the systolic wave (S wave) and diastolic wave (D wave) of the normal hepatic venous waveform.
Waveform Nomenclature


The term retrograde refers to flow in the reverse direction with respect to its expected direction in the circulatory system. For example, retrograde flow may be seen in severe portal hypertension, in which portal venous flow reverses direction (hepatofugal flow).

Phasicity versus Phase Quantification
Phasic is another word for cyclic; its absence or presence (and degree) may be qualified.
On the other hand, a phase is a stage, or portion, of a phasic process; the number of phases may be quantified.
Phasic blood flow has velocity and acceleration fluctuations that are generated by cyclic (phasic) pressure fluctuations, which are in turn generated by the cardiac cycle (cardiac phasicity).


Unidirectional versus Bidirectional
Vessels with flow in only one direction (whether antegrade or retrograde) can be said to have unidirectional flow, which can only be monophasic.
Vessels that have flow in two directions are said to have bidirectional flow, which may be biphasic, triphasic, or tetraphasic, depending on how many times blood flows in each direction.

Inflection Quantification.—Waveform can be characterized according to the number of inflections in each cycle.Inflections must occur in pairs; otherwise, what goes up doesn't come down. Waveforms without inflection are aninflectional; those with two inflections are di-inflectional; and those with four inflections—the maximum number of inflections per cardiac cycle—are tetrainflectional.

Arterial Resistance.—In the physiologic state, arteries have the capacity to change their resistance to divert flow toward the organs that need it most.
Arteries that normally have low resistance in resting (ie, nonexercising) patients include:
Arteries that normally have high resistance in resting patients include:

High-resistance artery (left) allows less blood flow during end diastole (the trough is lower) than does a low-resistance artery (right). These visual findings are confirmed by calculating an RI. High-resistance arteries normally have RIs over 0.7, whereas low-resistance arteries have RIs ranging from 0.55 to 0.7. The hepatic artery is a low-resistance artery.
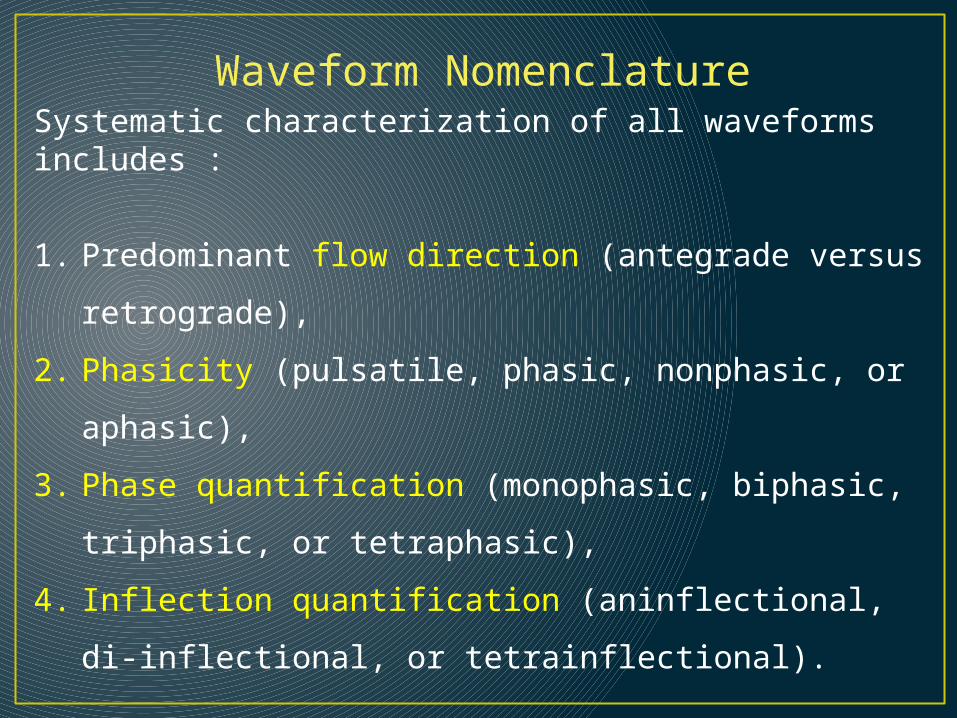
Waveform NomenclatureSystematic characterization of all waveforms includes :
1. Predominant flow direction (antegrade versus
retrograde),
2. Phasicity (pulsatile, phasic, nonphasic, or aphasic),
3. Phase quantification (monophasic, biphasic,
triphasic, or tetraphasic),
4. Inflection quantification (aninflectional, di-
inflectional, or tetrainflectional).
Additional features include the presence or absence of spectral broadening and, in arteries, the level of resistance (high versus low)

Normal waveforms

Abnormal waveforms

Abnormal waveforms
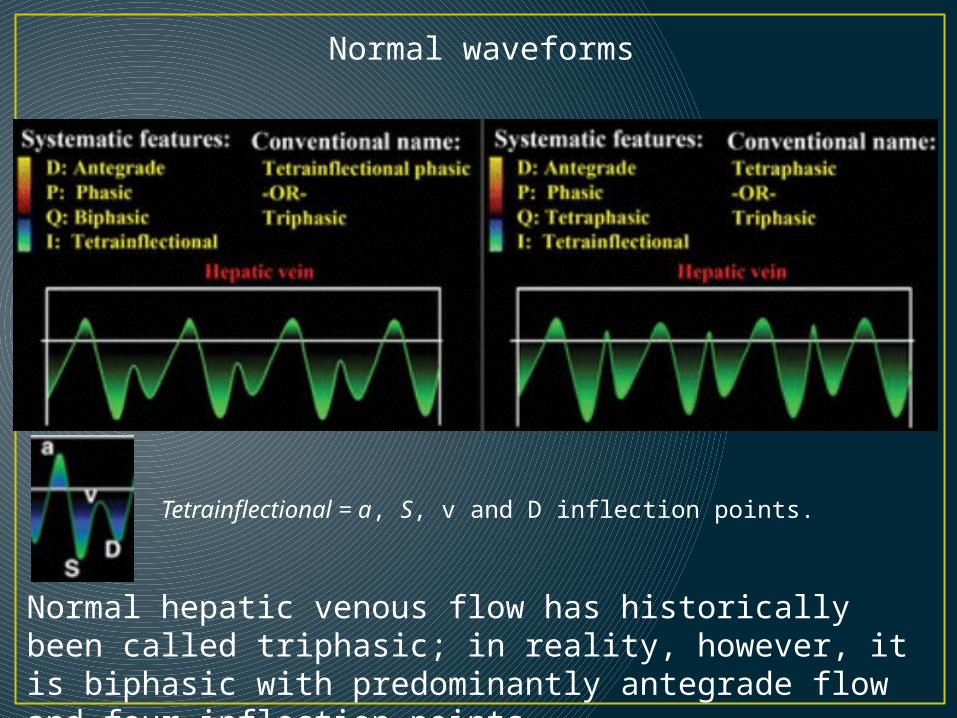
Tetrainflectional = a, S, v and D inflection points.
Normal hepatic venous flow has historically been called triphasic; in reality, however, it is biphasic with predominantly antegrade flow and four inflection points.
Normal waveforms

Abnormal waveforms
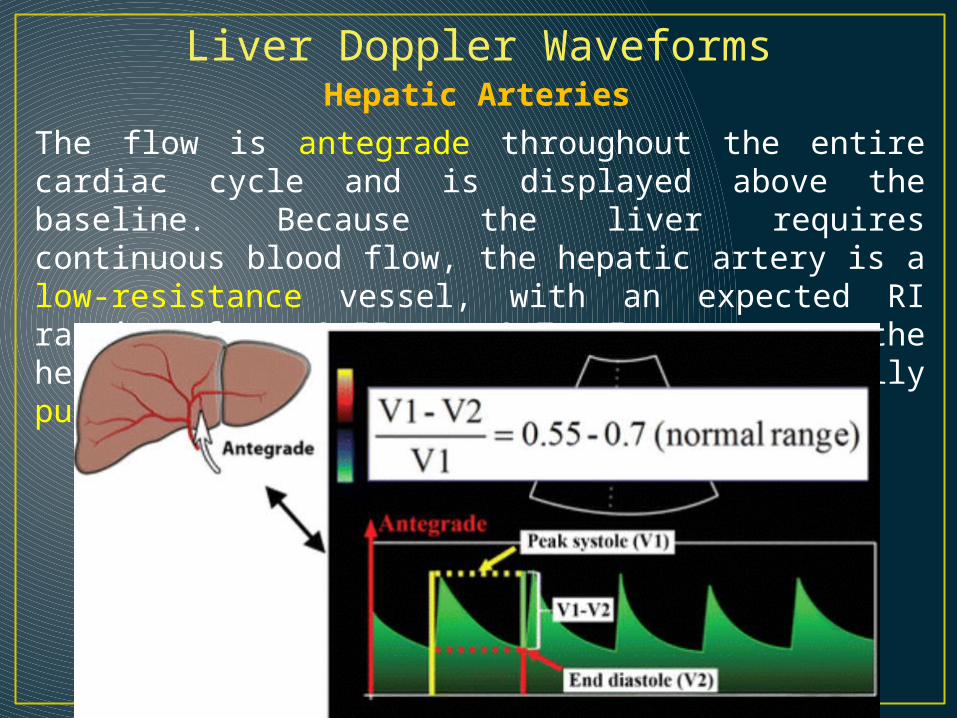
Liver Doppler WaveformsHepatic Arteries
The flow is antegrade throughout the entire cardiac cycle and is displayed above the baseline. Because the liver requires continuous blood flow, the hepatic artery is a low-resistance vessel, with an expected RI ranging from 0.55 to 0.7. In summary, the hepatic arterial waveform is normally pulsatile with low resistance.

Liver disease may manifest in the hepatic artery as abnormally elevated (RI >0.7) or decreased (RI <0.55) resistance.
High resistance is a nonspecific finding that may be seen :

Spectrum of increasing hepatic arterial resistance (bottom to top).
The hepatic artery normally has low resistance (RI = 0.55–0.7) (middle).
Resistance below this range (bottom) is abnormal. Similarly, any resistance above this range (top) may also be abnormal.
High resistance is less specific for disease than is low resistance.
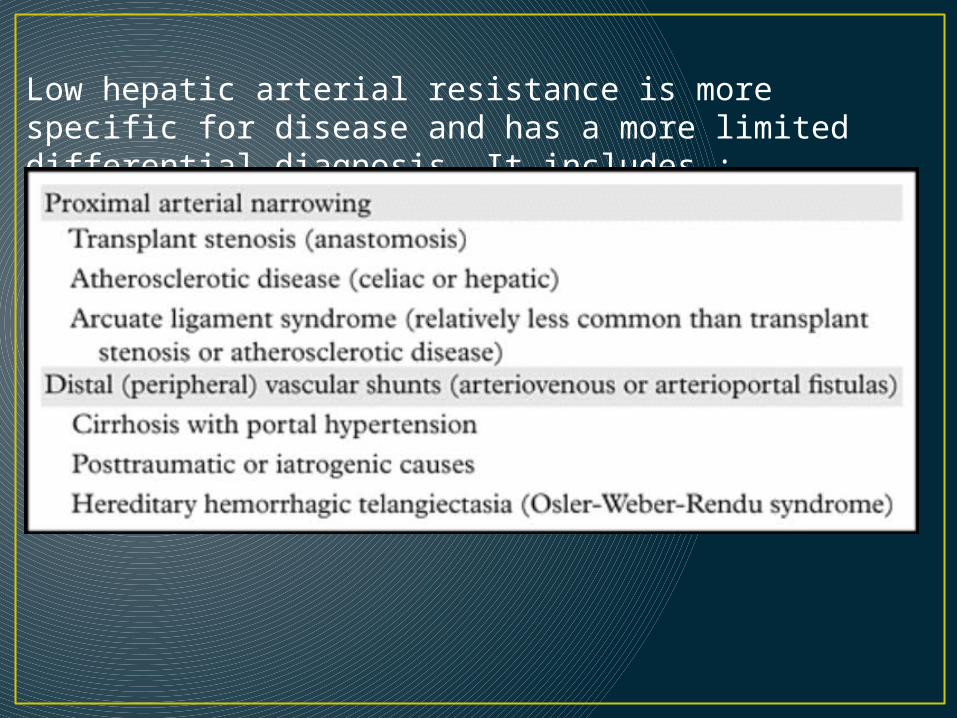
Low hepatic arterial resistance is more specific for disease and has a more limited differential diagnosis. It includes :

The effect of cirrhosis on hepatic arterial microcirculation is complex and variable. Arterial resistance has been shown to be decreased, normal, or increased in cirrhotic patients.
Some aspects of the disease process, such as inflammatory edema, arterial compression by regenerative nodules, and arterial compression by stiff noncompliant (fibrotic) parenchyma, have been thought to increase resistance. Other aspects, such as the “hepatic arterial buffer response” (compensatory small artery proliferation and increased numbers of arteriolar beds) and arteriovenous shunting, are thought to decrease resistance). The overall balance of these factors presumably dictates the observed resistance, and it has been shown that hepatic arterial RI is not useful for diagnosing cirrhosis or predicting its severity.

Hepatic Veins
The bulk of hepatic venous flow is antegrade. Although there are moments of retrograde flow, the majority of blood flow must be antegrade to get back to the heart. Antegrade flow is away from the liver and toward the heart; thus, it will also be away from the transducer and, therefore, displayed below the baseline.Pressure changes in the right atrium is transmitted directly to the hepatic veins.

The term triphasic, which refers to the a, S, and D inflection points, is commonly used to describe the shape of this waveform; according to some authors, however, this term is a misnomer, and the term tetrainflectional is more accurate, since it includes the v wave and avoids inaccurate phase quantification. Normal hepatic venous waveforms may be biphasic (bottom left) or tetraphasic (bottom right).

• The peak of the retrograde a wave corresponds with atrial contraction, which occurs at end diastole.
• The trough of the antegrade S wave correlates with peak negative pressure created by the downward motion of the atrioventricular septum during early to midsystole.
• The peak of the upward-facing v wave correlates with opening of the tricuspid valve, which marks the transition from systole to diastole.
• The trough of the antegrade D wave correlates with rapid early diastolic right ventricular filling.
• The cycle then repeats.

• It is generated by increased right atrial pressure resulting from atrial contraction, which occurs toward end diastole.
• The a wave is an upward-pointing wave with a peak that corresponds to maximal retrograde hepatic venous flow.
• In physiologic states, the peak of the a wave is above the baseline, and the a wave is wider and taller than the v wave.
• The only time this rule breaks down is in cases of severe tricuspid regurgitation, when the S wave becomes retrograde and merges with the a and v waves to form one large retrograde a-S-v complex.
a wave

S wave
• Its initial downward-sloping portion is generated by decreasing right atrial pressure, as a result of the “sucking” effect created by the downward motion of the atrioventricular septum.
• The S wave corresponds to antegrade hepatic venous flow.
• The lowest point occurs in mid-systole and is the point at which negative pressure is minimally opposed and antegrade velocity is maximal. After this low point, the wave rises again as pressure in the right atrium builds due to ongoing systemic venous return.

v wave
• The upward-sloping portion is generated by increasing right atrial pressure resulting from continued systemic venous return against the still-closed tricuspid valve, all of which occurs toward the end of systole.
• The peak of the wave marks the opening of the tricuspid valve and the transition from systole to diastole.
• Thereafter, the wave slopes downward because right atrial pressure is relieved during rapid early diastolic right ventricular filling.
• The position of the peak of the v wave varies from above to below the baseline in normal states.

D wave
• Its initial downward-sloping portion is generated by decreasing right atrial pressure resulting from rapid early diastolic right ventricular filling.
• The D wave corresponds to antegrade hepatic venous flow and is the smaller of the two downward-pointing waves.

Normal variant C wave
(a)As ventricular systole begins, retrograde velocity begins to decrease (small yellow arrow in the IVC), causing the retrograde velocity on the spectral tracing to decrease, as in a regular A wave.
(b)With the pulmonic valve closed, the ventricular pressure increases before ejection of blood into the pulmonary artery. The tricuspid valve may bulge into the right atrium, causing a transient pulse of increased flow in the retrograde direction (large yellow arrow in the IVC). This pulse is termed the C wave.

c)When the pulmonic valve opens, blood is ejected from the ventricle (large yellow arrow), and the retrograde velocity progressively decreases (small yellow arrow in the IVC) as part of the normal conclusion of the A wave.

Abnormal (pathologic) portal venous flow usually manifests in one of four ways.1. Increased pulsatility (pulsatile waveform) The hepatic sinusoids connect the portal veins with the hepatic arteries and veins.
Hepatic sinusoids connect the portal veins with the hepatic arteries and veins. In the normal state, the arteries do not contribute significantly to pulsatility, whereas the hepatic veins contribute as described earlier.
Anything that abnormally transmits pressure to the sinusoids will result in a pulsatile portal venous waveform.

On the hepatic venous side, tricuspid regurgitation and right-sided CHF transmit pressure and increase pulsatility.
On the arterial side, arteriovenous shunting (as seen in severe cirrhosis) or arteriovenous fistulas (as seen in hereditary hemorrhagic telangiectasia) may have this effect.
Causes of Pulsatile Portal Venous Waveform

Spectral Doppler US image shows a pulsatile waveform with flow reversal in the right portal vein. The waveform may be systematically characterized as predominantly antegrade, pulsatile, biphasic-bidirectional, and di-inflectional.

2. Slow portal venous flow.
Abnormally slow flow occurs when back pressure limits forward velocity. Slow flow is diagnostic for portal hypertension, which is diagnosed when peak velocity is less than 16 cm/sec.
Findings That Are Diagnostic for Portal Hypertension

Spectral Doppler US image shows slow flow in the main portal vein.

3. Hepatofugal (retrograde) flow Hepatofugal flow occurs when back pressure exceeds forward pressure, with flow subsequently reversing direction.
This results in a waveform that is below the baseline.

4. Absent (aphasic) portal venous flow. Absent flow in the portal vein may be due to stagnant flow (portal hypertension) or occlusive disease, usually caused by thrombosis.

Causes of Absent Portal Venous Flow
In severe portal hypertension, there is a period of time during the disease course when flow is neither hepatopetal nor hepatofugal, but stagnant.
This results in absent portal venous flow and puts the patient at increased risk for portal vein thrombosis.

THANK YOU