Embed Size (px)
Citation preview
ETHNICITY, FORMS OF CAPITAL, AND EDUCATIONALACHIEVEMENT
GEERT W. J. M. DRIESSEN
Abstract – Bourdieu’s cultural capital thesis is an attempt to explain how social classinfluences the transmission of educational inequality. In this article, the question ofthe extent to which various forms of capital also apply to ethnic minorities standscentral. On the basis of Dutch and American research findings, a model is formu-lated and empirically tested with the aid of data from the Dutch Primary Educationcohort study. Students from four ethnic groups are included: Dutch, Surinamese,Turkish, and Moroccan. The main variables are language and math test scores, socio-economic milieu, and a number of capital indicators, including financial resources,linguistic resources, parental reading behavior, and educational resources within thefamily. The results show no mediating effect of resources within the various ethnicgroups. The findings also suggest that in research and practice it is relevant to nottreat ethnic groups as one homogenous group, but to differentiate between the variousgroups.
Zusammenfassung – Bourdieus These kulturellen Kapitals ist ein Erklärungsversuch,wie soziale Klassen die Übertragung von Ungleichheiten im Bildungsbereich beein-flussen. In diesem Artikel wird untersucht, inwieweit die Theorie auch auf ethnischeMinderheiten angewandt werden kann. Auf der Basis niederländischer und amerikani-scher Forschungsergebnisse wird ein Modell formuliert und empirisch getestet, dasStudenten aus vier ethnischen Gruppen einbezieht: holländischen, surinamischen,türkischen und marokkanischen. Die Hauptvariablen sind Testergebnisse inSprache und Mathematik, im sozialwirtschaftlichen Milieu und eine Anzahl vonKapitalindikatoren, einschließlich finanzieller Mittel, elterlichen Leseverhaltens undBildungsressourcen innerhalb der Familie. Die Ergebnisse zeigen, dass es ernsthafteSchwierigkeiten bei dem Versuch der Anwendung der These Bourdieus auf ethnischeMinderheiten gibt.
Résumé – La thèse de Bourdieu sur le capital culturel tente d’expliquer la façon dontla classe sociale contribue à maintenir l’inégalité éducative. L’auteur de l’articleexamine dans quelle mesure cette théorie peut être étendue aux minorités ethniques.Il élabore et teste empiriquement un modèle à partir de résultats scientifiques danoiset étasuniens. Ce test est administré auprès d’écoliers issus de quatre groupesethniques: danois, surinamiens, turques et marocains. Les variables principalesconstituent les résultats aux tests linguistiques et mathématiques, le milieu socio-économique et une série d’indicateurs décisifs dont les ressources financières, lecomportement des parents envers la lecture et le niveau éducatif de la famille. Lesrésultats montrent cependant qu’il est très difficile d’appliquer la thèse de Bourdieuaux minorités ethniques.
Resumen – La tesis del capital cultural, de Bourdieu, apunta a explicar cómo la clasesocial influye sobre la transmisión de desigualdades en el nivel de instrucción de laspersonas. Este artículo examina hasta que grado esta teoría también podría ser aplicadaa las minorías étnicas. Sobre la base de los resultados obtenidos con investigaciones
International Review of Education – Internationale Zeitschrift für Erziehungswissenschaft– Revue Internationale de l’Education 47(6): 513–538, 2001. 2001 Kluwer Academic Publishers. Printed in the Netherlands.
holandesas y estadounidenses se está delineando un modelo sometido a un testempírico que incluye a estudiantes de cuatro grupos étnicos: holandeses, surinameses,turcos y marroquíes. Las principales variables son la lengua y las puntuacionesobtenidas en pruebas de matemáticas, el entorno socioeconómico y un número deindicatores importantes tales como recursos financieros, hábitos de lectura de lospadres y niveles de instrucción dentro de la familia. Los resultados demuestran quese presentan serias dificultades al tratar de aplicar la tesis de Bourdieu a las minoríasétnicas.
Educational position of ethnic minorities
Just as in most West-European countries, various groups of migrants havecome to the Netherlands since World War II for mainly political and economicreasons. These migrants can be divided into four categories: (1) Migrants fromformer Dutch colonies, including the Dutch East Indies, Surinam, and theNetherlands Antilles. As a result of their ties with the former motherland,these migrants were already somewhat acquainted with the Dutch languageand culture. (2) So-called guest workers from such Mediterranean countriesas Spain, Turkey, and Morocco. One characteristic shared by them was theirlow level of education. (3) Refugees coming from countries such as Iran, Iraq,former Yugoslavia, and Somalia. This is a very divergent category in termsof both language and culture. (4) Migrants from such Western countries asBelgium and Germany with a comparable socioeconomic status.
Based on the broad criterion of “origin”, i.e., the native countries of themigrants, their parents, and their grandparents, more than 16% of the Dutchpopulation of approximately 15.5 million inhabitants were non-indigenous in1996. Of these 15.5 million, 7% were the target of the ethnic minority policyof the Dutch government. Due to their relatively high socioeconomic status,migrants from the Dutch East Indies are excluded from this policy, as are
514
migrants from Western countries. In terms of numbers, the main countries oforigin are: Surinam (282,000), the Antilles (94,000), the Moluccas (35,000),Turkey (272,000), Morocco (225,000), the other Mediterranean countries(164,000), and refugees (44,000) (Driessen 2000).
In the Western world, the position of ethnic minorities in education is gen-erally a major cause of concern. Their position is characterized by lowachievement levels, little pursuit of higher types of education, widespreadtruancy and disciplinary problems, and high drop-out rates (Gillborn 1997;Rossi and Montgomery 1994). During the past few decades, numerous theorieshave been developed to explain the differences observed in school careers.Since the 1970s, a number of theories have claimed that existing socialinequalities tend to be reproduced independent of intelligence or capacity. Theeducational system is assumed to occupy a key position in this process.
One of the proponents of this reproduction thesis is Bourdieu with hisculture-political theory. Central for Bourdieu is the cultural transmission ofsocial inequality. In education, selection occurs on the basis of a number ofarbitrary criteria – namely, differences in cultural patterns and lifestylecharacteristics. These patterns and characteristics or so-called “cultural capital”or “cultural resources” are transmitted within one’s own milieu fromgeneration to generation. One can think of critical linguistic or social-culturalcompetencies and affinities (e.g., interactional forms, language use, interests,taste for art and culture, social and cultural opinions and preferences). Thishabitus differs from one status group to another.
Cultural capital cannot be acquired at school and the school cannot diminishdifferences in the amount of capital across groups of students. The converseis, in fact, the case: The manner in which education is organized, the one-sided interest of the educational system in the culture of the dominant statusgroups, the fit of the existing educational system with this culture, and thepresupposition of particular codes and capacities all contribute to an expan-sion of already existing differences. The cultural capital that education pre-supposes on the part of its students is largely acquired during primarysocialization within the family and upbringing by parents who belong to thedominant culture. The stronger the embedding of parents in the dominantculture and the more oriented their child rearing is toward the dominantculture, the more comfortable their children feel at school and the more theybenefit from that which is being taught. A gap can thus exist between homeand school as a result of a student’s access to cultural capital and belongingto a dominant status group or not. Given that the dominant culture lies at thecore of the – hidden – educational curriculum, it is often difficult for thechildren from the lower social strata to grasp the material being taught. Andthis situation explains the less favorable educational position of such groups(Bourdieu and Passeron 1977).
515
Research on cultural capital
Research in the Netherlands
In the Netherlands, the ideas of Bourdieu have been empirically tested by afew researchers. De Graaf (1986) analyzed not only the influence of culturalresources but also of financial resources (i.e., income levels). Although theresults of his study are not completely consistent, the effects of financialresources appeared to be modest, while the effects of parental reading behaviorand passive cultural participation on the part of the student were found tomediate the entire effect of social background on the educational levelsachieved by the students. Tesser and Mulder (1990) attempted to replicatethe study of De Graaf but could not confirm any of the findings. They did,however, find that special significance should be attached to the “possessionof books.” Such possession indicates a specific relation to language andperhaps a form of participation in the “culture of literacy” (cf. Carringtonand Luke 1977). Van der Velden (1991) also found the possession of culturalcapital (including reading behavior, cultural-pedagogical level of upbringing,insight into the educational system) to almost completely explain the effectsof the educational and vocational levels of the parents on the school careersof their children. Nevertheless, while the relevant characteristics of the familywere found to mediate part of the status effect, they did not contribute to abetter prediction of career course. The characteristics indicate, rather, whichprocesses appear to play a role in the observed effects.
Driessen, Mulder and Jungbluth (1999) examined a number of aspects ofcultural capital (book culture, cultural participation, parental educationalsupport behavior, and language choice) among an extensive sample of highschool students and came to the same conclusions as Van der Velden: Theinfluence of the family structural indicators (social milieu) occurs via familypedagogical indicators (cultural capital) although the latter characteristics addvirtually nothing to the explanatory power of the first characteristics. Lesemanet al. (1995) examined the effects of family characteristics on the achieve-ment of children in the first year of elementary school. Their analyses clearlyshowed the effects of socioethnic milieu on the vocabularies of the childrento be completely mediated by the language in the home, the instructionalquality of the parent-child interactions, and the degree of social-emotionalsupport within this context. In addition to the language at home, the peda-gogical conceptions and cultural-educational capital (“lifestyle characteris-tics”) within the family appeared to constitute important links between ethnicorigin and the socialization of cognitive skills.
The research conducted during the past few decades shows not only theeducational position of ethnic minorities to be a source of concern but alsothat this position may very well be related to the culturally determined valuesand patterns of child rearing found within the families themselves. Among theDutch studies in the domain of cultural capital only a few have considered
516
ethnic differences. Given their current position, however, it is relevant toevaluate the cultural-capital thesis for them as well. And in order to do this,it may be useful to first examine the results of the cultural-capital thesis inconnection with minorities in countries with an longer tradition of migrationthan in the Netherlands. A review of the literature was therefore undertakenfor research conducted within this domain in the USA.
Research in the USA
The US studies represent a broad scale of themes within diverse settings.And although we encountered relevant initiatives and new points of viewwithin this research, the general utility of the research was less than we hadhoped for. This is due to not only the limited amount of specific attention paidto “race” or “ethnicity” but also the inconsistency of the results. Most recently,Roscigno and Ainsworth-Darnell (1999: 160) also had to conclude that “sur-prisingly little research has focused on if and how racial and ethnic groupsdiffer with regard to these attributes in general, and cultural capital, in par-ticular.”
If we examine the theoretical perspective adopted in the majority of thestudies, it can be seen that the American studies are much more orientedtoward the concept of “social capital” (Coleman 1988; Runyan et al. 1998)when compared to the Dutch (and West-European) studies. Coleman’s thesisof social capital pertains to the structure of the social relations between people.Being part of a community in which educational achievement is stimulatedcan itself be considered a form of capital. The classical interpretation ofcultural capital in terms of Bourdieu (i.e., such “high-brow cultural partici-pation” as visiting the theater, concerts, and museums) is relatively infrequentin the American studies (cf. Aschaffenburg and Maas 1997). It is strikingthat cultural/social capital receives a very specific but varying definition: reli-gious capital as the binding factor within a community (Corvig 1996), thecultural subgroup (Sullivan 1997), or belonging to a particular ethnic groupas valuable in and of itself (Bankston, Caldas and Zhou 1997).
As already indicated, the results of the American studies are not at all con-sistent. In the one case, either cultural or social capital is found to play a medi-ating role; in the other, they do not. In this light, it should be noted that someof the studies confirm the mobility thesis (namely, cultural capital as a meansof mobility for lower-class children, cf. DiMaggio 1982) but not Bourdieu’sreproduction thesis (which is aimed at the higher social classes). With regardto the central aim of our search, namely the significance of cultural capitalfor ethnic minority groups, the findings are also disappointing. The expecta-tion was that a country with a much longer tradition of ethnic minorities thanin the Netherlands and a country where the size and scope of the groups ismuch greater than in the Netherlands would pay greater attention to such aperspective. This did not prove to be the case. In research on cultural capital,no explicit distinction was generally made with regard to ethnicity or the
517
sample was simply limited to a group of whites. The majority of the studiescited here thus constitute an exception, but this does not mean that ethnicityforms a central theme or explicit attention was even paid to ethnicity.
Despite this situation, we nevertheless encountered a few interestingnotions. Lareau and McNamara Horvat (1999), for example, make a distinc-tion between the possession and activation of capital and thereby suggestthat capital only gains its value in specific settings. They point, in particular,to the importance of student-teacher interactions and to the role that the teacherplays within these as so-called gatekeeper (Farkas et al. 1990). “Linguisticcapital” is also shown to be of major importance in a number of studies(Stanton-Salazar 1997), which is really not so amazing for a country with sucha wide variety of language groups. Yet another distinct approach is that ofAinsworth-Darnell and Downey (1998) who connect cultural capital to Ogbu’s“oppositional culture explanation” and “resistance model” (also see Kalmijnand Kraaykamp 1996). Further attention is paid in the American studies tothe educational support activities of the parents, such as providing help withhomework and attending parent evenings or conferences (Furstenberg andHughes 1995). Particularly striking is the number of occasions on whichfamily composition is referred to as an indicator of capital (i.e., the numberof children and a single-parent versus complete family structure; Bianchi andRobinson 1997; Downey 1995).
The manner in which ethnicity is incorporated into the research studies ingeneral is twofold. On the one hand, the sample may be limited to a specificminority or immigrant group (e.g., Roscigno and Ainsworth-Darnell 1999);on the other hand, ethnic origin may be coded in the form of dummy vari-ables for inclusion in the analyses (cf. Teachman, Paasch and Carver 1996;White and Kaufman 1997). The alternative of conducting separate analysesfor each of the ethnic groups and comparing the results was only encoun-tered once, namely in the study of Okagaki and Frensch (1998). Theyconcluded that there are big differences among the ethnic groups in thecorrelations between attitudes and behavior and educational achievement, evenafter controlling for social milieu and income. Their findings suggest thatconducting separate analyses is essential.
Research questions
On the basis of the research findings, we will examine the relation betweenvarious forms of capital and educational achievement in greater detail for anumber of different ethnic groups using recent empirical data. In doing this,we will attempt to answer the following research questions:
• To what extent do different ethnic minority groups have access to culturaland financial resources? To what extent does this access differ from theaccess of Dutch students to such resources?
• What relations exist between the different aspects of cultural and financial
518
capital, on the one hand, and the educational achievements of elementaryschool children, on the other hand? Does a difference exist between ethnicminority and Dutch students in this regard?
• To what extent does the effect of social milieu on achievement appear tobe mediated by cultural and financial resources? Does a difference existbetween ethnic minority and Dutch students in this regard?
Method
Sample, instruments, and variables
For the analyses in this study, we used data collected in the school year1994/95 for the Dutch nationally representative cohort study of PrimaryEducation (“PRIMA”). Of particular interest are the results of a languageand math test that the students were administered in second grade (7–8 yearsof age) and information with regard to the students and their home situationcollected via the completion of a written questionnaire by the parents (seeDriessen and Vierke 1999).
A central variable in our study is the ethnic origin of the students. Wefocused on (1) Dutch, (2) Surinamese and Antillean (former colonies), (3)Turkish (guest workers), and (4) Moroccan (guest workers) families with 7531,282, 515, and 415 students, respectively. In the present study, we were insearch of any differences between the ethnic groups suggesting a systematiceffect. For this reason, we utilized analyses in which the size of the groupswas held equal. In order to do this, the four groups were weighted with thesmallest group, the Surinamese students (N = 282), receiving a weighting of1 and the remaining groups receiving a weighting of 282/the number ofstudents in the particular group. In such a manner, a total weighted N of4
× 282 = 1128 students was obtained.The review of the literature revealed a number of features that could
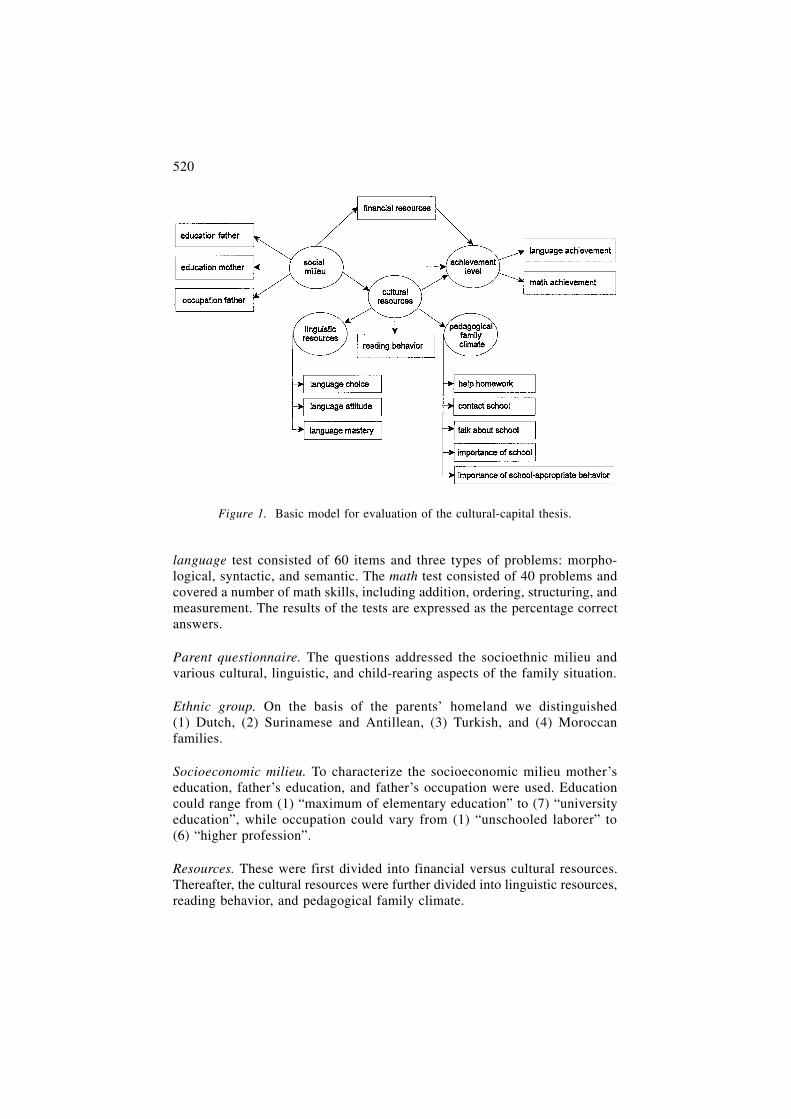
possibly be of particular importance, and the PRIMA files contained infor-mation on a number of these features. With regard to capital, financial andcultural resources could first be distinguished. Thereafter, the culturalresources could be divided into linguistic resources, reading behavior, andpedagogical family climate. We assumed that such “capital” characteristicswould play a mediating role in the explanation of language and math achieve-ment in terms of social milieu. It was also assumed that differences in theserelations would be found across the different ethnic groups. In Figure 1, theproposed relations between the variables are presented in the form of a basicmodel. In the following, an overview of the research instruments and theoperationalization of the variables will be presented.
Tests. Two tests developed specifically for PRIMA by the Dutch NationalInstitute for Educational Measurement were administered to the students. The
519
language test consisted of 60 items and three types of problems: morpho-logical, syntactic, and semantic. The math test consisted of 40 problems andcovered a number of math skills, including addition, ordering, structuring, andmeasurement. The results of the tests are expressed as the percentage correctanswers.
Parent questionnaire. The questions addressed the socioethnic milieu andvarious cultural, linguistic, and child-rearing aspects of the family situation.
Ethnic group. On the basis of the parents’ homeland we distinguished(1) Dutch, (2) Surinamese and Antillean, (3) Turkish, and (4) Moroccanfamilies.
Socioeconomic milieu. To characterize the socioeconomic milieu mother’seducation, father’s education, and father’s occupation were used. Educationcould range from (1) “maximum of elementary education” to (7) “universityeducation”, while occupation could vary from (1) “unschooled laborer” to(6) “higher profession”.
Resources. These were first divided into financial versus cultural resources.Thereafter, the cultural resources were further divided into linguistic resources,reading behavior, and pedagogical family climate.
520
Figure 1. Basic model for evaluation of the cultural-capital thesis.
• Financial resources. The disposable income per family member.• Linguistic resources:
– Language choice. The number of domains in which the child speaksDutch (as opposed to a Dutch dialect or foreign language): with mother,father, siblings, friends.
– Language attitude. Pertains to the language situation of the parents:“speaks no Dutch with partner”, “speaks Dutch with partner but attachesno importance to the child doing this”, or “speaks Dutch with partnerand attaches considerable importance to the child doing this as well”.
– Dutch language mastery. The average scores of the mother and fatherin four modalities: comprehension, speaking, reading, and writing. Thelevel of Dutch mastery in these modalities was recorded as “poor”,“moderate”, or “good”.
• Reading behavior. For both the mother and father, the number of hoursper week spent reading books, newspapers, and magazines.
• Pedagogical family climate: – Help with homework. Receiving help with one’s homework from one’s
mother, father, or siblings were included in the analyses as separate vari-ables. The responses vary from (1) “never or almost never” to (3) “fre-quently”.
– Contacts with school. These pertain to special meetings (parent evenings,conferences) with (1) “never or almost never”, (2) “most of the time”,or (3) “always” as the possible responses, and to consulting with theteacher at one’s own initiative with (1) “never”, (2) “one or two timesa year”, or (3) “three or more times a year” as the possible responses.
– Talking about school. The frequency with which the parents talk withthe child about things that happen at school and could range from (1)“less than once a week” to (4) “every day or almost every day”.
– Importance of school. The parents were asked whether they agree withthe statement that the child should go to school as long as possible; theresponse categories ranged from (1) “completely disagree” to (5)“completely agree”.
– Importance of school-appropriate behavior. The average of the scoresfor variables representing the importance that the parents attach to:“being obedient”, “working hard at school”, “neat work”, “behaving likeother children”, and “listening to what adults have to say”.
Analysis strategy
In this study, the question of whether a relation exists across and within anumber of different ethnic groups between socioeconomic milieu and theeducational achievements of children was examined. Previous research showeda moderate relation to exist between social milieu and achievement acrossgroups (Driessen and Dekkers 1997; Rossi and Montgomery 1994). Thequestion now is whether this relation is also encountered at the level of the
521
family and thus within the groups themselves or simply across groups as aresult of the correlation between average scores on social milieu and achieve-ment. In the latter case, the relation arises from some groups producing highscores for social milieu and achievement while other groups produce lowaverage scores for both social milieu and achievement; within the groupsthemselves, however, a relation need not exist between social milieu andachievement.
As indicated above, a number of studies also show cultural resources tomediate the relation between social milieu and achievement in a total analysisacross groups. In other words: When cultural resources are held constant, therelation between social milieu and achievement disappears. In that case thereis no direct effect of social milieu on the achievement of students. Once again,the question is whether such a mediating effect of cultural resources can befound within specific groups or simply emerges from the relations betweenthe averages for the different groups considered together. In the latter case ofno mediation, neither a relation between milieu and resources nor a relationbetween resources and achievement should be observed within the groups.
We initially examined the different ethnic groups for differences in therelations of social milieu and resources to achievement. Of particular interestwas the potentially interactive effect of ethnic group and some other pre-dictor (social milieu or resources) on test achievement. We tested for the exis-tence of such an interaction effect by performing a number of two-wayanalyses of variance with ethnic group and one of the other variables used topredict language and math scores. If a significant interaction effect was notfound, we could conclude that the relation of social milieu and resources totest achievement does not differ systematically for the different ethnic groups.In that case, we could also interpret the relation of a predictor to achieve-ment when ethnic group was held constant as the average within-group relationbetween predictor and achievement. Multiple regression analyses were alsoconducted to gain greater insight into the degree of mediation by resources.
Results
Differences in distributions across ethnic groups
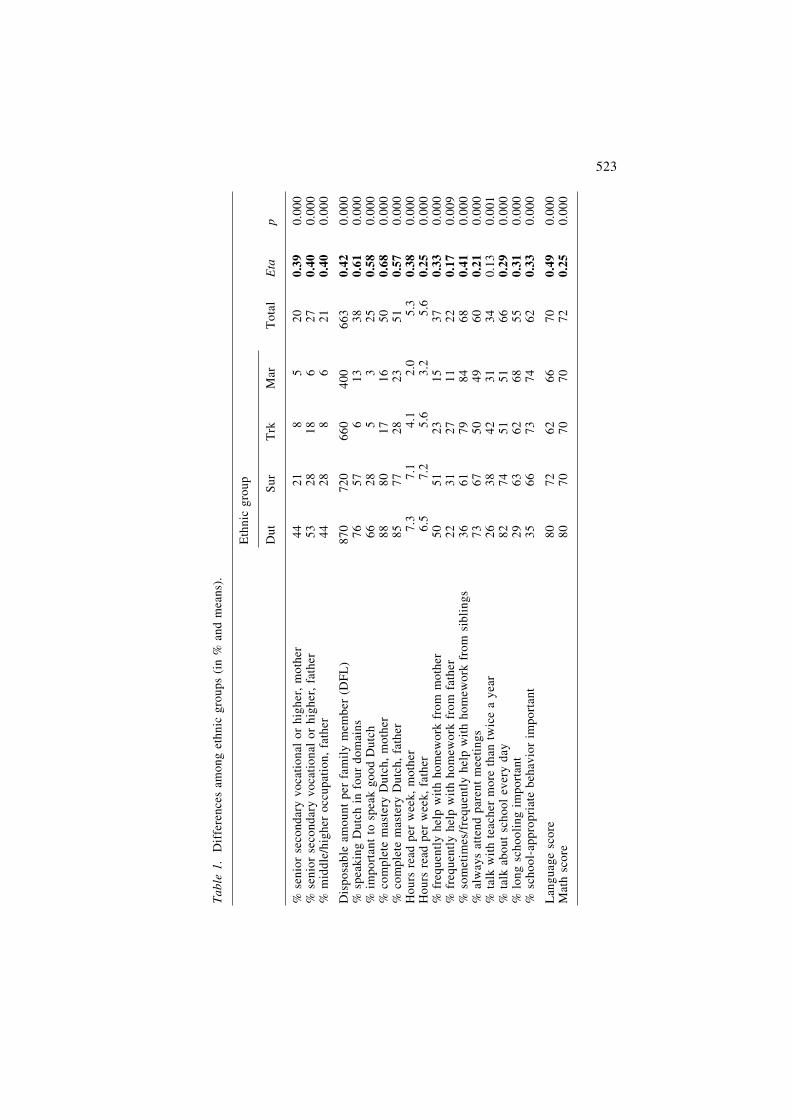
In Table 1, an overview of the characteristics of the different ethnic groupsis presented. For this analysis, we dichotomized the predictor variableswhenever possible.
The table shows considerable differences among the four groups. Withregard to educational level, it is striking how few Moroccan and Turkishparents have a senior secondary vocational or higher level of education. Foroccupational level, a similar situation is observed: The Moroccan and Turkishfathers show a very unfavorable occupational position, which also manifestsitself with regard to the disposable income per family member. For the
522
523
Tab
le 1
. D
iffe
renc
es a
mon
g et
hnic
gro
ups
(in
% a
nd m
eans
).
Eth
nic
grou
p
Dut
S
urT
rk
Mar
Tot
alE
tap
% s
enio
r se
cond
ary
voca
tion
al o
r hi
gher
, m
othe
r04
402
100
800
502
00.
390.
000
% s
enio
r se
cond
ary
voca
tion
al o
r hi
gher
, fa
ther
053
028
018
006
027
0.40
0.00
0%
mid
dle/
high
er o
ccup
atio
n, f
athe
r04
402
800
800
602
10.
400.
000
Dis
posa
ble
amou
nt p
er f
amil
y m
embe
r (D
FL
)87
072
066
040
066
30.
420.
000
% s
peak
ing
Dut
ch i
n fo
ur d
omai
ns07
605
700
601
303
80.
610.
000
% i
mpo
rtan
t to
spe
ak g
ood
Dut
ch06
602
800
500
302
50.
580.
000
% c
ompl
ete
mas
tery
Dut
ch,
mot
her
088
080
017
016
050
0.68
0.00
0%
com
plet
e m
aste
ry D
utch
, fa
ther
085
077
028
023
051
0.57
0.00
0H
ours
rea
d pe
r w
eek,
mot
her
007.
300
7.1
004.
100
2.0
005.
30.
380.
000
Hou
rs r
ead
per
wee
k, f
athe
r00
6.5
007.
200
5.6
003.
200
5.6
0.25
0.00
0%
fre
quen
tly
help
wit
h ho
mew
ork
from
mot
her
050
051
023
015
037
0.33
0.00
0%
fre
quen
tly
help
wit
h ho
mew
ork
from
fat
her
022
031
027
011
022
0.17
0.00
9%
som
etim
es/f
requ
entl
y he
lp w
ith
hom
ewor
k fr
om s
ibli
ngs
036
061
079
084
068
0.41
0.00
0%
alw
ays
atte
nd p
aren
t m
eeti
ngs
073
067
050
049
060
0.21
0.00
0%
tal
k w
ith
teac
her
mor
e th
an t
wic
e a
year
026
038
042
031
034
0.13
0.00
1%
tal
k ab
out
scho
ol e
very
day
082
074
051
051
066
0.29
0.00
0%
lon
g sc
hool
ing
impo
rtan
t02
906
306
206
805
50.
310.
000
% s
choo
l-ap
prop
riat
e be
havi
or i
mpo
rtan
t03
506
607
307
406
20.
330.
000
Lan
guag
e sc
ore
080
072
062
066
070
0.49
0.00
0M
ath
scor
e08
007
007
007
007
20.
250.
000
Moroccan families, this is less than half the amount for Dutch families. Thisis partly due to the low occupational level of the fathers and partly due to thelarge number of people in the family (namely 6.2 as opposed to 4.4 for theDutch families). In the Turkish and Moroccan families, very little Dutch isspoken and learning to speak Dutch is not considered very important. Themastery of the Dutch language is also fairly low in the Turkish and Moroccanfamilies – in particular the level of mastery for the mothers. In the Turkishand Moroccan families, the parents read very little. Once again, it is partic-ularly the mothers who score low. This is undoubtedly related to the fact that itis primarily the mothers who are illiterate within these ethnic minority groups.
With regard to helping the children with their homework, this is morecommonly done by the mothers than by the fathers. This may be due to thefact that fathers work outside the home and mothers are at home. Moroccanparents help their children least with their homework. For all of the ethnicminority groups, it is primarily the brothers and sisters who help withhomework. Within the Dutch families, this occurs considerably less often.Older brothers and sisters in ethnic minority families can perhaps compen-sate for the fact that their parents have little or no education and also havelittle or no mastery of the Dutch language. The percentage Turkish andMoroccan parents who always attend parental meetings is much lower thanthe percentages for the Dutch and Surinamese or Antillean parents. Withrespect to contact with the teacher, there are virtually no differences amongthe four ethnic groups. With respect to talking about school, however, dif-ferences are again observed. This occurs considerably less in the Turkish andMoroccan families than in the other families. The findings with regard to theimportance attached to attending school as long as possible are quite note-worthy: While the three ethnic minority groups virtually do not differ in thisrespect, the Dutch parents score particularly low. Also with regard to theimportance attached by parents to school-appropriate behavior (“conformity”),no great differences were observed among the three ethnic minority groups:They all consider school-appropriate behavior to be quite important. Dutchparents, in contrast, attach considerably less importance to such behavior.
In sum, it can be concluded with regard to the various milieu and capitalvariables that Surinamese families occupy an intermediate position betweenDutch families, on the one hand, and Turkish and Moroccan families, on theother hand, when it comes to – in particular – social milieu, financialresources, and linguistic resources. And what about achievement? With regardto language in particular, there are very strong differences. For language thetotal average is 70, with a standard deviation of 14, for math the average is72 with a standard deviation of 17. On average, the Dutch children get some80% of both the language and math problems correct. The language scoresfor the three ethnic minority groups and then again for the Turkish andMoroccan children in particular are significantly lower than those for theDutch children. The difference for the math scores is less marked and, within
524

the three ethnic minority groups, there is no difference whatsoever in thescores.
Differences in relations among ethnic groups
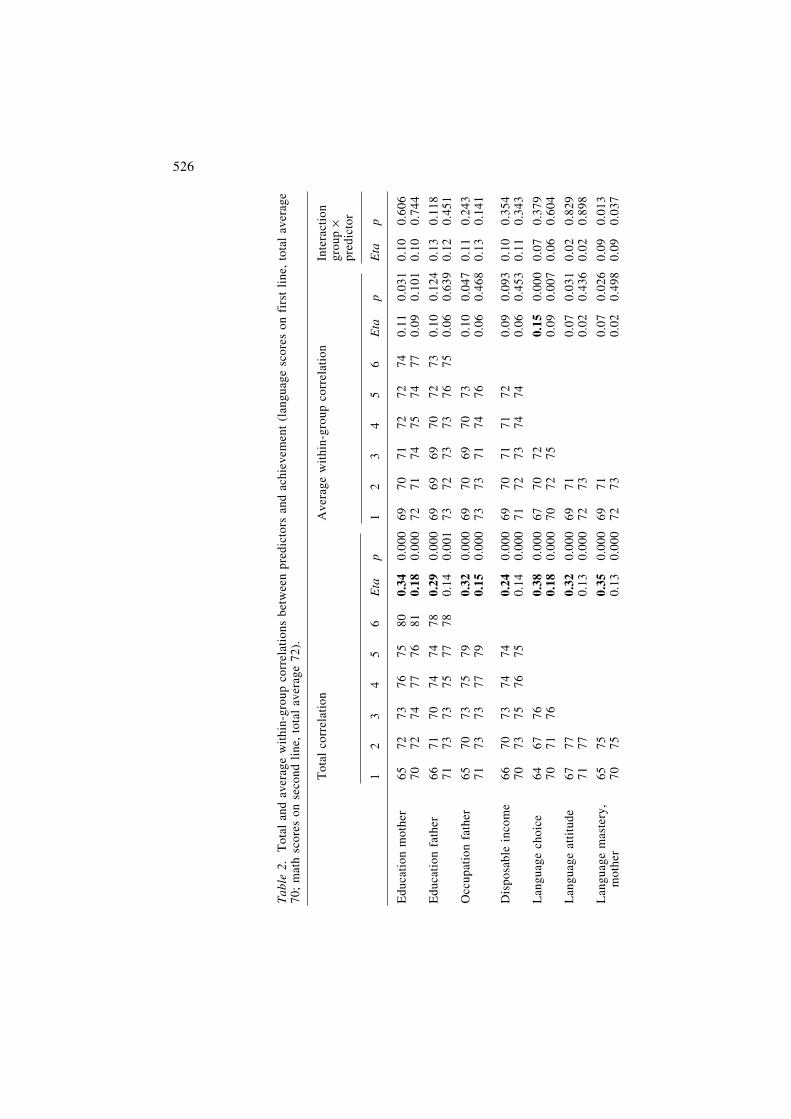
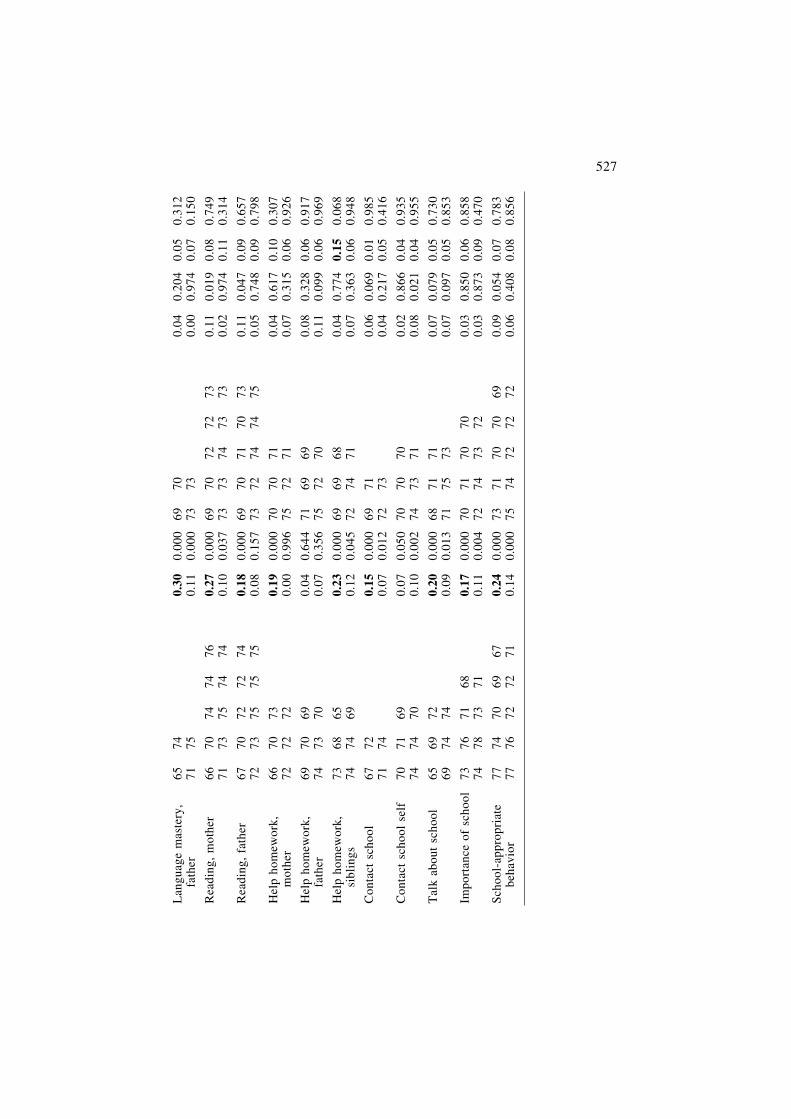
In Table 2, an overview of the relation between the language and math scoresfor each of the predictor variables is presented. For this analysis, we dividedthe continuous variables into categories and collapsed some of the non-continuous variables together for numerical reasons.1 The numbers 1–6 inthe heading of the table refer to the (varying numbers of) categories of thesepredicator variables. For every category of predictors, the average test scorefor language is presented on the first line and the average test score for mathon the second line.
The information in Table 2 shows the total correlation for almost all ofthe predictors with language to be significant and relevant but just relevantfor math (using the criterion that the Eta-coefficient be a minimum of 0.15,which was seldom found to be the case). The average within-group correla-tion was not significant for either language or math, however, and certainlynot relevant. One exception is the correlation between language choice andlanguage achievement, which showed a just relevant effect. The strength ofthe effect of the interaction between ethnic group and predictor on achieve-ment shows that we can interpret the average within-group correlation as indi-cating “the relation as it is within each of the groups”: Not one of theinteraction effects proved significant. The correlations of the various predictorvariables with achievement do not, thus, vary significantly for the differentethnic groups. Almost all of the correlations do not deviate systematicallyfrom zero; none of the within-group correlations were found to be significant(with the exception of language choice on language score).
The information with regard to social milieu suggests that the “total effect”of social milieu on achievement presupposed in previous research mustpossibly be seen as a level of interpretation mistake. In other words, it issuggested that an effect exists at the level of the family while this is not thecase: Such effects exist more at the level of the ethnic groups themselves.Dutch families have on average both a higher social milieu and in particulara higher language achievement level when compared to the other groups. Thisleads to a total positive correlation between social milieu and achievement.Within the groups, however, such a relation is virtually nonexistent. The pre-supposed mediation of the relation between social milieu and achievementby resources may also rest on an error in the level of interpretation. Giventhat the resources within the groups do not correlate with achievement, itis very unlikely that one can speak of within-group mediation – that is, amediating effect of resources on achievement at the level of the family.
525
526
Tab
le 2
. T
otal
and
ave
rage
wit
hin-
grou
p co
rrel
atio
ns b
etw
een
pred
icto
rs a
nd a
chie
vem
ent
(lan
guag
e sc
ores
on
firs
t li
ne,
tota
l av
erag
e70
; m
ath
scor
es o
n se
cond
lin
e, t
otal
ave
rage
72)
.
Tot
al c
orre
lati
on
Ave
rage
wit
hin-
grou
p co
rrel
atio
n In
tera
ctio
n gr
oup
×pr
edic
tor
12
34
56
Eta
p1
23
45
6E
tap
Eta
p
Edu
cati
on m
othe
r65
7273
7675
800.
340.
000
6970
7172
7274
0.11
0.03
10.
100.
606
7072
7477
7681
0.18
0.00
072
7174
7574
770.
090.
101
0.10
0.74
4
Edu
cati
on f
athe
r66
7170
7474
780.
290.
000
6969
6970
7273
0.10
0.12
40.
130.
118
7173
7375
7778
0.14
0.00
173
7273
7376
750.
060.
639
0.12
0.45
1
Occ
upat
ion
fath
er65
7073
7579
0.32
0.00
069
7069
7073
0.10
0.04
70.
110.
243
7173
7377
790.
150.
000
7373
7174
760.
060.
468
0.13
0.14
1
Dis
posa
ble
inco
me
6670
7374
740.
240.
000
6970
7171
720.
090.
093
0.10
0.35
470
7375
7675
0.14
0.00
071
7273
7474
0.06
0.45
30.
110.
343
Lan
guag
e ch
oice
6467
760.
380.
000
6770
720.
150.
000
0.07
0.37
970
7176
0.18
0.00
070
7275
0.09
0.00
70.
060.
604
Lan
guag
e at
titu
de67
770.
320.
000
6971
0.07
0.03
10.
020.
829
7177
0.13
0.00
072
730.
020.
436
0.02
0.89
8
Lan
guag
e m
aste
ry,
6575
0.35
0.00
069
710.
070.
026
0.09
0.01
3m
othe
r70
750.
130.
000
7273
0.02
0.49
80.
090.
037
527L
angu
age
mas
tery
, 65
740.
300.
000
6970
0.04
0.20
40.
050.
312
fath
er71
750.
110.
000
7373
0.00
0.97
40.
070.
150
Rea
ding
, m
othe
r66
7074
7476
0.27
0.00
069
7072
7273
0.11
0.01
90.
080.
749
7173
7574
740.
100.
037
7373
7473
730.
020.
974
0.11
0.31
4
Rea
ding
, fa
ther
6770
7272
740.
180.
000
6970
7170
730.
110.
047
0.09
0.65
772
7375
7575
0.08
0.15
773
7274
7475
0.05
0.74
80.
090.
798
Hel
p ho
mew
ork,
66
7073
0.19
0.00
070
7071
0.04
0.61
70.
100.
307
mot
her
7272
720.
000.
996
7572
710.
070.
315
0.06
0.92
6
Hel
p ho
mew
ork,
69
7069
0.04
0.64
471
6969
0.08
0.32
80.
060.
917
fath
er74
7370
0.07
0.35
675
7270
0.11
0.09
90.
060.
969
Hel
p ho
mew
ork,
73
6865
0.23
0.00
069
6968
0.04
0.77
40.
150.
068
sibl
ings
7474
690.
120.
045
7274
710.
070.
363
0.06
0.94
8
Con
tact
sch
ool
6772
0.15
0.00
069
710.
060.
069
0.01
0.98
571
740.
070.
012
7273
0.04
0.21
70.
050.
416
Con
tact
sch
ool
self
7071
690.
070.
050
7070
700.
020.
866
0.04
0.93
574
7470
0.10
0.00
274
7371
0.08
0.02
10.
040.
955
Tal
k ab
out
scho
ol65
6972
0.20
0.00
068
7171
0.07
0.07
90.
050.
730
6974
740.
090.
013
7175
730.
070.
097
0.05
0.85
3
Impo
rtan
ce o
f sc
hool
7376
7168
0.17
0.00
070
7170
700.
030.
850
0.06
0.85
874
7873
710.
110.
004
7274
7372
0.03
0.87
30.
090.
470
Sch
ool-
appr
opri
ate
7774
7069
670.
240.
000
7371
7070
690.
090.
054
0.07
0.78
3be
havi
or77
7672
7271
0.14
0.00
075
7472
7272
0.06
0.40
80.
080.
856
The mediating effect of resources
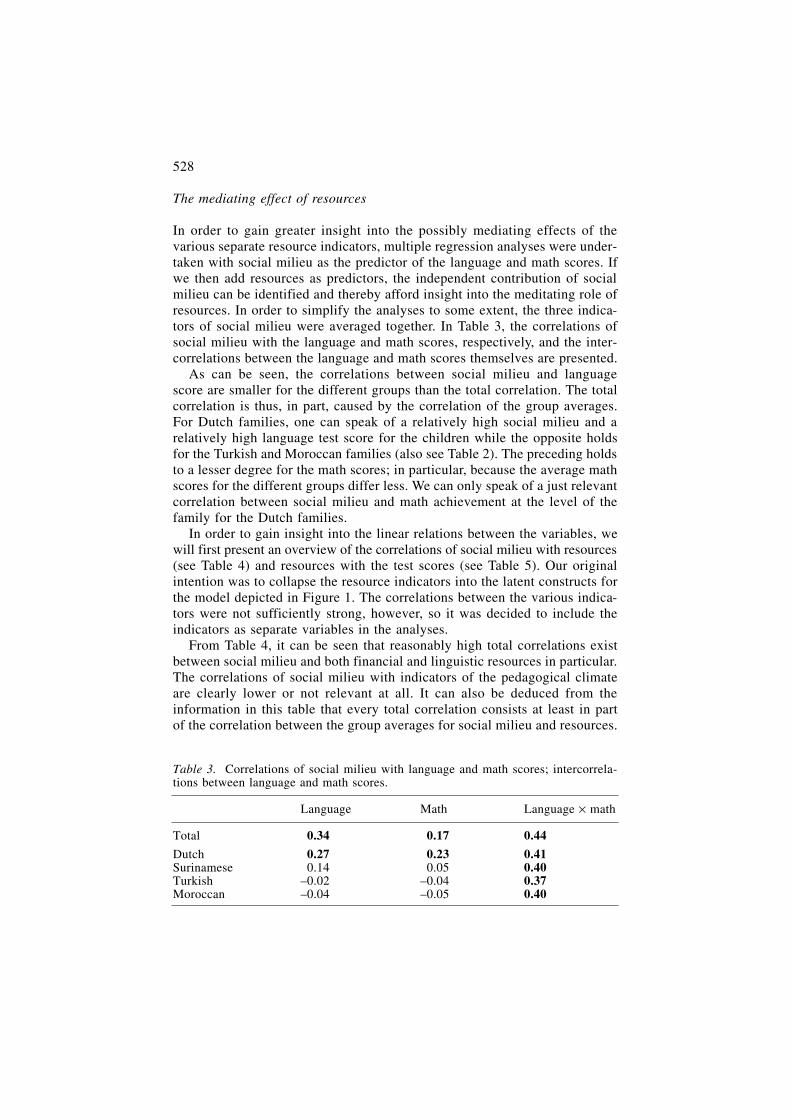
In order to gain greater insight into the possibly mediating effects of thevarious separate resource indicators, multiple regression analyses were under-taken with social milieu as the predictor of the language and math scores. Ifwe then add resources as predictors, the independent contribution of socialmilieu can be identified and thereby afford insight into the meditating role ofresources. In order to simplify the analyses to some extent, the three indica-tors of social milieu were averaged together. In Table 3, the correlations ofsocial milieu with the language and math scores, respectively, and the inter-correlations between the language and math scores themselves are presented.
As can be seen, the correlations between social milieu and languagescore are smaller for the different groups than the total correlation. The totalcorrelation is thus, in part, caused by the correlation of the group averages.For Dutch families, one can speak of a relatively high social milieu and arelatively high language test score for the children while the opposite holdsfor the Turkish and Moroccan families (also see Table 2). The preceding holdsto a lesser degree for the math scores; in particular, because the average mathscores for the different groups differ less. We can only speak of a just relevantcorrelation between social milieu and math achievement at the level of thefamily for the Dutch families.
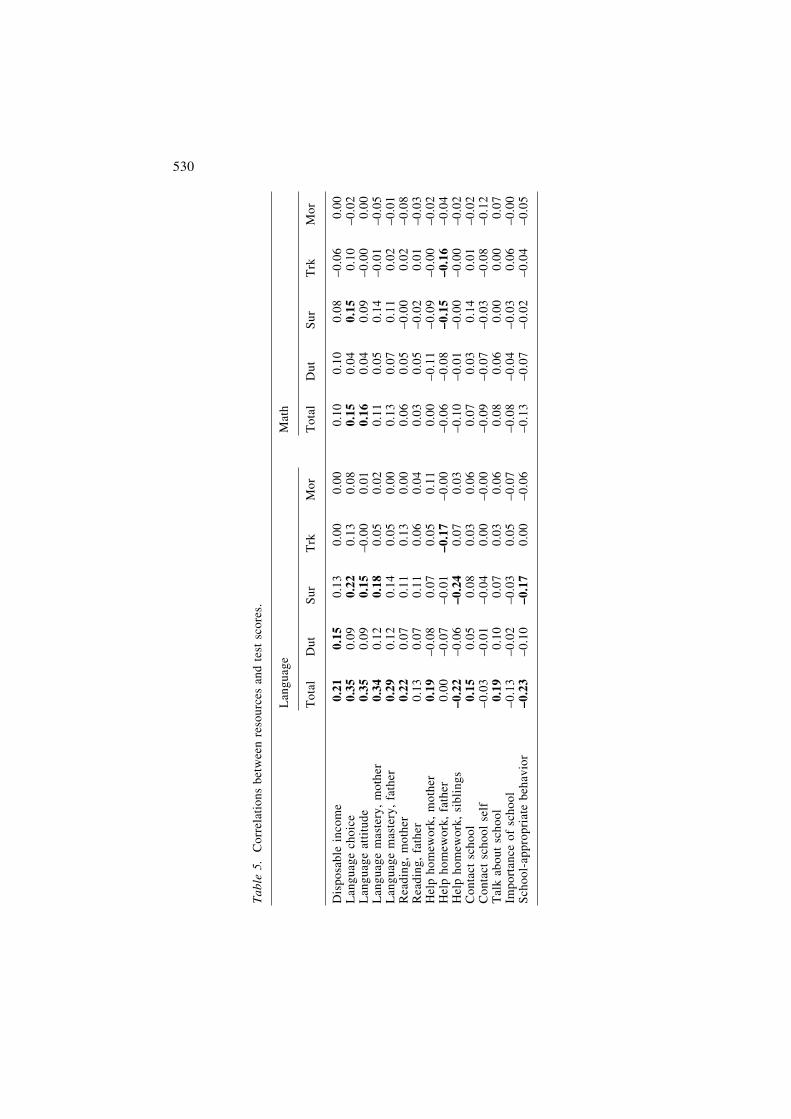
In order to gain insight into the linear relations between the variables, wewill first present an overview of the correlations of social milieu with resources(see Table 4) and resources with the test scores (see Table 5). Our originalintention was to collapse the resource indicators into the latent constructs forthe model depicted in Figure 1. The correlations between the various indica-tors were not sufficiently strong, however, so it was decided to include theindicators as separate variables in the analyses.
From Table 4, it can be seen that reasonably high total correlations existbetween social milieu and both financial and linguistic resources in particular.The correlations of social milieu with indicators of the pedagogical climateare clearly lower or not relevant at all. It can also be deduced from theinformation in this table that every total correlation consists at least in partof the correlation between the group averages for social milieu and resources.
528
Table 3. Correlations of social milieu with language and math scores; intercorrela-tions between language and math scores.
Language Math Language × math
Total –0.34 –0.17 0.44
Dutch –0.27 –0.23 0.41Surinamese –0.14 –0.05 0.40Turkish –0.02 –0.04 0.37Moroccan –0.04 –0.05 0.40
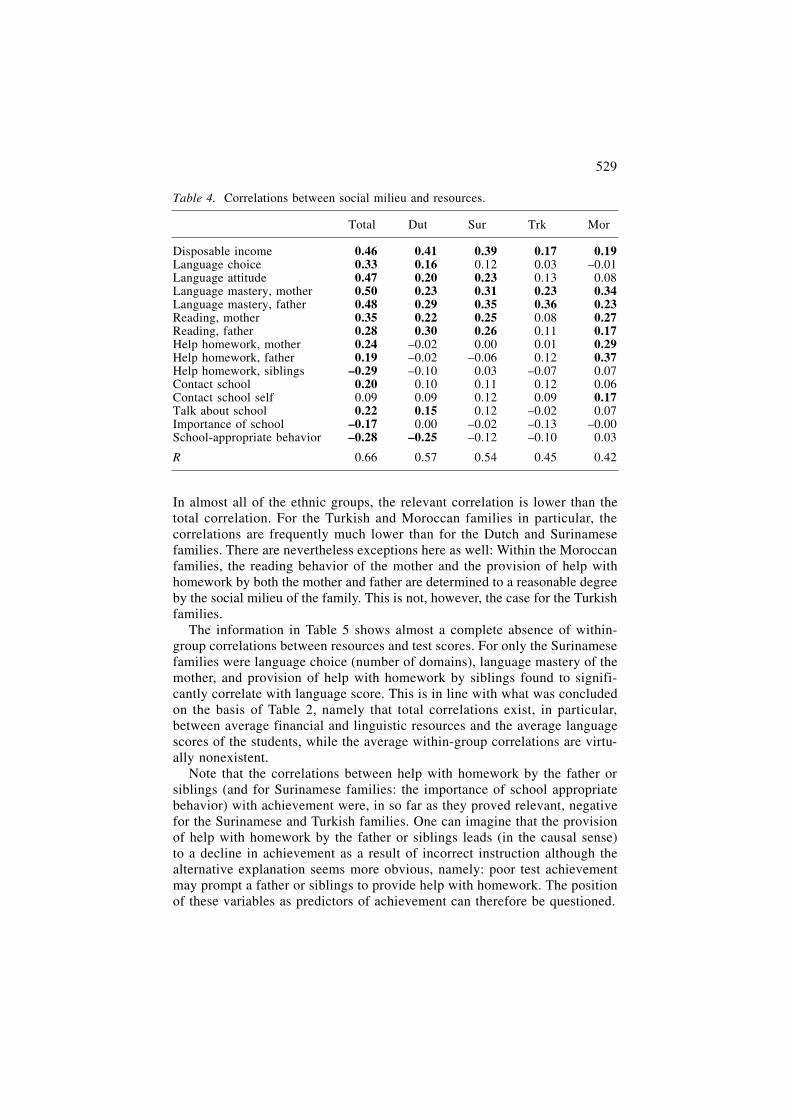
In almost all of the ethnic groups, the relevant correlation is lower than thetotal correlation. For the Turkish and Moroccan families in particular, thecorrelations are frequently much lower than for the Dutch and Surinamesefamilies. There are nevertheless exceptions here as well: Within the Moroccanfamilies, the reading behavior of the mother and the provision of help withhomework by both the mother and father are determined to a reasonable degreeby the social milieu of the family. This is not, however, the case for the Turkishfamilies.
The information in Table 5 shows almost a complete absence of within-group correlations between resources and test scores. For only the Surinamesefamilies were language choice (number of domains), language mastery of themother, and provision of help with homework by siblings found to signifi-cantly correlate with language score. This is in line with what was concludedon the basis of Table 2, namely that total correlations exist, in particular,between average financial and linguistic resources and the average languagescores of the students, while the average within-group correlations are virtu-ally nonexistent.
Note that the correlations between help with homework by the father orsiblings (and for Surinamese families: the importance of school appropriatebehavior) with achievement were, in so far as they proved relevant, negativefor the Surinamese and Turkish families. One can imagine that the provisionof help with homework by the father or siblings leads (in the causal sense)to a decline in achievement as a result of incorrect instruction although thealternative explanation seems more obvious, namely: poor test achievementmay prompt a father or siblings to provide help with homework. The positionof these variables as predictors of achievement can therefore be questioned.
529
Table 4. Correlations between social milieu and resources.
Total Dut Sur Trk Mor
Disposable income –0.46 –0.41 –0.39 –0.17 –0.19Language choice –0.33 –0.16 –0.12 –0.03 –0.01Language attitude –0.47 –0.20 –0.23 –0.13 –0.08Language mastery, mother –0.50 –0.23 –0.31 –0.23 –0.34Language mastery, father –0.48 –0.29 –0.35 –0.36 –0.23Reading, mother –0.35 –0.22 –0.25 –0.08 –0.27Reading, father –0.28 –0.30 –0.26 –0.11 –0.17Help homework, mother –0.24 –0.02 –0.00 –0.01 –0.29Help homework, father –0.19 –0.02 –0.06 –0.12 –0.37Help homework, siblings –0.29 –0.10 –0.03 –0.07 –0.07Contact school –0.20 –0.10 –0.11 –0.12 –0.06Contact school self –0.09 –0.09 –0.12 –0.09 –0.17Talk about school –0.22 –0.15 –0.12 –0.02 –0.07Importance of school –0.17 –0.00 –0.02 –0.13 –0.00School-appropriate behavior –0.28 –0.25 –0.12 –0.10 –0.03
R –0.66 –0.57 –0.54 –0.45 –0.42
530
Tab
le 5
.C
orre
lati
ons
betw
een
reso
urce
s an
d te
st s
core
s.
Lan
guag
e M
ath
Tot
alD
ut
Sur
T
rk
Mor
T
otal
Dut
S
ur
Trk
M
or
Dis
posa
ble
inco
me
–0.2
1–0
.15
–0.1
3–0
.00
–0.0
0–0
.10
–0.1
0–0
.08
–0.0
6–0
.00
Lan
guag
e ch
oice
–0.3
5–0
.09
–0.2
2–0
.13
–0.0
8–0
.15
–0.0
4–0
.15
–0.1
0–0
.02
Lan
guag
e at
titu
de
–0.3
5–0
.09
–0.1
5–0
.00
–0.0
1–0
.16
–0.0
4–0
.09
–0.0
0–0
.00
Lan
guag
e m
aste
ry,
mot
her
–0.3
4–0
.12
–0.1
8–0
.05
–0.0
2–0
.11
–0.0
5–0
.14
–0.0
1–0
.05
Lan
guag
e m
aste
ry,
fath
er–0
.29
–0.1
2–0
.14
–0.0
5–0
.00
–0.1
3–0
.07
–0.1
1–0
.02
–0.0
1R
eadi
ng,
mot
her
–0.2
2–0
.07
–0.1
1–0
.13
–0.0
0–0
.06
–0.0
5–0
.00
–0.0
2–0
.08
Rea
ding
, fa
ther
–0.1
3–0
.07
–0.1
1–0
.06
–0.0
4–0
.03
–0.0
5–0
.02
–0.0
1–0
.03
Hel
p ho
mew
ork,
mot
her
–0.1
9–0
.08
–0.0
7–0
.05
–0.1
1–0
.00
–0.1
1–0
.09
–0.0
0–0
.02
Hel
p ho
mew
ork,
fat
her
–0.0
0–0
.07
–0.0
1–0
.17
–0.0
0–0
.06
–0.0
8–0
.15
–0.1
6–0
.04
Hel
p ho
mew
ork,
sib
ling
s –0
.22
–0.0
6–0
.24
–0.0
7–0
.03
–0.1
0–0
.01
–0.0
0–0
.00
–0.0
2C
onta
ct s
choo
l–0
.15
–0.0
5–0
.08
–0.0
3–0
.06
–0.0
7–0
.03
–0.1
4–0
.01
–0.0
2C
onta
ct s
choo
l se
lf–0
.03
–0.0
1–0
.04
–0.0
0–0
.00
–0.0
9–0
.07
–0.0
3–0
.08
–0.1
2T
alk
abou
t sc
hool
–0.1
9–0
.10
–0.0
7–0
.03
–0.0
6–0
.08
–0.0
6–0
.00
–0.0
0–0
.07
Impo
rtan
ce o
f sc
hool
–0.1
3–0
.02
–0.0
3–0
.05
–0.0
7–0
.08
–0.0
4–0
.03
–0.0
6–0
.00
Sch
ool-
appr
opri
ate
beha
vior
–0.2
3–0
.10
–0.1
7–0
.00
–0.0
6–0
.13
–0.0
7–0
.02
–0.0
4–0
.05
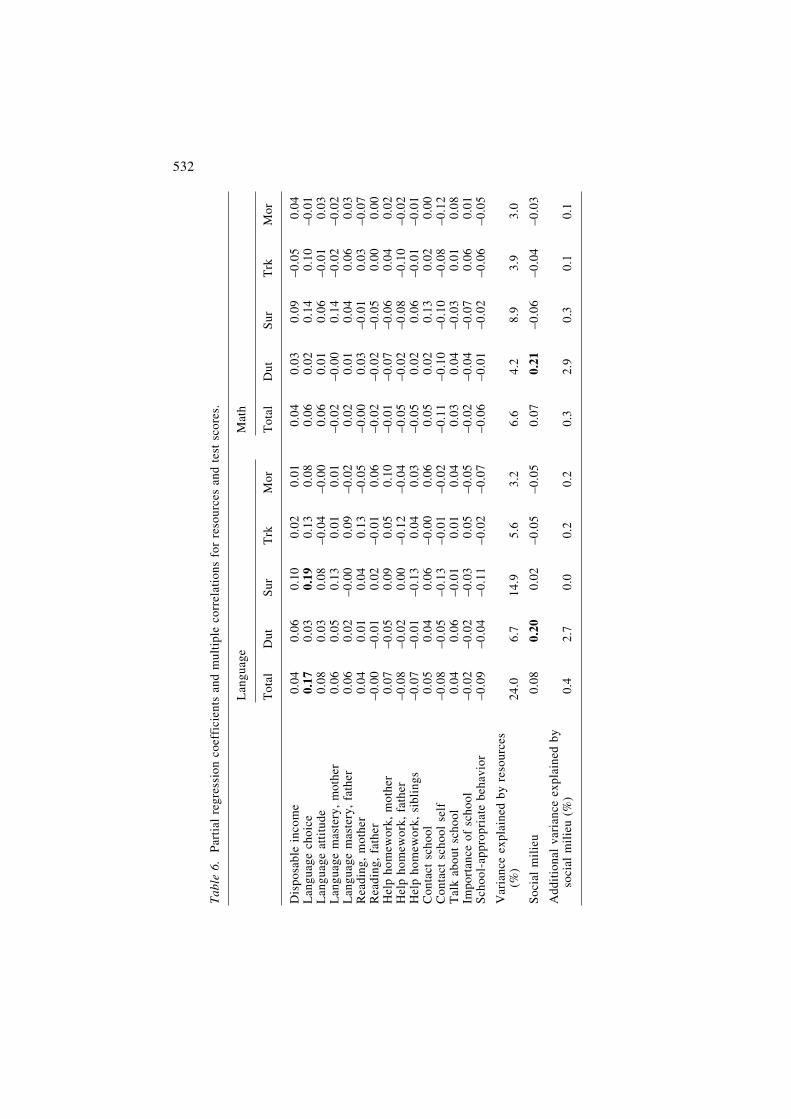
Up to this point, we have spoken about the total correlation of social milieuand resources with achievement. In doing this, however, the correlationsbetween the various resources have not been taken into consideration. In theregression analyses presented below, these correlations were therefore con-sidered and, using the partial correlation coefficients, the independent or directeffects of social milieu and resources on test scores can be determined. InTable 6, the partial correlation coefficients and the total variance explainedin the language and math scores, respectively, by all of the resources con-sidered together are presented. The increase in the amount of varianceexplained as a result of the addition of social milieu is also presented. Anyincrease is the result of the direct effects of social milieu on the testscores.
Despite the virtually complete absence of strong direct effects of resourceson test scores, one can speak of a relatively high degree of explained variancewith respect to language scores for the four groups together and within theSurinamese group. This suggests that the resources do not correlate verystrongly with each other. That is, the explained variance consists of thenumerous small contributions of various resources rather than a limitednumber of resources with a strong direct effect on achievement. Within theethnic groups themselves, the addition of social milieu was only found to beof some significance for the Dutch families. That is, we can only speak of ajust relevant direct effect of social milieu on both language and math scoreswithin the Dutch families. In Table 7, a complete summary of the precedingfindings is presented.
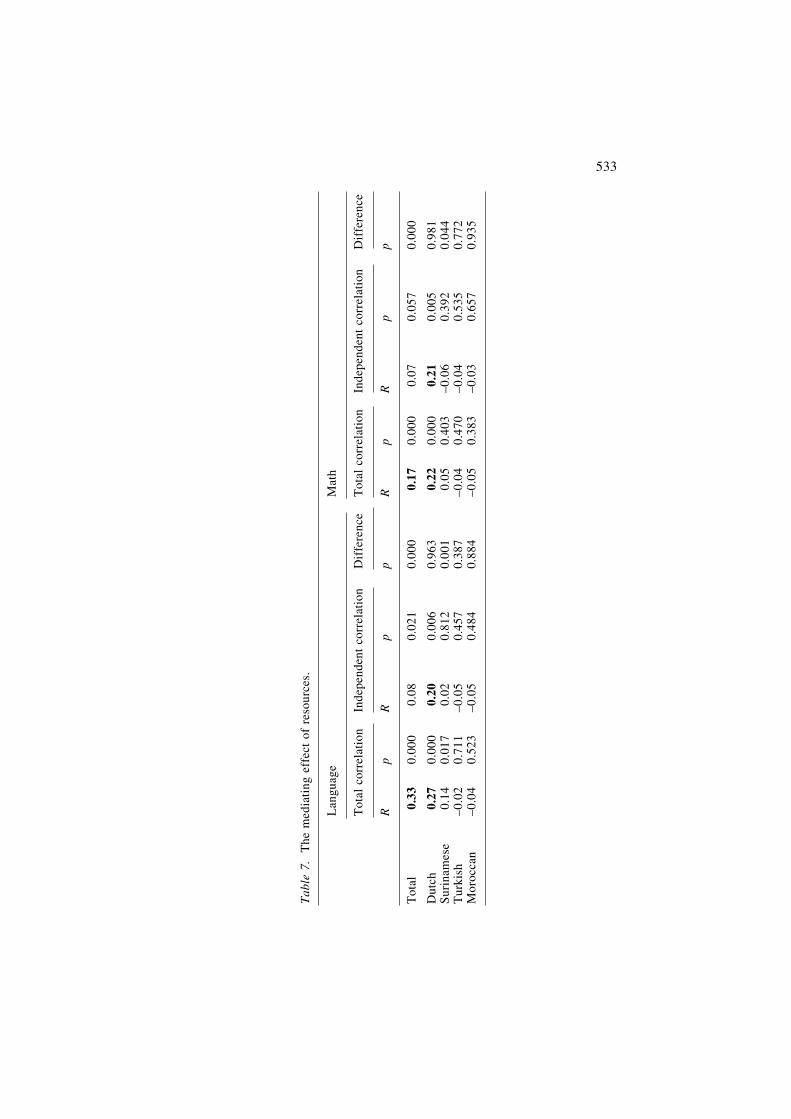
The difference between the total correlation and the partial correlation indi-cates the strength of the mediating effect of resources. We can speak of areasonably strong mediating effect of resources on the language scores. Themediating effect on the math scores is quite weak but nevertheless signifi-cant due to the large N. It can also be seen within the groups that the totaland partial correlations are only significant for the Dutch families. The medi-ating influence of resources is virtually non-existent, however. The total medi-ating influence of resources consists of all kinds of indirect effects of socialmilieu on the test scores via the resources. The indirect effect of a particularresource is equivalent to the product of the correlation between social milieuand resource (see Table 4) and the independent, i.e., partial correlation betweenresource and test score (see Table 6). In light of the almost complete absenceof direct effects of resources on test scores for math in particular, one can alsospeak of virtually no mediating effect of resources within groups. The p-values(under “difference”) show non-significant differences between the total andpartial correlations with the exception of the Surinamese families for whichthe total correlation with the language score drops from weak (0.14) to almostzero (0.02). The mediation occurs via disposable income, language choice,and language mastery by the mother, which account for the largest part ofthe indirect influence, namely: 0.39 × 0.10 + 0.12 × 0.19 + 0.31 × 0.13 = 0.10.Across groups, one can speak of a mediating effect of resources in the
531
532
Tab
le 6
.P
arti
al r
egre
ssio
n co
effi
cien
ts a
nd m
ulti
ple
corr
elat
ions
for
res
ourc
es a
nd t
est
scor
es.
Lan
guag
e M
ath
Tot
alD
ut
Sur
T
rk
Mor
T
otal
Dut
S
ur
Trk
M
or
Dis
posa
ble
inco
me
–0.0
4–0
.06
–0.1
0–0
.02
–0.0
1–0
.04
–0.0
3–0
.09
–0.0
5–0
.04
Lan
guag
e ch
oice
–0.1
7–0
.03
–0.1
9–0
.13
–0.0
8–0
.06
–0.0
2–0
.14
–0.1
0–0
.01
Lan
guag
e at
titu
de–0
.08
–0.0
3–0
.08
–0.0
4–0
.00
–0.0
6–0
.01
–0.0
6–0
.01
–0.0
3L
angu
age
mas
tery
, m
othe
r–0
.06
–0.0
5–0
.13
–0.0
1–0
.01
–0.0
2–0
.00
–0.1
4–0
.02
–0.0
2L
angu
age
mas
tery
, fa
ther
–0.0
6–0
.02
–0.0
0–0
.09
–0.0
2–0
.02
–0.0
1–0
.04
–0.0
6–0
.03
Rea
ding
, m
othe
r–0
.04
–0.0
1–0
.04
–0.1
3–0
.05
–0.0
0–0
.03
–0.0
1–0
.03
–0.0
7R
eadi
ng,
fath
er–0
.00
–0.0
1–0
.02
–0.0
1–0
.06
–0.0
2–0
.02
–0.0
5–0
.00
–0.0
0H
elp
hom
ewor
k, m
othe
r–0
.07
–0.0
5–0
.09
–0.0
5–0
.10
–0.0
1–0
.07
–0.0
6–0
.04
–0.0
2H
elp
hom
ewor
k, f
athe
r–0
.08
–0.0
2–0
.00
–0.1
2–0
.04
–0.0
5–0
.02
–0.0
8–0
.10
–0.0
2H
elp
hom
ewor
k, s
ibli
ngs
–0.0
7–0
.01
–0.1
3–0
.04
–0.0
3–0
.05
–0.0
2–0
.06
–0.0
1–0
.01
Con
tact
sch
ool
–0.0
5–0
.04
–0.0
6–0
.00
–0.0
6–0
.05
–0.0
2–0
.13
–0.0
2–0
.00
Con
tact
sch
ool
self
–0.0
8–0
.05
–0.1
3–0
.01
–0.0
2–0
.11
–0.1
0–0
.10
–0.0
8–0
.12
Tal
k ab
out
scho
ol–0
.04
–0.0
6–0
.01
–0.0
1–0
.04
–0.0
3–0
.04
–0.0
3–0
.01
–0.0
8Im
port
ance
of
scho
ol–0
.02
–0.0
2–0
.03
–0.0
5–0
.05
–0.0
2–0
.04
–0.0
7–0
.06
–0.0
1S
choo
l-ap
prop
riat
e be
havi
or–0
.09
–0.0
4–0
.11
–0.0
2–0
.07
–0.0
6–0
.01
–0.0
2–0
.06
–0.0
5
Var
ianc
e ex
plai
ned
by r
esou
rces
(%
)24
.0–6
.714
.9–5
.6–3
.2–6
.6–4
.2–8
.9–3
.9–3
.0
Soc
ial
mil
ieu
–0.0
8–0
.20
–0.0
2–0
.05
–0.0
5–0
.07
–0.2
1–0
.06
–0.0
4–0
.03
Add
itio
nal
vari
ance
exp
lain
ed b
y so
cial
mil
ieu
(%)
–0.4
–2.7
–0.0
–0.2
–0.2
–0.3
–2.9
–0.3
–0.1
–0.1
533
Tab
le 7
. T
he m
edia
ting
eff
ect
of r
esou
rces
.
Lan
guag
e M
ath
Tot
al c
orre
lati
onIn
depe
nden
t co
rrel
atio
nD
iffe
renc
eT
otal
cor
rela
tion
Inde
pend
ent
corr
elat
ion
Dif
fere
nce
Rp
Rp
pR
pR
pp
Tot
al–0
.33
0.00
0–0
.08
0.02
10.
000
–0.1
70.
000
–0.0
70.
057
0.00
0
Dut
ch–0
.27
0.00
0–0
.20
0.00
60.
963
–0.2
20.
000
–0.2
10.
005
0.98
1S
urin
ames
e–0
.14
0.01
7–0
.02
0.81
20.
001
–0.0
50.
403
–0.0
60.
392
0.04
4T
urki
sh–0
.02
0.71
1–0
.05
0.45
70.
387
–0.0
40.
470
–0.0
40.
535
0.77
2M
oroc
can
–0.0
40.
523
–0.0
50.
484
0.88
4–0
.05
0.38
3–0
.03
0.65
70.
935
prediction of language scores as a result in part of the higher correlationsbetween social milieu and resources.
Conclusions
On the basis of the results presented here, the following conclusions can bedrawn.2
• There are no systematic differences between the ethnic groups with respectto the total and independent effects of social milieu on test scores. The cor-relations do not differ systematically from the very weak average within-group correlation.
• The average direct effects of social milieu on language and math achieve-ment are only very weak.
• Within ethnic groups, there is no mediating effect of resources. An excep-tion is the Surinamese group with respect to the prediction of languagescore, where mediating effects of disposable income per person, languagechoice, and language mastery by the mother are found.
• Across groups, one can speak of a mediating effect of resources with respectto the prediction of language score as a result of the higher correlationsbetween social milieu and resources.
• The results suggest that the total effect of social milieu on achievement inethnic groups presupposed in previous research may be a level of inter-pretation error. The presupposition is namely that the effect exists at thelevel of the family/student, but this is only very partly the case: The effectlies more at the level of the separate ethnic groups. The presupposed medi-ation of this relation by cultural resources also appears to rest on the samelevel of interpretation error.
The research described here is fairly unique in the Netherlands. Large-scale,quantitative research into the effects of cultural capital in which the ethnicorigin of the participants is explicitly taken into consideration is only sporadic.Research in which separate analyses are conducted for the different ethnicgroups and the results of these analyses are then compared has not been con-ducted. Our study must therefore be seen as an attempt to explore differencesin various aspects of capital among ethnic groups. A limitation of the studyis that the data were not specifically collected for testing the cultural capitalthesis for different ethnic groups. However, in this respect our study does notdiffer from most of the studies we reviewed.
What the present study shows is that it may be relevant to split the totalsample into separate subgroups to examine the ethnic factor. Findings thathold for the entire sample may not necessarily hold for each of the ethnicgroups separately. This may be caused by differences in the distributions ofthe variables to be explained and the explanatory variables (the restriction-of-range problem) and their inter-relations within the different groups (see
534
Leseman and Van den Boom 1999). With regard to Bourdieu’s reproductionthesis, the present findings provide no confirmation. In follow-up research,the significance of cultural capital within each of the ethnic groups should beconsidered along with the extent to which the concept can be compared acrossgroups. The fundamental question stemming from the present study is whetherit is even possible to study the effects of cultural capital across groups inlight of the fact that little or no variation for both indicators of cultural capitaland achievement can be detected in some groups and the fact that culturalcapital is generally defined according to the standards of higher status groups.This conclusion expands on the comments of Lareau and McNamara Horvat(1999: 50) who observed that “Any form or type of capital derives value onlyin relation to the specific field of interaction.” Our conclusion also fits withthe suggestion of Roscigno and Ainsworth-Darnell (1999: 173), namely “thatdifferential racial returns are a consequence of the inapplicability of the statusattainment model to nonwhites” (see also Okagaki and Frensch 1998). Themethodological problem of contamination of specific strongly cultural definedindicators with ethnic origin also needfully requires further study. The enter-tainment of separate indicators of capital for each ethnic group does not,however, offer much solace for this problem as the groups become incom-parable. A solution to this dilemma will not be easy to find, thus.
Acknowledgments
I would like to express my gratitude to the Netherlands’ Organization forScientific Research (NWO) for funding the project on which this article isbased. This research was made possible by grant # 575-53-013 from NWO’sFoundation for Behavioral and Educational Sciences. I would also like to thankAdrie Claassen and Jan Doesborgh for their help with the review of the lit-erature and the empirical analyses, respectively.
Notes
1. For the analyses of variance, some of the categories for the predictor variables werecollapsed: the two highest categories of education “higher professional education”and “university education”; the occupational categories “schooled laborer”and“lower employee”; income was divided into five categories ranging from (1) “upto 500 guilders” to (5) “1100 guilders or more”; language choice was reduced tothree categories (1) “one or no domains of use”, (2) “two to three domains”, and(3) “four domains”; language attitude was dichotomized as (1) “considers speakingDutch important for the child” or (2) “does not consider speaking Dutch impor-tant for the child”; language mastery was dichotomized as (1) “none” or (2) “allfour aspects well”; reading behavior had five categories ranging from (1) “two orfewer hours” to (5) “eleven or more hours”; for contact with the teacher, “almostnever” was collapsed with “usually”; for talking about school, the two lowest cat-egories “less than once a week” and “once per week” were collapsed; for impor-
535
tance of education, the two lowest categories “disagree completely” and “disagree”were collapsed; and importance of school appropriate behavior had five categoriesranging from (1) < 2.6, to (5) > 3.4.
2. Multi-sample LISREL analyses were also conducted on the same data; theresults of these analyses did not differ from the multiple regression results reportedhere.
References
Ainsworth-Darnell, J. and Downey, D. 1998. Assessing the Oppositional CultureExplanation for Racial/Ethnic Differences in School Performance. AmericanSociological Review 63: 536–553.
Aschaffenburg, K. and Maas, I. 1997. Cultural and Educational Careers: The Dynamicsof Social Reproduction. American Sociological Review 62: 573–587.
Bankston, C., Caldas, S. and Zhou, M. 1997. The Academic Achievement ofVietnamese American Students: Ethnicity as Social Capital. Sociological Focus 30:1–16.
Bianchi, S. and Robinson, J. 1997. What Did You Do Today? Children’s Use of Time,Family Composition, and the Acquisition of Social Capital. Journal of Marriage andthe Family 59: 332–344.
Bourdieu, P. and Passeron, J.-C. 1977. Reproduction in Education, Society, Culture.Beverly Hills, CA: Sage.
Carrington, V. and Luke, A. 1997. Literacy and Bourdieu’s Sociological Theory: AReframing. Language and Education 11: 96–112.
Coleman, J. 1988. Social Capital in the Creation of Human Capital. American Journalof Sociology 94: s95–s120.
Covrig, D. 1996. Fundamentalists, Social Capital, and Children’s Welfare: A Placefor Religion in Public Education? Journal of Educational Policy 12: 53–60.
De Graaf, P. 1986. The Impact of Financial and Cultural Resources on EducationalAttainment in the Netherlands. Sociology of Education 59: 237–246.
DiMaggio, P. 1982. Cultural Capital and School Success: The Impact of Status CultureParticipation on the Grades of US High School Students. American SociologicalReview 47: 189–210.
Downey, D. 1995. When Bigger is Not Better: Family Size, Parental Resources, andChildren’s Educational Performance. American Sociological Review 60: 746–761.
Driessen, G. 1993. Achtergronden van Onderwijsprestaties. De Rol vanGezinsstructurele en Gezinspedagogische Kenmerken. Stimulans 11: 14–17.
Driessen, G. 2000. The Limits of Educational Policy and Practice? The Case of EthnicMinority Pupils in the Netherlands. Comparative Education 36: 55–72.
Driessen, G. and Dekkers, H. 1997. Educational Opportunities in the Netherlands.Policy, Students’ Performance and Issues. International Review of Education 43:299–315.
Driessen, G., Doesborgh, J. and Claassen, A. 1999. Cultureel Kapitaal, EtnischeHerkomst en Onderwijsprestaties. Nijmegen: ITS.
Driessen, G., Mulder, L. and Jungbluth, P. 1999. Structural and Cultural Determinants
536
of Educational Opportunities in the Netherlands, in S. Weil, ed., Roots and Routes:Ethnicity and Migration in Global Perspective (83–104). Jerusalem: Magnes Press.
Driessen, G. and Vierke, H. 1999. Abordar la Igualdad y la Calidad Educativas aTravés de la Investigación: Como Ejemplo un Estudio Nacional de Cohortes. Revistade Educación 319: 37–60.
Farkas, G. et al. 1990. Cultural Resources and School Success: Gender, Ethnicity,and Poverty Groups within an Urban School District. American Sociological Review55: 127–142.
Furstenberg, F. and Hughes, M. 1995. Social Capital and Successful Developmentamong At-Risk Youth. Journal of Marriage and the Family 57: 580–592.
Gillborn, D. 1997. Ethnicity and Educational Performance in the United Kingdom:Racism, Ethnicity, and Variability in Achievement. Anthropology & EducationQuarterly 28: 375–393.
Kalmijn, M. and Kraaykamp, G. 1996. Race, Cultural Capital, and Schooling: AnAnalysis of Trends in the United States. Sociology of Education 69: 22–34.
Lareau, A. and McNamara Horvat, E. 1999. Moments of Social Inclusion andExclusion. Race, Class, and Cultural Capital in Family-School Relationships. Sociologyof Education 72: 37–53.
Leseman, P. et al. 1995. Gezinsdeterminanten van de Cognitieve Ontwikkeling vanVierjarige Nederlandse, Surinaamse en Turkse Kleuters. Pedagogische Studiën 72:186–205.
Leseman, P. and van de Boom, D. 1999. Effects of Quantity and Quality of HomeProximal Processes on Dutch, Surinamese-Dutch and Turkish-Dutch Pre-schoolers’Cognitive Development. Infant and Child Development 8: 19–38.
Okagaki, L. and Frensch, P. 1998. Parenting and Children’s School Achievement: AMultiethnic Perspective. American Educational Research Journal 35: 123–144.
Roscigno, V. and Ainsworth-Darnell, J. 1999. Race, Cultural Capital, and EducationalResources: Persistent Inequalities and Achievement Returns. Sociology of Education72: 158–178.
Rossi, R. and Montgomery, A. 1994. Educational Reforms and Students at Risk. AReview of the Current State of the Art. Washington, DC: US Department of Education.
Runyan, D. et al. 1998. Children Who Prosper in Unfavorable Environments: TheRelationship to Social Capital. Pediatrics 101: 12–18.
Stanton-Salazar, R. 1997. A Social Captital Framework for Understanding theSocialization of Racial Minority Children and Youths. Harvard Educational Review67: 1–40.
Sullivan, L. 1997. Hip-Hop Nation: The Underdeveloped Social Capital of BlackUrban America. National Civic Review 86: 235–243.
Teachman, J., Paasch, K. and Carver, K. 1996. Social Capital and the Generation ofHuman Capital. Social Forces 75: 1343–1359.
Tesser, P. and Mulder, L. 1990. Cultureel Kapitaal en Schoolprestaties in hetBasisonderwijs. in C. Klaassen and P. Jungbluth, eds., Onderwijs Research Dagen1990. Onderwijs en Samenleving (39–51). Nijmegen: ITS.
Van der Velden, R. 1991. Sociale Herkomst en Schoolsucces. Het Effect van Cultureleen Sociale Hulpbronnen op de Schoolloopbaan. Groningen: RION.
537
White, M. and Kaufman, G. 1997. Language Usage, Social Capital, and SchoolCompletion among Immigrants and Native-Born Ethnic Groups. Social ScienceQuarterly 78: 385–398.
The author
Geert Driessen is an educational researcher at the Institute for Applied Social Sciences(ITS) of the University of Nijmegen, the Netherlands. His major research interestsinclude ethnic and social inequality in education.
Contact address: Dr. Geert Driessen, ITS, Universiteit van Nijmegen, Postbus 9048,6500 KJ Nijmegen, the Netherlands. E-mail: [email protected].
538