Embed Size (px)
Citation preview

Bunker Silage Storage Leachate and
Runoff Management
April 2, 2015
Waste to Worth, Seattle, WA
Becky Larson, Assistant Professor and Extension Specialist,
University of Wisconsin-Madison
Aaron Wunderlin, Discovery Farms
Eric Cooley, Discovery Farms
Mike Holly, Ph.D. Student UW-Madison

Bunker Silage Storage

Loading and Compaction

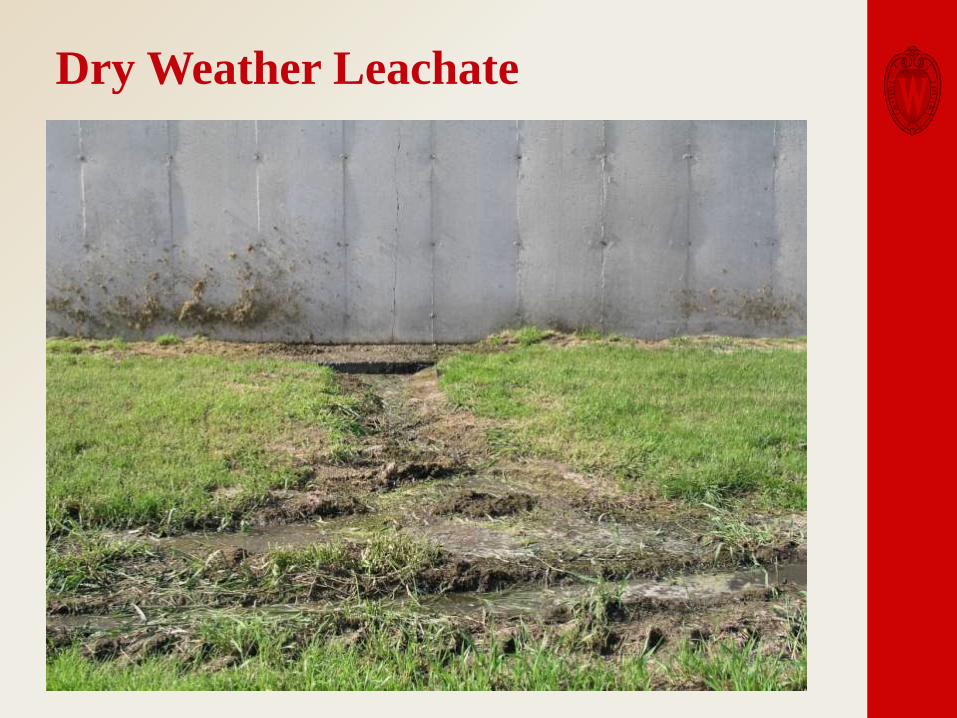
Dry Weather Leachate

Leachate Production Based on
Dry Matter Content
Bastiman (1976) and Bastiman and Altman (1985) (– - - –); Sutter (1957) (– - – -); Zimmer (1974) (– – –); Haigh (1999) (—)
(Haigh, 1999)
Recommended harvest moisture
65 - 70% Corn Silage
60 - 65% Hay Silage

Mc Donald 1981, Referencing Bastiman 1976
Timing Leachate Production

Dry Weather Leachate
Constituent Leachate1
Liq. Dairy Manure2
Dry Matter 2-10% 5%
Total N (mg/L) 1,500-4,400 2,600
P (mg/L) 300-600 1,100
K (mg/L) 3,400-5,200 2,500
pH 3.6-5.5 7.4
BOD (mg/L) 12,000-90,000 5,000-10,000
1Cornell 1994 2Clarke and Stone 1995
Dry Weather Leachate

Dry Weather Leachate

Corrosive - Concrete Erosion

Runoff

Snowmelt Runoff

Runoff Concentrations
Constituent Leachate1
Liq. Dairy Manure2 Runoff
Dry Matter 5% (2-10%) 5% 0 - 4.6%
Total N (mg/L) 1,500-4,400 2,600 20 - 1,356
P (mg/L) 300-600 1,100 8 - 659
K (mg/L) 3,400-5,200 2,500 n/a
pH 3.6-5.5 7.4 4 - 7
BOD (mg/L) 12,000-90,000 5,000-10,000 500 - 61,210

Impacts of Runoff

Impacts of Runoff

Rain Water Infiltration

Management to Minimize Silage Storage
Runoff Constituent Concentrations
• Cover
• Top
• Maintaining face (minimize exposure)
• Cover/wrap side walls
• Cover when filling if rain is forecast (minimize water additions)
• Clean pad (remove litter) particularly if rain event is forecast
• Cover spoilage and litter until removal (removal can include many options, land application, composting, digestion, among others)

Silage Storage Collection System Design
Objectives
• Minimize collection volumes• Reduce hauling requirements
• Reduce environmental impact• Collect high strength waste for storage and land
application
• Send low strength waste to treatment systems
Current System Design
• Capture the initial volume and send to storage as it has the highest concentrations
• This assumed a first flush scenario exists where the first portion of the runoff has higher strength than remaining runoff, unconfirmed
• First flush exists in urban runoff, though it would follow this pattern

Collection

Collection Designs are Numerous

Collection Designs

Treatment Using Filter Strips

Does a First-Flush Exist?

Normalized COD Data - AARS

Normalized BOD5 Data

Normalized TKN Data – Farm A
0%
10%
20%
30%
40%
50%
60%
70%
80%
90%
100%
0% 10% 20% 30% 40% 50% 60% 70% 80% 90% 100%
% e
ven
t lo
ad
% event flow
Event Load:Flow Ratio (5%): TKN - Farm A

Normalized TKN Data – Farm C
0%
10%
20%
30%
40%
50%
60%
70%
80%
90%
100%
0% 10% 20% 30% 40% 50% 60% 70% 80% 90% 100%
% e
ven
t lo
ad
% event volume
Event Load:Flow Ratio (5%): Total Kjeldahl Nitrogen - Farm C
TKN - Farm C# % # % # % # % # %
Above 2 7% 6 21% 6 21% 3 10% --- ---
W/in 29 100% 22 76% 22 76% 25 86% 29 100%
Below --- --- 1 3% 1 3% 1 3% 0 0%
Above 8 28% 10 34% 9 31% 8 28% 2 7%
W/in 21 72% 17 59% 16 55% 18 62% 26 90%
Below 0 0% 2 7% 4 14% 3 10% 1 3%
Flow (%)
10 20 50 80 90
10%
5%

Normalized Phosphorus Data – Farm A
0%
10%
20%
30%
40%
50%
60%
70%
80%
90%
100%
0% 10% 20% 30% 40% 50% 60% 70% 80% 90% 100%
% e
ven
t lo
ad
% event flow
Event Load:Flow Ratio (5%): TP - Farm A
TP - Farm A# % # % # % # % # %
Above 0 0% 2 4% 0 0% 0 0% --- ---
W/in 51 100% 44 86% 33 65% 36 71% 39 76%
Below --- --- 5 10% 18 35% 15 29% 12 24%
Above 2 4% 3 6% 3 6% 0 0% 0 0%
W/in 46 90% 28 55% 23 45% 26 51% 31 61%
Below 3 6% 20 39% 25 49% 25 49% 20 39%
5%
10%
10 90805020
Flow (%)

Normalized Phosphorus Data – Farm C
0%
10%
20%
30%
40%
50%
60%
70%
80%
90%
100%
0% 10% 20% 30% 40% 50% 60% 70% 80% 90% 100%
% e
ven
t lo
ad
% event volume
Event Load:Flow Ratio (5%): Total Phosphorus - Farm C
TP - Farm C# % # % # % # % # %
Above 0 0% 0 0% 2 7% 0 0% --- ---
W/in 28 100% 28 100% 26 93% 28 100% 28 100%
Below --- --- 0 0% 0 0% 0 0% 0 0%
Above 2 4% 5 10% 8 16% 3 6% 0 0%
W/in 26 93% 21 75% 17 61% 23 82% 27 96%
Below 0 0% 2 4% 3 6% 2 4% 1 2%
10%
5%
Flow (%)
10 20 50 80 90

Relationship of Flow vs. Concentration

Constituent Correlations
• All constituent data (TKN, TP, TS, COD, BOD) was
statistically correlated EXCEPT pH which was
negatively correlated

Total TKN Loading
0
500
1,000
1,500
2,000
2,500
Load
(lb
s)
2013 Cummulative Total Kjeldahl Nitrogen Loading: Farm A
Collected To VTA
2007 lbs
1359 lbs

Total TKN Loading
0
500
1,000
1,500
2,000
2,500
3,000
3,500
Load
(lb
s)
2014 Cummulative Total Kjeldahl Nitrogen Loading: Farm A
Collected To VTA
2235 lbs
2901 lbs

Total TKN Loading
0
50
100
150
200
250
300
350
Load
(lb
s)
2013 Cummulative Total Kjeldahl Nitrogen Loading: Farm C
Collected To VTA
60 lbs
315 lbs

Total P Loading
0
60
120
180
240
300
360
420
480
540
Load
(lb
s)
2013 Cummulative Total Phosphorus Loading: Farm A
Collected To VTA
470 lbs
317 lbs

Total P Loading
0
100
200
300
400
500
600
700
800
900
Load
(lb
s)
2014 Cummulative Total Phosphorus Loading: Farm A
Collected To VTA
687 lbs
782 lbs

Total P Loading
0
10
20
30
40
50
60
70
80
Load
(lb
s)
2013 Cummulative Total Phosphorus Loading: Farm C
Collected To VTA
10 lbs
58 lbs

Collection Design Recommendation
• First flush does not exist so collecting initial runoff does not target collecting the greatest load per volume collected
• Recommended to collect low flows only (stop collecting during high flows)
• If the system design to shut off during high flows is not practical, collect low flows throughout the storm
• Additional collection of runoff within 2 weeks of filling will increase load collection
• Grade your pad to ensure all flows enter at one central collection point
• Check pad for cracks or other potential issues and repair
• Provide subsurface drainage to collect leachate which permeates through the pad

Low Flow Collection
• Calculations show a greater loading collected when collecting the low flow
• Low flow was calculated using 1% of the peak flowrate from a 2-year 24-hour design storm
• Peak runoff flowrates can be calculated using the Rational Method (although there are many methods which you can use to do this)
• These can be calculated by hand or using software such as HydroCAD

Conductivity Meter to Route High
Strength Runoff to Storage
0
5,000
10,000
15,000
20,000
25,000
30,000
35,000
40,000
0
100
200
300
400
500
600
700
800
0 4 8 12 16 20 24 28 32
Co
nce
ntr
atio
n (
mg/
l)
Flo
w (
gal/
min
) &
Co
nd
uct
ivit
y ((
us/
cm)/
10
)
Hours
Example Event with Conductivity: COD
Flow ConductivityMid-pt Discrete

Thank You!


![Unit Hydrograph (UNIT-HG) Model · RUNOFF#0 – RUNOFF#N Where N= RUNOFF_UNIT Units for RUNOFF State Variables [mm or in] Sample States File: RUNOFF#0=0.0 RUNOFF#1=0.0 RUNOFF#2=9.0](https://img.dokumen.tips/doc/110x75/5ece307d6bbfcd2591178fc8/unit-hydrograph-unit-hg-model-runoff0-a-runoffn-where-n-runoffunit-units.jpg)