Embed Size (px)
Citation preview

Thomas Estermann
Director Funding, Governance and Public Policy Development
European University Association
Porto
7 October 2016
European Funding
A call for dialogue to increase efficiency

Content
I. Key challenges on
• Sustainability of funding
• Sufficiency of funding
• Simplification
ll. How to increase efficiency
in the future

EUA member consultation 2016
Erasmus+
• 218 higher education institutions from 36 countries
• The main contributors come from Poland, Germany, Spain, Italy and UK
• Variety of type and size of institutions
• Most institutions with experience in the programme
Horizon 2020
• 153 higher education institutions from 28 countries
• The main contributors from Germany, Spain, Italy, Poland and UK
• Variety of type and size of institutions
• Majority has more then 10 H2020 projects
3

Impact of national public funding
on European funding
• Discrepancies between the systems continue to grow. • Many national funders that have cut funding expect their universities
to compensate the loss through European funding.
European funding under pressure
• Low efficiency of public investment due to
Low success rate
Low cost-benefit ratio
High application and management costs
Lost opportunity
• Increasing use of loans to the detriment of grants
EFSI

Exceptionally low success rate
• Overall success rate goes down from 26% in FP5, down to 19% in FP7 to 14% or even lower in Horizon 2020
• More than 1/5 of respondents to the member consultation note lower success rate in H2020
• Success rates in Erasmus+ vary greatly across the actions, (e.g., 18% in KA2 and 4% in Knowledge Alliances)
26%
18%19%
14%
FP5 FP6 FP7 H2020
Evolution of success rate (proposals)
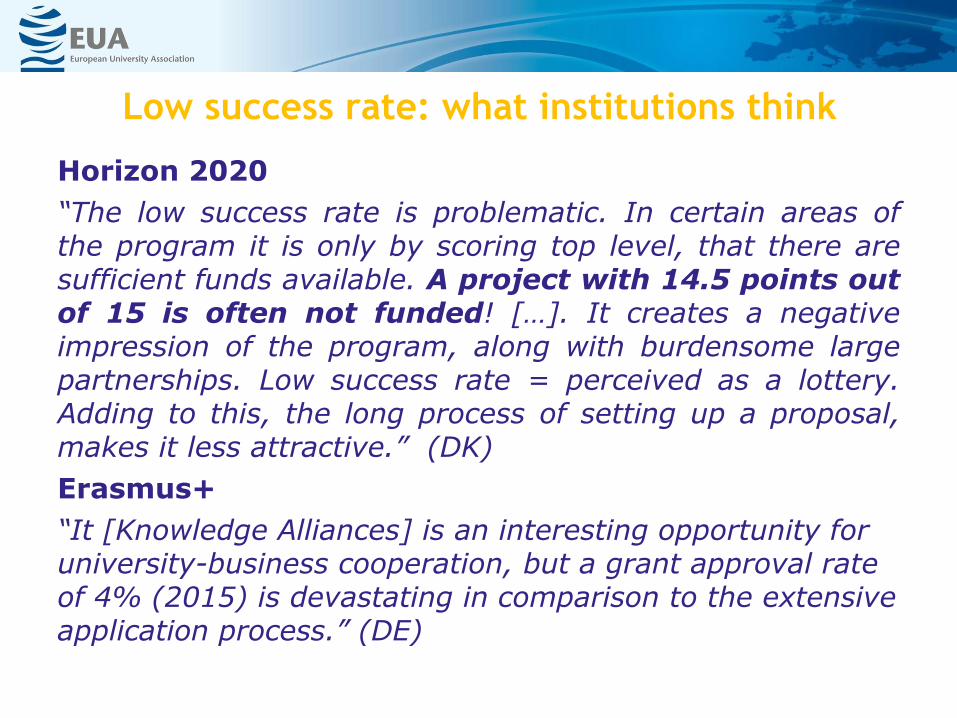
Low success rate: what institutions think
Horizon 2020
“The low success rate is problematic. In certain areas ofthe program it is only by scoring top level, that there aresufficient funds available. A project with 14.5 points outof 15 is often not funded! […]. It creates a negativeimpression of the program, along with burdensome largepartnerships. Low success rate = perceived as a lottery.Adding to this, the long process of setting up a proposal,makes it less attractive.” (DK)
Erasmus+
“It [Knowledge Alliances] is an interesting opportunity for university-business cooperation, but a grant approval rate of 4% (2015) is devastating in comparison to the extensive application process.” (DE)

Low success rate: what does this mean?
• Has an impact on academic behaviour and motivation.
• Leads to waste of top research ideas and new scientific discoveries.
• Low success rates = Inefficiency
=> How much does it cost to participate and who bears these additional costs?
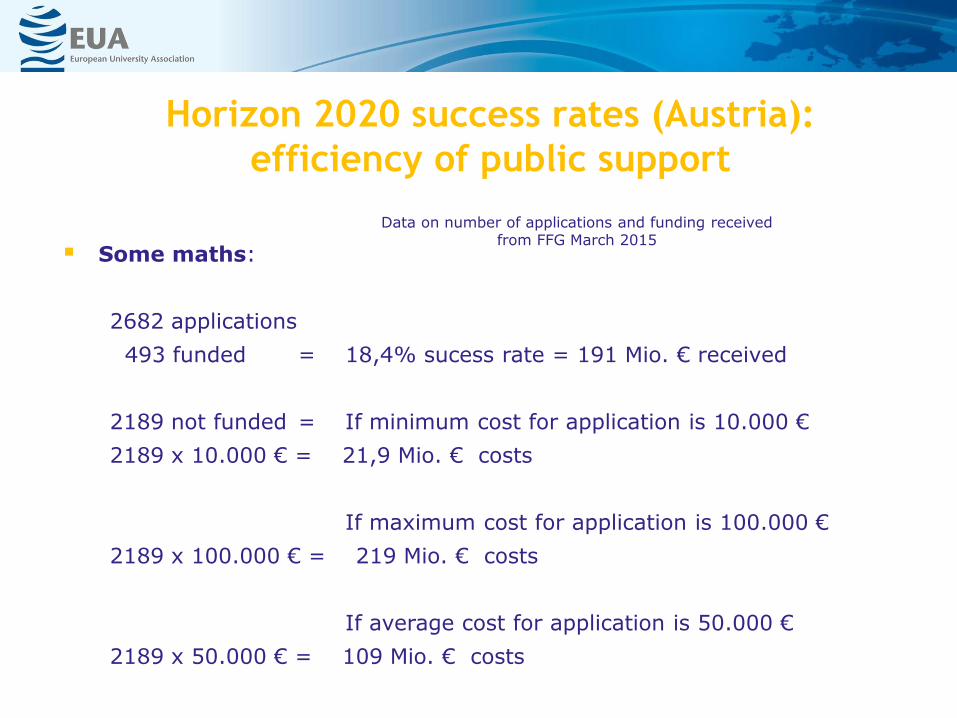
Horizon 2020 success rates (Austria):
efficiency of public support
Some maths:
2682 applications
493 funded = 18,4% sucess rate = 191 Mio. € received
2189 not funded = If minimum cost for application is 10.000 €
2189 x 10.000 € = 21,9 Mio. € costs
If maximum cost for application is 100.000 €
2189 x 100.000 € = 219 Mio. € costs
If average cost for application is 50.000 €
2189 x 50.000 € = 109 Mio. € costs
Data on number of applications and funding received from FFG March 2015

Horizon 2020 success rates (system-wide):
efficiency of public support
Some maths:
31115 eligible applications
4315 funded = 13,86% sucess rate = 5.5 bn € received
26800 not funded = If minimum cost for application is 10.000 €
26800 x 10.000 € = 268 Mio. € costs
If maximum cost for application is 100.000 €
26800 x 100.000 € = 2.68 bn € costs
If average cost for application is 50.000 €
26800 x 50.000 € = 1.34 bn € costs
Data on number of applications and funding for the first 100 calls of H2020
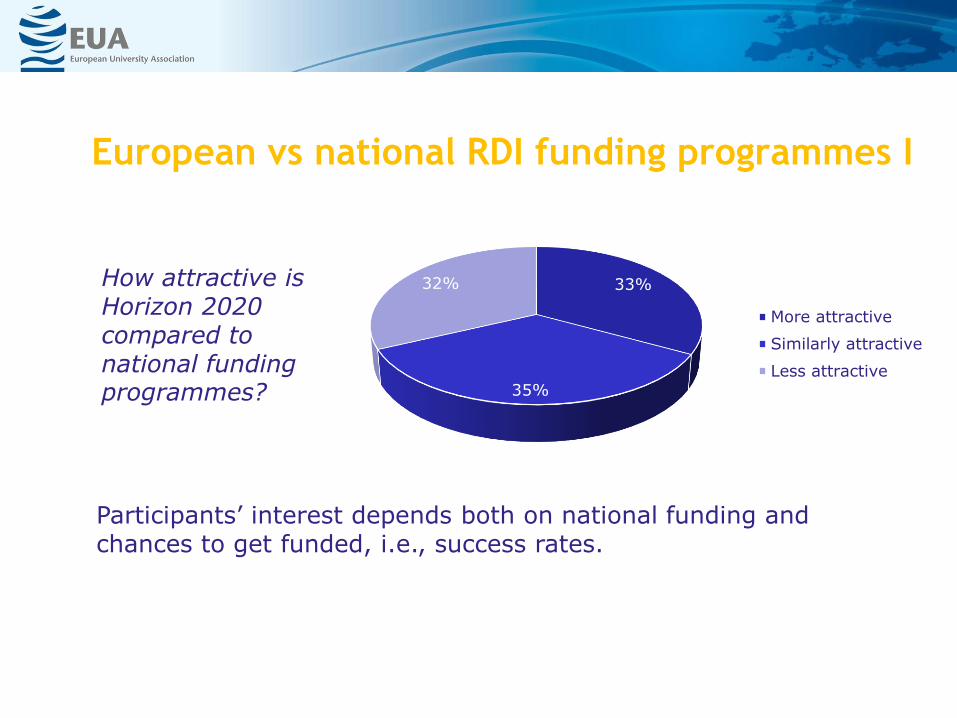
European vs national RDI funding programmes I
33%
35%
32%
More attractive
Similarly attractive
Less attractive
How attractive is Horizon 2020 compared to national funding programmes?=1
43)
Participants’ interest depends both on national funding and chances to get funded, i.e., success rates.
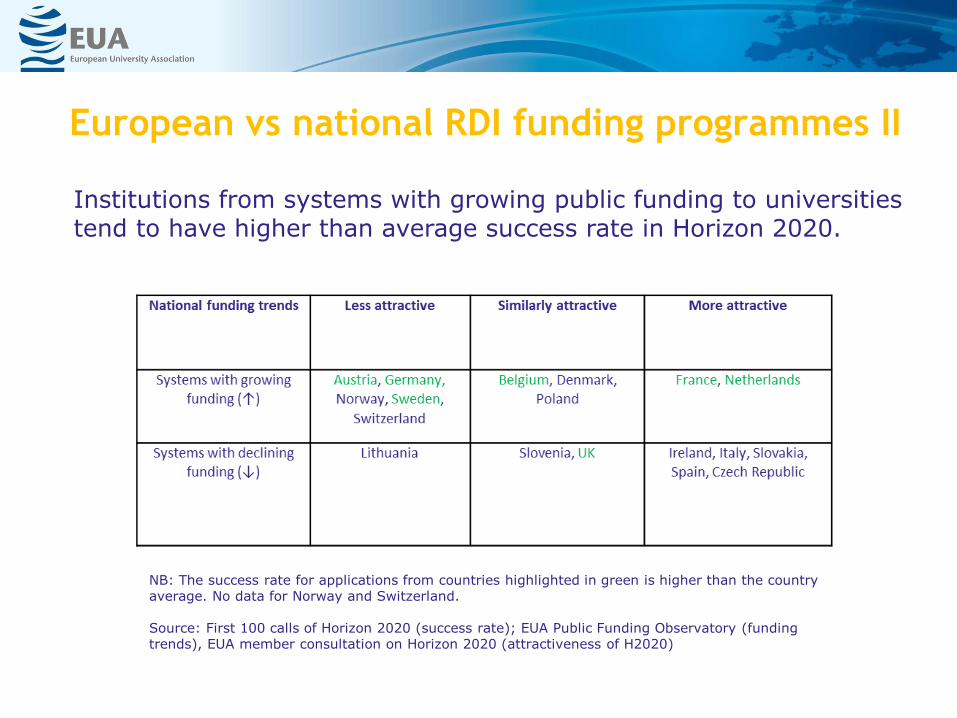
European vs national RDI funding programmes II
NB: The success rate for applications from countries highlighted in green is higher than the country average. No data for Norway and Switzerland.
Source: First 100 calls of Horizon 2020 (success rate); EUA Public Funding Observatory (funding trends), EUA member consultation on Horizon 2020 (attractiveness of H2020)
Institutions from systems with growing public funding to universities tend to have higher than average success rate in Horizon 2020.

EFSI: what’s in it for universities?
Lack of interest in EFSI:
Hardly any university has
engaged with EFSI so far
Universities are active in other
schemes for close-to-market innovation
(e.g., FTI) based on grants
EFSI has failed so far to deliver
upon its promise to bring universities and industry together within joint RDI.
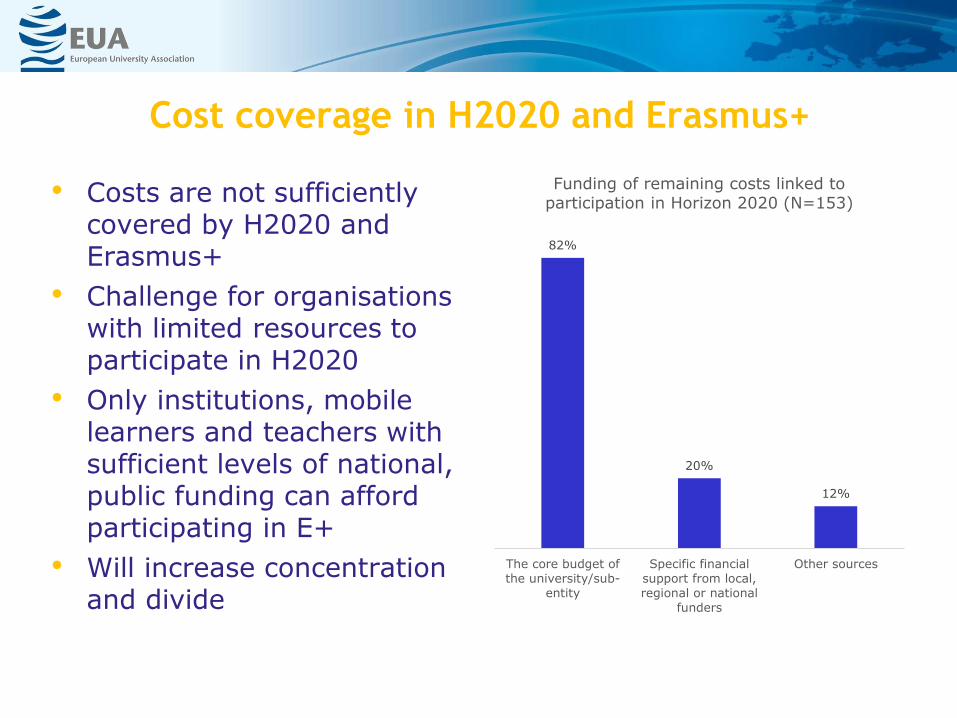
Cost coverage in H2020 and Erasmus+
• Costs are not sufficiently covered by H2020 and Erasmus+
• Challenge for organisations with limited resources to participate in H2020
• Only institutions, mobile learners and teachers with sufficient levels of national, public funding can afford participating in E+
• Will increase concentration and divide
82%
20%
12%
The core budget of
the university/sub-
entity
Specific financial
support from local,
regional or national
funders
Other sources
Funding of remaining costs linked to participation in Horizon 2020 (N=153)

Cost coverage in Erasmus+
▪
• Cost coverage is for 69 % an obstacle to participation in mobility
• Cost coverage is for 62 % an obstacle to participation in Cooperation

Simplification under Erasmus+
A high number of respondents note the increased administrative burden of Erasmus+, in particular for the Key Action 1 (KA1) mobility programmes.
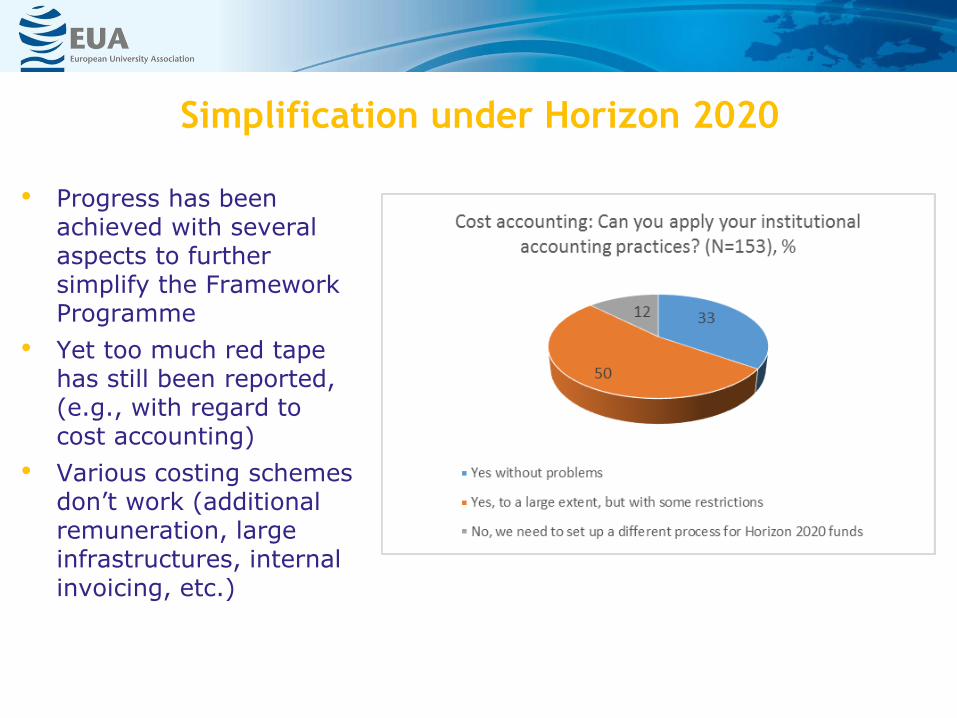
Simplification under Horizon 2020
• Progress has been achieved with several aspects to further simplify the Framework Programme
• Yet too much red tape has still been reported, (e.g., with regard to cost accounting)
• Various costing schemes don’t work (additional remuneration, large infrastructures, internal invoicing, etc.)

Efficiency and Effectiveness
Erasmus+ and H2020 are delivering high added value!
• High return on public investment
• New R&D expenditures
• Growth in GDP
• Jobs
• Collaboration
• Student and staff mobility
High effectiveness but low efficiency
Some thoughts on how to increase efficiency
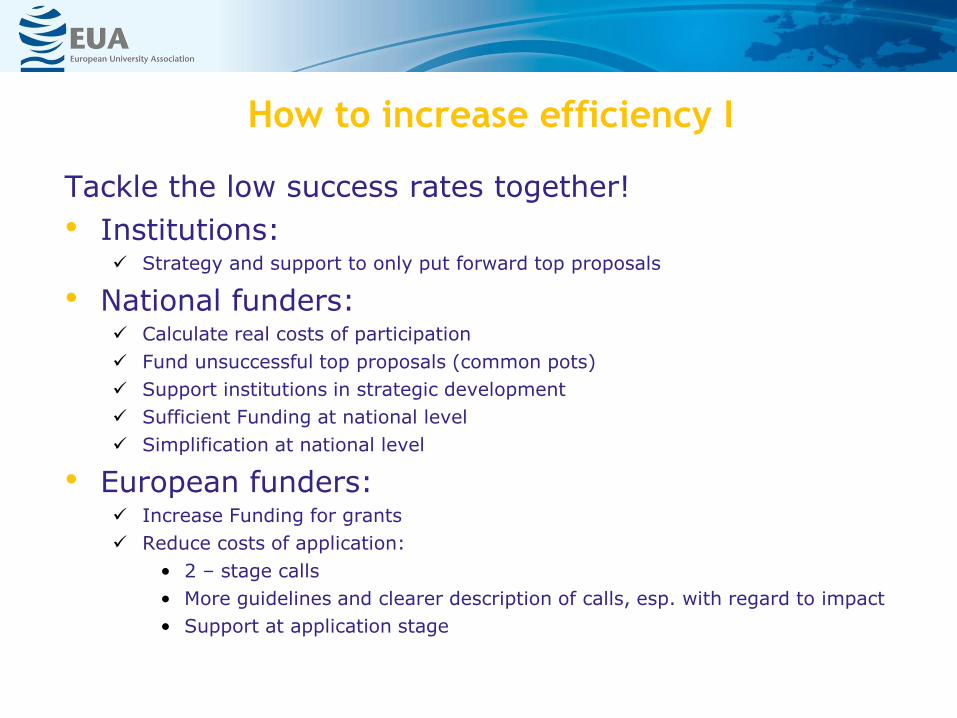
How to increase efficiency I
Tackle the low success rates together!
• Institutions: Strategy and support to only put forward top proposals
• National funders: Calculate real costs of participation
Fund unsuccessful top proposals (common pots)
Support institutions in strategic development
Sufficient Funding at national level
Simplification at national level
• European funders: Increase Funding for grants
Reduce costs of application:
• 2 – stage calls
• More guidelines and clearer description of calls, esp. with regard to impact
• Support at application stage
How to increase efficiency II
Reduce costs of participation through Simplification!
European Funders:
• Accept nationally recognised costing methodologies and institutional management and accounting practices
• Calculation of personal costs
• Time recording
Build a trust-based funding system!

Together towards sustainability
• Universities Strategic approach to funding and awareness of costs
• National Funders Don’t expect European funding to replace cuts at national level and invest in
university sector
• European Funders Increase grant funding for research and education instead of loan funding

THANK YOU!More information, data and studies:
www.eua.be
Contact:
www.eua.be
@ThomasEstermann / @euatweets