Embed Size (px)
Citation preview

CORRELATIONALDESIGNS [CD]
RESEARCH METHODOLOGY GB6013 - UKM [TESL GROUP]
GROUP MEMBERS
DHACHAINI A/P PRABHAKARAN (GP03743)JASIDAH IDANG (GP03760)
KUMARESEN A/L MAHALINGAM (GP03771)LU HUI PING (GP04061)
VIMALA A/P P. MOOKIAH (GP03810)

POINTS OF DISCUSSION1. WHAT IS CD?
2. WHEN TO USE CD?
3. HOW DID CD DEVELOP?
4. TYPES OF CD
5. KEY CHARACTERISTICS OF CD
6. HOW TO CONDUCT CORRELATIONAL STUDY?
7. HOW TO EVALUATE CORRELATIONAL STUDY?
* Reference: Cresswell, J.A. (2008) Educational Research: Planning, Conducting, and Evaluating Quantitative and Qualitative Research. Third Edition. Pearson Prentice Hall. USA.
WHAT IS CORRELATIONAL RESEARCH
According to Creswell, correlational research designs are used by investigators to describe and measure the degree of relationship between two or more variables or sets of scores.
A procedure in which subjects’ scores on two variables are simply measured, without manipulation of any variables, to determine whether there is a relationship.
Correlational research examines the relationship between two or more non manipulated variables.
WHAT IS CORRELATIONAL RESEARCH
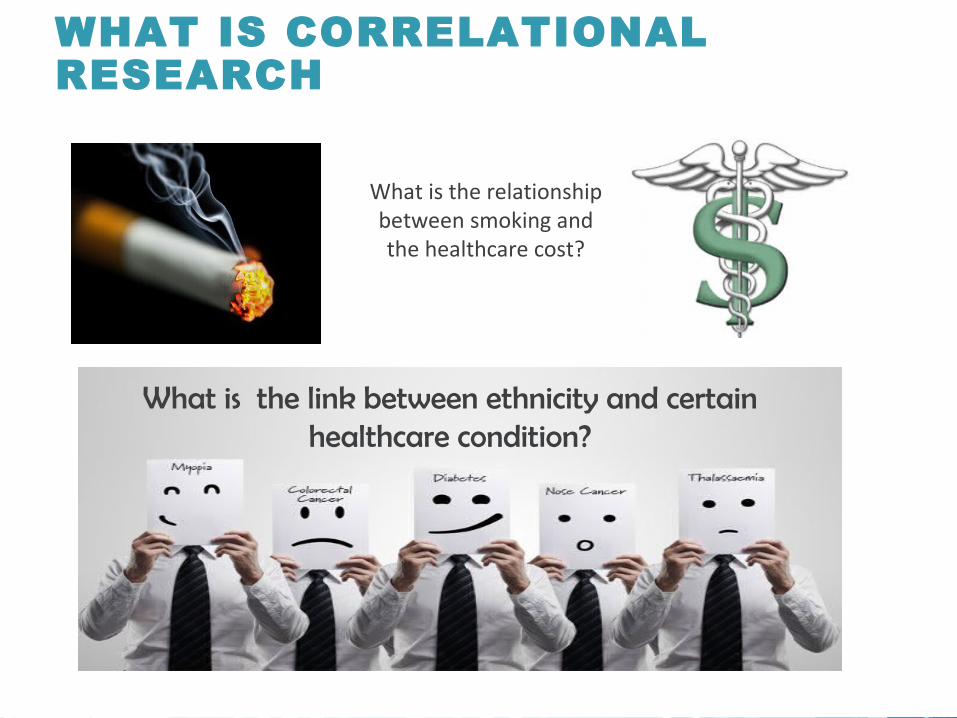
What is the relationship between smoking and the healthcare cost?
What is the link between ethnicity and certain healthcare condition?
WHEN DO WE USE CD?
when we want to see if there is a relationship between variables or to predict an outcome.
important NOTE:
Correlation can be positive or negative.
There is no perfect 1:1 relationship between items
Correlations cannot tell us the cause of any relationship.
WHEN DO WE USE CD?
simple example:
We, as teachers, practice correlation research often in the forms of pre-tests, quizzes, etc., where we correlate (based on years of experience) the outcome of these assessments with anticipated final test results. We will often modify our teaching in response to the data to modify the outcome.

HOW DID CD DEVELOP? Late 19th century
Karl Pearson (1895) correlation formula
Yule (1897) theory of regression & the ability to predict scores using info based on
correlating correlation coefficients.
Spearman (1904) Spearman's rho
Fisher (1935) significant testing & ANOVA
Campbell & Stanley (1963) new impetus (encouraged researchers to both recognize and specify the
extensive threats to validity in this form of research)
Advent of computers

HOW DID CD DEVELOP? Statisticians first developed the procedures for
calculating the correlation statistics in the late 19th century (Cowles, 1989).
Karl Pearson presented the familiar correlation formula we know today in a paper before the Royal Society in England in November 1895 (Cowles, 1989).
In 1897, Yule (Pearson’s student) developed solutions for correlating two, three, and four variables.
With Pearson, Yule also advanced the theory of regression and the ability to predict scores using information based on correlating correlation coefficients.
HOW DID CD DEVELOP? During the 1970s and 1980s, quantitative researchers
started the correlation studies.
Hence, with computers, they could statistically remove the effects of a large number variables to examine the relationship among a small set of variables.
For example, they could explore the combination of variables (eg. Gender, age, and SAT scores) and an outcome (e.g., college grade point average)
TYPES OF CD
The two primary correlation designs:-
1. THE EXPLANATORY/explanation DESIGN
2. THE PREDICTION DESIGN
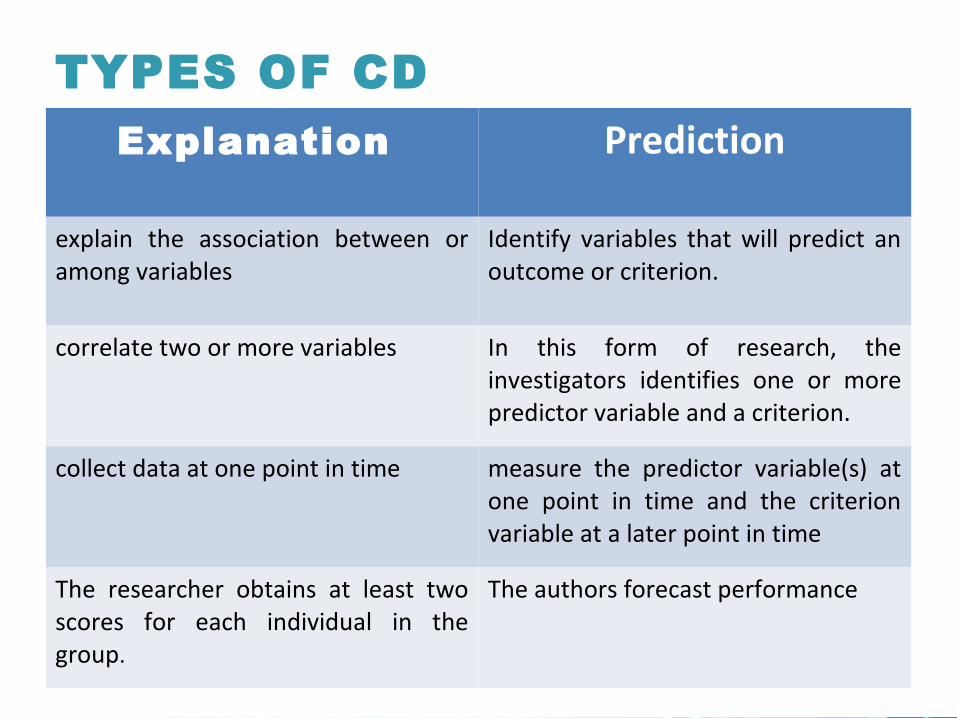
TYPES OF CDExplanation Prediction
explain the association between or among variables
Identify variables that will predict an outcome or criterion.
correlate two or more variables In this form of research, the investigators identifies one or more predictor variable and a criterion.
collect data at one point in time measure the predictor variable(s) at one point in time and the criterion variable at a later point in time
The researcher obtains at least two scores for each individual in the group.
The authors forecast performance
THE EXPLANATION DESIGN Other names of this designs:
• 'relational' research (Cohen & Manion, 1994, p.123)• 'accounting-for-variance studies' (Punch, 1998, p.78)• 'explanatory' research (Fraenkel & Wallen, 2000, p.
360)
Is a correlational design in which we are interested in the extent to which two/more variables co-vary.
Consists of a simple association between two or more variables.
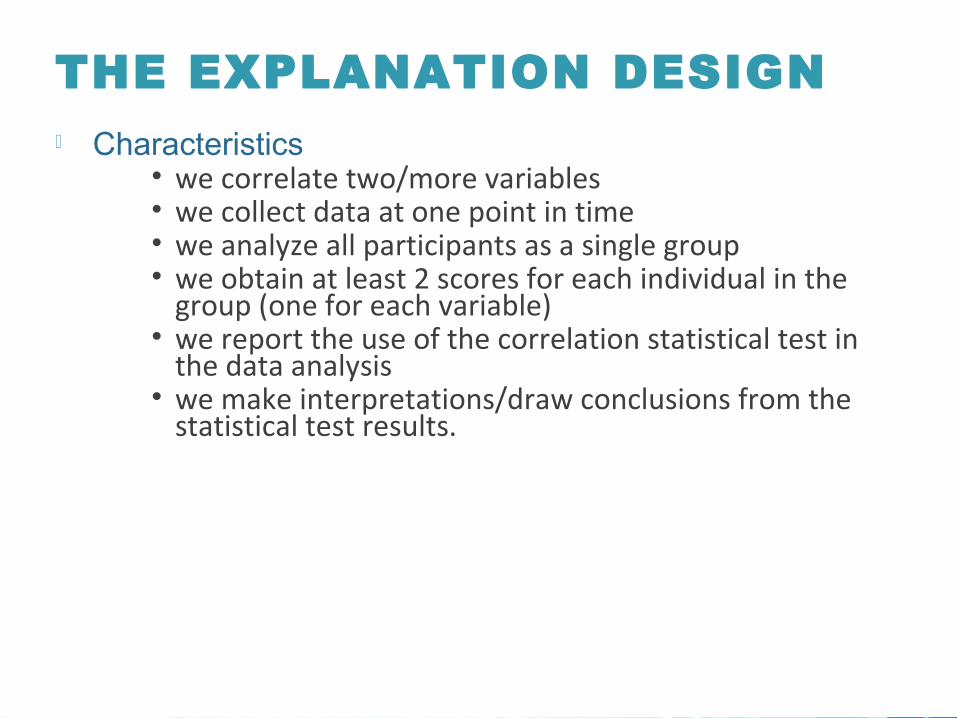
THE EXPLANATION DESIGN Characteristics
• we correlate two/more variables• we collect data at one point in time• we analyze all participants as a single group• we obtain at least 2 scores for each individual in the
group (one for each variable)• we report the use of the correlation statistical test in
the data analysis• we make interpretations/draw conclusions from the
statistical test results.
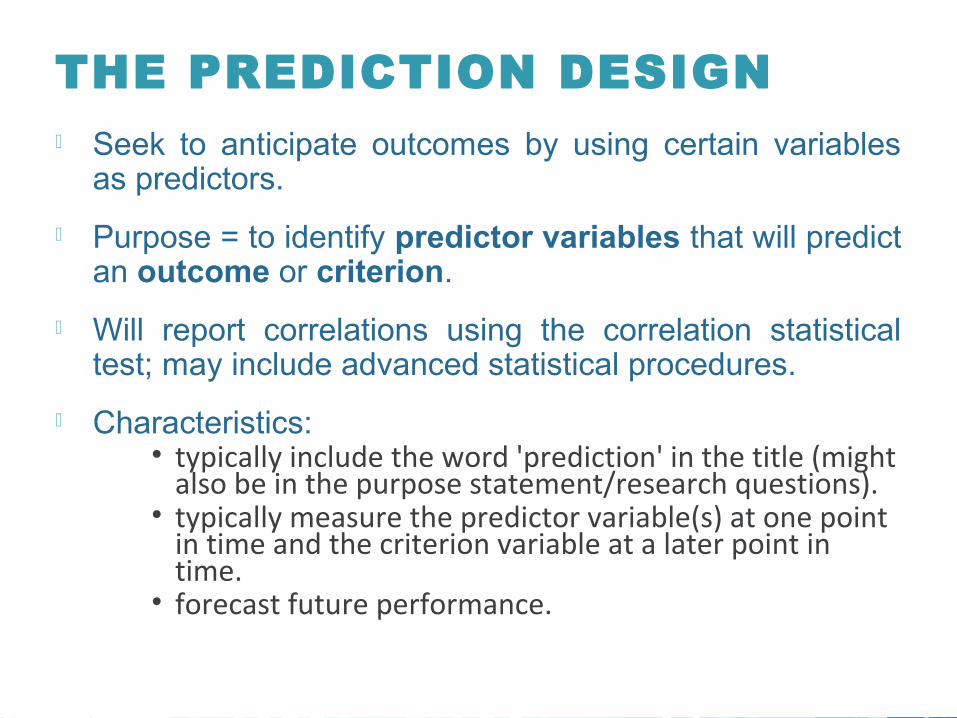
THE PREDICTION DESIGN Seek to anticipate outcomes by using certain variables
as predictors.
Purpose = to identify predictor variables that will predict an outcome or criterion.
Will report correlations using the correlation statistical test; may include advanced statistical procedures.
Characteristics:• typically include the word 'prediction' in the title (might
also be in the purpose statement/research questions).• typically measure the predictor variable(s) at one point
in time and the criterion variable at a later point in time.
• forecast future performance.
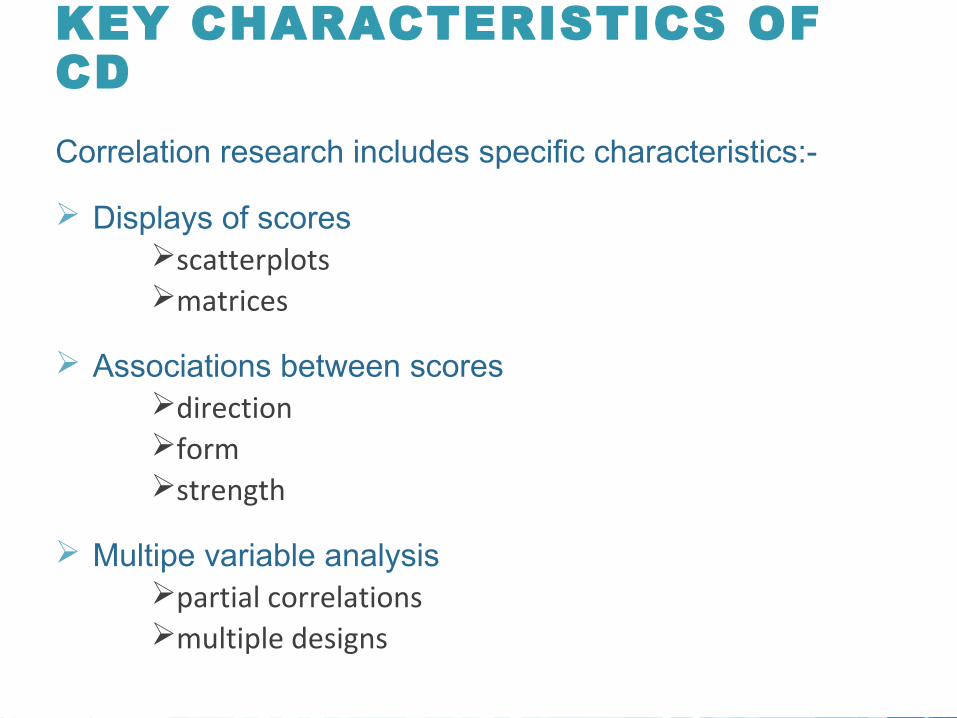
KEY CHARACTERISTICS OF CDCorrelation research includes specific characteristics:-
Displays of scoresscatterplotsmatrices
Associations between scoresdirectionformstrength
Multipe variable analysispartial correlationsmultiple designs

Scatterplot are
vitally important to
correlational
research as they
allow researchers
to determine:
The degree of the
association
The form of the
association
The type of association
The existence of extreme
scores
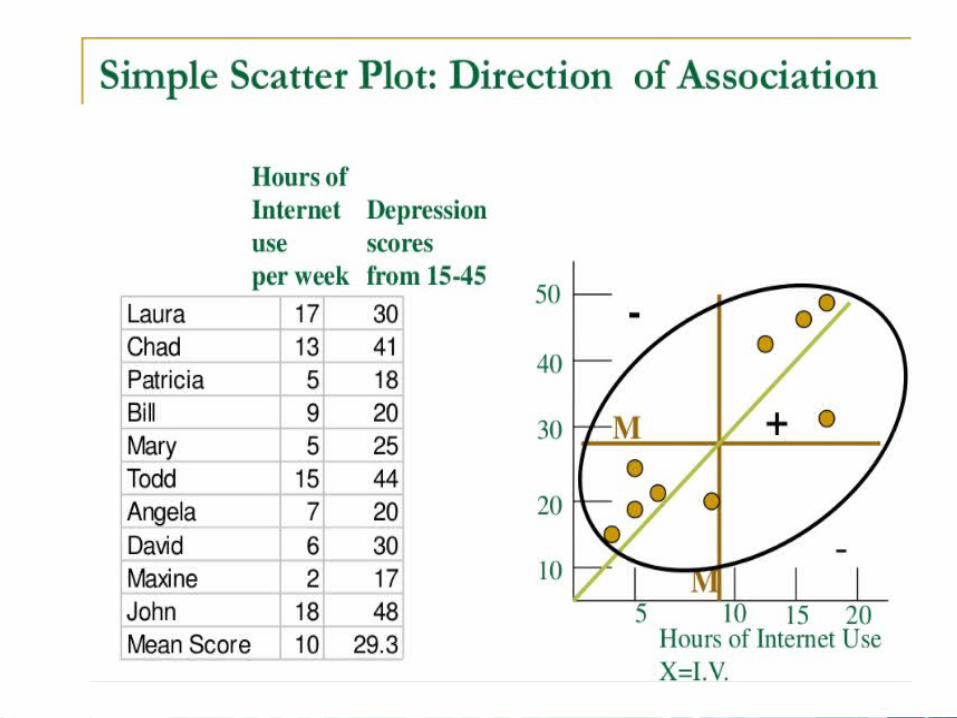
The direction of the
association

The form of the
relationship
Linear Non-Linear
Positive Negative

Positive Non-Linear Negative

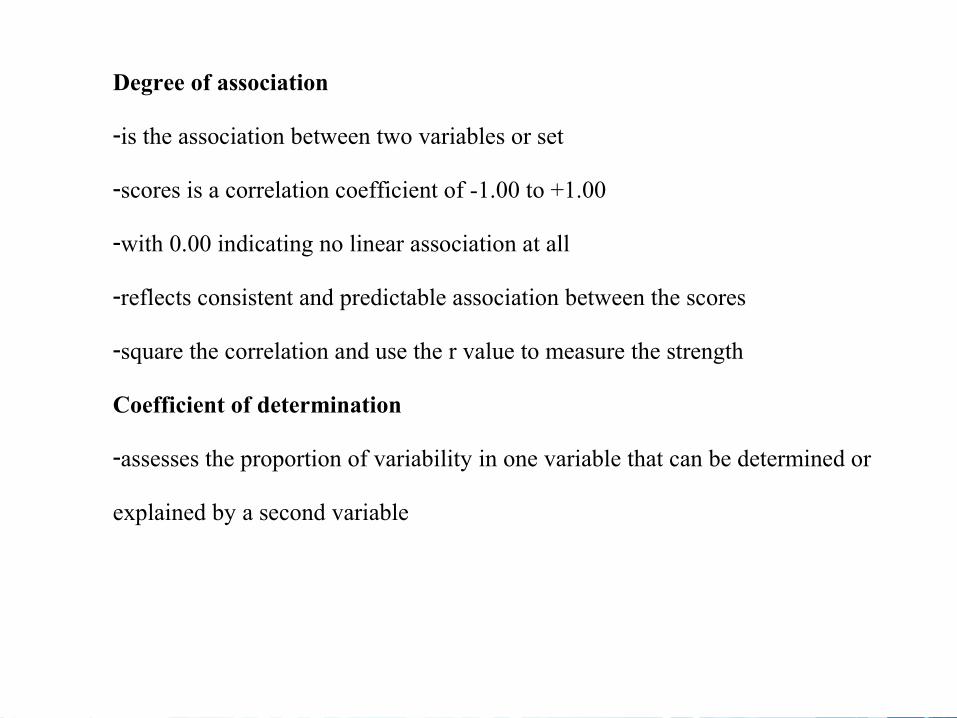
Degree of association
-is the association between two variables or set
-scores is a correlation coefficient of -1.00 to +1.00
-with 0.00 indicating no linear association at all
-reflects consistent and predictable association between the scores
-square the correlation and use the r value to measure the strength
Coefficient of determination
-assesses the proportion of variability in one variable that can be determined or
explained by a second variable

Standards for interpreting the strength of the association.
.20 - .35 - there is only a slight relationship
.35 –.65 - useful for limited prediction.
- used to identify variable membership in the statistical procedure of
factor analysis
- many correlation coefficients for bivariate relationships fall into this
area.
.66 –.85 - good prediction can result from one variable to the other.
- considered very good.
.86 and above - typically achieved for studies of construct validity or test– retest
reliability.
- when two or more variables are related, correlations this high are
seldom achieved.

- Significant testing - determine whether the value is meaningful
- The null hypothesis would be no relationship or association among the scores in the population.
Testing these hypothesis involves:- setting a level of significance- calculating the test statistic- examining whether the correlation coefficient value falls
into the region of rejection rejecting or failing to reject the null hypothesis.
r squared - expresses the magnitude of two variables or sets of scores.- represents the effect size

Multiple Variable Analysis
-Partial Correlations
-Multiple Regression
Partial Correlation
-Determine the amount of variance that an intervening variable explains in both the independent and dependent variables.
-Used because of various number of variables as predictors of the outcome.
-These variables are called as the mediating or intervening variable.
-The variables ‘stands between’ the independent and dependent variables and influences both of them.

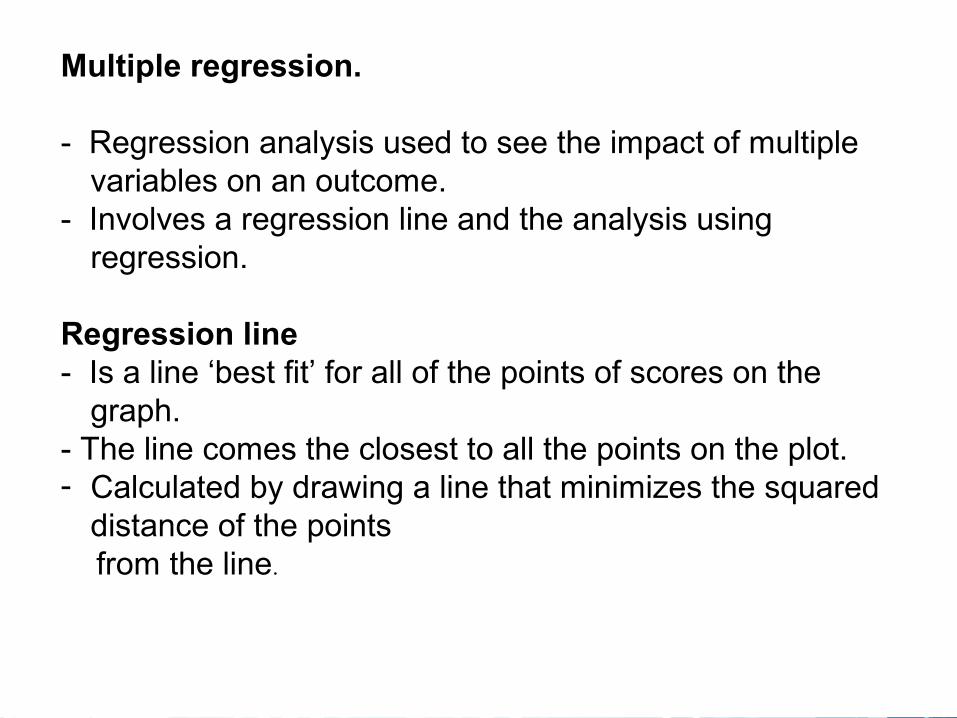
Multiple regression.
- Regression analysis used to see the impact of multiple variables on an outcome.
- Involves a regression line and the analysis using regression.
Regression line- Is a line ‘best fit’ for all of the points of scores on the
graph. - The line comes the closest to all the points on the plot. - Calculated by drawing a line that minimizes the squared
distance of the points from the line.


Multiple Regression / Multiple Correlation
- multiple independent variables combines to correlate with a dependent variable

Regression Table
-calculate regression coefficients for each variable,
assess the combined influence of all variables and provide
a picture of the results
-shows the overall amount of variance explained in a
dependent variable by all independent variables, called R²
or R squared
-shows the regression weight (beta)


Beta Weight
-beta weight indicates the magnitude of prediction for
a variable after removing the effects of all other
predictors.
-identifies the strength of the relationship of a
predictor variable of the outcomes.
-reported in a standardised form, a z score with a
value from +1.00 to -1.00.

Meta analysis
•Authors integrate the findings of many research studies in meta
analysis.
•Meta-analysis conducting process follows systematic steps.
1.locate the studies on a single topic and notes the results for all
the studies.
2.Calculates an overall result for all of the studies and reports this
information.
•By conducting this process, the investigator synthesizes the
literature, providing a secondary source of primary research report.
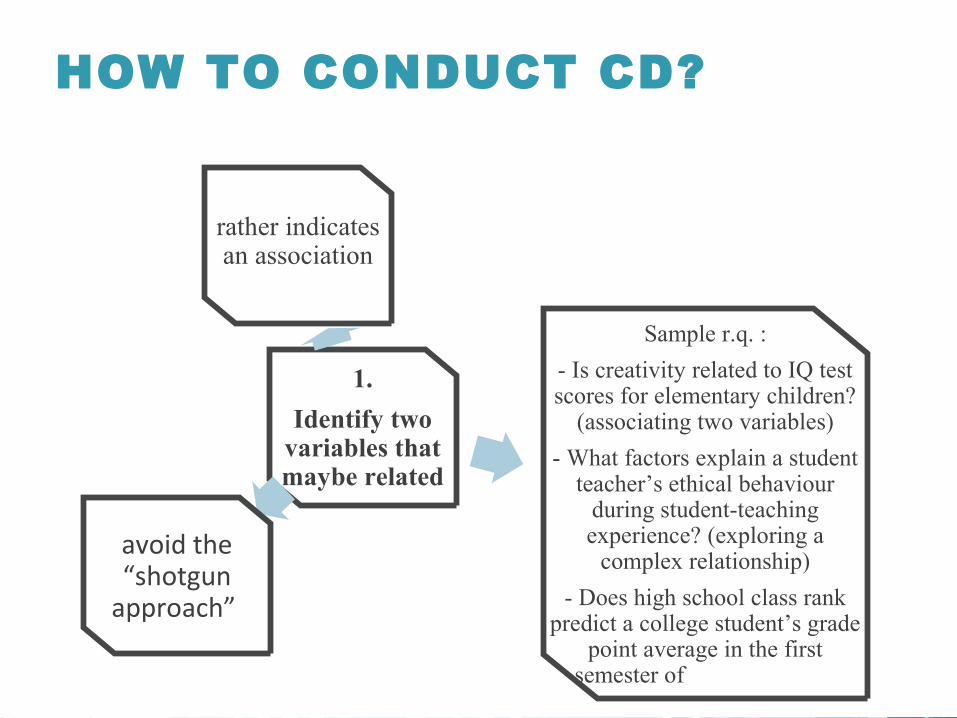
HOW TO CONDUCT CD?
1.
Identify two variables that maybe related
rather indicates an association
between two or more variables
Sample r.q. :
- Is creativity related to IQ test scores for elementary children?
(associating two variables)
- What factors explain a student teacher’s ethical behaviour
during student-teaching experience? (exploring a
complex relationship)
- Does high school class rank predict a college student’s grade
point average in the first semester of the college? (prediction)
avoid the “shotgun
approach”

HOW TO CONDUCT CD?
2.
Identify sample to
study
at least 30 individuals;
select randomly
heterogeneous sample produces wide ranges of scores
compared to homogenous sample; helps to determine the
true relationship between variables.
narrowed group of population may
influence the strength of the
correlation relationships
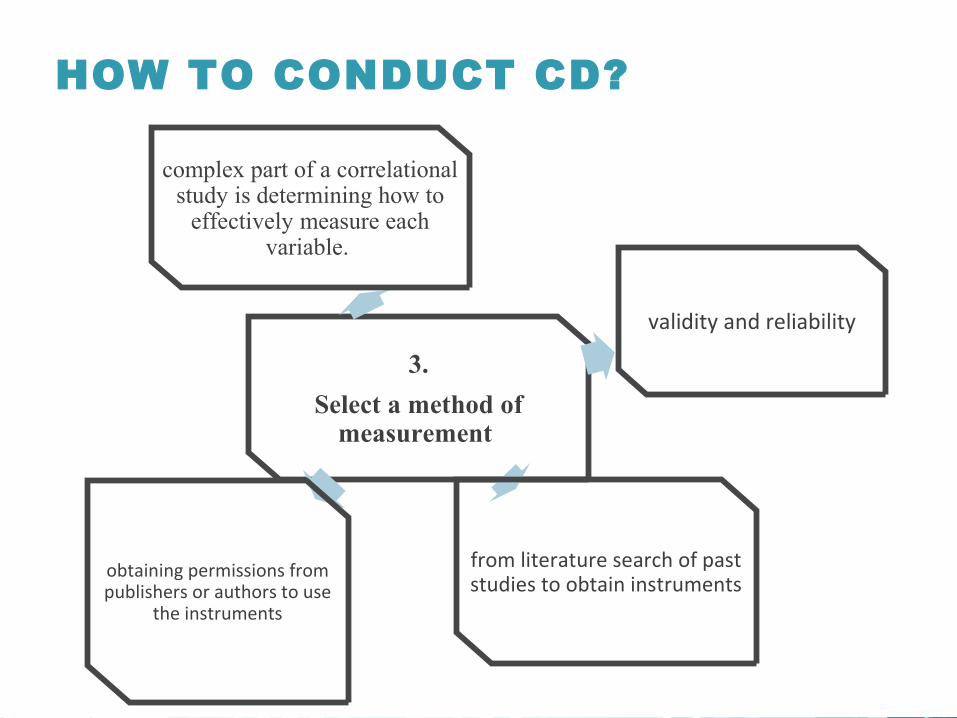
HOW TO CONDUCT CD?
3.
Select a method of measurement
complex part of a correlational study is determining how to
effectively measure each variable.
validity and reliability
from literature search of past studies to obtain instruments
obtaining permissions from publishers or authors to use
the instruments

HOW TO CONDUCT CD?
4.
Collect Data and Monitor
Potential Threats
the two sets of data should be collected for each of the
participants
multiple independent variables are collected to
understand complex relationshipsprediction studies require data
collection at more than one point in time. In such cases,
researchers often assign numbers to participants to ensure that data remains
confidential
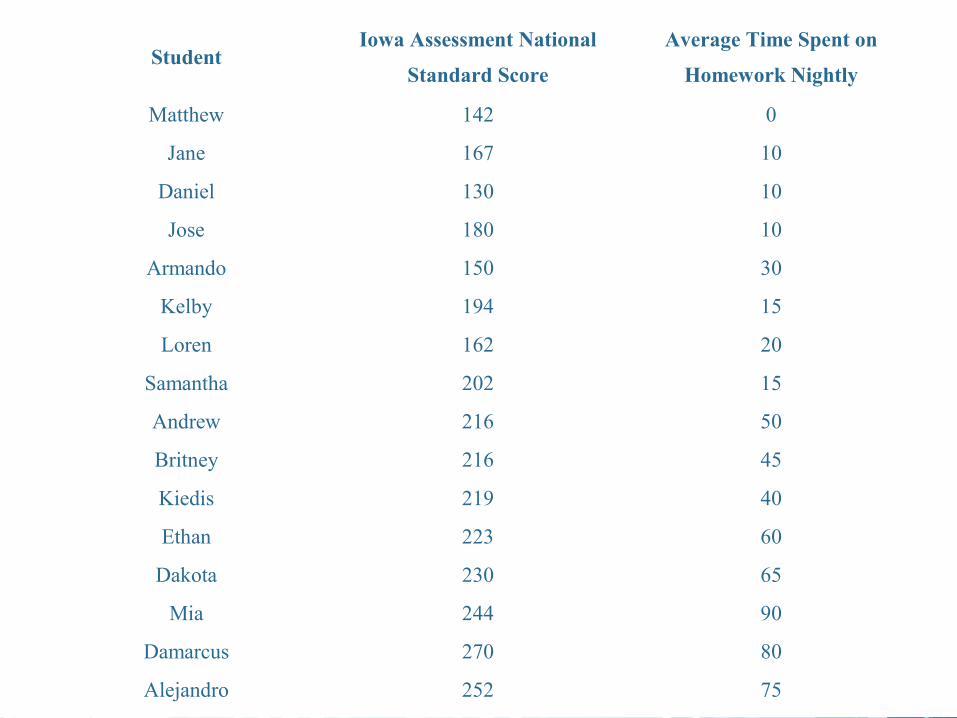
StudentIowa Assessment National
Standard Score
Average Time Spent on
Homework Nightly
Matthew 142 0
Jane 167 10
Daniel 130 10
Jose 180 10
Armando 150 30
Kelby 194 15
Loren 162 20
Samantha 202 15
Andrew 216 50
Britney 216 45
Kiedis 219 40
Ethan 223 60
Dakota 230 65
Mia 244 90
Damarcus 270 80
Alejandro 252 75
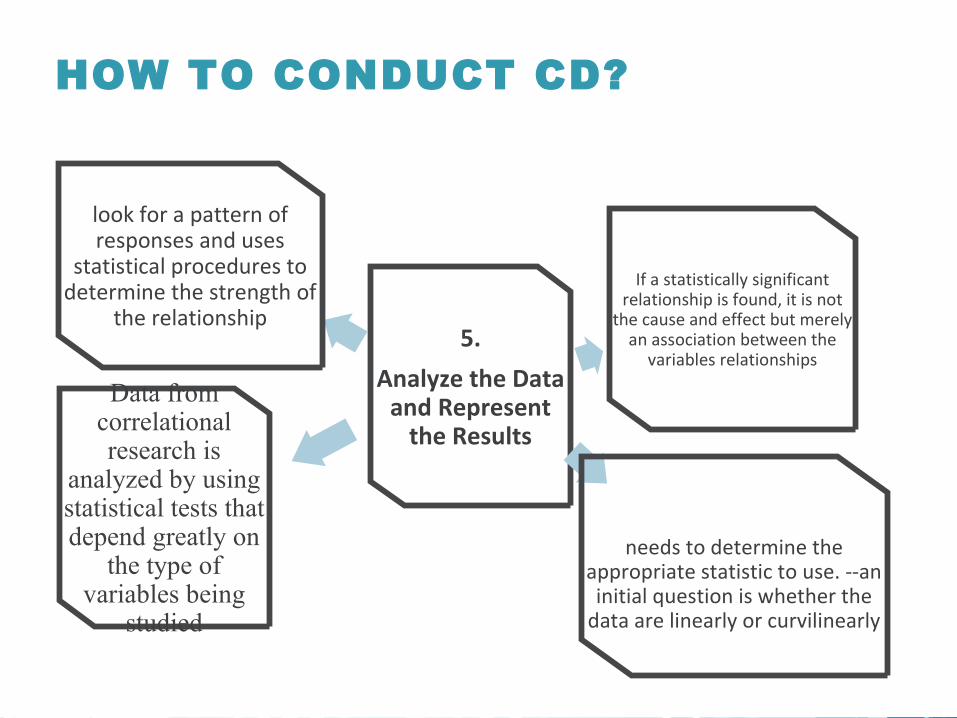
HOW TO CONDUCT CD?
5.
Analyze the Data and Represent
the Results
look for a pattern of responses and uses
statistical procedures to determine the strength of
the relationship
If a statistically significant relationship is found, it is not
the cause and effect but merely an association between the
variables relationships
needs to determine the appropriate statistic to use. --an initial question is whether the
data are linearly or curvilinearly
Data from correlational research is
analyzed by using statistical tests that depend greatly on
the type of variables being
studied

scatterplot
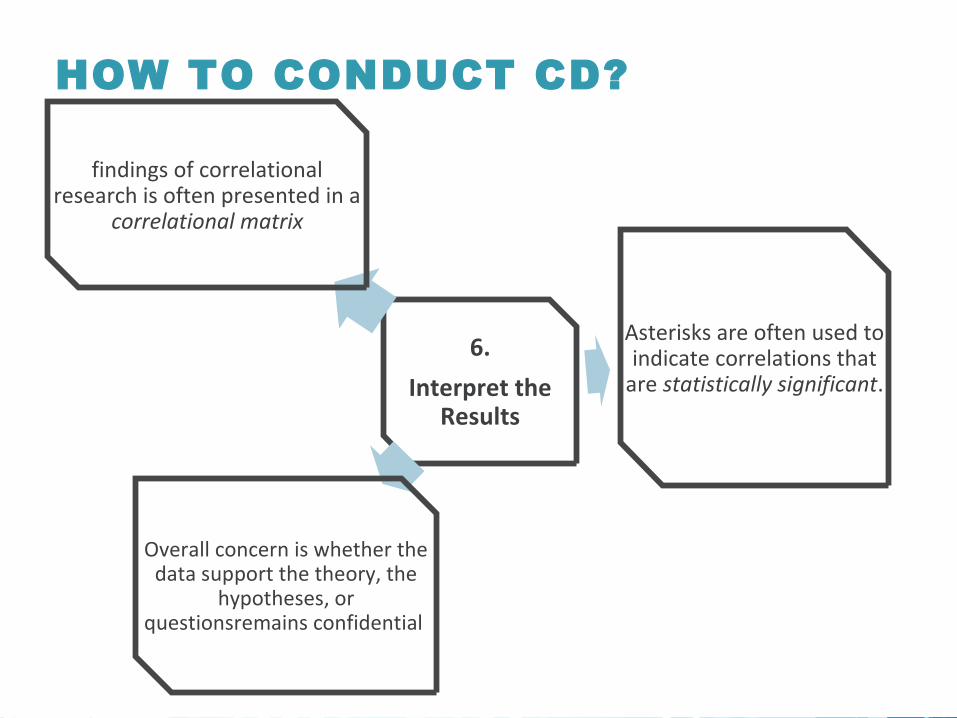
HOW TO CONDUCT CD?
6.
Interpret the Results
findings of correlational research is often presented in a
correlational matrix
Asterisks are often used to indicate correlations that
are statistically significant.
Overall concern is whether the data support the theory, the
hypotheses, or questionsremains confidential

HOW DO YOU EVALUATE A CORRELATIONAL STUDY?
Below are the criteria we use to evaluate and assess the quality of a correlational study:-
Is the size of the sample adequate for hypothesis testing?
Does the researcher adequately display the results in matrices or graphs?
Is there an interpretation about the direction and magnitude of the association between two variables?
Is there an assessment of the magnitude of the relationship based on the coefficient of determination, p values, effect size, or the size of the coefficient?
Is the researcher concerned about the form of the relationship so that an appropriate statistic is chosen for analysis?
Has the researcher identified the predictor and the criterion variables?
If a visual model of the relationships is advanced, does the researcher indicate the expected direction of the relationships among variables? Or the predicted direction based on observed data?
Are the statistical procedures clearly identified?
REFERENCE:
ISBN-13: 978-0133831535 ISBN-10: 0133831531