Embed Size (px)
Citation preview

In proceedings of ICLS 2014
1
An Analytic Tool for Supporting Teachers’ Reflection on Classroom Talk
Gaowei Chen, University of Hong Kong, Pokfulam Road, Hong Kong, [email protected]
Sherice N. Clarke, Lauren B. Resnick, University of Pittsburgh, 3939 O’Hara Street,
Pittsburgh, PA 15260, USA
Email: [email protected], [email protected]
Abstract: Teachers can reflect on and analyze their classroom talk to inform their
instructional practice. When teachers try to do so however, they often face analytic difficulties
regarding the data set (data input, data transformation, and utterances by unknown speakers),
coding (coding complexity, reliability, and efficiency), visualization (representations of a
variety of information, synchronization of displays, and adaptation to the data/codes changes),
and tracking and comparison (many students’ actions across discussion sessions). This paper
introduces an analytic tool called classroom discourse analyzer (CDA) to address these
difficulties, as shown in the analyses of classroom discourse from a fourth grade science class.
The analyses demonstrate how CDA can be used by teachers to support their reflection on
classroom talk and how it can provide personalized, data-supported evidence to inform
teachers’ classroom practice.
Introduction Teachers play a crucial role in classroom discussions. Their orchestration of student participations,
argumentation and evaluations can affect students’ learning processes and outcomes (Resnick, Asterhan, &
Clarke, in press). However, currently teachers’ performance in helping student learn through discussion is far
from satisfactory (Mercer, Dawes, & Staarman, 2009; McNeil & Pimentel, 2010). Given the large benefits of
effective classroom talk on students’ learning, teachers often find it difficult to engage students into productive
discussions involving deep reasoning and argumentation (Clarke et al., 2013; Howe & Abedin, 2013; Pimentel
& McNeil, 2013). This raises the challenge of teacher education and professional development (PD) on their
classroom discussions with students.
To address this issue, many PD programs have developed instructions to guide teachers’ reflection on
their classroom interaction. Although reflection has been widely accepted as a useful means of learning in PD
programs (Korthagen, & Vasalos, 2005; Pollard et al., 2008), the format of reflection from one’s memory has
been questioned by some researchers who argued that one’s memory cannot always be reliable, neither can it
notice and memorize every detail of classroom interaction (McCullagh, 2012; Rosaen, Lundebrg, Cooper,
Fritzen & Terpstra, 2008). As such, more recently a growing number of researchers and practitioners have been
investigating the use of videos as a facilitator in teacher education and PD (e.g., Baecher, Kung, Jewkes, &
Rosalia, 2013; Borko, Koellner, Jacobs, & Seago, 2011; van Es, 2012). Studies have compared various types of
video and got mixed research results. For instance, analyzing videos of one’s own teaching was shown to be
more effective regarding activation experience but less effective regarding emotional/motivational involvement
than analyzing others’ video (e.g., Kleinknecht & Schneider, 2013). The mixed results encouraged us to explore
alternative means of PD that can not only take the advantage of using authentic classroom data as video
reflections do, but also provide teachers with data-supported evidence to inform their practice.
The emerging fields of learning analytics provide ample opportunities for the employment of data as
evidence for teaching and learning (1st International Conference on Learning Analytics & Knowledge; Baker &
Yacef, 2009; Siemens et al., 2011). In particular, discourse analytics in which language is a primary tool for
knowledge negotiation and construction (Shum & Ferguson, 2012) allows teachers to identify classroom
discussion behaviors and patterns through the analysis of discourse data. As data and analytics are reshaping the
way of teaching and learning, tools that can interact with teachers to visualize and track classroom discourse and
communicate analytic results should be explored to meet the needs of teachers.
This paper introduces a novel discourse analytic tool called Classroom Discourse Analyzer (CDA) for
teachers. We explicate how CDA addresses the difficulties regarding data set, coding, visualization, and
tracking and comparison that teachers face in analyzing their classroom discourse data. Data set difficulties
include data input, data transformation, and dealing with utterances by unknown speakers. Difficulties involving
data coding include the coding of complex classroom discourse, coding reliability, and coding efficiency. The
visualization issues include the visual representations of many things, synchronization of different displays, and
adaptation to data/codes changes. Lastly, there are also difficulties regarding tracking and comparing teacher’s
and students’ actions across multiple sessions.
We showcase CDA by applying it to the discourse data from a fourth grade science class. The data was
first video recorded and transcribed by humans. The female teacher and 16 students (9 males, 7 females)

In proceedings of ICLS 2014
2
contributed 1,939 teacher turns and 1,926 student turns in 30 discussion sessions (total duration: 8 hours and 51
minutes). The analyses and visual representations show how CDA can support teachers’ reflection on their
classroom discussions and how it can provide personalized, data-supported evidence to inform teachers’
classroom practice.
Classroom Discourse Analyzer When trying to reflect on and analyze classroom discourse, teachers often face analytic difficulties regarding the
discourse data set, coding, visualization, and tracking and comparison. Table 1 presents the difficulties as well
as what strategies that CDA takes to address these difficulties. We classify the difficulties into four categories
(i.e., data set, coding, visualization, and tracking and comparison) and discuss below how CDA addresses each
of them.
Table 1. Difficulties for teachers in analyzing classroom discourse and CDA strategies.
Analytic Difficulty Classroom Discourse Analyzer Strategy
Data set
Data input Simple input template (session, turn, speaker, content)
Data transformation Automated transformation into data of three levels (turn [teacher
turn vs. student turn], exchange [teacher-students turn-taking],
session [sequences of exchanges])
Unknown speakers Naming array (individual student [e.g., John; identifiable student],
Male [a male student], Female [a female student], SS [a group of
students], or S [an unidentifiable student])
Coding
Complexity of classroom discourse Multi-dimensional coding with mutually exhaustive, exclusive
categories
Coding reliability Multi-dimensional coding with mutually exhaustive, exclusive
categories
Coding efficiency Automated coding by machine learning software
Visualization
Displays of many participants, turns
and codes
Visual displays of many students, many turns, and multiple codes by
different colors/shapes and in different frames
Synchronization of displays Automated synchronization of various displays
Adapting to data/codes changes Real-time link of visualization to data and codes
Tracking and comparison
Many students’ actions over time View of anyone’s (teacher or students) any actions (e.g., number of
words, new ideas, questions) in any discussion sessions
Data Set CDA addresses the discourse data set issues (data input, data transformation, unknown speakers) with a simple
input template, automated transformation, and a student naming array. The input of classroom discourse can
include various entries and may take various forms. To minimize the workload of teachers, a simple input
template uses four variables to represent a conversational turn, which are session (i.e., session # in a series), turn
(i.e., turn # in a session), speaker (i.e., name of the speaker), and content (i.e., entire content of a turn). The input
can be any number of sessions, turns, or speakers.
Classroom discourse data often need to be transformed into right types of data sets for subsequent
analyses. CDA can automate the data transformation processes, which transforms classroom discourse into
three-level data with a nested structure, namely turn, exchange, and session levels. Turns are nested within
exchanges and exchanges are nested within sessions. At the turn level, all conversational turns are classified into
teacher turns or student turns. At the exchange level, the sequences of teacher student turn-taking are identified
(e.g., a sequence of “T->S1->T->S2” or “T->S1->S2->T”). Lastly, at the session level, the boundaries between
any two consecutive discussion sessions are automatically detected.
Classroom discussions often involve a large number of participants (teacher and many students). This
may create obstacles for the identification of the participating students in some utterances, especially with
audio-taped data. To address this issue, CDA provides a student naming array to classify the speakers into one
of the five following categories: individual student (e.g., John; identifiable student), Male (a male student),
In proceedings of ICLS 2014
3
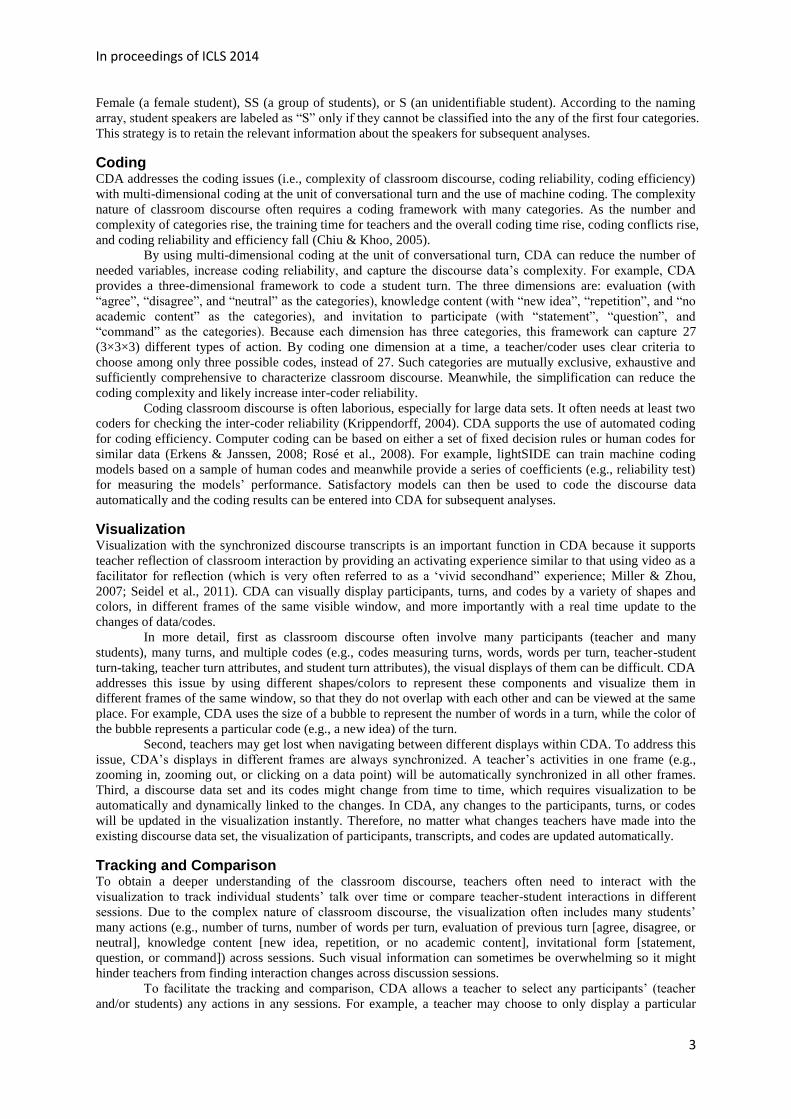
Female (a female student), SS (a group of students), or S (an unidentifiable student). According to the naming
array, student speakers are labeled as “S” only if they cannot be classified into the any of the first four categories.
This strategy is to retain the relevant information about the speakers for subsequent analyses.
Coding CDA addresses the coding issues (i.e., complexity of classroom discourse, coding reliability, coding efficiency)
with multi-dimensional coding at the unit of conversational turn and the use of machine coding. The complexity
nature of classroom discourse often requires a coding framework with many categories. As the number and
complexity of categories rise, the training time for teachers and the overall coding time rise, coding conflicts rise,
and coding reliability and efficiency fall (Chiu & Khoo, 2005).
By using multi-dimensional coding at the unit of conversational turn, CDA can reduce the number of
needed variables, increase coding reliability, and capture the discourse data’s complexity. For example, CDA
provides a three-dimensional framework to code a student turn. The three dimensions are: evaluation (with
“agree”, “disagree”, and “neutral” as the categories), knowledge content (with “new idea”, “repetition”, and “no
academic content” as the categories), and invitation to participate (with “statement”, “question”, and
“command” as the categories). Because each dimension has three categories, this framework can capture 27
(3×3×3) different types of action. By coding one dimension at a time, a teacher/coder uses clear criteria to
choose among only three possible codes, instead of 27. Such categories are mutually exclusive, exhaustive and
sufficiently comprehensive to characterize classroom discourse. Meanwhile, the simplification can reduce the
coding complexity and likely increase inter-coder reliability.
Coding classroom discourse is often laborious, especially for large data sets. It often needs at least two
coders for checking the inter-coder reliability (Krippendorff, 2004). CDA supports the use of automated coding
for coding efficiency. Computer coding can be based on either a set of fixed decision rules or human codes for
similar data (Erkens & Janssen, 2008; Rosé et al., 2008). For example, lightSIDE can train machine coding
models based on a sample of human codes and meanwhile provide a series of coefficients (e.g., reliability test)
for measuring the models’ performance. Satisfactory models can then be used to code the discourse data
automatically and the coding results can be entered into CDA for subsequent analyses.
Visualization Visualization with the synchronized discourse transcripts is an important function in CDA because it supports
teacher reflection of classroom interaction by providing an activating experience similar to that using video as a
facilitator for reflection (which is very often referred to as a ‘vivid secondhand” experience; Miller & Zhou,
2007; Seidel et al., 2011). CDA can visually display participants, turns, and codes by a variety of shapes and
colors, in different frames of the same visible window, and more importantly with a real time update to the
changes of data/codes.
In more detail, first as classroom discourse often involve many participants (teacher and many
students), many turns, and multiple codes (e.g., codes measuring turns, words, words per turn, teacher-student
turn-taking, teacher turn attributes, and student turn attributes), the visual displays of them can be difficult. CDA
addresses this issue by using different shapes/colors to represent these components and visualize them in
different frames of the same window, so that they do not overlap with each other and can be viewed at the same
place. For example, CDA uses the size of a bubble to represent the number of words in a turn, while the color of
the bubble represents a particular code (e.g., a new idea) of the turn.
Second, teachers may get lost when navigating between different displays within CDA. To address this
issue, CDA’s displays in different frames are always synchronized. A teacher’s activities in one frame (e.g.,
zooming in, zooming out, or clicking on a data point) will be automatically synchronized in all other frames.
Third, a discourse data set and its codes might change from time to time, which requires visualization to be
automatically and dynamically linked to the changes. In CDA, any changes to the participants, turns, or codes
will be updated in the visualization instantly. Therefore, no matter what changes teachers have made into the
existing discourse data set, the visualization of participants, transcripts, and codes are updated automatically.
Tracking and Comparison To obtain a deeper understanding of the classroom discourse, teachers often need to interact with the
visualization to track individual students’ talk over time or compare teacher-student interactions in different
sessions. Due to the complex nature of classroom discourse, the visualization often includes many students’
many actions (e.g., number of turns, number of words per turn, evaluation of previous turn [agree, disagree, or
neutral], knowledge content [new idea, repetition, or no academic content], invitational form [statement,
question, or command]) across sessions. Such visual information can sometimes be overwhelming so it might
hinder teachers from finding interaction changes across discussion sessions.
To facilitate the tracking and comparison, CDA allows a teacher to select any participants’ (teacher
and/or students) any actions in any sessions. For example, a teacher may choose to only display a particular
In proceedings of ICLS 2014
4
student’s turns according to time sequence, in order to see if the student is participating in the discussions more
or less frequently over time. Alternatively, a teacher may select to view all students’ talk in two different
sessions to observe if these students participated in the discussion of the two topics differently. Once a trend or
difference is identified, teachers can zoom in to view the visualization in further details.
Showcasing Classroom Discourse Analyzer In this section, we showcase CDA by applying it to the transcripts from a fourth-grade science class. After
describing the data set and coding, we show in what ways that teachers may use CDA to analyze the discourse
and thereby inform their classroom talk with students.
Data The data set includes 1,939 teacher turns and 1,926 student turns transcribed from videotapes of 30 discussion
sessions in a 4th grade science class. The participants were a female teacher and 16 students (9 males, 7
females). The total time of discussion was about 8 hours and 51 minutes. Sample discussion topics include:
“what causes the water level to rise?”; “Same volume, same weight?”; “How can we measure the volume of a
liquid?”. The format of the input data in CDA is presented in Table 2. Teachers only need to provide data along
the following four columns: session, turn, speaker, and content.
Table 2. Format of the input data in CDA.
Session Turn Speaker Content
1 1 Ta What is an earth material? Amalia, what’s an earth material?
1 2 Amaliab Materia- Material is like, um, like well, you could say like what’s under our feet,
you could say like um, maybe like soil and rocks.
1 3 T OK. What’s another way you would describe earth materials? What does that word
or that term mean to you? Louie?
. . . …
30 87 T And what do we call that?
30 88 SSc Water displacement.
30 89 T I could use my water displacement again to get the exact measurement, because that
worked for us with the rock, so I believe that would probably work for us with the
gravel. a Teacher.
b Student name was pseudonym.
c A group or whole-class of students.
Coding CDA used multi-dimensional frameworks for coding the teacher and student turns. (Teachers may also create
their own coding framework in CDA). CDA automatically computed the number of words in a teacher or
student turn and identify teacher student turn-taking patterns over time (e.g., T->S1->T->S2->T vs. T->S1->S2-
>T).
The teacher turns were coded based on the scheme of teacher Accountable Talk® during the discussion,
which includes eight categories of Accountable Talk moves (i.e., “say more”, “revoice”, “press for reasoning”,
“challenge”, “restate”, “add on”, “agree/disagree”, and “explain other”; Resnick, Michaels, & O’Connor, 2010).
For example, to encourage individual students’ thinking, teachers can ask students to say more (e.g., “Can you
say more about that?”) or to explain their reasoning (e.g., “Why do you think that?”). To facilitate students’
thinking with others, teachers can ask students to extend the ideas of others (e.g., “Who can add onto to that
idea?”) or to evaluate someone else’s reasoning (e.g., “Do you agree / disagree?”). Machine coding software
(lightSIDE; Mayfield & Rosé, 2013) was used to facilitate the coding of teacher turns.
The student turns were coded using a multi-dimensional framework: a) knowledge content (new idea
[with justification or not], repetition, or no academic content), b) evaluation of previous turns (agree, disagree,
or being neutral), and c) invitation to participate (statement, question, or command; Chen & Chiu, 2008; Chen,
Chiu, & Wang, 2012).
Analyses We first introduce the overall interface of CDA. We then show how the various displays in CDA help visualize
the discourse processes and how they can inform teachers about their talk with students in the classroom.
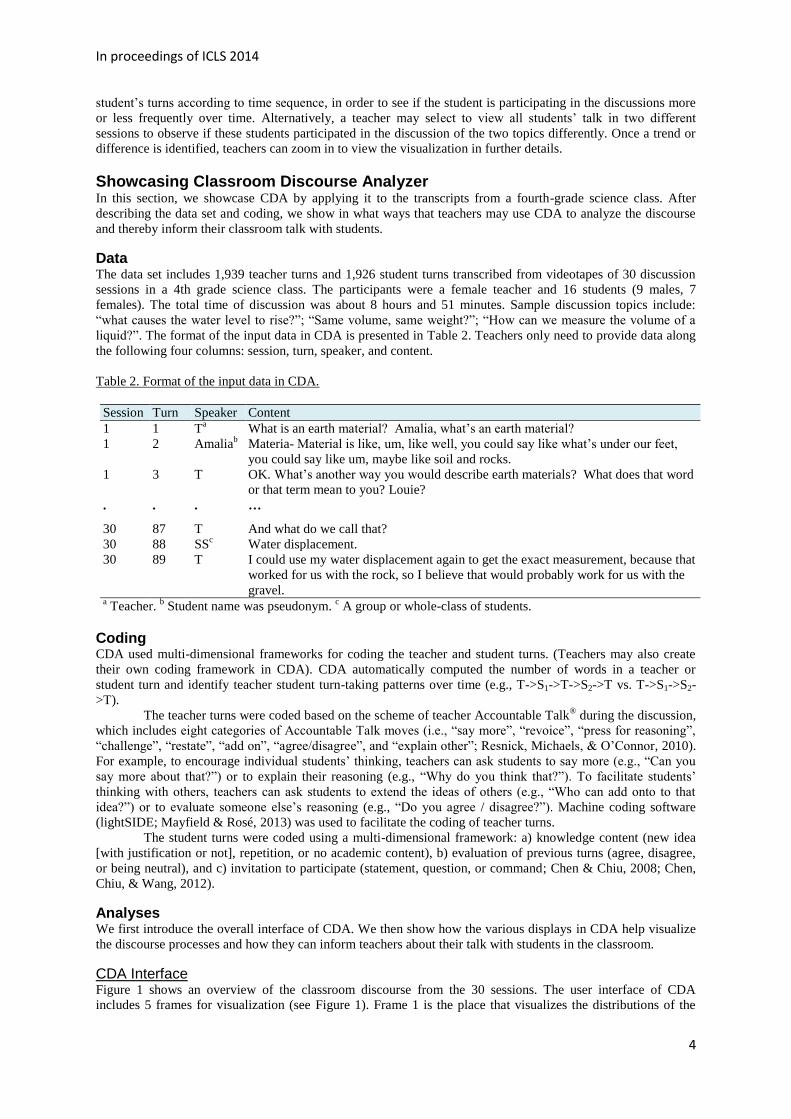
CDA Interface Figure 1 shows an overview of the classroom discourse from the 30 sessions. The user interface of CDA
includes 5 frames for visualization (see Figure 1). Frame 1 is the place that visualizes the distributions of the
In proceedings of ICLS 2014
5
teacher and student turns. The vertical axis is participants and the horizontal axis is timeline. Each line of
bubbles represents a student’s or the teacher’s (the dark red bubbles) talk. Size of bubbles represents the number
of words in a turn. The teacher’s line of bubbles near the bottom of the frame 1 shows that she talked much
more than the students across the 30 sessions.
Frame 2 represents teacher-student turn-taking patterns automatically generated by CDA. The vertical
axis is the number of students between two adjacent teacher turns and the horizontal axis is timeline. Frame 3
shows summary statistics for each row of data (e.g., teacher’s and student’s percentages of total words in the 30
sessions). The transcripts are displayed in frame 4 and the coding frameworks for teacher and student turns are
displayed in frame 5. The visual displays in different frames are always synchronized to facilitate viewing. For
instance, Figure 1 shows that a particular turn (turn 38 in session 16 by the student Johnny, a pseudo name in
this study) can be easily located in frames 1, 2, and 4 simultaneously.
Figure 1. An overall interface of CDA.
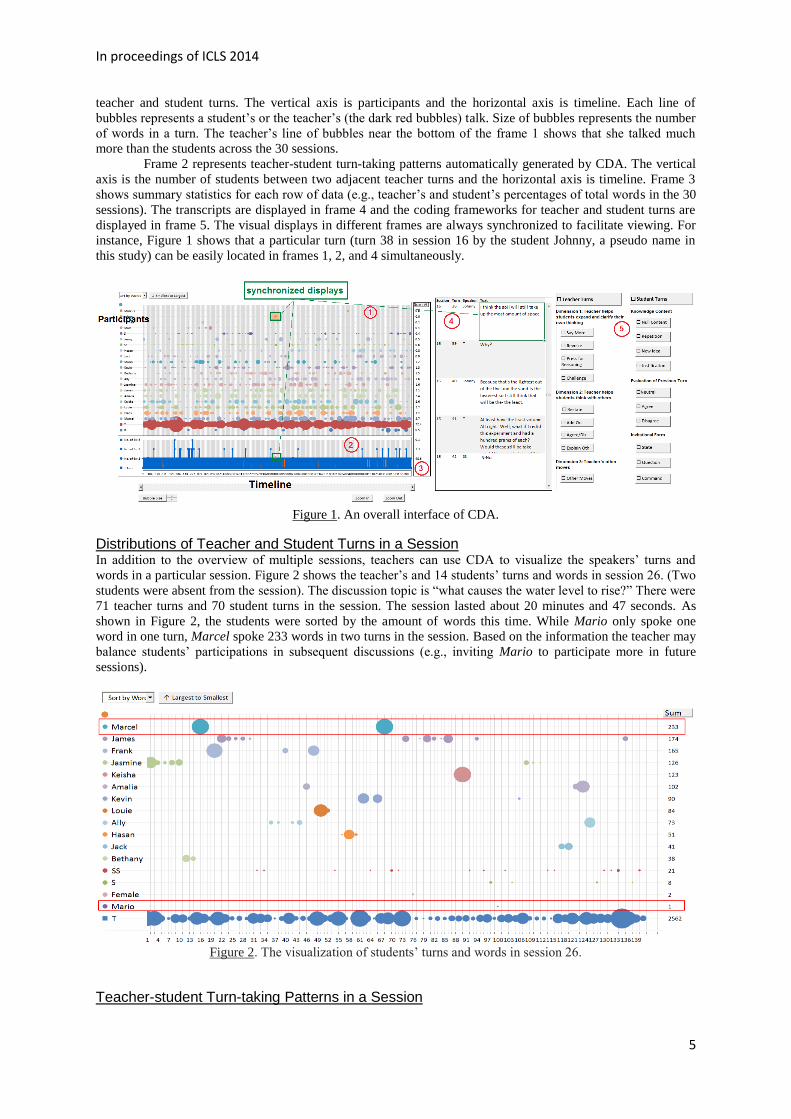
Distributions of Teacher and Student Turns in a Session In addition to the overview of multiple sessions, teachers can use CDA to visualize the speakers’ turns and
words in a particular session. Figure 2 shows the teacher’s and 14 students’ turns and words in session 26. (Two
students were absent from the session). The discussion topic is “what causes the water level to rise?” There were
71 teacher turns and 70 student turns in the session. The session lasted about 20 minutes and 47 seconds. As
shown in Figure 2, the students were sorted by the amount of words this time. While Mario only spoke one
word in one turn, Marcel spoke 233 words in two turns in the session. Based on the information the teacher may
balance students’ participations in subsequent discussions (e.g., inviting Mario to participate more in future
sessions).
Figure 2. The visualization of students’ turns and words in session 26.
Teacher-student Turn-taking Patterns in a Session

In proceedings of ICLS 2014
6
CDA can automatically generate the visualization of teacher and students’ turn-taking patterns during a
discussion. There are three major patterns during classroom discussions. The first is teacher’s talk with a
particular student for two or more turns (or “T->S1->T->S1”). Another is teacher’s talk with one student for one
turn and then turn to another student (or “T->S1->T->S2”). The last one is that teacher allows two or more
students to talk with each other before taking the turn (or “T->S1->S2->T”).
See Figure 3 for the turn-taking patterns in session 26. During this discussion, the teacher and students
used many “T->S1->T->S1” patterns (dashed orange lines) and many “T->S1->T->S2” patterns (solid blue areas),
but no “T->S1->S2->T” patterns. For example, Figure 3 shows a place where the teacher talked with a particular
student for 11 consecutive turns before going to another student (“T->S1->T->S1->T->S1->T->S1->T->S1->T”).
This might be the place that the teacher helped the student clarify or expand his or her own thinking. At another
place, the teacher went through eight students and talked with each student with only one turn (“T->S1->T->S2-
>T->S3->T->S4->T->S5->T->S6->T->S7->T->S8->T”). This might be the place where the teacher helped
students think with one another. Teachers can click on the visual representation to view the corresponding
video/transcripts details and purposefully examine whether a teacher has managed the discourse segments
appropriately or whether he/she missed opportunities for fostering student thinking in that context.
Figure 3. The visualization of teacher-student turn-taking patterns in session 26.
Tracking Teacher and Student Actions in a Session Teachers can use CDA to track teacher’s or any individual students’ particular actions during classroom
discussions. Figure 4 shows the visualization of a) the teacher’s use of “agree/disagree” moves, and b) the
students’ use of “disagreement” moves in session 26. The purpose was to track how students disagreed with one
another during the discussion. From Figure 4 we can see whether they disagreed with one another as a result of
the teacher’s probes or they disagreed with one another voluntarily.
Figure 4. Visualization of teacher’s “agree/disagree” turns and students’ “disagreement” turns in session 26.
As shown in Figure 4, there were 5 teacher turns that asked students to evaluate one another’s ideas and
8 student turns that disagreed with one another’s ideas. What is interesting here is that only 2 of the 8
disagreement turns were elicited by the teacher. The other 6 turns were not preceded by teacher “agree/disagree”
turns, suggesting that these students were likely to disagree with the ideas by their peers explicitly during the
discussion (McNeill & Pimentel, 2010). Teachers may zoom in to reflect on why the students were having
conflicting views and how the teacher moderated the disagreements in this episode.
Comparisons Between Classes

In proceedings of ICLS 2014
7
Moving beyond a single class, teachers can use CDA to compare their classroom discourse data with those from
other teachers. This is a useful function especially in teacher PD because it can help teachers learn from the
analyses of one another’s classroom talk. Figure 6 shows the teacher-student turn-taking patterns of a discussion
segment from a ninth grade biology class (discussion topic: Punnett square; one male teacher and 16 students;
duration: 16' 00"). This visualization is in sharp contrast to that in Figure 3. The ninth grade biology class used
much fewer “T->S1->T->S1” patterns (dashed orange lines), but a lot more “T->S1->S2->T” patterns (higher,
blue lines with a peak) than the fourth grade science class. As can be seen in Figure 6, there were as many as
five students taking the turns to talk between two teacher turns (e.g., “T->S1->S2->S3->S4->S3->S5->T” as
shown in the rectangles). The visualization showed that students in this discussion session had a lot of
opportunities to interact with one another directly, which indicates a presence of students’ dialogic interactions
in the session (Lehesvuori et al., 2013; McNeill & Pimentel, 2010; Schultz & Oyler, 2006).
Figure 6. The visualization of teacher-student turn-taking patterns in a session from a 9
th grade biology class.
Discussion and Conclusions In this paper, we explicated how teachers can use CDA to analyze their own classroom discourse. While many
difficulties encumber teachers’ analysis of their discourse data, CDA addresses each of them. CDA can be used
by teachers and teacher educators to support teachers’ self-assessment and reflection of their classroom
discussion processes and provide personalized, data-supported evidence to inform their classroom practice.
Through visualizing, tracking, and comparing classroom discourse processes, CDA can be applied to address
questions regarding a) how classroom talk develop over time, b) how teacher and students take turns to interact
with one another, and c) how their behaviors differ across sessions and classes.
The CDA results of the above case showed that it can be used to visualize teacher and student talk over
time. This allows teachers to track any participants’ actions (e.g., students’ disagreements with one another, new
ideas, justifications) in a discussion session. The information can also be used to inform teacher’s guidance and
feedback in future discussions. CDA can also automatically visualize teacher and students’ turn-taking patterns
to reveal at a glance the social structure of a discussion. For example, the occurrences of “T->S1->S2->T”
pattern (two or more students talk between two adjacent teacher turns) might indicate the places where students
voluntarily evaluate someone else’s idea, raise a question, or propose a new idea (McNeill & Pimentel, 2010;
Schultz & Oyler, 2006). Moving beyond a single session, teachers can use CDA to compare students’ behaviors
in different sessions. Furthermore, a group of teachers can use CDA to view and compare the discourse from
one another’s classes, which would also help develop a learning community among teachers.
There are challenges that might limit the application of CDA in practice, which include data collection,
transcribing, and coding. All the three processes, especially data transcribing and coding, are laborious and
expensive, thereby hindering the rapid feedback and continuous support that CDA can provide. The data of
classroom discussions are often collected by audio or video taping (e.g., the data used in the above case). In a
classroom discussion that involves a large number of students, it is sometimes difficult to capture the
information of who speaks at what time. Alternative ways of recording classroom discussions, such as
microphone-array systems (Sun & Canny, 2012), may help address this issue.
The data in the above case were all transcribed manually from videotaped records. The process was
often time and labor consuming. New technology in the areas of speaker identification and speech recognition
may be used to facilitate the transcribing of classroom discussions (e.g., Vandyke, Wagner, & Goecke, 2013;
Walker et al., 2004). Whether computer transcribing is comparable to external human transcribing remains an
open research area. Another strategy is that teachers can select to transcribe the small segments that they are
interested. (Sampling portions of the data omits substantial data, which can bias the analysis results.)
Coding transcripts of classroom discussions also takes time and effort. It has been showed that
computer coding was reasonably acceptable as it coded for some particular categories (Clarke et al., 2013;
Mayfield, Laws, Wilson, & Rosé, 2013). In the above case, we have used the machine learning software
lightSIDE (Mayfield & Rosé, 2013) to help code for some teacher talk moves that do not require the teacher to
be able to paraphrase or interpret the student speaker’s “meaning.” They are the moves that mainly use general
expressions (e.g., press for reasoning: “why do you think that?”; add on: “who can add on?”; agree/disagree: “do
you agree/disagree?”). Whether computer coding can be used to code complex categories of classroom talk
remains an open research area.

In proceedings of ICLS 2014
8
References Baecher, L., Kung, S. C., Jewkes, A. M., & Rosalia, C. (2013). The role of video for self-evaluation in early
field experiences. Teaching and Teacher Education, 36, 189-197.
Baker, R. S. J. D., & Yacef, K. (2009). The state of educational data mining in 2009. Journal of Educational
Data Mining, 1(1), 3-17.
Borko, H., Koellner, K., Jacobs, J., & Seago, N. (2011). Using video representations of teaching in practice-
based professional development programs. ZDM, 43(1), 175-187.
Chen, G., & Chiu, M. M. (2008). Online discussion processes. Computers & Education, 50(3), 678-692.
Chen, G., Chiu, M. M., & Wang, Z. (2012). Social metacognition and the creation of correct, new ideas.
Computers in Human Behavior, 28(3), 868-880.
Chiu, M. M., & Khoo, L. (2005). A new method for analyzing sequential processes: Dynamic multi-level
analysis. Small Group Research, 36, 1-32.
Clarke, S. N., Chen, G., Stainton, C., Katz, S., Greeno, J. G., & Resnick, L. B. et al. (2013). The impact of CSCL
beyond the online environment. Paper presented in the CSCL 2013 conference. Madison, WI.
Erkens, G. & Janssen, J. (2008). Automatic coding of dialogue acts in collaboration protocols. International
Journal of Computer-Supported Collaborative Learning, 3(4), 447-470. Howe, C. & Abedin, M. (2013). Classroom dialogue. Cambridge Journal of Education, 43(3), 325-356.
Kleinknecht, M., & Schneider, J. (2013). What do teachers think and feel when analyzing videos of themselves
and other teachers teaching? Teachers and Teaching, 33, 13-23.
Korthagen, F., & Vasalos, A. (2005). Levels in reflection. Teachers and Teaching, 11, 47-71.
Krippendorff, K. (2004). Content Analysis. Thousand Oaks: SAGE Publications.
Lehesvuori, S., Viiri, J., Rasku‐Puttonen, H., Moate, J., & Helaakoski, J. (2013). Visualizing communication
structures in science classrooms. Journal of Research in Science Teaching.
Mayfield, E., & Rosé, C. P. (2013). LightSIDE. Handbook of Automated Essay Evaluation: Current
Applications and New Directions, 124.
Mayfield, E., Laws, M. B., Wilson, I. B., & Rosé, C. P. (2013). Automating annotation of information-giving
for analysis of clinical conversation. Journal of the American Medical Informatics Association,
amiajnl-2013.
McCullagh, J. F. (2012). How can video supported reflection enhance teachers’ professional
development? Cultural Studies of Science Education, 7, 137-152.
McNeill, K. L., & Pimentel, D. S. (2010). Scientific discourse in three urban classrooms. Science Education,
94(2), 203-229.
Miller, K., & Zhou, X. (2007). Learning from classroom video: What makes it compelling and what makes it
hard. Video research in the learning sciences, 321-334.
Pollard, A., Anderson, J., Maddock, M., Swaffield, S., Warin, J., & Warwick, P. (2008). Reflective teaching:
Evidence-informed professional practice (3rd ed.). London, New York: Continuum.
Resnick, L. B., Asterhan, C. A., & Clarke, S. N. (Eds.) (in press). Socializing Intelligence through Academic
Talk and Dialogue. Washington, DC: American Educational Reserach Association.
Resnick, L. B., Michaels, S., & O’Connor, C. (2010). How (well structured) talk builds the mind. In D. Preiss &
R. Sternberg (Eds.), Innovations in educational psychology (pp. 163-194). New York, NY: Springer.
Rosaen, C. L., Lundeberg, M., Cooper, M., Fritzen, A., & Terpstra, M. (2008). Noticing noticing. Journal of
Teacher Education, 59, 347-360.
Rosé, C. P., Wang, Y. C., & Arguello, J. et al. (2008). Analyzing collaborative learning processes automatically.
International Journal of Computer Supported Collaborative Learning, 3(3), 237-271.
Schultz, B. D., & Oyler, C. (2006). We make this road as we walk together. Curriculum Inquiry, 36(4), 423-451.
Seidel, T., Stürmer, K., Blomberg, G., Kobarg, M., & Schwindt, K. (2011). Teacher learning from analysis of
videotaped classroom situations. Teaching and Teacher Education, 27(2), 259-267.
Shum, S. B., & Ferguson, R. (2012). Social learning analytics. Educational Technology & Society, 15(3), 3-26.
Siemens, G. et al. (2011). Open Learning Analytics. Society for Learning Analytics Research.
van Es, E. A. (2012). Examining the development of a teacher learning community. Teaching and Teacher
Education, 28(2), 182-192.
Vandyke, D., Wagner, M., & Goecke, R. (2013). Voice source waveforms for utterance level speaker
identification using support vector machines. In International Conference on Information Technology
in Asia, CITA.
Walker, W. et al. (2004). Sphinx-4: A flexible open source framework for speech recognition.
Acknowledgments This work was supported in part by NSF grant SBE-0836012 to the Pittsburgh Science of Learning Center and
by NSF grant DRK12-0918435 awarded to TERC.