Embed Size (px)
Citation preview

A comparative study on cost-sharing in higher education – Using the case study approach to contribute to evidence-based policy
Future of Higher Education – Bologna Process Researchers’ Conference FOHE-BPRC24 – 26 November 2014, National Library, Bucharest, Romania
Dr. Dominic Orr ([email protected]) DZHW Hannover

2Cost-Sharing in Higher Education
The mission – helping the EU advise on country policies related to HE funding
• Open call for tender (2012) by European Commission, Directorate-General for Education and Culture.
• Overall objective of the tendered study:"…to provide a consolidated, accessible and up-to-date overview of the effects of different models of cost-sharing in higher education on participation patterns, the diversity, quality and relevance of educational provision and system efficiency.“
• Time frame: 15 months (Dec. 2012 – Mar. 2014).

3Cost-Sharing in Higher Education
Research team
Project team:• Dominic Orr, Johannes Wespel (DZHW)• Alex Usher (HESA - Higher Education Strategy Associates, Toronto, Canada)
Expert advisors:• Jamil Salmi (HE policy consultant, World Bank Higher Education coordinator ’06-’12)• Bruce Johnstone (Professor of Higher and Comparative Education Emeritus at the State University of New
York at Buffalo)• Jan Sadlak (Professor and Vice-Rector for International Cooperation at the Warsaw School of Social
Sciences and Humanities, Poland; Chief of Section for Higher Education Policy at UNESCO, ’92-’99)

4Cost-Sharing in Higher Education
Country associates
Tasks of country associates:
• Deliver qualitative and quantitative data on all aspects of cost-sharing required by the project plan (in data templates prepared by RT).
• Conduct eight expert interviews per country (based on interview guidelines prepared by RT).
• Help with interpretation of data and review country reports written by RT.

5Cost-Sharing in Higher Education
Selection of cases & timeframe
Canada
Portugal
UK-England Germany Poland
AustriaHungary
Finland
South Korea
• 1995-2010• focus on years after 2000• 2011-2012 included where possible and relevant
1995 1996 1997 1998 1999 2000 2001 2002 2003 2004 2005 2006 2007 2008 2009 2010 2011 2012

7Cost-Sharing in Higher Education
Methodological approach
• Central political intervention analysed in this study: increases in cost-sharing (i.e. rises in the private share of higher education financing).
• Scope: institutional and student side of cost-sharing.
• Analysis of all cases based on four hypotheses capturing common lines of argument in cost-sharing debate.

8Cost-Sharing in Higher Education
• Hypothesis A: As private funding increases, total revenue of HEIs increase, if public funding (at least) remains constant.
• Hypothesis B: As the incentives to earn private funding increase, HEIs become more responsive to student demand, if they have an increased motivation to maximize revenue.
• Hypothesis C: Increasing private funding has a negative effect on student demand, if some students have liquidity or rate of return issues.
• Hypothesis D: Increasing private funding affects student choice of how and what to study, if some students have liquidity or rate of return issues.
Hypotheses

9Cost-Sharing in Higher Education
Design of study – comparative report
Comparative report
1. Introduction2. Descriptive basis: the setting3. Implications at the institutional level4. Implications at the student level5. Policy considerations

10Cost-Sharing in Higher Education
• Clear policy changes in cost-sharing in country sample were restricted to changes in tuition fee policy.
• Distinction between “continuity countries” (CA, FI, HU, KR, PL) and “discontinuity countries” (AT, DE, ENG,PT).
• Tuition fee introduction / reforms in four discontinuity countries:– Austria: winter semester 2001/2002 fee introduction– England: 1998 fee introduction / 2006 (&2012) fee step-up– Germany (five Länder): 2006 / 2007 fee introduction– Portugal: 2003 fee step-up
Approach in comparative report

11Cost-Sharing in Higher Education
Please note:
Higher education data systems remain incomplete.
(Photo from Jason Devaun CC BY-ND 2.0)

12Cost-Sharing in Higher Education
Setting the scene
13Cost-Sharing in Higher Education
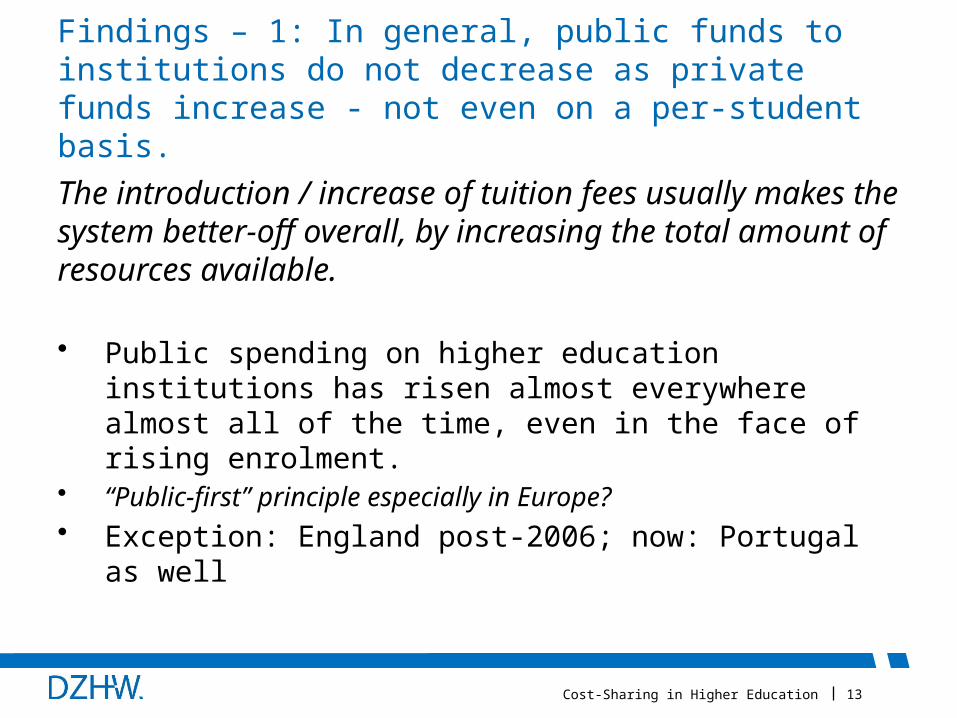
Findings – 1: In general, public funds to institutions do not decrease as private funds increase - not even on a per-student basis.
The introduction / increase of tuition fees usually makes the system better-off overall, by increasing the total amount of resources available.
• Public spending on higher education institutions has risen almost everywhere almost all of the time, even in the face of rising enrolment.
• “Public-first” principle especially in Europe?• Exception: England post-2006; now: Portugal as well

14Cost-Sharing in Higher Education
South Korea: Per-student income of HEIs, by source, in million won (1998-2009)
Note: Constant prices (2011).Source: : Ministry of Education; Korean Education Statistics Service; Higher Education in Korea.
….even in continuity country, growing public funding

15Cost-Sharing in Higher Education
England: Per-student income of HEIs, by source (1995-2011)
Note: Constant prices (2011).Source: Case study research.
….exception England – swap between public and private funding (if you ignore publically funded loans)

16Cost-Sharing in Higher Education
Portugal: Per-student income of HEIs, by source (1999-2007)
Note: Constant prices (2011).Source: Case study research.
….(exception) Portugal – following rise in private funding, stability until end 200s (now swap between public and private due to financial crisis [n.d.])

17Cost-Sharing in Higher Education
Findings – 2: In general, responsiveness as a result of cost-sharing is less marked in traditional universities and more clearly visible in new institutions
Possible reasons:• The shape of competing financial incentives.• The shape of competing prestige incentives.• The (lack of) continuity of government policy-making.
Real responsiveness does not result from putting private funding into public university systems; it comes from permitting new institutions to evolve.
• Austria: 66% of enrolment growth ’95-’10 absorbed by Fachhochschulen.• Finland: 80% of growth absorbed by polytechnics (ammattikorkeakoulu).
Important contextual factor: State regulations concerning HEIs’ profiles, closure of study programmes / student admittance.

18Cost-Sharing in Higher Education
Findings – 3: Demand for higher education has been increasing everywhere throughout the last two decades to such a degree that adverse effects of increased cost-sharing on participation are difficult to establish
Total enrolments in higher education (1995 = 100)

19Cost-Sharing in Higher Education
2000-2003 2004-2006 2007-2009 2010-20126,000
8,000
10,000
12,000
14,000
16,000
18,000
Austria Canada England Finland
Germany Portugal South Korea*
Total annual costs to students in Euros including fees (constant prices 2011)
….please note: look at total costs instead of just fees

20Cost-Sharing in Higher Education
England: Application rates from the lowest income quintile,England, Wales and Scotland (2007-2013)
Source: Universities and Colleges Application Service.
….case England vs. Scotland & Wales (with no fees): applications rates rising similarly

21Cost-Sharing in Higher Education
Findings – 4: Study aid matters (but so do other support measures).
Different types of cost were distinguished in the study:• Fees = gross instructional costs• Net fees (= gross instructional costs minus non-repayable study aid)• Out-of-pocket fees (=net fees minus repayable aid)• Costs of living (student costs including non-instructional costs)

22Cost-Sharing in Higher Education
‘Out-of-pocket’ fees, public institutions only (1995-2010)
Note: ‘Out-of-pocket’ fees = tuition fees minus repayable and non-repayable study aid (grants and loans). Data for England include English and Welsh full-time undergraduate students up until 2004, from 2005 onwards only English full time undergraduate students are included. Constant prices (2011).Source: Case studies.
….is studying really more expensive during studies? out-of-pocket costs

23Cost-Sharing in Higher Education
South Korea: Tuition fees, net fees & ‘out-of-pocket’ fees in public HEIS (1991-2011)
Note: Net student fees is student fees minus grants. Constant prices (2011).Source: Country Index; Ministry of Education.
Out-of-pocket fees
won
Out-of-pocket fees
….is studying really more expensive during studies? KR = increasing loans

24Cost-Sharing in Higher Education
England: Tuition fees, net fees & ‘out-of-pocket’ fees (2001-2011)
Source: Student Loans Company.
2001 2002 2003 2004 2005 2006 2007 2008 2009 2010 2011-3,000
-2,000
-1,000
0
1,000
2,000
3,000
4,000
Fees Net Fees Net Fees After LoansOut-of-pocket fees
Briti
sh p
ound
s
….is studying really more expensive during studies? Eng = increasing loans

25Cost-Sharing in Higher Education
England: HEI spending of fee income (projected) 2015-16
See also http://www.offa.org.uk/wp-content/uploads/2014/07/Access-agreements-for-2015-16-key-statistics-and-analysis.pdf
• Fee income HEIs in England: 2,896 m.• HEI spending via access agreements: 735 m.• Share of fee income spent: c. 25 %
….other support Eng = 25% of fee income used to support students

26Cost-Sharing in Higher Education
Fees in IE and NL
….other issues affect the inclusiveness of a higher education system(fees just one element)

27Cost-Sharing in Higher Education
Recommended main consideration: Cost-sharing strategies call for integrative approaches to institutional funding and student aid.
Figure 1.1: Tuition fees in the context of student expenditures and institutional revenues
housing
tuition fees
food
transport
…
governmentfunding
tuition fees
investmentincome
donations
…
student expenditure institutional income
Source: Authors.
Figure 1.1: Tuition fees in the context of student expenditures and institutional revenues
housing
tuition fees
food
transport
…
governmentfunding
tuition fees
investmentincome
donations
…
student expenditure institutional income
Source: Authors.