Embed Size (px)
Citation preview

46 Magnetic Resonance Imaging of the Female Pelvis
CLINICAL IMAGAGINGAN ATLAS OF DIFFERENTIAL DAIGNOSIS
EISENBERG
DR. Muhammad Bin Zulfiqar PGR-FCPS III SIMS/SHL

• Fig GU 46-1 Submucosal leiomyoma of the uterus. Sagittal T2-weighted image shows a well-circumscribed hypointense leiomyoma (L) almost completely surrounded by endometrium.65

• Fig GU 46-2 Subserosal leiomyomas of the uterus. Sagittal T2-weighted image shows two large subserosal leiomyomas (L), which appear as well-defined hypointense lesions along the superior surface of the uterus.65

• Fig GU 46-3 Prolapsing leiomyoma. Sagittal T2-weighted image shows a large submucosal leiomyoma (M) splaying apart the anterior (A) and posterior (P) lips of the cervix and protruding through the external cervical os. Before imaging, the clinical suspicion based on physical examination was carcinoma of the cervix.66

• Fig GU 46-4 Diffuse adenomyosis. Coronal T2-weighted image shows markedly diffuse enlargement of the junctional zone (arrows) replacing normal myometrium.67

• Fig GU 46-5 Adenomyosis. Sagittal T2-weighted image demonstrates oval areas of thickened junctional zone containing a few hyperintense foci that are characteristic of this condition.66

• Fig GU 46-6 Septate uterus. Axial T2-weighted image at the miduterine (small arrow) level shows a single uterine horn with two endometrial canals divided by a septum (large arrow). (M, myometrium.)68

Fig GU 46-7 Bicornuate uterus. Axial T2-weighted image shows two uterine horns of similar size with functioning endometrium (E).68

• Fig GU 46-8 Endometrial carcinoma (superficially invasive). Sagittal T2-weighted image shows tumor (t) causing segmental disruption of the junctional zone, with tumor confined to the inner half of the myometrium.65

• Fig GU 46-9 Endometrial carcinoma (superficially invasive). Sagittal T2-weighted scan shows tumor (t) extending to the outer half of the myometrium (arrow).65

• Fig GU 46-10 Endometrial carcinoma (deeply invasive). Sagittal T2-weighted image shows tumor (T) extending to the outer half of the myometrium (arrow).66

• Fig GU 46-11 Endometrial carcinoma (value of gadolinium). (A) Sagittal T2-weighted image shows a markedly enlarged endometrial cavity with intact junctional zone (suggesting a stage 1A tumor confined to the myometrium). (B) Sagittal gadolinium-enhanced T1-weighted scan at the same level (bladder contains more urine) shows intermediate-intensity tumor invading the junctional zone and myometrium of the fundus (solid arrows), which was proved at surgery to represent stage 1C tumor (invasion to more than 50% of the endometrium). Note the normal high-intensity enhancement of the posterior myometrium (open arrow).69

• Fig GU 46-12 Cervical carcinoma without full-depth stromal invasion. Coronal T2-weighted image through the cervix demonstrates a thin, intact, low-signal-intensity rim (arrows), representing residual cervical stroma surrounding the medium-signalintensity tumor (T), which expands the cervix. Identification of this intact rim has high predictive value for excluding invasion into the parametrial and paracervical areas. The sacrum (S), iliac bones (i), and levator ani muscles (L) are labeled for orientation.66

• Fig GU 46-13 Cervical carcinoma. Sagittal T2-weighted images show the high-intensity tumor (arrows) extending into the proximal vagina but not invading the bladder wall.69

• Fig GU 46-14 Simple ovarian cysts. Axial T2-weighted image shows two well-defined, homogeneous high-signal-intensity corpus luteum cysts (arrows) in the right ovary.70

• Fig GU 46-15 Hemorrhagic ovarian cyst. Axial T1-weighted image demonstrates a well-defined homogeneous high-signal-intensity mass (arrows). Similar high signal intensity was also seen on T2-weighted images. Spontaneous resolution occurred, differentiating it from an endometrioma.68

• Fig GU 46-16 Dermoid cyst. Axial T2-weighted image shows an oval right ovarian mass containing a fat-fluid level (arrows).69

• Fig GU 46-17 Endometrial (chocolate) cysts. (A) Axial T1-weighted image shows multiple cysts in the right ovary. All three cysts are hyperintense (straight arrows, arrowhead), indicating that the adnexal mass is not due to fat as in a dermoid. (B) On the T2-weighted image, one of the cysts is hyperintense (arrowhead) and the other two are hypointense (straight arrows). U = uterus; curved arrow = left ovary.71
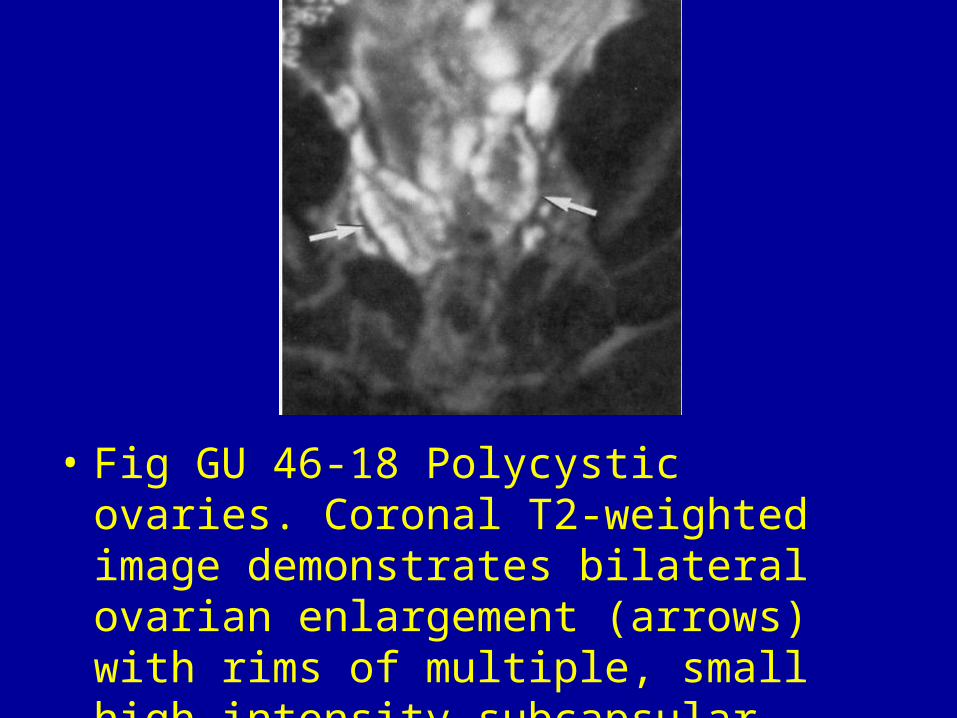
• Fig GU 46-18 Polycystic ovaries. Coronal T2-weighted image demonstrates bilateral ovarian enlargement (arrows) with rims of multiple, small high-intensity subcapsular follicles and abundant central stroma.68

• Fig GU 46-19 Carcinoma of the ovary. (A) Sagittal T2-weighted image shows a large cystic and solid mass located above the uterus and anterior to the rectum. Note that the mass does not seem to be arising from either of these structures. (B) T2-weighted axial image demonstrates the extensive solid components of the mass. Again, the mass does not appear to arise from the rectum and it obliterates the left ovary. Note that the right ovary shows no evidence of tumor (arrow).70

• Fig GU 46-20 Peritoneal and mesenteric implants from ovarian carcinomatosis. T1-weighted image shows numerous very small nodules studding the sigmoid and small bowel mesenteries and omentum (arrows).70

• Fig GU 46-21 Serous carcinoma. T1-weighted contrast image with fat suppression shows a solid nodular, enhancing mass (arrows). Note the enlargement of external iliac lymph nodes bilaterally (arrowheads), which is a strong indicator of malignancy.71

• Fig GU 46-22 Serous papillary carcinoma. (A) Axial T2-weighted images shows a cystic and solid mass (arrows). (B) Contrast-enhanced, fat-suppressed T1-weighted image shows the characteristic exophytic projections of the tumor (arrows).71

• Fig GU 46-23 Metastases to the ovaries. (A) T2-weighted and (B) contrast-enhanced, fat-suppressed T1-weighted images show a multicystic right ovarian mass (short arrows) with a solid component. The irregular thick septa and solid component enhance on the post-contrast image (arrowheads). A rectal tumor (long arrow) in seen.71

• Fig GU 46-24 Fibrothecoma. (A) Sagittal T2-weighted image shows a hypointense solid mass (arrows), reflecting the fibrotic mature of the lesion. U = uterus. (B) Axial T2-weighted image in another patient shows a heterogeneous solid mass (arrows) with intermediate to high signal intensity. There is ascites in the cul-de-sac. The uterus is enlarged, an abnormal finding in this post-menopausal woman.71

• Fig GU 46-25 Brenner tumor. T2-weighted axial image shows a solid mass (arrows) that is sharply demarcated and has low signal intensity. In addition, there is a multicystic mass (arrowheads) that represents a mucinous cystadenoma.71

• Fig GU 46-26 Pelvic congestion syndrome. (A) Coronal T2-weighted image and (B) T1-weighted contrast image with fat-suppression demonstrate severely congested pelvic veins.67
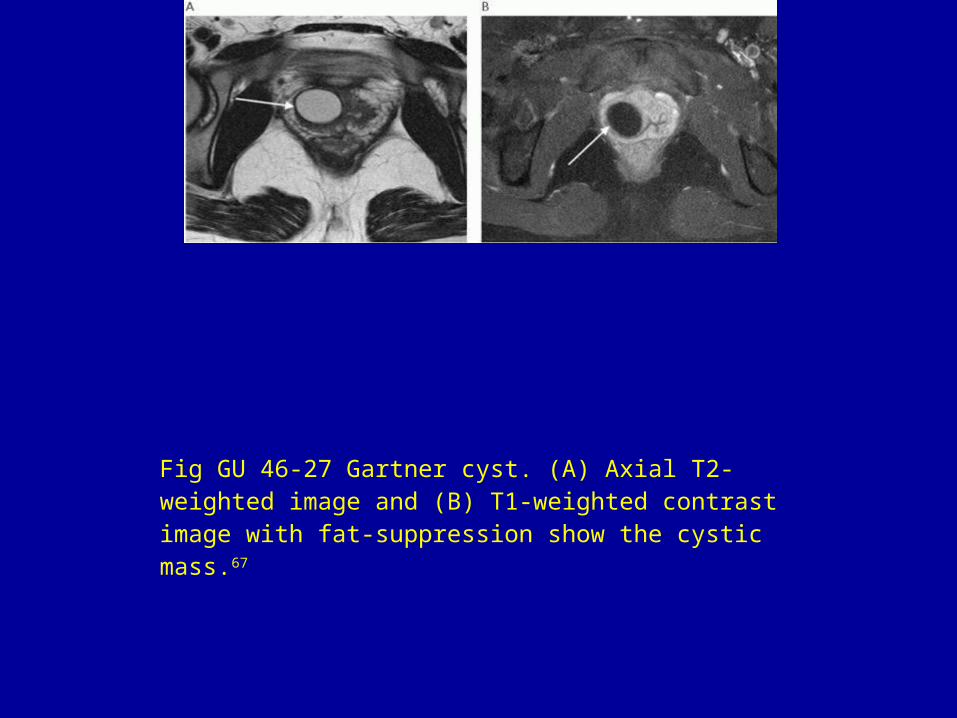
Fig GU 46-27 Gartner cyst. (A) Axial T2-weighted image and (B) T1-weighted contrast image with fat-suppression show the cystic mass.67

• Fig GU 46-28 Periurethral cyst. Sagittal T2-weighted image shows the cystic mass (arrow).67