Embed Size (px)
Citation preview

How to Test a Million(ops/sec)

Wanna Build a Cluster

How to Build?
● Build?
● Deploy/Provision
● Configure
● Orchestrate
● …
Smells like DevOps work
https://jaxenter.com/the-phoenix-project-one-companys-struggle-to-adopt-a-devops-culture-119919.html

How to Test?
● Fill with initial test data
● Load it
● Gather metrics
● Gather state snapshots
● Visualize, analyse, compare
● Tune it
● Repeat

How to Load?
A Loader:
● Distributed
● Asynchronous
● Verbose○ not too much
● Flexible/Extendable
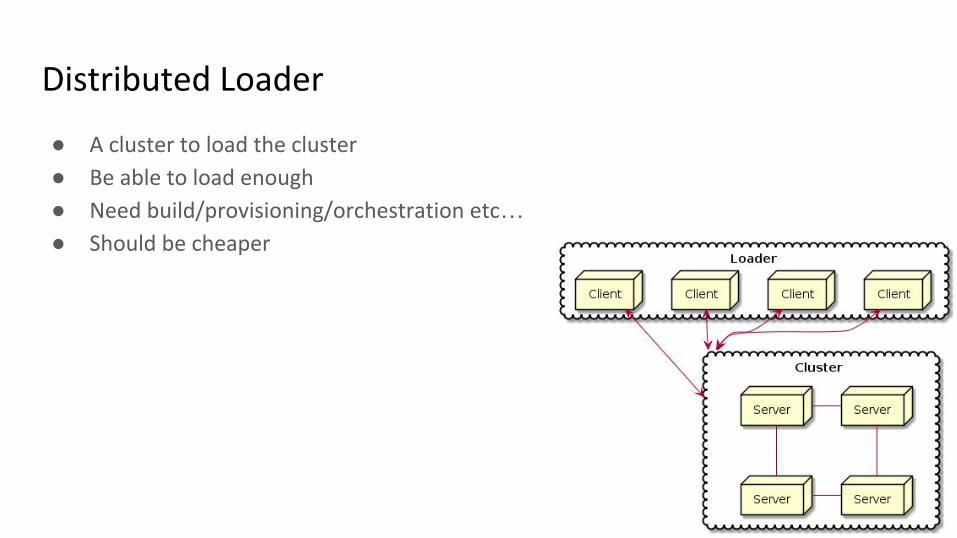
Distributed Loader
● A cluster to load the cluster
● Be able to load enough
● Need build/provisioning/orchestration etc…● Should be cheaper
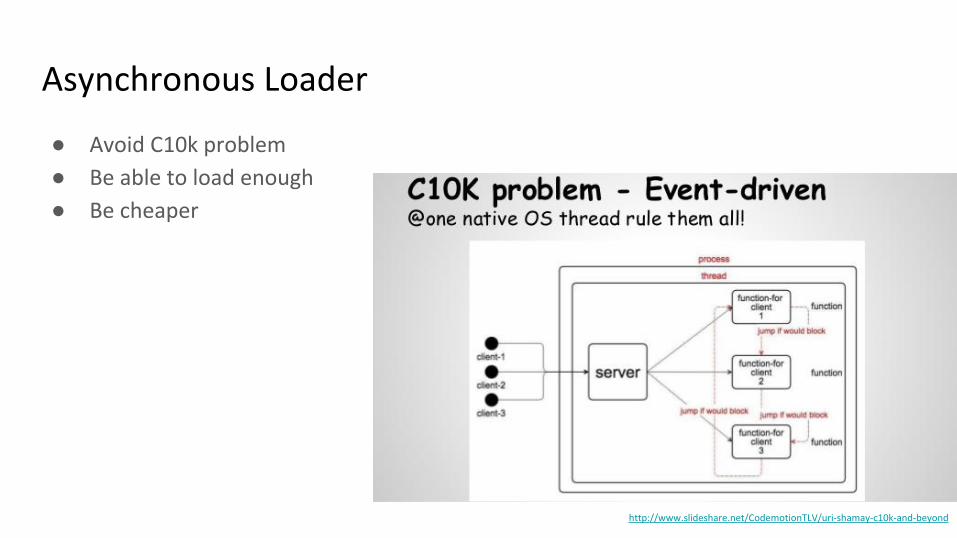
Asynchronous Loader
● Avoid C10k problem
● Be able to load enough
● Be cheaper
http://www.slideshare.net/CodemotionTLV/uri-shamay-c10k-and-beyond

The Asynchronous is...
Async
● java.nio, Netty (Java)
● Akka (Scala)
● Twisted, Tornado (Python)
● Erlang
● libuv + V8 a.k.a. Node.js
● ...
Sync
● java.io, Jetty (Java)
● ANY other traditional IO

Loader-Driver-Protocol-Server

Synchronous Driver
Outside of the event-loop
● Thread Pool
● Connection Pool
Limit the pool size

Synchronous Protocol
A connection for each request
● Connection Pool
Limit the number of connections

Full Async
● Queue of requests
Limit the size of the queue

How to Load the Data?
● Insert them○ It’s a kind of a test
● Take a standard dataset

Loader Verbosity == Metrics
● Operation○ Result (Successful/Failure)
○ Duration a.k.a. Latency
● Operations○ Count
■ Throughput
○ Distribution of Latency
■ Mean value
■ Percentiles: 50%, 90%, 95%, 99%, ...
https://en.wikipedia.org/wiki/Percentile_rank

Percentiles
https://en.wikipedia.org/wiki/Percentile_rank

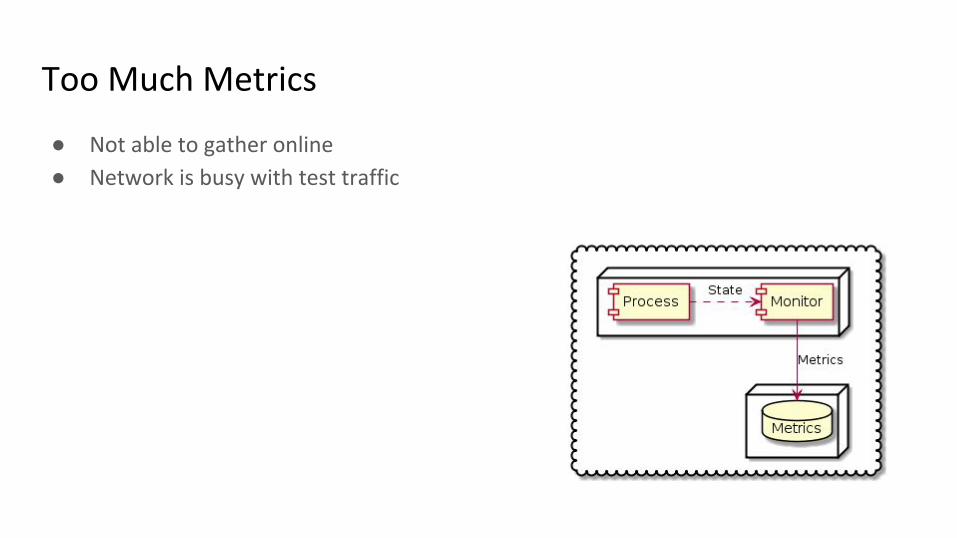
Too Much Metrics
Millions operations per second
● Too much○ to handle
○ to store
● Aggregate on fly○ Count
○ Sum latency
○ Distribution buckets
■ Approximate percentiles
http://www.amiq.com/consulting/2014/06/10/coverage-aware-generation/
Too Much Metrics
● Not able to gather online
● Network is busy with test traffic
Flexible Loader
● Interaction with any type of a test cluster○ driver to any DB
● Any type of the workload○ Key-Value (YCSB)
○ SQL (TPC, ...)
○ … any you like to test
● Any metrics○ depends on workload
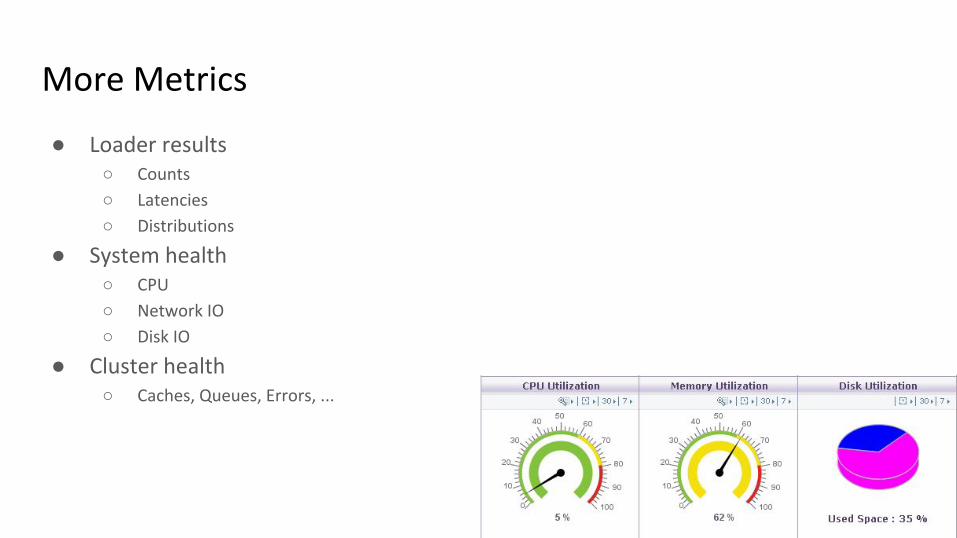
More Metrics
● Loader results○ Counts
○ Latencies
○ Distributions
● System health○ CPU
○ Network IO
○ Disk IO
● Cluster health○ Caches, Queues, Errors, ...

State Snapshots
● Before test○ Disk
○ Memory
○ Cache
○ ...
● After test○ Disk
○ Memory
○ Cache
○ ...
Configuration Snapshot
● Cluster configuration
● Loader configuration
● System configuration
● ANYTHING else which can be adjusted...

Visualise
● Snapshots○ Document database
● Metrics○ For each test separately
○ Time-series database
○ CUSTOM dashboard
● A comparison tool
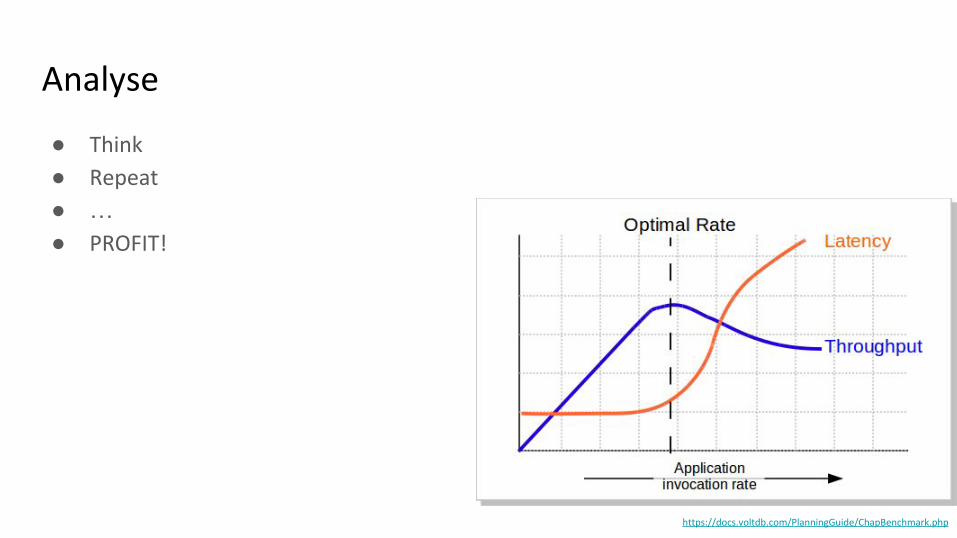
Analyse
● Think
● Repeat
● …● PROFIT!
https://docs.voltdb.com/PlanningGuide/ChapBenchmark.php

YCSB
Yahoo! Cloud Serving Benchmark
● Test NoSQL performance
● Key-Value data model
● Java
● Synchronous
● Single-node
● Metrics = Logs
http://hssl.cs.jhu.edu/wiki/doku.php?id=cs423:fenghuan:nosql

Fabric
SSH-based remote execution framework
● Distribute YCSB
● Gather distributed logs

Tsung
● Simulates HTTP, XMPP, SQL… user activity○ XML scenarios?
● Erlang
● Distributed
● Exports metrics?
● HTML reports
http://www.slideshare.net/hungryblank/erlang-factory-2011-london

MZBench
● Simulates users of Game of War○ ANY scenario on Erlang or Python
● Erlang
● Distributed
● Deploys scenarios
● Orchestrate test runs
● Gathers test metrics○ to Graphite?
● Visualizes test metrics
http://www.slideshare.net/happydev/20151205-mzbench

Node.js
● Asynchronous by definition
● Many DB drivers○ trying to be asynchronous
Ideal for Loader?
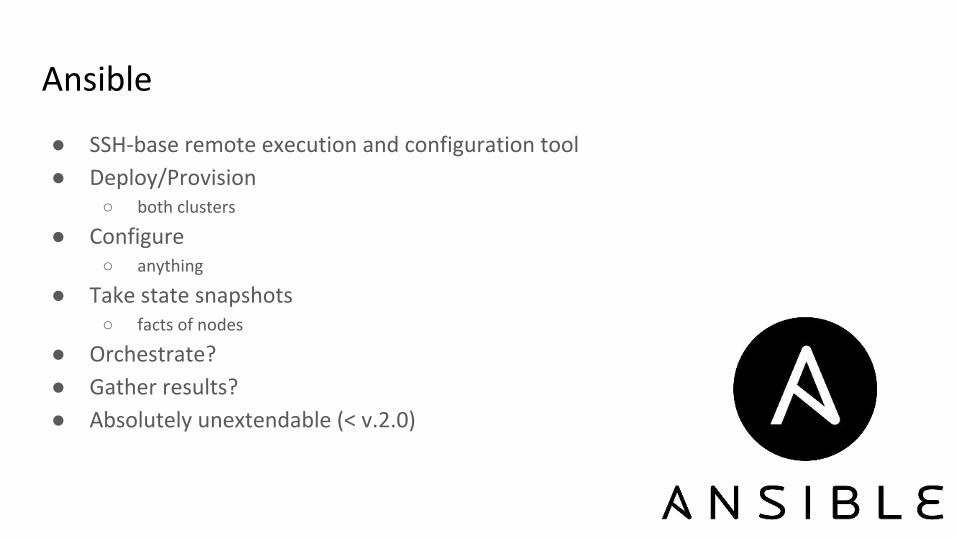
Ansible
● SSH-base remote execution and configuration tool
● Deploy/Provision○ both clusters
● Configure○ anything
● Take state snapshots○ facts of nodes
● Orchestrate?
● Gather results?
● Absolutely unextendable (< v.2.0)

Diamond
● Python
● Gather metrics○ System metrics
○ Cluster metrics
○ Loader metrics?
● Metrics are in Graphite format

Graphite vs. Tags
● Metric name hierarchy○ client.<hostname>.operation.read.latency
● Wildcards for query○ client.*.operation.*.latency
● Tags for each metric○ hosttype=client
○ host=<hostname>
○ operation=read
● Short metric names○ latency
● SQL-like queries○ where hosttype = ‘client’
Tags are non-hierarchical dimensions

http://www.slideshare.net/ErnoAapa/metrics-driven-development-10092014

Graphite
● Time-series database
● Hierarchical metric names
● Always aggregates old data
● Powerful aggregation and processing functions
● Python
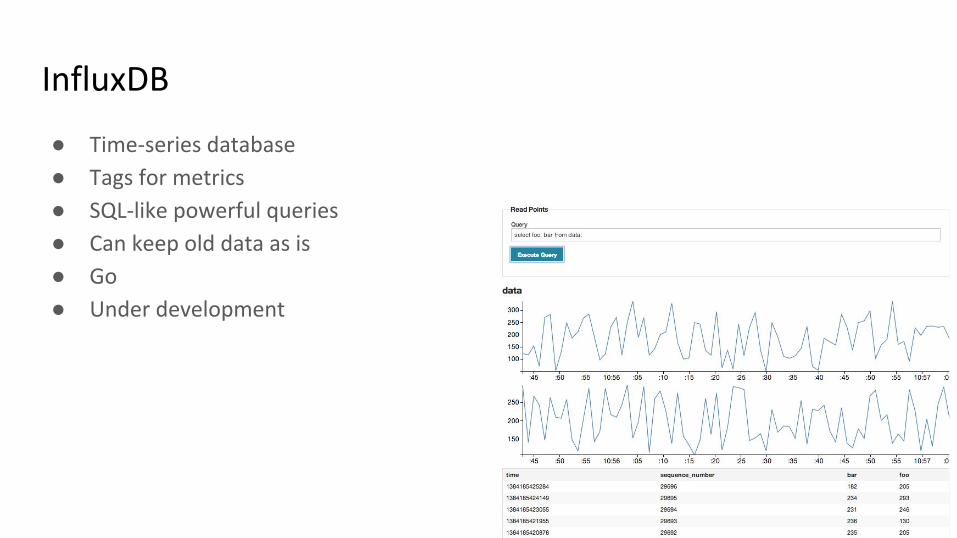
InfluxDB
● Time-series database
● Tags for metrics
● SQL-like powerful queries
● Can keep old data as is
● Go
● Under development

OpenTSDB
● Time-service database
● Tags for metrics
● Keeps old data as is
● Works over Hadoop

Metrics
● Metrics○ Results of the test
● Snapshots (configuration and state)○ Pre and postconditions of the test

Thank You
Denis Nelubin
https://google.com/+DenisNelubin