Embed Size (px)
Citation preview

Stockholm Institute of Transition Economics (SITE) ⋅ Stockholm School of Economics ⋅ Box 6501 ⋅ SE-113 83 Stockholm ⋅ Sweden
Stockholm Institute of Transition Economics
WORKING PAPER
September 2014
No. 27
The EU Leniency Programme and Recidivism
Catarina Marvão
Working papers from Stockholm Institute of Transition Economics (SITE) are preliminary by nature, and are circulated to promote discussion and critical comment. The views expressed here are the authors’ own and not necessarily those of the Institute or any other organization or institution.

The EU Leniency Programme and Recidivism
Catarina Marvao∗
March 31, 2014
ABSTRACT: The EU Leniency Programme (LP) aims to encourage the dissolution
of existing cartels and the deterrence of future cartels, through spontaneous reporting
and/or significant cooperation by cartel members during an investigation. However, the
European Commission guidelines are rather vague in terms of the factors that influence
the granting and scale of fine reductions. As expected, the results shown that the first re-
porting or cooperating firm receives generous fine reductions. More importantly, there
is some evidence that firms can “learn how to play the leniency game”, either learning
how to cheat or how to report, as the reductions given to multiple offenders (and their
cartel partners) are substantially higher. These results have an ambiguous impact on
firms’ incentives and major implications for policy making.
JEL Classification: K21, K42, L4, L51
Keywords: Cartels, competition policy, Leniency Programme, self-reporting
Catarina Marvao
SITE, Stockholm School of Economics
Trinity College Dublin
∗Many thanks to Joseph Harrington, Michele Polo, Giancarlo Spagnolo, Francis O’Toole, Carol Newman,
Cinzia Rovesti and Kai-Uwe Kuhn, for comments and suggestions. This research would not have been
possible without the support of Fundacao para a Ciencia e Tecnologia, Portugal.
1
1 Introduction
Article 1011 of the EU Treaty prohibits explicitly the existence of cartels. However,
recent antitrust cases provide evidence that cartel agreements are a perennial problem
in the EU: in 2011 and 2012, a total of 23 groups of firms were put under formal cartel
investigation by the European Commission DG-Competition.2
Following the example of the “successful” US Leniency Programme of 1978, the
European Commission launched, in July 1996, the European Leniency Programme
(LP) (European.Commission, 1996). This programme grants immunity or reduction
of fines to individual firms that are members of a cartel, in exchange for the initial re-
porting of the cartel and/or relevant cooperation with the Commission during a cartel
investigation. Revisions to the LP occurred in 2002 and 2006 (European.Commission,
2002, 2006), making it more detailed and, in general, more “generous”.3
The procedures are fairly simple: leniency applicants have to submit a fax appli-
cation, but are advised to call the Commission officials beforehand to obtain some
assistance, either directly or through a legal adviser. During the contact, the firm can
find out if there is an ongoing investigation in the relevant market. If the firm is not
first in line, it may cooperate and qualify for a fine reduction under the LP if, besides
additional behavioral conditions, it provides “significant added value with respect to
the evidence already in the Commission’s possession”. This is rather vague, since the
applicant does not know, when applying, what information the European Commission
(EC) has and/or to which extent it can meet the “added value” requirement.
1Article 101 of the Treaty on the Functioning of the European Union, formerly Article 81 of the European
Community Treaty.2Cartel members can report either to the national competition authority or directly to the European Com-
mission. The cases are then dealt with by the EC (DG-Competition) if they have an appreciable effect on
interstate trade or by the national competition authority if they are national cases. This paper only deals with
international cartel cases.3The 2002 guidelines are much more detailed than those of 1996 and provide, in general, for higher
reductions for the reporting firms. The major changes in the LP of 2006 were in terms of clarification and
additional flexibility to the previous LP Notice, regarding the immunity thresholds and the conditions for
fine reductions, as well as the introduction of a discretionary marker system, so as to preserve an informant’s
position as being the first to come forward and disclose the cartel.
2

The present paper attempts to address the following question: what incentives does
a firm have to apply to the LP? In other words, which firm or cartel characteristics
influence the leniency decision by the Commission? Ideally, the expectations by firms
are such that the programme creates a destabilizing effect for existing cartels and deters
future cartels, but there may exist a divergence between law and the stated guidelines
and practice.
The empirical literature is recent and includes several papers that merely analyze
descriptive statistics on the LP (e.g. Connor (2007), Berinde (2008), Veljanovski
(2010) and Asker (2010)). One of the first empirical papers using econometric methods
is by Borrell and Jimenez-Gonzalez (2008), who look at the drivers of antitrust effec-
tiveness and find it to be increased by the LP. Levenstein and Suslow (2011) estimate
the impact of organizational mechanisms such as moral hazard problems, which are
discussed in more detail below, while Miller (2009) finds that the number of cartels
discovered increases in the periods around the introduction of the LP and decreases to
pre-LP levels afterwards.
The empirical works that most closely relate to this paper are by Sjoerd (2005) and
Brenner (2009). Sjoerd uses data on 67 EU cartel cases between 1990 and 2004, while
Brenner uses data on 61 EU cartels in the period 1990 to 2003. Sjoerd finds that the
LP, measured by a dummy for whether a firm received maximum leniency or not, is
positively correlated with the number of words in the decision (it is assumed that this is
an appropriate proxy for the amount of information the Commission already had) and
the gravity of the infringement. The size of the reduced fine as a share of the firm’s
turnover is also found to be higher after the LP is introduced. Brenner finds a similar
result when looking at the average of the absolute values of both the reduced and total
fines. Additionally, both authors find that the duration of the investigation decreases
once the LP is in place.
The present paper contributes to the existing literature by empirically examining
which factors give incentives to cartel members to self-report. This is also the first pa-
per to specifically examine the case of recidivism and to use a Tobit model to analyze
firm-level data, which was collected by the author.
3

Not surprisingly, the empirical results confirm that the first reporter receives sig-
nificantly higher reductions. More importantly, they illustrate how the 67 multiple
offending firms can apparently play the “leniency game” and receive predicted reduc-
tions, on average, 20 percentage points higher than single offending firms. Although
the LP creates an incentive to report the cartel, there may exist at least a temporary
incentive to collude and then be the first reporter. To reinforce this finding, it is shown
that the number of repeat (and multiple) offenders in a cartel also has a significant, pos-
itive and large impact on the predicted individual leniency reduction. The implications
of these findings are discussed further in the paper, suggesting that the fines for repeat
and multiple offenders should be unrestricted or, at least, more severe.
From a policy point of view, at present, more cartels appear to be dissolving. This
is either due to an effective LP that is able to encourage the dissolution of current car-
tels, or to a LP which causes more cartels to form and, as a result, more cartels to be
discovered and/or reported. The long-run aim is, or should be, to deter new cartels
from forming, but the LP carries a potential problem of moral hazard in the sense that
a cartel member might behave differently from if it were to receive no fine reduction
and competition authorities (CAs) may be placing too much weight on increasing the
number of convictions, to the detriment of increased deterrence. The long-run effect
of the LP is not explicitly measured or evaluated in this paper, but the fact that there
are several multiple and repeat offenders and that these, within the current LP, seem to
receive additional fine reductions, suggests that the long-run underlying trade-off may
not be set in an ideal manner.
The organization of the rest of the paper is as follows. In the next section, the
dataset is described and the specific case of multiple and repeat offenders is discussed.
The empirical methodology is described in Section 3 before the results are presented in
Section 4. Section 5 offers concluding comments.
4

2 Data
2.1 Data collection
The data employed in the empirical analysis were collected by the author using
publicly available summary reports and associated press releases of the antitrust cases
handled by the European Commission and accessible via the Commission’s website.
Within the set of all cartel cases since 1996 (107 cartels), only those in which there
was at least one successful LP application were selected (93 cartels were fined in 71
EU decisions).4 The final decisions on the setting of fines, for the cases under analysis,
were taken between 19985 and 2013 and include the universe of cases making use of
the LP, up to October 10th 2013. The starting dates of the investigation of these cases
range between 1994 and 2012. The investigation year is the official date in which the
Commission started the investigation and hence not necessarily the same date/year in
which the cartel was reported. The 93 cartels involve 439 cartel members, in a total
of 553 firm-level observations, as several firms took part in more than one cartel and
are therefore labeled multiple or repeat offenders. This is discussed in the next section.
Other datasets have been used by other authors in the description and analysis of cartels.
A summary of these can be found in Table 8 in the Appendix.
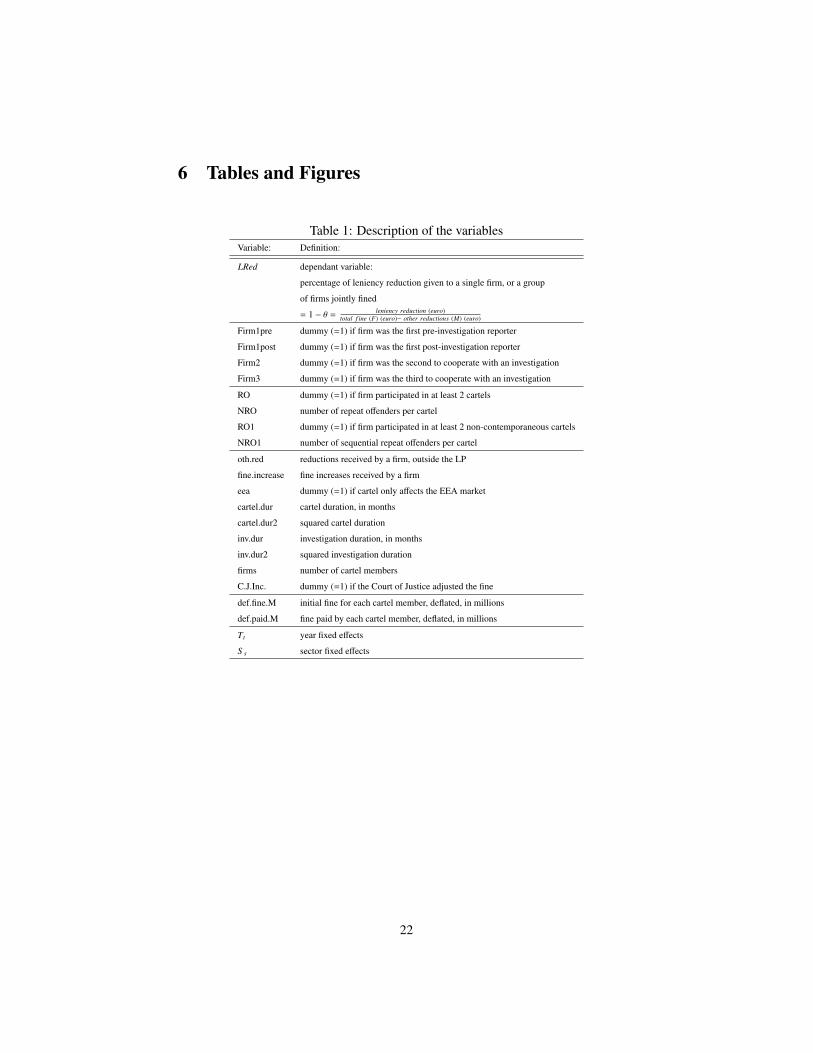
Tables 1 and 2 define and describe the variables for use in the model specifications.
The percentage of leniency reduction is used since, according to the current legislation,
the absolute amount of the fine is capped at 10% of the firm’s worldwide turnover in
the previous year and comprehensive information on the relevant turnover is not avail-
able.6 Also, the percentage values are more representative when comparing across
4It is important to note that cartels, and not cases, are analyzed in the chapter, since within the same case
there may be several cartels, possibly with different members and different fines and fine reductions. The 93
cartels correspond to 71 cases. See Table 3 for further details.5The first decision applying the LP to a cartel case was in 1998, on a cartel involving British Sugar.
The complaint was made in 1994 and after the introduction of the LP; all four cartel members applied for
leniency. Three reductions of 10% and one of 50% were granted.6The highest fines imposed, after leniency and other reductions, on a cartel member were for Saint-
Gobain SA, which was fined 896 million euros after having received, in 2009, 50% leniency reduction, for
its participation in a car glass cartel; and for F.Hoffmann-La Roche AG, in 2001, of 462 million euros (again,
after a 50% leniency), for being a member of a vitamins cartel.
5

firms and cases. For each cartel, information was gathered on the duration of both the
cartel and the investigation carried out by the Commission, the number of firms and of
multiple or repeat offenders per cartel, the geographic area in which the cartel impacted
customer prices (EEA or extra-EEA countries), the specific LP in use (1996, 2002 or
2006), whether or not the case was initiated due to a leniency application, the type of
cartel infringement, and the years in which the cartel was reported to the Commission,
the investigation was initiated and final decision was made. There is also information
on whether a Court of Justice judgement occurred and led to a re-imposition of fines,
subsequent to a decision by the Commission. The cartel infringements in the cases
under analysis are mainly price-fixing, but also relate to the allocation of tenders, the
fixing of quotas and sales conditions, the sharing of geographic markets, the exchange
of sensitive information on prices, sales volumes and procurement tenders, the elimi-
nation of price discounts, and bid-rigging. Firm-level information was also collected
and includes information on the individual fine both before and after the leniency re-
duction, whether the firm is the first reporter (either pre or post-investigation) and other
fine reductions or increases obtained previously to and independently of the application
of the LP, due to mitigating or aggravating circumstances.
[Table 1 here]
[Table 2 here]
2.2 Data description
The number of cartels discovered since 1998 has been growing each year, as has the
total number of firms involved in cartels. This is shown in Table 3, which reports the
number of cartel cases closed, the number of firms fined in each year and the number of
leniency reductions, for the period between 1998 and October 2013. It is important to
bear in mind that the figures presented for the number of cases using the LP may differ
slightly from the actual values, due to the cases under investigation (open) and those for
which public information was not yet available in October 2013. The figures for “open
cases” correspond to the latest update on a case, i.e., the year in which a given case
had its last development, as of October 2013. The cases are also differentiated by what
6

led to the discovery of the cartel. The number of cases found through pre-investigation
leniency applications has increased dramatically, reaching as high as 83% in 2008 (5
of 6 cases), 86% in 2009 (6 of 7 cases) and 100% in 2010 to October 2013, and thus
the number of leniency reductions granted has also increased. However, some of these
reports may have been triggered by US investigations and/or decisions. In fact, at least
25% of the cases which were reported to the EU Commission by a cartel member,
were first convicted in the US, and at least another 20% were convicted by US and
EU authorities in the same year7. The remaining cases were discovered due to other
reasons, such as reporting by a third party (e.g. a customer or rival firm) or under the
Commission’s own initiative, perhaps by observing the evolution of prices. It is also
shown that, on average, 38 cartel members are fined and 18 leniency reductions and 7
reductions for mitigating circumstances are granted each year.
[Table 3 here]
Table 4 reports the allocation of the percentage of leniency reductions granted, in
periods of 5 years. The “generosity” and willingness to provide incentives to self-
reporting have visibly increased: 31% of the reductions correspond to immunity in the
period of 2008 to October 2013, while full immunity corresponded to a very small
share in the initial period (9%). Conversely, reductions below 10% became very scarce
(falling from 23% to 7%).
Over half of the firms in cartels with leniency applicants (56%) received a fine
reduction and 12% received full immunity.8 These numbers illustrate the increasing
importance of the programme, not only in terms of the amount of reductions granted
in each cartel case, but also in the number of pre-investigation leniency applications.
It also highlights the need to understand the main factors affecting the Commission’s
leniency decisions.
[Table 4 here]7A further 4% of the cases were also convicted in the EU and US but there is no information on the year
of conviction in the US.8The discontinuity in the amount of fine reductions is due to the range of leniency reductions set in the
guidelines, for each reporting or cooperating firm.
7

The value of the paid fine is calculated by deducting leniency and other reductions
and adding fine increases to the initial value of the fine. Both total and average fines
have been increasing, as the total number of cartel members fined in each year has also
been increasing, in particular following the introduction of the Leniency Programme in
2006. Additional fines increase the revenue for the authorities, which can then be used
to carry out unannounced inspections, and to investigate and prosecute firms.
The chemicals’ sector, and in particular pharmaceuticals, involves a great deal of
intellectual property rights, which makes collusive agreements more attractive, in the
sense that these would delay the entry of cheaper generic medicines. This is the sector
where the vast majority of leniency applications occurred. It is followed by the indus-
trial inputs and transport sectors (32% and 13% of the cases, respectively).
2.3 Multiple and Repeat Offenders
The LP Notice is not explicit as to whether or not multiple or repeat offenders
should receive a lower reduction. Chen and Rey (2012) suggest that they should, while
Houba et al. (2009) and the Greek competition authority9 suggest the opposite. Tables
5 and 6 show the distribution of the firms fined according to the number of cartels in
which they have taken part. The numbers may even be underestimated since there is no
information on unknown cartels, both past and present. Most firms (84.8%) have been
found to participate in only one cartel, but more serious are the cases of Akzo Nobel,
F.Hoffman-La Roche and BASF, which in the past 11 years have been fined for their
roles in 9 cartels each, and which received significant leniency reductions in most of
the cases.
[Table 5 here]
[Table 6 here]
It is challenging to define the term “repeat offender” precisely in the present con-
text. Three firms (Akzo, Degussa and Sumitomo) started to participate in a new cartel
9Available at:www.epant.gr/faqs.php.
8

after being previously fined. Four other firms (Mitsubishi, ABB, FMC and Thyssen
Krupp) only ended their participation in a cartel after being fined for participation in
another cartel. Finally, a total of 67 firms have participated, contemporaneously or oth-
erwise, in at least two cartels.
The 2006 Leniency Notice states that a repeat offender is any firm that was pre-
viously found to infringe Articles 101 or 102 of the EU Treaty, which corresponds to
seven of the firms included in this paper (definition 1, RO). Nonetheless, if an investi-
gation into a cartel member is initiated after all the cartels in which it participated have
ended, the firm still has an incentive to report the other cartel(s) and apply for the LP
if it believes that there is a high probability of conviction of those cartels. The data
show that it does not seem to be the case that firms report cartels in different markets,
as happens with the US Amnesty Plus Programme. Instead, it seems that firms learn
how to use the LP to their benefit, either by learning what and when to report or how
to be the first reporter. Therefore, a broader definition of the term is also considered,
including any firm that was convicted for collusion at least twice, which corresponds
to 15.84% of the firms in the analysis (67 out of 441) (definition 2, RO1). Including
both definitions in the empirical analysis allows to distinguish between simultaneous
and sequential cartels, as these can imply very distinct problems in the design of the
leniency rules.
Akzo Nobel N.V. is one of the main players in the chemicals’ sector and one of the
main repeat offenders. Details on its involvement in collusive agreements are included
in Table 9 in the Appendix, as an example of a repeat offending firm.
3 Empirical Model
The econometric work provides insight into how the Commission makes decisions
regarding the leniency reductions granted to cartel members. This work does not at-
tempt to identify the characteristics of the reporting firm, to discuss the optimal design
of the Leniency Programme.
Two main criteria influenced the choice of the specific empirical method. First, it
9

is likely that the decisions to grant a leniency reduction and on its amount are directly
related. Second, the purpose of this paper is to examine which factors incentivize a car-
tel member to apply to the LP and the differences between the LP Notice and reality.
Since the LP only allows for fine reductions, the zeros in the dependent variable need
to be modeled. This is a problem of censoring rather than of sample selection bias, so
using a censoring model on the data for all the firms in cartels with at least one leniency
applicant, should provide consistent results. The appropriate approach is a Tobit which
jointly models the factors affecting the decisions to grant a fine reduction and on its
amount, and takes into account the censoring of the zeros.
Jointly modeling the three leniency programmes (of 1996, 2002 and 2006) provides
a very small scope for conclusions, as the programmes have changed over time. Sep-
arate estimations for each LP produce a more accurate analysis as they allow one to
study its evolution. This paper focuses on the current LP (of 2006), since it is the most
relevant for policy making. Nevertheless, the same analysis is carried out for the two
previous LPs and, while these results are not discussed, they are included in Table 12
in the Appendix.
According to the LPs of 2002 and 2006, the first firm to report a secret cartel re-
ceives full immunity10, so firms who self-reported and received immunity from fines
are excluded. This will better illustrate the characteristics of firms who received higher
fines and of the cartels in which they took part.
Under this approach, the leniency reduction for each cartel member is identified
by Firm1post, Firm2 and Firm3, depending on their place in the “reporting queue”,
and the number of firms in the cartel is given by f irms. According to the legislation,11
10Immunity is granted provided the firm complies with the CA’s conditions. Since the LP of 2002 was put
in place, only one initial applicant firm has not received full immunity, as its reporting was not completely
voluntary (according to the case press release). Instead, a 90% reduction was granted.11According to the current “Guidelines on the method of setting fines” imposed pursuant to Arti-
cle 23(2)(a) of Regulation No 1/2003, 2006/C, 210/02, the individual cartel fine is imposed as F =
F0 + A − M = [k(gt)salest−1][a%cartel duration + b% + (A − M)]. In the formula, t represents the
time period, k(gt) is a multiplier of proportional penalty that depends on the gravity of the offense (gt),
a ≤ 30% depends on the degree of gravity of the infringement and bε[15%, 25%] aims at deterring un-
dertakings from entering horizontal price-fixing, market-sharing and output limitation agreements. The
main changes to the previous Guidelines are a new entry fee, higher fines for repeat offenders and a
10

the fine depends on the duration of the cartel (cartel.dur) and is adjusted by aggra-
vating circumstances (fine.increase), including recidivism (RO, RO1), and mitigating
circumstances (oth.red), so these variables are all included in the model. The number
of multiple and repeat offenders is also included (NRO, NRO1).Finally, additional vari-
ables are included to account for the geographic area of impact by the cartel’s activities
(eea), the duration of the investigation (inv.dur and inv.dur2) and the accuracy of the
decision (C.J.Inc.), as the court of Justice has altered the set penalties in several cases.
Therefore, the canonical specification of the model takes the following form:
LRedi jt = β0 + β1Firm1posti jt + β2Firm2i jt + β3Firm3i jt
+ β4ROi jt + β5NRO jt + β6RO1i jt + β7NRO1 jt
+ β8 f ine.increasei jt + β9oth.redi jt
+ β10 f irms jt + β11eea jt + β12cartel.dur jt
+ β13inv.dur jt + β14inv.dur2 jt + β15C.J.Inc. jt +$Tt + %S s + εi jt
where i and j are the indices for firm and case, respectively; ε is the error term, which
is assumed to be i.i.d.; $ is the vector of year dummies (T ), where t is the decision
year in each cartel case; and % is the vector of sector dummies (S ), where s denotes
each sector.
3.1 Sample Selection Bias
One concern with the data is the possibility of sample selection bias. Four possible
biases may arise:
link between fines and cartel duration. For further information refer to the Guidelines, available at:
http : //ec.europa.eu/competition/antitrust/legislation/ f ines.html. The fine is adjusted according to ag-
gravating (A) and mitigating (M) circumstances. Aggravating circumstances apply in the cases of recidivism
(i.e. repeat offenders), absence of cooperation, obstruction to the investigation, or role of cartel leader or
instigator. Mitigating circumstances relate to termination of the infringement at the time of the investigation,
negligence as the cause of the cartel, limited involvement in the cartel, cooperation with the Commission
outside the LP, or proof of having been encouraged by public authorities or legislation. The final value of the
fine is capped at 10% of the total turnover of the firm in the previous year and special conditions are set in
the case of inability to pay.
11

(i) Since cartels are prohibited by the EU Treaty, they are secret so the available
data only include cartels that were prosecuted and convicted. Past cartels may have
remained secret because their members did not have a strong enough incentive to report
them. This problem of selection on the unobservables cannot be overcome, but its
existence is acknowledged in the interpretation of the results.
(ii) One other issue which may generate selection on the unobservables is the case
of “repeat offenders”. There may be individual unobservable characteristics of these
firms that determine their repeated participation in cartels. In the empirical analysis,
dummy variables controlling for multiple and repeat offenders are included so as to
discover whether recidivism is relevant or not in the setting of the leniency reductions.
This issue requires a more complex analysis of repeat offenders and is discussed further
in the next section.
(iii) The term “single offender” may be misleading, either because the firm also
took part in an undiscovered cartel or because the cartel for which it is being prosecuted
has not yet been convicted. Again, there is nothing that can be done with regards to this
issue, but to acknowledge that the number of repeat offenders may be underestimated.
(iv) The cases in which there was no successful LP application are excluded (14
cases for the period concerned), which makes the data a non-random subset of the total
of discovered and secret cartels. Cases without LP applications are, however, irrelevant
for this paper’s research question. Nevertheless, a Heckman two-stage model12 is used
to examine the possibility of sample selection bias in the data for leniency reductions
and the inverse mills ratio is not significant, which means that there is no selection bias
on the observable variables that have been included in the selection step. The results
are shown in Tables 10 and 11 in the Appendix.
3.2 Endogeneity
One other concern with the data is the possibility of reverse causality regarding the
variable accounting for the duration of the cartel and which is likely to be linked to
12In the Heckman two-stage model (Heckman, 1979), the first stage corresponds to a Probit modeling
of the probability of receiving a leniency reduction, and the second stage is a fixed effects model which
measures the amount of leniency reduction granted.
12

whether or not a leniency application was received by the competition authority. For
this reason, an instrumental variable is introduced in the Tobit estimation. To instru-
ment for cartel duration, the value of the initial fine set by the Commission is used, as it
is directly related to the duration of the cartel but is unlikely to be related to the percent-
age of leniency reduction granted to each cartel member. Nonetheless, it is shown that
this is not a serious issue as the results are robust throughout the specifications. This is
also supported by the analysis of the qualitative information on these cartels, where it
is clear that the duration of the cartel is not directly correlated with the level of leniency
reductions granted or with the application for a leniency reduction (see Figures 1 and
2 in the Appendix).
4 Results
Table 7 presents the Tobit results for the current LP. The values reported correspond
to the marginal effects calculated at the sample means of the data, since the coefficients
from the Tobit model measure the change in the latent dependent variable. Clustering
is done at the cartel level, but the results are robust to clustering at the case level and
there is no serious issue of sample selection bias on the observable variables, as tested
by the Heckman two-stage model. The possible existence of a selection bias on unob-
servables is of course acknowledged.
To control for a possible endogeneity issue in the cartel duration variable, column
(3) consists of an instrumental variable Tobit estimation. Columns (5) and (6) present
an alternative definition of repeat offenders. Columns (4) and (5) include the individual
fine increase, which is due to recidivism or other aggravating circumstances. Columns
(4) to (6) are the preferred specifications.
The majority of the variables are not robust or are statistically insignificant. The
surprising exceptions are the variables that control for recidivism, which present nega-
tive and statistically significant coefficients.
13
[Table 7 here]
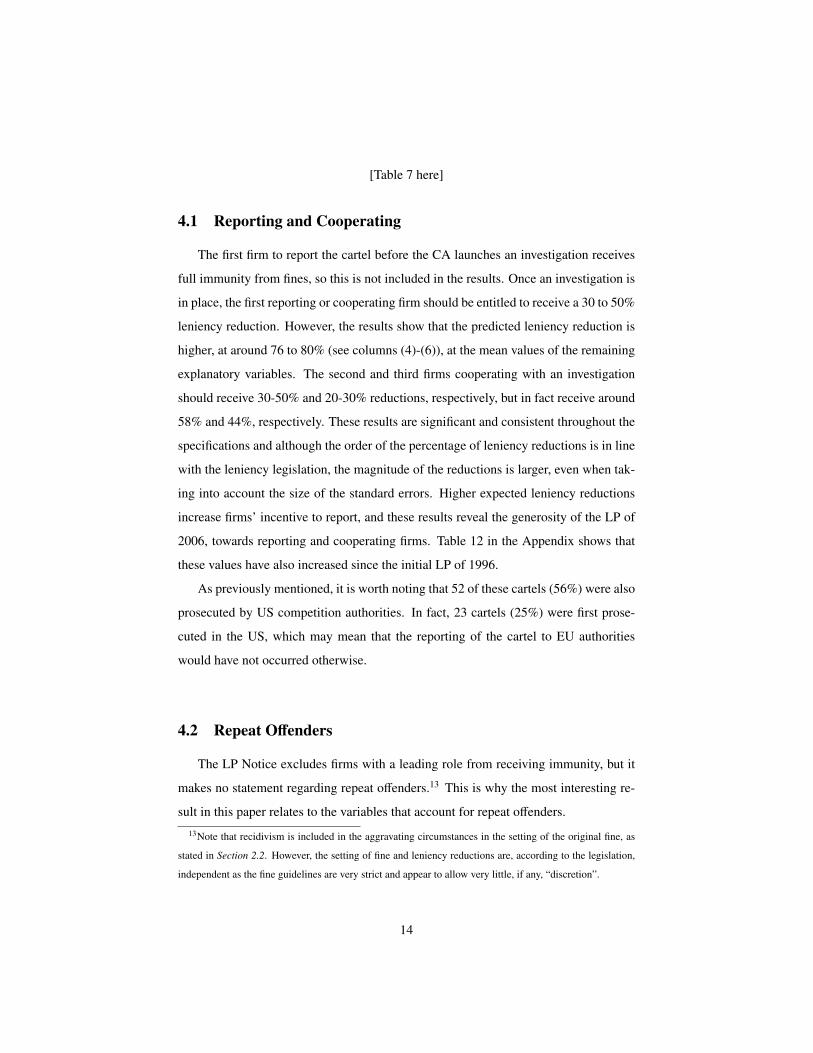
4.1 Reporting and Cooperating
The first firm to report the cartel before the CA launches an investigation receives
full immunity from fines, so this is not included in the results. Once an investigation is
in place, the first reporting or cooperating firm should be entitled to receive a 30 to 50%
leniency reduction. However, the results show that the predicted leniency reduction is
higher, at around 76 to 80% (see columns (4)-(6)), at the mean values of the remaining
explanatory variables. The second and third firms cooperating with an investigation
should receive 30-50% and 20-30% reductions, respectively, but in fact receive around
58% and 44%, respectively. These results are significant and consistent throughout the
specifications and although the order of the percentage of leniency reductions is in line
with the leniency legislation, the magnitude of the reductions is larger, even when tak-
ing into account the size of the standard errors. Higher expected leniency reductions
increase firms’ incentive to report, and these results reveal the generosity of the LP of
2006, towards reporting and cooperating firms. Table 12 in the Appendix shows that
these values have also increased since the initial LP of 1996.
As previously mentioned, it is worth noting that 52 of these cartels (56%) were also
prosecuted by US competition authorities. In fact, 23 cartels (25%) were first prose-
cuted in the US, which may mean that the reporting of the cartel to EU authorities
would have not occurred otherwise.
4.2 Repeat Offenders
The LP Notice excludes firms with a leading role from receiving immunity, but it
makes no statement regarding repeat offenders.13 This is why the most interesting re-
sult in this paper relates to the variables that account for repeat offenders.
13Note that recidivism is included in the aggravating circumstances in the setting of the original fine, as
stated in Section 2.2. However, the setting of fine and leniency reductions are, according to the legislation,
independent as the fine guidelines are very strict and appear to allow very little, if any, “discretion”.
14

As previously mentioned, RO includes any cartel member who has been found to
collude at least twice, whereas RO1 accounts for cartel members who colluded sequen-
tially in at least two cartels. This is important in distinguishing between multiple and
repeat offenders, which imply different problems in the design of the leniency rules.
The variable fine.increase, instead, includes recidivism and any other factors that lead
to fine increases.
It is found that, for the observed cartel cases and despite the fact that leniency re-
ductions should not be affected by recidivism, the predicted leniency reduction is 19 to
26 percentage points higher for multiple offenders (RO) than for single offending firms,
at the mean values of the remaining explanatory variables. In addition, the number of
multiple offenders per cartel (NRO) also has a positive and significant impact on the
firm’s predicted leniency reduction.
When the analysis takes into account sequential offences (RO1), it is the number of
repeat offenders per cartel (NRO1) that drives the main effect on the leniency reduction
granted. While repeat offenders seem to receive reductions which are 35 percentage
points lower than for other firms, for each repeat offender in a cartel the predicted le-
niency reduction is around 50 percentage points higher (for a maximum number of two
repeat offenders per cartel), at the sample mean values. It is also worrying that these
effects are more serious in the current LP than in the previous programmes, where re-
peat offending firms seemed to receive lower leniency reductions.
The leniency reduction should also be independent from the fine increase, as it is
shown for the data in the analysis. However, Sjoerd (2005) finds that the gravity of the
infringement increases the leniency reduction. While Sjoerd’s result is not corroborated
in this analysis, it is shown that, in the LPs of 1996 and 2002, the leniency reductions
were around 11 and 6 percentage points smaller if the original fine was increased, at
the mean values. Again, these results are likely to be underestimated and may carry a
problem of selection in the unobservables.
The above discussed results are robust, causal and possibly suggest some strategic
behavior: a previously fined firm can arguably learn “the rules of the game” and take
advantage of the LP by being the first reporter or by providing better or more extensive
information.
15

In the cases analyzed, fewer than half of the repeat or multiple offenders were the
first reporter (32% and 20%, respectively) but a large share received a leniency reduc-
tion (59% and 68%, respectively). Repeat offending firms often collude with the same
set of firms (eg. Akzo, Arkema France and Degussa Evonik) and they seem to take
turns in the reporting of the cartel to the Commission. It is surprising that a firm would
collude in a new cartel (although for a different product) with a firm who reported their
previous collusive agreement.
As mentioned in Section 2, some multiple and repeat offending firms also merge
with or acquire a firm with whom they previously colluded. It is not clear why firms
would enter a collusive agreement if they could merge. A merger is, in theory, a better
strategy than collusion since while both may give rise to monopoly gains, a collusive
agreement comes with the inherent risk of detection. Moreover, a merger also allows
cost savings by increasing efficiency. Hence, firms would be expected to choose to
merge instead of colluding, when the two options are available. The existence of the
LP may, however, change firms’ incentives as the risk of detection is higher but the
reporting of the cartel may grant the firm immunity from fines. One example of this
scenario is Akzo and BASF. Between 1992 and 1998, Akzo, BASF and four other firms
participated in a cartel in choline chloride. When Chinook (one of the cartel members)
reported the cartel to the Commission, in 1998, and the firms were fined (with a 20%
leniency reduction for BASF and 30% for AKZO), Akzo acquired BASF’s decorative
coatings business in Europe, increasing its market share in coatings from 5% to 60%.
Although examples of recurrent cartel partners and mergers or acquisitions of previous
partners can be found in several industries, these practices are particularly evident in
the pharmaceutical industry, which is the industry where most EU cartels occur and in
which Akzo is one of the largest players.
It is difficult to understand why repeat and multiple offenders receive larger le-
niency reductions. It may be that, due to their previous experience, these firms are
faster to react as a second reporter or once the investigation is initiated in order to mit-
igate the effects of having to pay the fine. It could also be that these firms gather more
16
information so as to add significant value to a possible investigation. This could signify
that firms learn how to report, and not necessarily how to cheat. To shed some light
on this issue, the econometric model is restricted to the set of multiple offenders. The
results are shown in Table 13 in the Appendix. While the results in the LP of 2006 are
fairly similar to those for all cartel members, the impacts of being a repeat offender,
of the geographical area and of receiving other reductions are much larger. The num-
ber of cartel members becomes significant and its coefficient is negative. The leniency
reduction for a multiple offender is 5 to 10 percentage points smaller with each addi-
tional firm taking part in the cartel, at the mean values of the remaining variables. This
finding suggests that larger cartels are less stable and multiple offenders may not be as
fast in reporting, or they may have less information which adds value to the investiga-
tion. The decision by the Court of Justice is also significant in explaining the leniency
reductions for multiple offenders. In the cases where the fine is later amended by the
Court of Justice, multiple offenders seem to receive larger reductions. The opposite is
true for single offending firms, as can be seen in the results for all the cartel members.
Finally, a variable which controls for the number of cartels in which each multiple of-
fender took part is included. Although the result is not robust, it seems that the amount
of leniency reduction is larger for firms which have taken part in more cartels.
There may also be specific characteristics of these firms which make them more
prone to colluding. Multiple and repeat offending firms tend to be big in terms of their
sales or market share, which may provide them with the means to orchestrate a cartel.
They may also be more skillful and thus, better at colluding, even if the firm would
have high rates of return without the collusive agreement. One other possibility is the
firm’s corporate culture or the market in which they act. In India, for example, perhaps
because of the lack of fear of sanctions, there is a culture of cartelizing. Depression
cartels are allowed in many countries, in industries which require price and produc-
tion stability. In Japan, such arrangements have been permitted in the steel, aluminum
smelting, ship building and various chemical industries.
It is in the EU’s interest that firms self-report so that cartel members can be con-
17

victed, but it may be that repeat offending firms are, or are becoming, particularly good
at providing relevant information and that the LP is actually encouraging collusion.
This may also relate to the US Amnesty Plus Programme, where firms report con-
temporaneous cartels in other markets, once they are being investigated for collusion.
Although this does not apply to the EU rules, firms may fear being fined in other cartels
and so they report them in advance of a possible investigation.
Recidivism is a serious problem and may well require a different and/or tougher ap-
proach in the future calculation of appropriate leniency reductions. The LP should ide-
ally create ex-post deterrence or a desistance effect, which could possibly be achieved
through unrestricted and, thus, greater expected sanctions for repeat and multiple of-
fenders, at the cost of fewer reported cartels. This trade-off needs to be carefully as-
sessed. A desistance effect does not seem to exist, since 15% of the fined cartel mem-
bers, in the period 1998 to October 2013, have taken part in more than one cartel. In
fact, 8% of the firms have participated in at least 3 cartels. Repeat offenders may also
be defined by specific firm characteristics, such as industry, nationality and firm size,
but this analysis is outside the scope of this paper.
4.3 Other variables
The LP requires that the European Commission is notified of all the jurisdictions
where a leniency application was made. Brenner (2009) finds that the number of coun-
tries in which the cartel members are based is not correlated with the fine reductions,
while Borrell and Jimenez-Gonzalez (2008) find that the average antitrust effectiveness
depends on country-specific characteristics. For these reasons, a dummy controlling
for cartels that affect exclusively EEA-based customers of the cartel’s product(s) is in-
cluded. Firms in cartels which exclusively concern EEA customers are likely to receive
a higher leniency reduction, although this result is not robust to all the specifications.
When other jurisdictions are also affected, they can impose fines (and fine reductions),
such that the total fine paid by the cartel member is larger. In this way, EU authori-
ties can grant larger leniency reductions and have the same impact, in terms of absolute
value of the individual fine (in the various jurisdictions). The results from the first stage
18

of the Heckman regression also shed some light on the effect of this variable, showing
that when the cartel only impacts EEA countries, leniency reductions are less likely to
be granted.
Although the magnitude of the fine adjustments for mitigating circumstances (oth.red),
and therefore outside the LP, should be independent from the setting of the leniency re-
duction, it is shown that the predicted leniency reduction is much lower when other
reductions are also granted. This result is also verified for the LP of 2002 and it sup-
ports the reasoning that the reporting firms tend to have a determinant role in the cartel
and are larger or financially stable firms, which are thus not entitled to other reductions.
In some cartel cases, there was hidden information or lack of evidence and, there-
fore, untruthful or incomplete reporting by the cartel members which led to a subse-
quent decision by the Court of Justice. In this scenario, the leniency reductions granted
seem to be smaller (see C.J.Inc). Since there is a lower level of cooperation, this result
is as expected. However, under the previous LP of 2002 the reverse is true, perhaps to
provide an additional incentive for cooperation with an ongoing investigation.
Larger cartels tend to be less stable, as there is a larger probability that at least one
firm will report the cartel and it is more difficult to monitor all the members. Nonethe-
less, in smaller cartels, firms have more and/or better information on the cartel’s activity
and so these two effects may cancel each other out since the results show that the num-
ber of cartel members (firms) does not affect the amount of leniency reductions granted.
Harrington (2008) argues that the cartel duration (cartel.dur) may be informative
as to the change in the total (discovered or not) number of cartels, and Levenstein and
Suslow (2011) conclude that fluctuations in firm-specific discount rates significantly
affect the cartel duration. The LP, however, stipulates that if the first reporter gives
further information that enables a CA to establish additional facts which increase the
duration of the infringement, those will not be taken into account for that specific firm.
To control for possible endogeneity, an instrumental variable is introduced, but the co-
efficients for cartel duration (cartel.dur) are not significant, which is not surprising as
the duration of the cartel is already accounted for in the setting of the initial fine. How-
ever, the results from the first stage Heckman regression, show that firms are slightly
more likely to apply and receive a leniency reduction in shorter cartels.
19
Sjoerd (2005) and Brenner (2009) both conclude that the duration of the investi-
gation is decreased by the introduction of the LP, as leniency applicants reveal more
information to aim for a higher fine reduction. Nonetheless, the coefficients of the du-
ration of the investigation (inv.dur and inv.dur2) are consistently zero in the LP of 2006,
and are therefore not included in the table of results.
5 Discussion
What really matters for the setting of the percentage of fine reductions within the
Leniency Programme? What incentives do firms have to self-report and does the real-
ity match the guidelines? To what extent and in what ways can firms use and possibly
abuse the LP?
There are no doubts as to the increasing importance of the LP and the number of
firms applying for leniency reductions in exchange for information on secret cartels to
which they belong. It is thus of major importance to guarantee that the programme is
efficient in preventing and dissolving cartels and that it does not constitute an easy way
to escape a fine. The first step to ensuring this is making the guidelines very clear and
explicit, in an attempt to guarantee that firms clearly know the consequences they face
and what they can expect.
The analysis carried out in this paper confirms the main expected result: the first
reporter receives much higher fine reductions, whether or not the reporting of the car-
tel takes place before the Commission started an investigation. This supports both the
guidelines and the aim of the LP in providing a significant incentive to reporting, al-
though the reductions seem to be more generous than is outlined in the guidelines.
It is interesting to note that the predicted leniency reductions seem to be smaller
for firms who received other fine reductions outside the LP, in cartels with a geograph-
ical impact beyond the EEA, and when there is such a lack of cooperation or evidence
which leads to a subsequent decision by the Court of Justice.
However, arguably the main result is that repeat offenders receive higher leniency
reductions, which shows some evidence that firms can learn the “rules of the game”,
20

repeatedly colluding and reporting the cartels in which they take part, thus substantially
damaging their partners. This result is reinforced by the finding that a higher number of
repeat offenders per cartel also increases the average leniency reduction, by the mergers
and/or acquisitions which occur between firms who previously colluded and by the fact
that firms often collude with the same partners in different cartels. While the prospect
of high leniency reductions may incentivize cartel members to report, it may also create
an incentive for them to participate in a cartel and then be the first reporter, thus learn-
ing how to “cheat”. Due to the ambiguous impact of the LP on firms’ incentives, repeat
offenders’ penalties should be carefully assessed so as to create a desistance effect and
the leniency reductions should be independent of recidivism, or else this link should be
made explicit in the guidelines.
The existence and application of such a programme has major impacts on society
in general and it seems that firms are able to use it in their own benefit, in some unin-
tended ways. This is supported by the previous theoretical and empirical research and
seems apparent in the data. It is likely that this means the desired long-term effect of the
LP is not being achieved. Although the number of reported cartels has been increasing,
it is difficult to measure the rate of success of the programme as the total number of
existing cartels is unknown and more cartels may be initiated due to the prospect of a
more lenient penalty.
From the point of view of a firm, it may seem better to enjoy higher profits of collu-
sion, up to the moment of reporting to the Commission, and then pay a small or no fine,
since the reductions granted are generally very high, and enjoy the damage caused by
the fines imposed on the other cartel members, i.e., competing firms. From the point
of view of policy makers, the existence of firms that have participated in more than
four cartels in the last eleven years should be seen as a warning sign that, despite the
increase in the number of cartels reported, the LP may also have pro-collusive effects,
which are reinforced by the fact that the cartels reported by a given firm are often in a
single market. In summary, it appears clear that the guidelines should be more explicit
and less generous, especially regarding how repeat offenders are treated.
21
6 Tables and Figures
Table 1: Description of the variablesVariable: Definition:
LRed dependant variable:
percentage of leniency reduction given to a single firm, or a group
of firms jointly fined
= 1 − θ =leniency reduction (euro)
total f ine (F) (euro)− other reductions (M) (euro)
Firm1pre dummy (=1) if firm was the first pre-investigation reporter
Firm1post dummy (=1) if firm was the first post-investigation reporter
Firm2 dummy (=1) if firm was the second to cooperate with an investigation
Firm3 dummy (=1) if firm was the third to cooperate with an investigation
RO dummy (=1) if firm participated in at least 2 cartels
NRO number of repeat offenders per cartel
RO1 dummy (=1) if firm participated in at least 2 non-contemporaneous cartels
NRO1 number of sequential repeat offenders per cartel
oth.red reductions received by a firm, outside the LP
fine.increase fine increases received by a firm
eea dummy (=1) if cartel only affects the EEA market
cartel.dur cartel duration, in months
cartel.dur2 squared cartel duration
inv.dur investigation duration, in months
inv.dur2 squared investigation duration
firms number of cartel members
C.J.Inc. dummy (=1) if the Court of Justice adjusted the fine
def.fine.M initial fine for each cartel member, deflated, in millions
def.paid.M fine paid by each cartel member, deflated, in millions
Tt year fixed effects
S s sector fixed effects
22

Table 2: Summary statisticsVariable Mean Std. Dev. Min. Max. N
LRed 0.245 0.327 0 1 553
Firm1pre 0.099 0.300 0 1 553
Firm1post 0.197 0.398 0 1 553
Firm2 0.275 0.447 0 1 553
Firm3 0.025 0.157 0 1 553
RO 0.307 0.462 0 1 553
NRO 1.837 2.011 0 9 470
RO1 0.036 0.187 0 1 553
NRO1 0.195 0.491 0 2 553
oth.red 0.031 0.097 0 1 553
fine.increase 0.225 0.518 0 2.9 553
eea 0.687 0.464 0 1 553
cartel.dur 90.443 72.521 2 419 553
cartel.dur2 13429.670 24623.800 4 175561 553
inv.dur 46.647 21.242 3 96 553
inv.dur2 2626.401 2241.239 9 9216 553
firms 8.049 4.119 2 17 553
C.J.Inc 0.192 0.394 0 1 553
t 2006.468 4.067 1998 2013 553
def.fine.M 35.976 76.112 0.1 689.98 483
def.paid.M 33.142 72.001 0 981.03 553
23

Table 3: Statistics on cartel cases (using the LP), by decision yearClosed Open Cartels No.firms No.LP No.other
Year cartels (cases) cases found by LP reductions reductions
1998 2 (2) - - 18 10 6
1999 1 (1) - - 24 2 8
2000 2 (2) - 1 28 5 8
2001 14 (7) - 8 25 25 1
2002 9 (9) - 7 48 36 3
2003 4 (4) - 3 26 18 0
2004 3 (3) - 3 29 8 1
2005 4 (4) - 4 39 18 2
2006 5 (5) - 6 67 16 2
2007 10 (7) - 5 67 21 14
2008 6 (6) - 5 34 11 4
2009 10 (6) 0 6 49 23 3
2010 6 (6) 3 6 68 35 26
2011 4 (4) 6 4 13 11 10
2012 8 (4) 10 8 62 29 3
October 2013 5 (1) 3 5 13 13 13
total 93 (71) 22 71 610 281 104
mean 5.8 (4.4) - 4 38 18 7Source: Author’s calculations, using data from EC’s website.
Table 4: Frequency of leniency reductions granted in January 1998-October 2013Reduction Frequency 1998-2002 2003-2007 2008-2013
0% 224 38 76 130
1-9% 5 24 (23%) 7 (9%) 6 (5%)
10-49% 185 46 (43%) 44 (54%) 63 (52%)
50% 49 25 (24%) 10 (12%) 14 (12%)
51-99% 3 2 (2%) 0 (0%) 1 (1%)
100% 67 9 (9%) 20 (25%) 38 (31%)
Sub-total 309 106 (100%) 81 (100%) 122 (100%)
Total 553 144 157 252Source: Author’s calculations, using data from EC’s website.
24

Table 5: Number of cartels per firm, January 1998-October 2013Multiple Offender No.Cartels No.Leniency No.Full No.Other
(No.cases*) reductions Leniency Reductions
firms: Akzo 9 (8) 7 3 0
(RO1) Sumitomo 6 (5) 5 5 1
Degussa Evonik 5 5 2 0
Mitsubishi 4 0 0 2
Thyssen Krupp 4 (2) 2 0 0
ABB 4 1 1 0
FMC 3 (2) 1 0 1
firms: F.Hoffman-La Roche 9 (2) 9 0 0
(RO) BASF 9 (2) 8 0 0
Elf Aquitane (Arkema) 6 5 0 0
Takeda Chemical Industries 6 (2) 6 1 0
Aventis 5 5 4 1
Bayer 5 4 2 0
Prym 5 (2) 4 1 0
Toshiba 4 0 0 1
Total 4 2 0 0
Samsung 4 (3) 4 1 1
Coats 4 (3) 2 0 0
SGL 4 (3) 2 0 0
KONE 4 (1) 3 2 1
Otis 4 (1) 4 1 3
Schindler 4 (1) 1 0 4
AC Treuhand 3 0 0 0
Archer Daniels Midlands 3 3 0 1
Asahi Glass (AGC) 3 1 0 1
Chunghwa 3 3 2 0
DuPont, Dow 3 3 0 0
ENI 3 0 0 0
EKA Chemicals (now part of Akzo) 3 2 1 0
Hitachi 3 0 0 2
Repsol 3 3 0 1
Shell 3 1 1 0
Solvay 3 2 0 0
Chemtura (ex-Crompton) 3 (2) 3 2 0
Exel 3 (1) 3 3 0
sub-total 67 Multiple Offenders
374 Single Offenders
total 441 firms
25

Table 6: Number of cartels per firm, January 1998-October 2013 (continued)Multiple Offender No.Cartels No.Leniency No.Full No.Other
(No.cases*) reductions Leniency Reductions
Yazaki 3 (1) 3 0 3
YKK Group 3 (1) 2 0 0
Ajinomoto 2 2 0 0
Alstom 2 0 0 1
ArcelorMittal 2 1 0 0
Areva 2 0 0 2
Boliden 2 2 1 0
BP 2 2 2 0
Carbone Lorraine 2 2 0 0
Chiquita 2 2 2 2
Daesang 2 2 0 1
Danone 2 1 0 0
Fuji Electric 2 1 0 0
Hoechst AG 2 1 0 0
IMI 2 2 0 0
Interbrew 2 1 0 0
Kemira 2 1 1 0
KME group 2 2 0 1
LG Electronics 2 0 0 0
Merck Kga 2 2 1 0
Mueller Ind. 2 2 2 0
Nippon Steel 2 1 0 1
Nynas 2 0 0 1
Outokumpu 2 2 0 0
Panasonic 2 1 0 1
Pilkington 2 0 0 0
SAS 2 1 0 1
Siemens 2 1 1 0
Tokai Carbon 2 1 0 0
Elementis 2 (1) 0 0 0
Furukawa 2 (1) 2 0 2
SYS 2 (1) 2 0 2
sub-total 67 Multiple Offenders
374 Single Offenders
total 441 firmsSource: Author’s calculations, using data from EC’s website.; (*) denotes the number of Cases if it differs
from the number of cartels
26

Table 7: Tobit results: Leniency Programme of 2006(lred) LP.2006 LP.2006 LP.2006 LP.2006 LP.2006 LP.2006
(1) (2) (3) IV (4) (5) (6)
Firm1post 0.65*** 0.70*** 0.74*** 0.76*** 0.80*** 0.80***
(0.11) (0.12) (0.11) (0.12) (0.13) (0.13)
Firm2 0.62*** 0.62*** 0.66*** 0.59*** 0.58*** 0.58***
(0.13) (0.12) (0.13) (0.12) (0.11) (0.11)
Firm3 0.31*** 0.42*** 0.42*** 0.40*** 0.46*** 0.44***
(0.10) (0.12) (0.13) (0.11) (0.13) (0.13)
RO 0.20** 0.19* 0.26*** 0.11
(0.10) (0.10) (0.09) (0.11)
NRO 0.05*
(0.03)
RO1 -0.35*
(0.19)
NRO1 0.49*** 0.50***
(0.12) (0.11)
fine.increase 0.22 0.40
(0.30) (0.34)
eea 0.19** 0.15 0.23* -0.05 -0.07
(0.09) (0.12) (0.12) (0.09) (0.09)
oth.red -1.21 -0.34 -2.54** -2.14* -2.26**
(0.96) (1.29) (1.26) (1.29) (1.12)
cartel.dur -0.00 0.01 . 0.00 0.00
(0.00) (0.01) . (0.00) (0.00)
C.J.Inc 0.23 -0.11 -0.60*** -0.65* -0.40
(0.30) (0.61) (0.22) (0.36) (0.35)
firms -0.02 -0.01 -0.01
(0.02) (0.02) (0.01)
year effects yes yes yes yes yes yes
sector effects yes yes yes yes yes yes
pseudo R2 39.02% 44.34% 45.80% 47.80% 48.80%
Log-likelihood -75.71 -69.11 -1029.00 -67.29 -64.80 -63.57
lred -6.17% -6.06% -6.22% -7.48% -7.43% -7.15%
Chi2 791.83
Iterations 8
Instrument fine
N censored 101 101 101 101 101 101
N uncensored 85 85 85 85 85 85
N total 186 186 186 186 186 186
***, **, * correspond to 1, 5 and 10% significance level, respectively. Standard errors reported inparenthesis. The R2 corresponds to McFadden’s pseudo R-squared.
27

7 Appendix
Table 8: Dataset and analysis of CartelsAuthor Data Number Number Analysis Time
Cartels Firms Period
Connor (2007) Asia 377 Descriptive Statistics 1990-2007
Berinde (2008) EU 78 Descriptive Statistics 1990-2008
Veljanovski (2010) EU 63 Descriptive Statistics 1999-2007
Asker (2010) US 1 Descriptive Statistics 2001-2002
Connor (2010) US 799 2310 Descriptive Statistics 1984-2009
Borrell and Jimenez-Gonzalez (2008) world 47 Antitrust effectiveness 2003-2004
Levenstein and Suslow (2011) EU,US 81 Cartel duration 1990-2007
Sjoerd (2005) EU 67 399 Fine, Gravity, Inv.Duration 1990-2005
Brenner (2009) EU 61 232 Fine, Investigation Duration 1990-2003
Marvao (2012) EU 81 385 Leniency Reduction 1998-2011
Miller (2009) US 342 Cartel discoveries 1985-2005
Table 9: Statistics on cartel cases (with LP applications) where Akzo took part, by
decision year.Akzo
decision invest. cartel Len. Oth. Fine no. Product Reduction Fine
year year duration Red. Red Increase Firms 000ε 000ε
2001 1997 1987-1995 20% 0% 0% 5 Sodium Gluconate 1,800 7,200
2003 2001 1971-1999 100% 0% 0% 6 Organic Peroxyde 214,500 0
2004 1999 1992-1998 30% 0% 50% 3 Choline chloride 9,000 20,990
jointly with EKA Chemicals
2005 2000 1984-1999 25% 0% 50% 4 MCAA acid 28,127 84,380
2006 2003 1994-2000 40% 0% 0% 9 Hydrogen peroxide 16,680 25,200
0% jointly with EKA Chemicals
2008 2003 1994-2000 100% 0% 0% 8 Sodium Chlorate 116,000 0
0% jointly with EKA Chemicals
2009 2003 1991-2000 0% 0% 0% 8 Heat stabilizers 0 40,600
jointly with Elementis and Akcros
2009 2007 2004-2007 100% 0% 100% 15 Calcium carbide 17,400 0
jointly with Carbide SwedenSource: Author’s calculations, using data from EC’s website.
28

Figure 1: Cartel duration and amount of leniency reductions, 1/1998-10/2013.
Corr(carteldur,lred)=-5.42%; corr(carteldur,lred)[LP 2006]=-6.61%
29

Figure 2: Cartel duration and decision to grant a leniency reduction, 1/1998-10/2013.
Corr(carteldur,lred)=-13.86%; corr(carteldur,lred)[LP 2006]=-11.89%
30

Table 10: Heckman resultsSTAGE 1 LP.2006 LP.2006 LP.2006 LP.2006 LP.2006 LP.all LP.all LP.all
(lred0) (1) (2) (3) (4) (5) (6) (7) (8)
Firm1post 15.42 13.86 13.16 14.03 18.27 4.83*** 4.19*** 4.18***
(6546.55) (28474.04) (1585.30) (3144.87) (3807.04) (0.71) (0.50) (0.49)
Firm2 15.35 13.11 11.55 11.65 18.15 4.97*** 4.50*** 4.68***
(5911.36) (22200.76) (1330.37) (2697.57) (3824.97) (0.62) (0.49) (0.51)
Firm3 8.94 8.14 7.46 7.53 7.55 10.12 9.40 10.51
(7709.51) (30352.61) (3292.69) (8797.23) (11670.20) (2098.42) (44192.44) (48517.03)
RO 0.06 -0.02 -0.05 0.42 0.29
(0.40) (0.37) (0.42) (0.29) (0.28)
NRO -0.08 0.04
(0.12) (0.08)
RO1 -6.25 -1.12*
(2231.29) (0.64)
NRO1 1.72** 2.03** 0.10
(0.82) (0.84) (0.31)
fine.increase 2.04 1.85 -0.01 0.09
(1.89) (1.91) (0.42) (0.41)
eea -0.53 -1.08* -1.77** -2.22** -0.68* -0.71**
(0.51) (0.58) (0.79) (0.88) (0.35) (0.35)
oth.red -3.36 -2.22 -5.86 -7.35 -1.49 -1.22
(3.58) (4.54) (4.93) (5.42) (1.87) (1.80)
cartel.dur -0.02*** 0.00 -0.00 -0.00 -0.01*** -0.01**
(0.01) (0.00) (0.00) (0.00) (0.01) (0.01)
carteldur2 0.00*** 0.00*** 0.00***
(0.00) (0.00) (0.00)
C.J.Inc -5.55 -4.03 -6.30 -5.97 0.47 0.44
(16273.72) (2822.46) (10752.25) (1742.93) (0.51) (0.53)
firms -0.11* -0.02 -0.02 -0.04 0.02 -0.00
(0.07) (0.08) (0.07) (0.05) (0.05) (0.05)
lp step 0.14 -0.00 -0.02
(0.68) (0.57) (0.58)
constant -0.35 -14.89 -1.67 -2.43 -2.94 -0.64 -13.12 -12.83
(0.77) (34.14) (1.81) (2.65) (3.43) (0.63) (351.85) (334.74)
year effects yes yes yes yes yes yes yes yes
N 208.00 208.00 208.00 208.00 208.00 553.00 553.00 553.00
lnsig2u 7.88 9.06 8.12 6.99 7.28 6.22 8.10 8.41
(6196.50) (29107.65) (1970.78) (3977.20) (4974.06) (1618.54) (34783.05) (35920.40)
log-likelihood -65.01 -56.79 -61.20 -58.58 -56.72 -101.28 -95.23 -94.73
chi2 5.65 . 14.36 17.68 19.42 81.22 . .
iterations 5 7 3 3 4 4 9 9
***, **, * correspond to 1, 5 and 10% significance level, respectively. Standard errors reported inparenthesis. lnsig2u is the logged variance of the random effect.
31
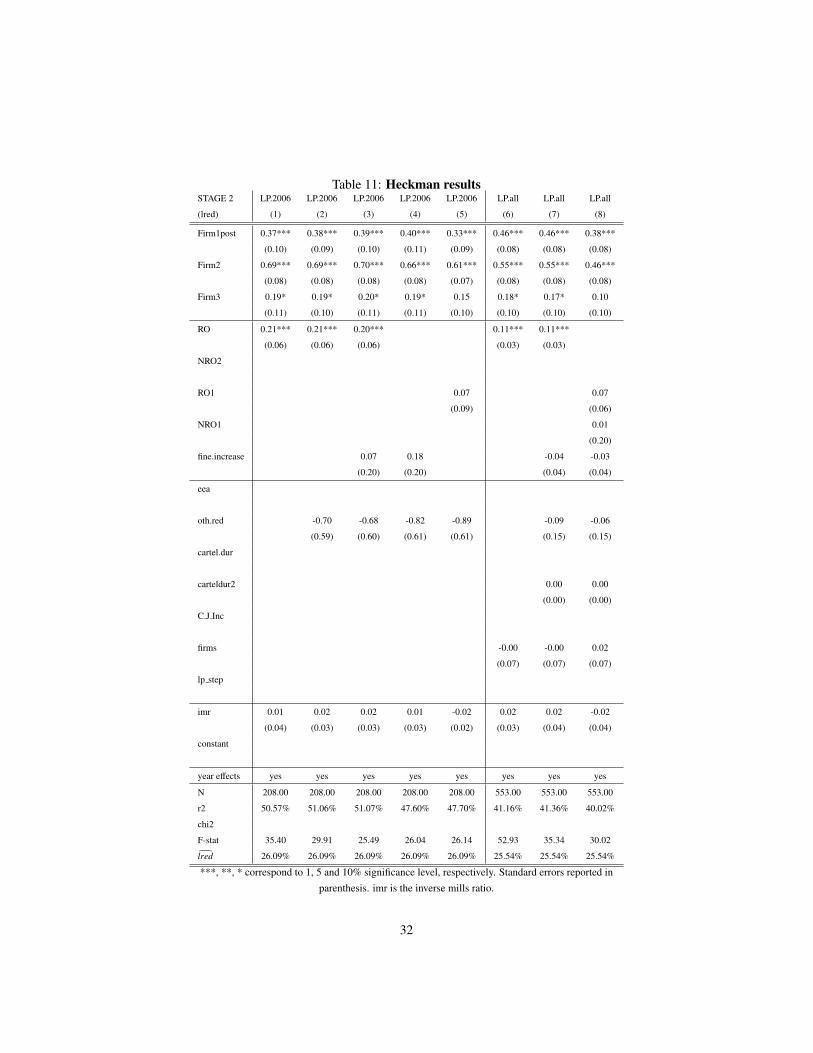
Table 11: Heckman resultsSTAGE 2 LP.2006 LP.2006 LP.2006 LP.2006 LP.2006 LP.all LP.all LP.all
(lred) (1) (2) (3) (4) (5) (6) (7) (8)
Firm1post 0.37*** 0.38*** 0.39*** 0.40*** 0.33*** 0.46*** 0.46*** 0.38***
(0.10) (0.09) (0.10) (0.11) (0.09) (0.08) (0.08) (0.08)
Firm2 0.69*** 0.69*** 0.70*** 0.66*** 0.61*** 0.55*** 0.55*** 0.46***
(0.08) (0.08) (0.08) (0.08) (0.07) (0.08) (0.08) (0.08)
Firm3 0.19* 0.19* 0.20* 0.19* 0.15 0.18* 0.17* 0.10
(0.11) (0.10) (0.11) (0.11) (0.10) (0.10) (0.10) (0.10)
RO 0.21*** 0.21*** 0.20*** 0.11*** 0.11***
(0.06) (0.06) (0.06) (0.03) (0.03)
NRO2
RO1 0.07 0.07
(0.09) (0.06)
NRO1 0.01
(0.20)
fine.increase 0.07 0.18 -0.04 -0.03
(0.20) (0.20) (0.04) (0.04)
eea
oth.red -0.70 -0.68 -0.82 -0.89 -0.09 -0.06
(0.59) (0.60) (0.61) (0.61) (0.15) (0.15)
cartel.dur
carteldur2 0.00 0.00
(0.00) (0.00)
C.J.Inc
firms -0.00 -0.00 0.02
(0.07) (0.07) (0.07)
lp step
imr 0.01 0.02 0.02 0.01 -0.02 0.02 0.02 -0.02
(0.04) (0.03) (0.03) (0.03) (0.02) (0.03) (0.04) (0.04)
constant
year effects yes yes yes yes yes yes yes yes
N 208.00 208.00 208.00 208.00 208.00 553.00 553.00 553.00
r2 50.57% 51.06% 51.07% 47.60% 47.70% 41.16% 41.36% 40.02%
chi2
F-stat 35.40 29.91 25.49 26.04 26.14 52.93 35.34 30.02
lred 26.09% 26.09% 26.09% 26.09% 26.09% 25.54% 25.54% 25.54%
***, **, * correspond to 1, 5 and 10% significance level, respectively. Standard errors reported inparenthesis. imr is the inverse mills ratio.
32

Table 12: Tobit results: Leniency Programmes of 1996 and 2002(lred) LP all LP all LP all LP 2002 LP 2002 LP 2002 LP 1996 LP1996 LP 1996
(1) (2) (3) (1) (2) (3) (1) (2) (3)
Firm1post 0.85*** 0.87*** 0.87*** 0.79*** 0.77*** 0.78*** 0.62*** 0.56*** 0.61***
(0.06) (0.06) (0.06) (0.13) (0.12) (0.12) (0.15) (0.00) (0.00)
Firm2 0.93*** 0.94*** 0.94*** 0.57*** 0.55*** 0.56*** 0.30** 0.30*** 0.30***
(0.06) (0.07) (0.07) (0.11) (0.10) (0.10) (0.15) (0.00) (0.00)
Firm3 0.43*** 0.45*** 0.45*** 0.26*** 0.26*** 0.26*** 0.10 0.10*** 0.10***
(0.07) (0.08) (0.08) (0.07) (0.07) (0.07) (0.15) (0.00) (0.00)
RO 0.17*** 0.05* -0.05
(0.05) (0.03) (0.04)
NRO -0.01 0.03* -0.05
(0.01) (0.01) (0.03)
RO1 0.04 -0.06* 0.02***
(0.10) (0.03) (0.00)
NRO1 -0.05 -0.04 -0.04* -0.05* -0.47*** -0.41***
(0.03) (0.03) (0.02) (0.03) (0.00) (0.00)
fine.increase -0.01 0.01 -0.06* -0.02 -0.10** -0.11***
(0.03) (0.03) (0.03) (0.02) (0.04) (0.00)
firms -0.02** -0.03*** -0.03*** 0.00 0.00 0.00 0.03 0.00*** -0.02***
(0.01) (0.01) (0.01) (0.01) (0.01) (0.01) (0.03) (0.00) (0.00)
eea 0.00 -0.01 -0.01 -0.05 -0.06 -0.06 0.04 -0.13*** -0.03***
(0.06) (0.06) (0.06) (0.10) (0.12) (0.12) (0.09) (0.00) (0.00)
oth.red -0.19 -0.16 -0.18 -0.20** -0.41*** -0.34*** 0.08 0.32*** 0.02***
(0.28) (0.30) (0.30) (0.08) (0.11) (0.11) (0.99) (0.01) (0.01)
cartel.dur 0.00* 0.00** 0.00** 0.00 0.00 0.00 0.00 0.00*** 0.00***
(0.00) (0.00) (0.00) (0.00) (0.00) (0.00) (0.00) (0.00) (0.00)
C.J.Inc -0.02 -0.01 -0.01 0.06 0.16*** 0.15*** -0.31*** 0.02*** -0.01***
(0.06) (0.07) (0.07) (0.06) (0.05) (0.05) (0.08) (0.00) (0.00)
inv.dur 0.00 -0.00 -0.00 0.02* 0.01 0.01 -0.07* -0.03*** -0.07***
(0.01) (0.00) (0.00) (0.01) (0.01) (0.01) (0.04) (0.00) (0.00)
invdur2 0.00 0.00 0.00 -0.00* -0.00 -0.00 0.00* 0.00*** 0.00***
(0.00) (0.00) (0.00) (0.00) (0.00) (0.00) (0.00) (0.00) (0.00)
year effects yes yes yes yes yes yes yes yes yes
sector effects yes yes yes yes yes yes yes yes yes
pseudo R2 60.13% 61.71% 60.11% 140.19% 141.19% 139.97% 240.97% 255.81% 252.42%
Log-likelihood -167.68 -161.07 -167.79 50.49 51.74 50.21 54.02 59.70 58.41
lred 4.07% 4.03% 4.04% -3.51% -4.12% -3.72% 12.03% 12.85% 12.48%
Clusters 93 93 93 42 42 42 21 21 21
N censored 244 244 244 112 112 112 29 29 29
N uncensored 309 309 309 97 97 97 74 74 74
N total 553 553 553 209 209 209 103 103 103***, **, * correspond to 1, 5 and 10% significance level, respectively. Standard errors reported in
parenthesis. The R2 corresponds to McFadden’s pseudo R-squared.
33

Table 13: Tobit Results - Multiple Offenders onlyLP.2006 LP.2006 LP.2002 LP.2002 LP.all LP.all
(lred) (1) (2) (3) (4) (5) (6)
Firm1post 0.50*** 0.51*** 0.81*** 0.84*** 0.64*** 0.66***
(0.01) (0.09) (0.17) (0.18) (0.09) (0.09)
Firm2 0.08*** 0.16 0.56*** 0.58*** 0.48*** 0.48***
(0.02) (0.14) (0.13) (0.13) (0.08) (0.08)
Firm3 0.35*** 0.34** 0.29*** 0.29*** 0.30*** 0.30***
(0.01) (0.12) (0.10) (0.09) (0.09) (0.08)
NRO2 0.20*** 0.11*** 0.03 0.04 -0.01 -0.01
(0.00) (0.04) (0.03) (0.03) (0.02) (0.02)
RO1 -0.78*** -0.09** -0.23***
(0.01) (0.04) (0.08)
fine.increase -0.35 -0.04 0.03
(0.38) (0.03) (0.02)
firms -0.10*** -0.05*** -0.01 -0.01 -0.02 -0.03*
(0.00) (0.01) (0.02) (0.02) (0.02) (0.02)
eea 0.71*** 0.64** -0.01 0.02 0.00 0.01
(0.01) (0.26) (0.14) (0.11) (0.12) (0.12)
oth.red -15.05*** -10.41*** -0.31*** -0.22*** -0.20 -0.23
(0.16) (1.39) (0.08) (0.06) (0.26) (0.29)
cartel.dur 0.00*** 0.00 0.00 -0.00 0.00 0.00
(0.00) (0.00) (0.00) (0.00) (0.00) (0.00)
C.J.Inc 1.81*** 0.12 0.06
(0.01) (0.10) (0.08)
inv.dur -0.01*** -0.01* 0.00 0.00 0.00 0.00*
(0.00) (0.00) (0.00) (0.00) (0.00) (0.00)
No.Cartels 0.04*** 0.02 0.00 -0.01 0.01 -0.01
(0.00) (0.01) (0.02) (0.01) (0.01) (0.01)
year effects yes yes yes yes yes yes
sector effects yes yes yes yes yes yes
pseudo R2 146.41% 135.96% 123.44% 122.44% 103.13% 99.12%
Log-likelihood 15.29 11.85 13.55 12.97 3.29 -0.93
lred -2.12% 8.22% 6.09% 6.33% 11.67% 11.99%
N censored 21 21 39 39 65 65
N uncensored 28 28 51 51 108 108
N total 49 49 90 90 173 173
***, **, * correspond to 1, 5 and 10% significance level, respectively. Standard errors reported inparenthesis. The R2 corresponds to McFadden’s pseudo R-squared.
34
References
Asker, J., 2010. Leniency and post-cartel market conduct: Preliminary evidence from
parcel tanker shipping. International Journal of Industrial Organization 28 (4), 407–
414.
Berinde, M., 2008. Cartels between theory, leniency policy and fines. Annals of Faculty
of Economics 1 (1), 549–552.
Borrell, J.-R., Jimenez-Gonzalez, J. L., 2008. The drivers of antitrust effectiveness.
Hacienda Publica Espanola 185 (2), 69–88.
Brenner, S., 2009. An empirical study of the European corporate leniency program.
International Journal of Industrial Organization 27 (6), 639–645.
Chen, Z., Rey, P., 2012. On the design of leniency programs. IDEI Working Papers
452.
Connor, J., 2007. Global antitrust prosecutions of international cartels: Focus on asia.
In: Annual Meeting of the Asian Law and Economics Association.
Connor, J. M., 2010. Recidivism revealed: Private international cartels 1990-2009. CPI
Journal 6, 2.
European.Commission, 1996. Commission notice on immunity from fines and reduc-
tion of fines in cartel cases. Official Journal of the European Union, Ch. 207, 4-6.
European.Commission, 2002. Commission notice on immunity from fines and reduc-
tion of fines in cartel cases. Official Journal of the European Union, Ch. 45, p.3-5.
European.Commission, 2006. Commission notice on immunity from fines and reduc-
tion of fines in cartel cases. Official Journal of the European Union, Ch. 298, p.17.
Harrington, J. E., 2008. Optimal corporate leniency programs. Journal of Industrial
Economics 56 (2), 215–246.
Heckman, J. J., 1979. Sample selection bias as a specification error. Econometrica
47 (1), 153–61.
35

Houba, H., Motchenkova, E., Wen, Q., 2009. Maximal cartel pricing and leniency
programs. Discussion Paper 2009 - 081/1, Tilburg University, Tilburg Law and Eco-
nomic Center.
Levenstein, M. C., Suslow, V. Y., 2011. Breaking up is hard to do: Determinants of
cartel duration. Journal of Law and Economics 54 (2), 455 – 492.
Marvao, C., 2012. The EU leniency programme: Incentives for self-reporting. working
paper, Trinity College Dublin.
Miller, N. H., 2009. Strategic leniency and cartel enforcement. American Economic
Review 99 (3), 750–68.
Sjoerd, A., 2005. Crime but no punishment. An empirical study of the EU 1996 le-
niency notice and cartel fines in Article 81 proceedings. Master’s thesis, Economic
Faculty of the Universiteit van Amsterdam.
Veljanovski, C., 2010. European Commission cartel prosecutions and fines, 1998-2009:
An updated statistical analysis of fines under the 1998 penalty guidelines. Research
paper.
36