Embed Size (px)
Citation preview

c o r p o r a t e k n i g h t s c a p i t a l . c o m
October 2014
Low Carbon Investing
Corporate Knights Capital (Corporate Knights Capital) is the investment research arm of Corporate Knights
2
▪ Corporate Knights is a Toronto-based, employee-owned B Corp that operates in three segments: !– Corporate Knights Capital ▫ Sustainable Beta – The world’s largest sustainable investment platform ▫ External research projects (e.g. Global 100 Most Sustainable Corporations,Sustainable
Stock Exchanges Rankings, Newsweek Green Rankings) ▫ Solactive CK Low Carbon Family of Equity Indices ▫ Offers investment services to asset owners and managers !
– Corporate Knights Magazine ▫ World's largest circulating magazine focused on sustainability ▫ Reaches 130,000 of the world’s most influential business and political decision-makers !
– Council for Clean Capitalism ▫ CEO-supported group catalyzing public policy to support cleaner capitalism ▫ Engages with leading public policy-makers
© 2014 Corporate Knights Capital -Proprietary and Confidential

$50b Global Divest-Invest Coalition
What: The Global Divest-Invest Coalition was launched at the UN Climate Summit with foundations representing $2b in AUM committed to eliminating all fossil fuels from their investment portfolios while investing in a new, clean energy economy through renewables, clean tech and other innovations. !Objective: Secure commitments from investors to divest $50 billion from fossil fuel companies over next five years. !Who: 650 individuals and 180 institutions have joined the coalition, including Rockefeller Brothers, with assets totalling $2 billion and growing. !Why: Divest-Invest Philanthropy seeks to reinforce the growing divestment movement in colleges, cities, states, pension funds, and religious institutions. Drawing on a core innovation of anti-Apartheid activism, today’s movement argues that mission-based institutions whose goals and constituencies are threatened by the extraction and combustion of fossil fuels should not also seek to profit from them. !How: Divest from fossil fuel assets in favour of clean energy assets
3

$100b Portfolio Decarbonization Coalition
What: The Portfolio Decarbonization Coalition was launched at the UN Climate Summit but the United Nations Environment Programme Finance Initiative and leading investors () launched a Coalition to decarbonize USD 100 billion of institutional investment worldwide by December 2015 !Objective: Secure commitments from investors to decarbonize $100 billion of investments by December 2015. !Who: So far, AP4, FRR, CIC, ERAFP !Why: “Climate change is increasingly recognized as a financial risk and it is our duty, as trustees, to take concrete steps to reduce this risk.” - Mats Andersson, CEO of AP4 !How: Quantitative target-setting to reduce portfolio carbon footprints by re-allocating capital from carbon-inefficient companies within each sector to carbon-efficient ones and other techniques. !“Institutional investors often have long-term investment horizons and are diversified across the economy. They have an interest in the long-term stability of the whole system rather than the short-term performance of individual market actors. That is why avoiding disruptive climate change, a truly systemic threat, is of such intrinsic interest to them.” - UN Under-Secretary-General and UNEP Executive Director Achim Steiner
4

$3t Montreal Carbon Pledge (Portfolio Footprinting)
• What: The Montreal Carbon Pledge was launched at the UN PRI annual summit in Montreal on September 25, 2014. It is the world’s first commitment by institutional investors to measure and reduce the carbon footprint of their investment portfolios beginning with equities by December 1, 2015.
• Objective: Secure commitments from investors representing $3 trillion AUM by September 2015.
• Who: The pledge is open to all investors. So far, investors controlling $1.1 trillion (including CalPERS, PGGM, Nordea, ERAFP, AP4, and FRR) have signed up.
• Why: You can’t manage what you don’t measure. Carbon footprinting your investments enables better risk management around climate issues. A growing number of investors, including ERAFP, AP4, London Pension Fund Authority and VicSuper, have already taken steps to measure the carbon footprint of their investments.
• How: The two most common approaches for measuring the carbon footprint of an investment portfolio: total portfolio carbon (tonnes of CO2e) divided by total portfolio sales, which provides a measure of carbon efficiency, or tonnes of CO2e per million dollars of portfolio investment. !
"The main reason to carbon footprint and decarbonize portfolios is not an ethical or moral one for asset owners - it is a financial risk imperative.” - Julian Poulter, Executive Director of the Asset Owners Disclosure Project (AODP).
5
Why does the carbon matter for your portfolios?Risk management “We believe that it’s is likely that we will see significant increase in the cost structure of carbon emissions. This will change the relative competitiveness between companies. Our expectation is that the companies with less carbon emissions than their competitors will have an economic advantage and will have a better value performance. We see it as an investment opportunity to avoid companies that are going to suffer the most due to the increased cost of carbon emissions. Our belief is that the value of those companies will be worse.” - Mikael Johansson, senior portfolio manager global equities, AP4 !Efficiency edge Carbon efficient firms tend to be more resource productive, an important profit driver in resource intensive sectors. This may not be fully reflected in current valuations due to the nascence of reliable carbon data.
6

Defining Carbon (Three breadths of measurement)
© 2014 Corporate Knights Capital -Proprietary and Confidential 7
• Scope 1 (or ‘direct’) GHG emissions occur from sources that are owned or controlled by the company, for example, emissions from combustion in owned or controlled boilers, furnaces, vehicles, etc.; emissions from chemical production in owned or controlled process equipment. !
• Scope 2 GHG emissions occur from the generation of purchased electricity, steam, or heat, consumed by the company. Scope 2 emissions physically occur at the facility where electricity is generated. !
• Scope 3 GHG emissions are a consequence of the activities of the company, but occur from sources not owned or controlled by the company. Some examples of Scope 3 activities are extraction and production of purchased materials, and use of sold products and services.

78% of the 500 largest companies by market capitalization in the world disclose scope 1 and 2 GHG emissions46% of the 500 largest companies by market capitalization in the world disclosed GHG emissions (scopes 1, 2 and 3) and conducted an audit of their ESG performance metrics in 2012Source: 2014 Newsweek Green Rankings

Disclosure of scope 1+2 carbon emissions, companies with a market capitalization of at least US$ 2 billion as at July 1, 2014
0
500
1000
1500
2000
2008 2009 2010 2011 2012
All companiesDeveloped countriesEmerging countries

Number of companies with a market capitalization of at least US$2 billion on July 1, 2014 that conducted an audit of sustainability data
0
275
550
825
1100
2008 2009 2010 2011 2012
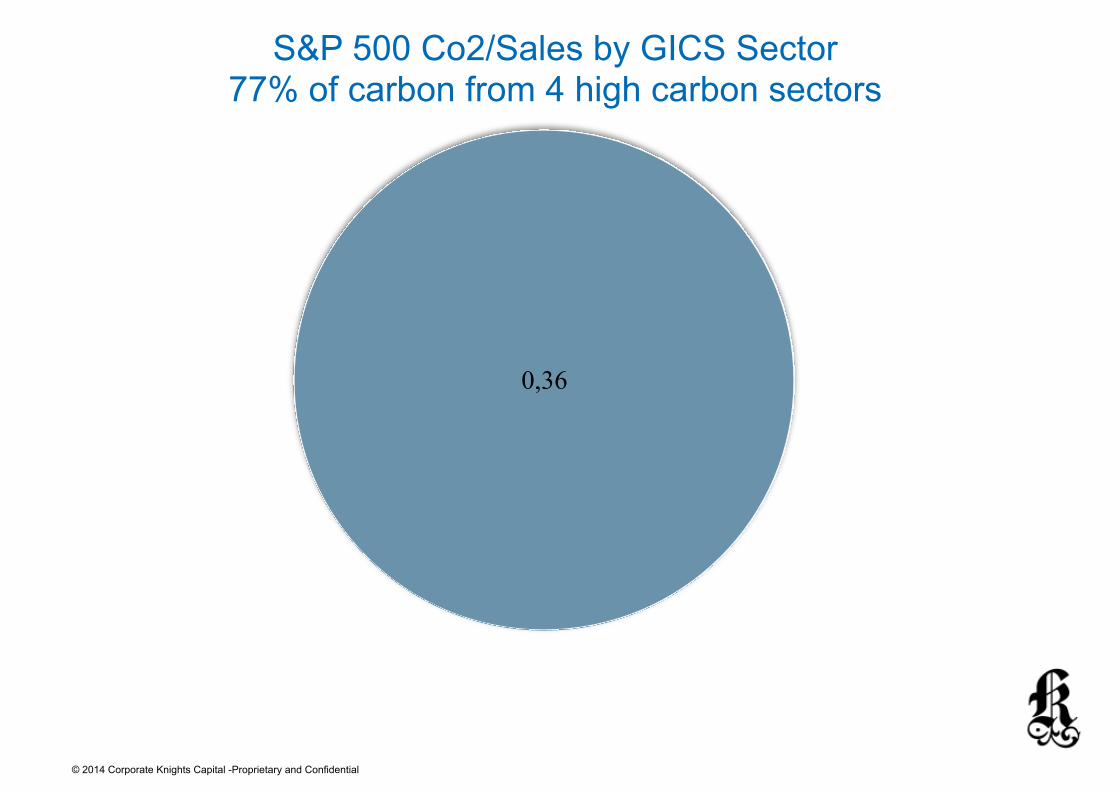
S&P 500 Co2/Sales by GICS Sector 77% of carbon from 4 high carbon sectors
0,36
© 2014 Corporate Knights Capital -Proprietary and Confidential

Stoxx 600 Co2/Sales by GICS Sector88% of carbon from 4 high carbon sectors
© 2014 Corporate Knights Capital -Proprietary and Confidential
0,38

Carbon Report Rates Europe (high carbon=high reporters)
© 2014 Corporate Knights Capital -Proprietary and Confidential
GICS Sector Report Rate
Materials 93.10%Utilities 93.10%Energy 85.29%
Consumer Staples 81.63%Industrials 81.48%
Health Care 80.56%
Telecommunication Services 76.00%
Consumer Discretionary 73.00%
Information Technology 72.22%
Financials 68.38%

Carbon Report Rates U.S. (high carbon=high reporters)
© 2014 Corporate Knights Capital -Proprietary and Confidential
GICS Sector Report Rate
Consumer Staples 87.80%Telecommunication Services 80.00%
Utilities 77.78%Materials 72.41%
Information Technology 66.23%Financials 57.78%
Health Care 55.38%
Industrials 55.07%
Consumer Discretionary 53.57%
Energy* 38.30%
* Within the Energy Sector Integrated Oil and Gas disclosure is significantly higher (globally 73%) than the sector average. Service firms tend not to disclosure Source: Ranking the Worlds Stock Exchanges 2014

Define Carbon • Emissions (scope 1,2,3
reported/estimated, data provider)
• Reserves • ICB/GICS, Sic Code • Capex !
Portfolio Selection • Normalizer: raw/sale/
market cap/other • Class: ICB/GICS/SASB
SICS • Selection: Best in Class
and/or %reduction
Weighting • Weights: Cap/T.E./
Alternative weight/Tilt • Constraints: sector/
concent./ region/turnover
What is your objective • Less carbon, similar performance (beta) • Less carbon, more performance (alpha) • Engagement (send a clear signal to companies)

Existing ProductsExcess 3-yr return
against market Benchmark (at Sept 30,
2014)
Carbon Reduction
FTSE Devloped ex Fossil Fuels (1)
Exclude fossil fuel companies (cap-
weighted)1.20% Not reported
S&P U.S. Carbon Efficient Index (1)
Exclude worst in benchmark on carbon
efficiency (T.E. 0.20% Not reported
MSCI ACWI Low Carbon Leaders Index (1)
Exclude worst in class (T.E. Optimized) 0.25%
At least 50% carbon/sales and potential
carbon/market cap, not verified by third party
Solactive CK Low Carbon Europe Index (2)
Include all companies in low carbon sectors and
all best-in-class companies carbon
efficient in high carbon 0.49%
At least 50% weighted carbon/sales reduction
with 3rd party verification by South Pole.
Solactive CK Low Carbon U.S. Index (2) Same as above -0.48%
At least 50% weighted carbon/sales reduction
with 3rd party verification by South Pole.
CK EW Low Carbon U.S. (PRI Study) (3)
Include best in benchmark on carbon
efficiency. Equal weight. 3.47%
82.77% weighted carbon/sales reduction not
verified by third party© 2014 Corporate Knights Capital -Proprietary and Confidential
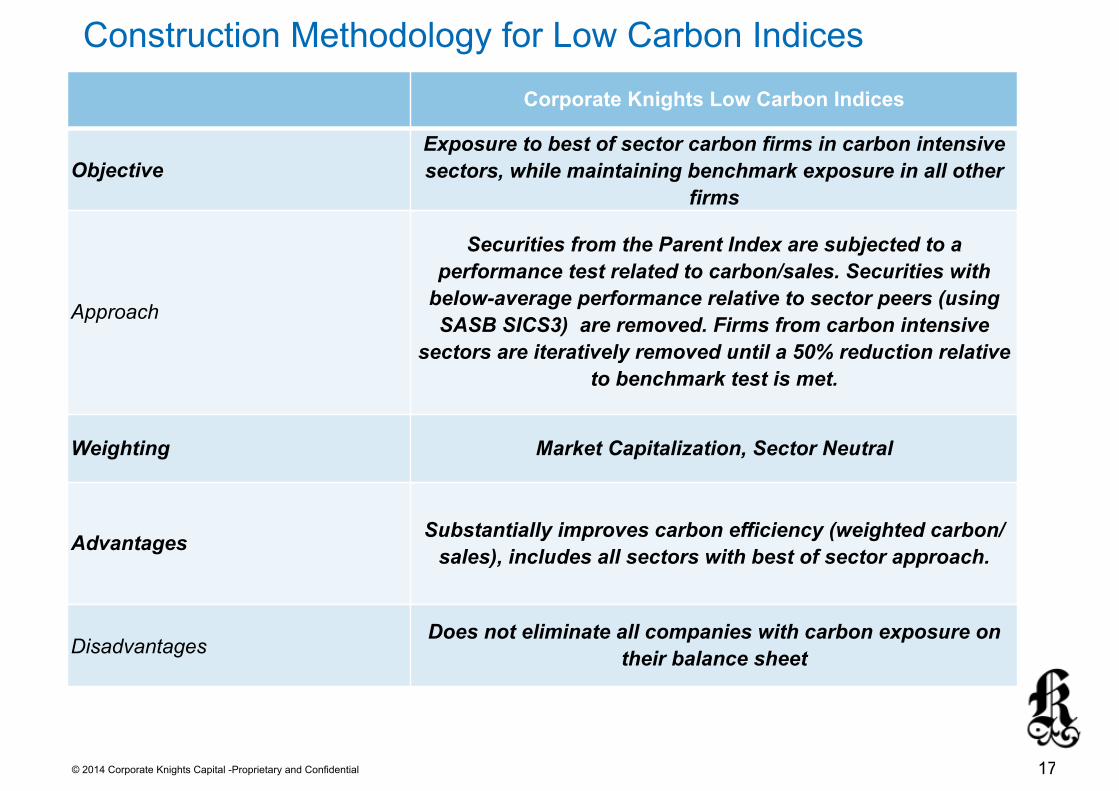
Construction Methodology for Low Carbon Indices
© 2014 Corporate Knights Capital -Proprietary and Confidential
Corporate Knights Low Carbon Indices
ObjectiveExposure to best of sector carbon firms in carbon intensive sectors, while maintaining benchmark exposure in all other
firms
Approach
Securities from the Parent Index are subjected to a performance test related to carbon/sales. Securities with
below-average performance relative to sector peers (using SASB SICS3) are removed. Firms from carbon intensive
sectors are iteratively removed until a 50% reduction relative to benchmark test is met.
Weighting Market Capitalization, Sector Neutral
Advantages Substantially improves carbon efficiency (weighted carbon/sales), includes all sectors with best of sector approach.
DisadvantagesDoes not eliminate all companies with carbon exposure on
their balance sheet
17

Historical Performance of the Low Carbon U.S. vs Parent Index and S&P 500(2008-01/2014-08)
18
$ 50
$ 80
$ 110
$ 140
$ 170
Nov-07 Jul-09 Apr-11 Dec-12 Aug-14
Low Carbon U.S.Solactive U.S. 500S&P 500

^ Calculated using monthly returns, then annualized
Portfolio Analysis Low carbon U.S. vs Solactive 500 Solactive 500 S&P 500
Total Return* 65.62% 62.35% 57.85%
Alpha^* 0.15% 0% 0%
Beta 1.03 1 1
Information Ratio 0.26 N/A N/A
Sharpe Ratio 0.45 0.44 0.41
Tracking Error 1.25% 0% 0%
Maximum Drawdown 47.0% 47.0% 48.42%
Volatility^ 17.5% 17.0% 17.17%
Turnover 21.2% 12.2% 2.99%**
Number of Securities (2014) 382 500 500
Carbon Efficiency 94.16 Tonnes/Mn 217.53 Tonnes/Mn 222 Tonnes/Mn
Carbon Efficiency Reduction 56.71% 0% 0%
© 2014 Corporate Knights Capital - Proprietary and Confidential
Detailed performance statistics
19* As of August 31, 2014**Taken from SPY (https://finance.yahoo.com/q/pr?s=SPY+Profile)

Historical Performance of the Low Carbon Europe vs STOXX 600 (2008-01/2014-08)
20
$ 45
$ 69
$ 93
$ 116
$ 140
Nov-07 Jul-09 Apr-11 Dec-12 Aug-14
Low Carbon EuropeSolactive Europe 600Stoxx 600

^ Calculated using monthly returns, then annualized
Portfolio Analysis Low carbon Europe vs Solactive 600 Solactive 600 Stoxx 600
Total Return* 32.76% 23.76% 21.52%
Alpha^* 1.1% 0% 0%
Beta 0.99 1 1
Information Ratio 0.97 N/A N/A
Sharpe Ratio 0.26 0.20 0.18
Tracking Error 1.13% 0% 0%
Maximum Drawdown -48.4% -50.0% -50.3%
Volatility^ 16.6% 16.6% 16.7%
Turnover 31.8% 15.1% ND
Number of Securities (2014) 485 600 600
Carbon Efficiency 84.46 Tonnes/Sales(Mn) 191.36 Tonnes/Sales(Mn) 213.41 Tonnes/Sales(Mn)
Carbon Efficiency Reduction -55.86% 0% 0%
© 2014 Corporate Knights Capital - Proprietary and Confidential
Detailed performance statistics
21* As of August 31, 2014

4 things to watch out for1.Are you making carbon bets in sectors
where carbon is not important? 2.Apples to oranges: What does best in
sector mean? Are you using the right buckets to compare firms?
3.Estimated carbon: Are you making bets based on imaginary numbers?
4.Are you meeting your carbon and financial objectives?
22

23
Contact information
For questions or more information on Corporate Knights Capital, please contact: !!Toby Heaps CEO Corporate Knights Capital !Ph: (416) 203-0066 Email: [email protected] ! !!
Kyle Balkissoon Director of Quantitative Strategy Corporate Knights Capital’ !Ph: (416) 203-4674 x 231 Email: [email protected] !!
Disclaimer !The information, concepts, findings and recommendations expressed or implied in this document are based on information available at the time of this document’s preparation. Actions undertaken on the basis of information, concepts, findings and recommendations contained in this document are at the sole risk of the reader. Corporate Knights, Inc. shall have no liability whatsoever for any damages or losses arising directly or indirectly from the use of the information, concepts, findings and recommendations contained in this document. All information is provided “as is” without any warranty or condition of any kind, including as to its completeness and/or accuracy. The document may contain inaccuracies, omissions or typographical errors. The indicated rates of return herein are the historical annual compounded total returns including changes in unit value and reinvestment of all distributions and do not take into account sales, redemption, distribution or operational charges or income taxes payable by any security holder that would have reduced returns. The funds are not guaranteed, their values change frequently (without warning) and past performance (positive or negative) may not be indicative of potential future results. Tax, investment and all other decisions should be made, as appropriate, only with guidance from a qualified professional.
© 2014 Corporate Knights Capital -Proprietary and Confidential