Embed Size (px)
Citation preview
UNITED STATESSECURITIES AND EXCHANGE COMMISSION
Washington, D.C. 20549
FORM 10-K(Mark One)
È ANNUAL REPORT PURSUANT TO SECTION 13 OR 15(d) OF THE SECURITIES EXCHANGE ACTOF 1934
For the fiscal year ended June 30, 2008
‘ TRANSITION REPORT PURSUANT TO SECTION 13 OR 15(d) OF THE SECURITIES EXCHANGEACT OF 1934
For the transition period from to .
Commission file number 0-15086
SUN MICROSYSTEMS, INC.(Exact name of registrant as specified in its charter)
Delaware 94-2805249(State of incorporation) (I.R.S. Employer Identification No.)
4150 Network Circle (650) 960-1300Santa Clara, CA 95054 (Registrant’s telephone number, including area code)
(Address of principal executive offices, http://www.sun.com/aboutsun/investorincluding zip code) (Registrant’s url)
Securities registered pursuant to Section 12(b) of the Act:Title of Each Class Name of Each Exchange on Which Registered
Common Stock The NASDAQ Global Select Market
Securities registered pursuant to Section 12(g) of the Act: None
Indicate by check mark if the Registrant is a well-known seasoned issuer, as defined in Rule 405 of the Securities Act of1933. YES È NO ‘
Indicate by check mark if the Registrant is not required to file reports pursuant to Section 13 or Section 15(d) of the SecuritiesExchange Act of 1934 (the “Exchange Act”). YES ‘ NO È
Indicate by check mark whether the Registrant (1) has filed all reports required to be filed by Section 13 or 15(d) of theExchange Act during the preceding 12 months (or for such shorter period that the Registrant was required to file such reports)and (2) has been subject to such filing requirements for the past 90 days. YES È NO ‘
Indicate by check mark if disclosure of delinquent filers pursuant to Item 405 of Regulation S-K is not contained herein and willnot be contained, to the best of Registrant’s knowledge, in definitive proxy or information statements incorporated by referencein Part III of this Form 10-K or any amendment to this Form 10-K. YES ‘ NO È
Indicate by check mark whether the Registrant is a large accelerated filer, an accelerated filer, or a non-accelerated filer. Seedefinition of “accelerated filer” and “large accelerated filer” in Rule 12b-2 of the Exchange Act. (Check one):
Large accelerated filer È Accelerated filer ‘ Non-accelerated filer ‘ Smaller reporting company ‘
Indicate by check mark whether the registrant is a shell company (as defined in Rule 12b-2 of the ExchangeAct). YES ‘ NO È
The aggregate market value of the voting stock (Common Stock) held by non-affiliates of the registrant, as of December 28,2007 (the last business day of registrant’s second quarter of fiscal 2008), was approximately $13 billion based upon the last saleprice reported for such date on The NASDAQ Global Select Market. For purposes of this disclosure, shares of Common Stockheld by persons who hold more than 5% of the outstanding shares of Common Stock and shares held by officers and directors ofthe Registrant have been excluded because such persons may be deemed to be affiliates. This determination is not necessarilyconclusive.
The number of shares of the registrant’s Common Stock (par value $0.001) outstanding as of August 22, 2008 was 752,953,410.
DOCUMENTS INCORPORATED BY REFERENCE
Parts of the Proxy Statement for the 2008 Annual Meeting of Stockholders are incorporated by reference into Items 10, 11, 12,13 and 14 hereof.
INDEX
PART IItem 1. Business . . . . . . . . . . . . . . . . . . . . . . . . . . . . . . . . . . . . . . . . . . . . . . . . . . . . . . . . . . . . . . . . . . . . . . . . . . . . . 3
Executive Officers of the Registrant . . . . . . . . . . . . . . . . . . . . . . . . . . . . . . . . . . . . . . . . . . . . . . . . . . . . . . . . 9
Item 1A. Risk Factors . . . . . . . . . . . . . . . . . . . . . . . . . . . . . . . . . . . . . . . . . . . . . . . . . . . . . . . . . . . . . . . . . . . . . . . . . . 11
Item 1B. Unresolved Staff Comments . . . . . . . . . . . . . . . . . . . . . . . . . . . . . . . . . . . . . . . . . . . . . . . . . . . . . . . . . . . . . . 21
Item 2. Properties . . . . . . . . . . . . . . . . . . . . . . . . . . . . . . . . . . . . . . . . . . . . . . . . . . . . . . . . . . . . . . . . . . . . . . . . . . . . 21
Item 3. Legal Proceedings . . . . . . . . . . . . . . . . . . . . . . . . . . . . . . . . . . . . . . . . . . . . . . . . . . . . . . . . . . . . . . . . . . . . . . 22
Item 4. Submission of Matters to a Vote of Security Holders . . . . . . . . . . . . . . . . . . . . . . . . . . . . . . . . . . . . . . . . . . 22
PART IIItem 5. Market for the Registrant’s Common Equity, Related Stockholder Matters and Issuer Purchases of Equity
Securities . . . . . . . . . . . . . . . . . . . . . . . . . . . . . . . . . . . . . . . . . . . . . . . . . . . . . . . . . . . . . . . . . . . . . . . . . . . . . 23
Item 6. Selected Financial Data . . . . . . . . . . . . . . . . . . . . . . . . . . . . . . . . . . . . . . . . . . . . . . . . . . . . . . . . . . . . . . . . . . 25
Item 7. Management’s Discussion and Analysis of Financial Condition and Results of Operations . . . . . . . . . . . . . 26
Item 7A. Quantitative and Qualitative Disclosures About Market Risk . . . . . . . . . . . . . . . . . . . . . . . . . . . . . . . . . . . . 46
Item 8. Financial Statements and Supplementary Data . . . . . . . . . . . . . . . . . . . . . . . . . . . . . . . . . . . . . . . . . . . . . . . . 48
Consolidated Statements of Operations . . . . . . . . . . . . . . . . . . . . . . . . . . . . . . . . . . . . . . . . . . . . . . . . . 49
Consolidated Balance Sheets . . . . . . . . . . . . . . . . . . . . . . . . . . . . . . . . . . . . . . . . . . . . . . . . . . . . . . . . . 50
Consolidated Statements of Cash Flows . . . . . . . . . . . . . . . . . . . . . . . . . . . . . . . . . . . . . . . . . . . . . . . . . 51
Consolidated Statements of Stockholders’ Equity . . . . . . . . . . . . . . . . . . . . . . . . . . . . . . . . . . . . . . . . . 52
Notes to Consolidated Financial Statements . . . . . . . . . . . . . . . . . . . . . . . . . . . . . . . . . . . . . . . . . . . . . . 53
Item 9. Changes in and Disagreements with Accountants on Accounting and Financial Disclosure . . . . . . . . . . . . 91
Item 9A. Controls and Procedures . . . . . . . . . . . . . . . . . . . . . . . . . . . . . . . . . . . . . . . . . . . . . . . . . . . . . . . . . . . . . . . . . 91
Item 9B. Other Information . . . . . . . . . . . . . . . . . . . . . . . . . . . . . . . . . . . . . . . . . . . . . . . . . . . . . . . . . . . . . . . . . . . . . . 91
PART IIIItem 10. Directors and Executive Officers of the Registrant . . . . . . . . . . . . . . . . . . . . . . . . . . . . . . . . . . . . . . . . . . . . 92
Item 11. Executive Compensation . . . . . . . . . . . . . . . . . . . . . . . . . . . . . . . . . . . . . . . . . . . . . . . . . . . . . . . . . . . . . . . . 92
Item 12. Security Ownership of Certain Beneficial Owners and Management and Related Stockholder Matters . . . 92
Item 13. Certain Relationships and Related Transactions . . . . . . . . . . . . . . . . . . . . . . . . . . . . . . . . . . . . . . . . . . . . . . . 92
Item 14. Principal Accountant Fees and Services . . . . . . . . . . . . . . . . . . . . . . . . . . . . . . . . . . . . . . . . . . . . . . . . . . . . . 92
PART IVItem 15. Exhibits and Financial Statement Schedules . . . . . . . . . . . . . . . . . . . . . . . . . . . . . . . . . . . . . . . . . . . . . . . . . 93
SIGNATURES . . . . . . . . . . . . . . . . . . . . . . . . . . . . . . . . . . . . . . . . . . . . . . . . . . . . . . . . . . . . . . . . . . . . . . . . . . . . . . . . . . . . . 95
2

PART I
ITEM 1. BUSINESS
GENERAL
Sun Microsystems, Inc. (NASDAQ: JAVA) provides network computing infrastructure solutions that drive global networkparticipation through shared innovation, community development and open source leadership. Guided by a singular vision, “TheNetwork is the Computer™”, we provide a diversity of software, systems, storage, services and microelectronics that powereverything from consumer electronics, to developer tools and the world’s most powerful data centers.
With core brands including the Java™ technology platform, the Solaris™ Operating System, the MySQL™ databasemanagement system, Sun StorageTek™ storage solutions and the UltraSPARC® processor, our network computing platformsare used by nearly every sector of society and industry, and provide the infrastructure behind some of the world’s best knownsearch, social networking, entertainment, financial services, manufacturing, healthcare, retail, news, energy and engineeringcompanies.
By investing in research and development, we create products and services that address the complex information technologyissues facing customers today, including increasing demands for network access, bandwidth and storage. We share theseinnovations in order to grow communities, in turn increasing participation on the network and building new marketopportunities while maintaining partnerships with some of the most innovative technology companies in the world.
For the fiscal year ended June 30, 2008, we reported net revenues of $13.9 billion, employed approximately 34,900 employeesand conducted business in over 100 countries. We were incorporated in California in February 1982, and reincorporated inDelaware in July 1987.
Our Internet address is http://www.sun.com. The following filings are posted to our Investor Relations web site, located athttp://www.sun.com/investors as soon as reasonably practical after submission to the United States (U.S.) Securities andExchange Commission (SEC): annual reports on Form 10-K, quarterly reports on Form 10-Q, current reports on Form 8-K, theproxy statement related to our most recent annual stockholders’ meeting and any amendments to those reports or statementsfiled or furnished pursuant to Section 13(a) or 15(d) of the Securities Exchange Act of 1934, as amended. All such filings areavailable free of charge on our Investor Relations web site. We periodically webcast company announcements, product launchevents and executive presentations which can be viewed via our Investor Relations web site. Additionally, we providenotifications of our material news including SEC filings, investor events, press releases and CEO blogs as part of the OfficialInvestor Communications section of our Investor Relations web site. The contents of these web sites are not intended to beincorporated by reference into this report or in any other report or document we file and any references to these web sites areintended to be inactive textual references only.
BUSINESS STRATEGY
Our business strategy is to provide superior network computing infrastructure solutions that rely on innovation as a coredifferentiator. A key driver behind this strategy is the development, integration and sharing of our software, microprocessors,storage, services and systems in order to grow communities of developers and users around the world, while increasingparticipation on the network and building new markets for our solutions. We intend to continue to invest in this model, with afocus on the development and delivery of leading-edge, energy-efficient network computing products based upon our latestinnovations.
With a strong commitment to open standards, open interfaces and the open source community, we believe sharing andcollaboration is key to our long-term success. We focus on creating communities and sharing innovations and technologies tofoster global network participation and advance the use of the Internet as a social utility, driving increases in use and demand forthe infrastructure to support that increased use. Our open source initiatives are intended to increase participation in software andhardware design by making our innovative hardware and software intellectual property freely available. A core premise to thesuccess of our software business is our ability to attract innovative application developers to our Java platform and SolarisOperating System. We build relationships with these communities of developers to stimulate demand for our commercialproducts and services. For example, more Java technology-driven devices means more demand for what we build to supportthose devices. Today, there are billions of Java-enabled devices in the marketplace. As more people gain access to the network,more opportunities surface for developers and businesses to deploy applications that create value, from educational institutionsdeploying high-performance computing grids, to banks and social networks serving millions of users. Bringing more people tothe network and encouraging development of community-based intellectual property fuels greater demand for the innovativetechnologies and services that we create.
3
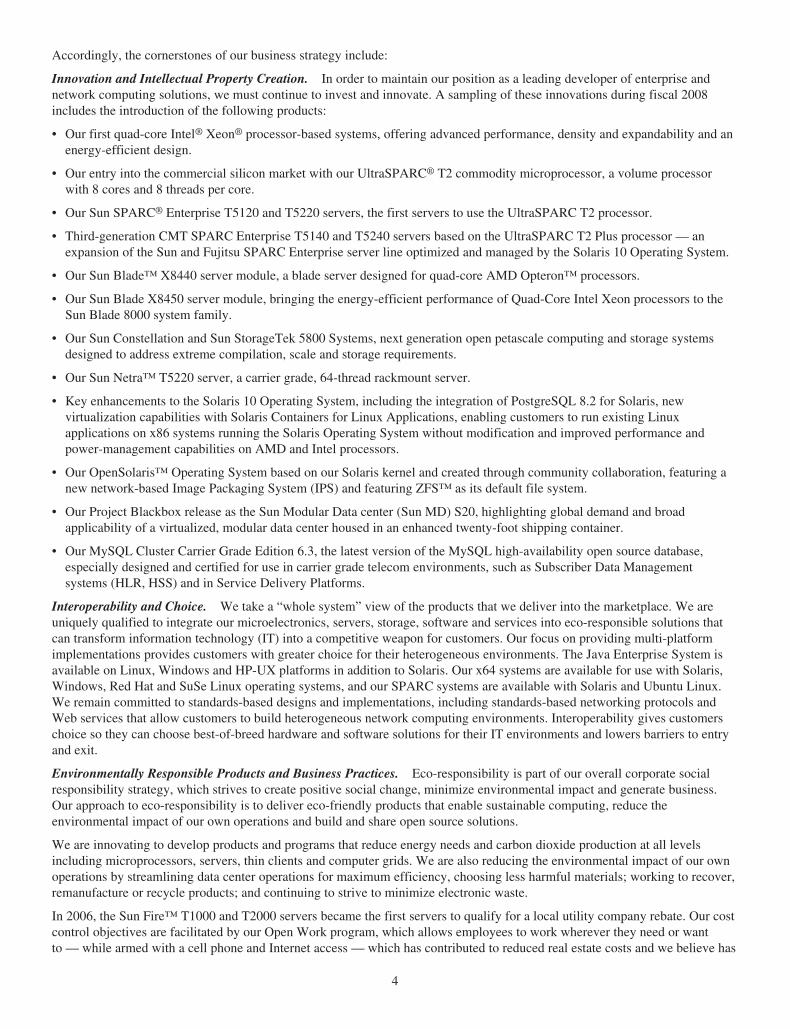
Accordingly, the cornerstones of our business strategy include:
Innovation and Intellectual Property Creation. In order to maintain our position as a leading developer of enterprise andnetwork computing solutions, we must continue to invest and innovate. A sampling of these innovations during fiscal 2008includes the introduction of the following products:
• Our first quad-core Intel® Xeon® processor-based systems, offering advanced performance, density and expandability and anenergy-efficient design.
• Our entry into the commercial silicon market with our UltraSPARC® T2 commodity microprocessor, a volume processorwith 8 cores and 8 threads per core.
• Our Sun SPARC® Enterprise T5120 and T5220 servers, the first servers to use the UltraSPARC T2 processor.
• Third-generation CMT SPARC Enterprise T5140 and T5240 servers based on the UltraSPARC T2 Plus processor — anexpansion of the Sun and Fujitsu SPARC Enterprise server line optimized and managed by the Solaris 10 Operating System.
• Our Sun Blade™ X8440 server module, a blade server designed for quad-core AMD Opteron™ processors.
• Our Sun Blade X8450 server module, bringing the energy-efficient performance of Quad-Core Intel Xeon processors to theSun Blade 8000 system family.
• Our Sun Constellation and Sun StorageTek 5800 Systems, next generation open petascale computing and storage systemsdesigned to address extreme compilation, scale and storage requirements.
• Our Sun Netra™ T5220 server, a carrier grade, 64-thread rackmount server.
• Key enhancements to the Solaris 10 Operating System, including the integration of PostgreSQL 8.2 for Solaris, newvirtualization capabilities with Solaris Containers for Linux Applications, enabling customers to run existing Linuxapplications on x86 systems running the Solaris Operating System without modification and improved performance andpower-management capabilities on AMD and Intel processors.
• Our OpenSolaris™ Operating System based on our Solaris kernel and created through community collaboration, featuring anew network-based Image Packaging System (IPS) and featuring ZFS™ as its default file system.
• Our Project Blackbox release as the Sun Modular Data center (Sun MD) S20, highlighting global demand and broadapplicability of a virtualized, modular data center housed in an enhanced twenty-foot shipping container.
• Our MySQL Cluster Carrier Grade Edition 6.3, the latest version of the MySQL high-availability open source database,especially designed and certified for use in carrier grade telecom environments, such as Subscriber Data Managementsystems (HLR, HSS) and in Service Delivery Platforms.
Interoperability and Choice. We take a “whole system” view of the products that we deliver into the marketplace. We areuniquely qualified to integrate our microelectronics, servers, storage, software and services into eco-responsible solutions thatcan transform information technology (IT) into a competitive weapon for customers. Our focus on providing multi-platformimplementations provides customers with greater choice for their heterogeneous environments. The Java Enterprise System isavailable on Linux, Windows and HP-UX platforms in addition to Solaris. Our x64 systems are available for use with Solaris,Windows, Red Hat and SuSe Linux operating systems, and our SPARC systems are available with Solaris and Ubuntu Linux.We remain committed to standards-based designs and implementations, including standards-based networking protocols andWeb services that allow customers to build heterogeneous network computing environments. Interoperability gives customerschoice so they can choose best-of-breed hardware and software solutions for their IT environments and lowers barriers to entryand exit.
Environmentally Responsible Products and Business Practices. Eco-responsibility is part of our overall corporate socialresponsibility strategy, which strives to create positive social change, minimize environmental impact and generate business.Our approach to eco-responsibility is to deliver eco-friendly products that enable sustainable computing, reduce theenvironmental impact of our own operations and build and share open source solutions.
We are innovating to develop products and programs that reduce energy needs and carbon dioxide production at all levelsincluding microprocessors, servers, thin clients and computer grids. We are also reducing the environmental impact of our ownoperations by streamlining data center operations for maximum efficiency, choosing less harmful materials; working to recover,remanufacture or recycle products; and continuing to strive to minimize electronic waste.
In 2006, the Sun Fire™ T1000 and T2000 servers became the first servers to qualify for a local utility company rebate. Our costcontrol objectives are facilitated by our Open Work program, which allows employees to work wherever they need or wantto — while armed with a cell phone and Internet access — which has contributed to reduced real estate costs and we believe has
4

eased pollution and reduced energy use. More than 56% of our employees around the world work from home or a flexibleoffice, saving us tens of millions of dollars annually in real estate costs. We have driven out additional costs by significantlyconsolidating our global data center square footage and implementing state-of-the-art energy efficient data center designprinciples. During fiscal 2008, we have significantly reduced our annual energy costs in the Bay Area as a result of theconsolidation into our new Santa Clara data center which was completed in June 2007. Silicon Valley Power, a local utilitycompany, has recognized the breakthrough efficiencies and design of this data center by giving us approximately $1.2 million inrebates and awards, which included a $250,000 innovation grant.
SEGMENT INFORMATION
During fiscal 2008, our Products revenue was comprised of revenue from Computer Systems products and Storage products.Our Services revenue was comprised of sales from two classes of services: (1) Support Services (Support and ManagedServices) and (2) Professional Services and Educational Services. Support Services are services that offer customers technicalsupport, software, and firmware updates, online tools, product repair and maintenance and preventive services for system,storage and software products. Managed Services include on-site and remote monitoring and management for the componentsof their IT infrastructure, including operating systems, third-party and custom applications, databases, networks, security,storage and the web. Professional Services are services that enable customers to reduce costs and complexity, improveoperational efficiency and build or transform their IT infrastructure. Professional Services include IT assessments, architecturalservices, implementation services and consolidation and migration services. Educational Services include training andcertification for individuals and teams. In fiscal 2008, 2007 and 2006, Computer Systems represented approximately 45%, 46%and 46%, respectively, of total net revenues. In fiscal 2008, 2007 and 2006, Storage products represented approximately 17%,17% and 18%, respectively, of total net revenues. In fiscal 2008, 2007 and 2006, Support Services represented approximately29%, 29% and 28%, respectively, of total net revenues. In fiscal 2008, 2007 and 2006, Professional Services and EducationalServices represented approximately 9%, 8% and 8%, respectively, of total net revenues. A table providing external revenue forsimilar classes of products and services for the last three fiscal years is found in Note 15 to the Consolidated FinancialStatements in Item 8. Financial information for each segment for fiscal 2008, 2007 and 2006 is found in Note 15 to theConsolidated Financial Statements in Item 8.
PRODUCTS
We develop innovative networking computing products and technologies that include energy-efficient servers, storage, opensource software, tools, services and training. For information about revenue for similar classes of products and services, refer toNote 15 to the Consolidated Financial Statements in Item 8 and Item 7, Management’s Discussion and Analysis of FinancialCondition and Results of Operations — Results of Operations.
SYSTEMS
The substantial growth of network data and traffic, increasing compliance and regulatory demands, expanding needs forincreased computing capacity and market pressure for energy and space reductions requires a broad set of system solutions thatare cost effective, reliable, scalable and eco-responsible.
Servers. We offer a full line of scalable servers based on SPARC64®, UltraSPARC, AMD Opteron and Intel Xeonmicroprocessors, that range from cost and energy efficient entry level servers and blade systems through data center/high-performance business critical computing servers designed for heterogeneous computing environments.
Entry server systems. We offer a wide range of Sun Fire and Sun Blade entry server systems differentiated by their size, theircost, their processor architecture (UltraSPARC, SPARC64, AMD Opteron or Intel Xeon), their form factor (rack, blade orstand-alone systems) and the environment for which they are targeted (general purpose or specialized systems). These systemsare compatible with the Solaris, Linux and Windows operating system environments.
Enterprise and data center servers. Our enterprise and data center servers, including the Sun Fire and SPARC Enterpriseproduct families, are designed to offer greater performance and lower total cost of ownership than mainframe systems forbusiness critical applications and more computational intensive environments. These systems are based on UltraSPARC,SPARC64, AMD and Intel microprocessor platforms and are also compatible with the Solaris, Linux and Windows operatingsystem environments.
Desktops. Our Sun Ray™ Ultra-Thin Client platforms provide an alternative to traditional desktop personal computers whereclient applications are better suited and more economical to run on a network versus an individual desktop platform.
We also offer a line of products aimed at the unique needs of Original Equipment Manufacturers (OEMs) and NetworkEquipment Providers (NEPs). Rack-optimized systems and our blade product offerings combine high-density hardware
5

architecture and system management software that OEMs find particularly useful in building their own solution architectures.Our NEP-certified Sun Netra systems are designed to meet the specialized needs of NEPs.
Microelectronics. Our microelectronics business develops and sells silicon-based chips that facilitate networking,cryptography and high-performance computing. These chips are utilized by OEM customers and hardware vendors worldwidein a broad range of devices from servers to routers, switches, network devices, medical imaging, industrial printing and more.
Storage. We offer a broad range of products and services for securely managing mission critical data assets. Ourentry-to-enterprise-level data storage products and services include heterogeneous tape, disk, software, networking and servicesfor mainframe and open systems environments.
Our tape storage includes libraries, drives, virtualization systems, media and software. The extensive disk system product lineincludes data center disks, Network Attached Storage (NAS), Enterprise Archive System, mid-range disks, workgroups disks, aboot disk and a full range of disk device software.
We are leveraging the Solaris Operating System across our storage portfolio to increase data management per administrator,scalability, security, utilization rates, observability and self-healing. The heterogeneous, industry-standard modular storagehardware works with Windows, Linux, z/OS, HP-UX, AIX and Solaris platforms and other software, so customers can morequickly and cost-effectively adapt to changing business needs. Our Storage solutions help to improve data availability,providing fast data access, dynamic data protection for restoration and secure archiving for compliance.
SOFTWARE
Our software offerings consist primarily of enterprise infrastructure software systems, software desktop systems, developersoftware and infrastructure management software.
Solaris. The Solaris Operating System is a high performance, reliable, scalable and secure operating environment for SPARCand x64 platforms. It is optimized for enterprise computing, Internet and intranet business requirements, powerful databases andhigh-performance technical computing environments. The Solaris Operating System runs on hundreds of different serverplatforms including standard x64/x86 servers. The ability to run on multiple platforms has contributed to the rapid growth of theSolaris Operating System on non-SPARC based systems over the last two years. Additionally, we recently announced thatFujitsu-Siemens Computers will distribute the Solaris Operating System and Solaris Subscriptions for select x86-basedPRIMERGY servers, joining other leading OEMs — including IBM, Dell and Intel — that support and offer Solaris on x86hardware.
OpenSolaris. OpenSolaris is an open source project we created in 2005 to build a developer community around the SolarisOperating System. In May 2008, Sun and the global OpenSolaris community introduced the availability of the OpenSolarisOperating System, a single distribution for desktop, server and high-performance computing deployments. OpenSolaris, basedon the Solaris kernel and created through community collaboration, delivers a development and deployment environmentoffering a combination of rapid innovation, platform stability and support to meet business and development needs. OpenSolarisfeatures a new network-based IPS and features ZFS as its default file system.
Java Technology. Java technology plays a key role in powering compelling content and rich end-user experiences acrossvarious consumer electronics platforms. The Java platform is a global standard that powers billions of devices — from desktopbrowsers and computers to mobile phones and Blu-ray Disc players, TVs, Java smart cards and other connected consumerproducts.
Middleware. We also offer a full range of middleware solutions including mission-critical clustering, messaging, identitymanagement, directory, service-oriented architecture (SOA), business integration, application server and Web servicesinfrastructure software. Other software offerings include provisioning and monitoring software for network computing resourceoptimization and systems management simplification.
Virtualization. We announced our virtualization and management strategy in fiscal 2008, which includes an end-to-endportfolio of virtualization products from the desktop to the data center — Sun xVM VirtualBox™, Sun VDI, Sun xVM OpsCenter and our to-be-released Sun xVM Server.
MySQL. MySQL is one of the fastest growing open source databases in the world. Many of the world’s largest and fastest-growing organizations use MySQL to save time and money powering their high-volume web sites, critical business systems andpackaged software. We provide corporate users with commercial subscriptions and services and actively support the largeMySQL open source developer community.
Network.com. Our Network.com™ site offers access to compute infrastructure on a pay-per-use basis via our Sun Gridcompute utility at $1/CPU-hr. It is powered by the Solaris 10 Operating System and Sun Grid Engine running on our x64hardware. CPU-hr is defined as the aggregate time spent across all CPUs and rounded up to the next hour.
6
SERVICES
We offer a broad range of services from Support Services and Managed Services for hardware, software and client solutions, toProfessional Services and Educational Services. We assist customers globally with Support Services contracts in more than 100countries.
Our services innovation is focused on integrating technology, knowledge, process and partners to deliver customer satisfaction,profitably, through our services to architect, implement and manage IT infrastructure. Our global service and support offeringshelp our customers increase system service levels, improve data center operational efficiency and effectiveness, and to deploynext-generation automation technologies to provide predictive, preemptive and proactive service to heterogeneousinfrastructures.
SALES, MARKETING AND DISTRIBUTION
Our Global Sales and Services organization manages and has primary responsibility for our field sales organization, relationshipswith selling partners, technical sales support, sales operations and delivery of Support, Managed and Professional Services. We sellend-to-end networking architecture platform solutions, including products and services, in most major markets globally through acombination of direct and indirect channels. We also offer component products, such as central processor unit (CPU) chips andembedded boards, on an OEM basis to other hardware manufacturers and supply after-market and peripheral products to theirend-user installed base, both directly and through independent distributors and value added resellers (VARs).
We have organized our sales coverage within 16 geographically established markets (GEMs) around the world and employindependent distributors in over 100 countries. In general, the sales coverage model calls for independent distributors to bedeployed via strategic alliances with our direct sales force. However, in some smaller markets, independent distributors andjoint venture partners may be the sole means of sales, marketing and distribution. Our relationships with channel partners arevery important to our future revenues and profitability. Channel relationships accounted for more than 63%, 65% and 63% ofour total net revenues in fiscal 2008, 2007 and 2006, respectively.
The partner community is essential to our success. With a vast and diverse product and service portfolio, we recognize that nosingle supplier of computing solutions can meet the needs of all of its customers. As a result, we have established relationshipswith leading Independent Software Vendors (ISVs), VARs, OEMs, channel development providers, independent distributors,computer systems integrators and Service Development Providers (SDPs) to deliver solutions that customers demand. Throughthese relationships, it is our goal to optimize our ability to be the technology of choice, the platform of choice, the partner ofchoice and to provide the end-to-end solutions that customers require to compete. Our Worldwide Marketing Organizationoversees marketing planning, determines product and pricing strategy, coordinates advertising, demand creation and publicrelations activities, maintains strategic alliances with major ISVs and performs competitive analyses. Additionally, ISV partnershelp us to maximize our technology footprint by integrating their software products with our platforms and technologies. SDPs,such as Internet Service Providers (ISPs) and Application Service Providers (ASPs), allow us to expand our service coveragewithout new large-scale investments.
We seek out partner companies that align with our technology direction and vision of enabling network participation. We havelong-standing partnerships with several companies, including: Advanced Micro Devices, Inc. (AMD) to expand its entry-levelline of Opteron processor-based x64 systems; Intel Corporation, whereby Intel endorses the Solaris Operating System and weoffer a comprehensive family of servers and workstations based on Xeon processors; Fujitsu to deliver and support a generationof SPARC-based systems that we have developed through collaboration (our relationship with Fujitsu is discussed in greaterdetail in Item 1A, “Risk Factors”) and is intended to enlarge the Solaris Operating System footprint, drive increased marketshare for our enterprise-class systems and allow for additional dedicated resources to our throughput computing initiative andnext generation of processor products; and Hitachi Data Systems to provide high-end storage solutions and extend our storageofferings into other enterprise environments.
Several new or expanded partnerships were announced in fiscal 2008, including those with: IBM to distribute our Solaris 10Operating System and Solaris for select x86-based IBM servers and blade servers; Google to make our StarOffice™ Suiteavailable through the Google Pack software download service; Dell to establish a multi-year OEM agreement making theSolaris Operating System and support services available directly to customers for select Dell PowerEdge services; andMicrosoft to expand our existing alliance with the official opening of the Sun/Microsoft Interoperability Center for optimizingMicrosoft applications on Sun Fire x64 server systems and storage, and the availability of the Sun Infrastructure Solution forMicrosoft Exchange Server 2007.
Revenues from outside the U.S. were approximately 63%, 59% and 58% of our total net revenues in fiscal 2008, 2007 and 2006,respectively. Direct sales outside of the U.S. are generally priced in local currencies and can be subject to currency exchangefluctuations. The net foreign currency impact on our total net revenues and operating results is difficult to precisely measure due
7
to hedging and pricing actions we take to mitigate the effect of foreign exchange rate fluctuations. Excluding the effect of theseactions, and due to the general weakening of the U.S. dollar, the maximum favorable impact related to foreign exchange ratechanges during fiscal 2008, as compared with fiscal 2007, would be approximately 4% to net revenues.
For further financial information on our sales and long-lived assets by geographic area, see “Net Revenues by Geographic Area”in Item 7, Management’s Discussion and Analysis of Financial Condition and Results of Operations and Note 15 to theConsolidated Financial Statements in Item 8.
For a discussion of risks attendant to our foreign operations, see “Risk Factors — Our international customers and operationssubject us to a number of risks,” in Item 1A.
Although our sales and other operating results can be influenced by a number of factors, and historical results are notnecessarily indicative of future results, our sequential quarterly operating results generally fluctuate downward in the first andthird quarters of each fiscal year when compared with the immediately preceding quarter.
Sales to Avnet, Inc. (Avnet), the largest distributor of our products, accounted for approximately 11% of our net revenues ineach of fiscal 2008, 2007 and 2006. In January 2007, Access Distribution, the largest distributor of our products at the time, wassold to Avnet by General Electric Company. Avnet was StorageTek’s largest distributor and became a distributor of ourproducts after our acquisition of StorageTek in August 2005. The net revenue percentages for fiscal 2007 and 2006 representsales to Avnet and Access Distribution on a combined basis. No other customer accounted for more than 10% of our netrevenues in fiscal 2008.
Our product order backlog at June 30, 2008 was $1.1 billion, as compared with $1.0 billion at June 30, 2007. The productbacklog total includes orders for which customer-requested delivery is scheduled within six months and orders that have beenspecified by the customer for which products have been shipped but revenue has been deferred. Although actual customerdelivery can occur over several periods, product backlog can be used to identify potential revenue coverage for future periods.The larger the percentage coverage of targeted pending revenue, the lower the potential risk of non-achievement. Backlog levelsvary with demand, product availability, product revenue recognition treatment, and delivery lead times and are subject tosignificant decreases as a result of, among other things, customer order delays, changes or cancellations. As such, backlog levelsmay not be a reliable indicator of future operating results.
WORLDWIDE OPERATIONS
Our Worldwide Operations organization manages company-wide purchasing of materials used in making our products, assists inproduct design enhancements, oversees in-house manufacturing operations and those of our manufacturing partners andcoordinates logistics operations.
Our manufacturing operations consist primarily of final assembly, test and quality control of enterprise and data center serversand storage systems. For all other systems, we rely on external manufacturing partners. We manufacture primarily in Oregonand Scotland and distribute much of our hardware products from our facilities and partner facilities located in California, theNetherlands and Japan.
We are expanding our direct ship capabilities, using a customer fulfillment architecture that enables us to ship certain productsfrom suppliers directly to customers, with the goal of reducing cost, risk and complexity in the supply chain. We have continuedto simplify our manufacturing process by increasing the standardization of components across product types. In addition, wehave continued to increase our focus on quality and processes that are intended to proactively identify and solve quality issues.The early identification of products containing defects in engineering, design and manufacturing processes, as well as defects inthird-party components included in the products, could prevent or reduce delays of product shipments.
RESEARCH AND DEVELOPMENT
Our research and product development programs are intended to sustain and enhance our competitive position by incorporatingthe latest advances in hardware, microprocessors, software, graphics, networking, data communications and storagetechnologies. As such, we have extended our product offerings and intellectual property through acquisitions of businesses,technologies and other arrangements with alliance partners. Product development continues to focus on enhancing theperformance, scalability, reliability, availability, security, energy efficiency and serviceability of our existing systems and thedevelopment of new technology standards. Additionally, we remain focused on system software platforms for Internet andintranet applications, telecommunications and next-generation service provider networks, developing advanced workstation,server and storage architectures and advanced service offerings. We devote substantial resources to research and development(R&D) believing it provides and will continue to provide significant competitive differentiation. R&D expenses were $1.8billion, $2.0 billion and $2.0 billion in fiscal 2008, 2007 and 2006, respectively.
8
COMPETITION
We operate in the computer systems (hardware and software), storage (hardware and software) and services markets. Thesemarkets are intensely competitive. Our competitors are some of the largest, most successful companies in the world. Theyinclude International Business Machines Corporation (IBM), Dell Inc. (Dell), Hewlett-Packard Company (HP), EMCCorporation (EMC), Oracle Corporation (Oracle), Fujitsu Limited (Fujitsu), Hitachi Data Systems, Inc. (HDS) and the Fujitsu-Siemens joint venture. We also compete with (i) systems manufacturers and resellers of systems based on microprocessorsmanufactured by Intel Corporation (Intel), the Windows family of operating systems software from Microsoft and the Linuxfamily of operating systems from Red Hat and others, as well as (ii) companies that focus on providing support and maintenanceservices for computer systems and storage products.
We continue to invest significantly in R&D to create hardware, software and services based on open standards and innovativebusiness models to offer differentiated solutions to our customer, partner and developer communities. We focus our R&Dinvestments to address complex customer issues such as escalating IT infrastructure costs, data security, under-utilized IT assetsand the rising costs of power consumption, cooling and space in data-centers. We believe our innovations will continue to helpbusinesses and developers address these IT concerns, drive high-growth business solutions and differentiate us from our majorcompetitors.
We believe competition will be at least as intense in the next fiscal year as it was over the last fiscal year. In this environment, alack of competitive advantage with respect to our hardware, software or services offerings could lead to a loss of competitiveposition resulting in fewer customer orders, reduced revenues, reduced margins, reduced levels of profitability and loss ofmarket share. For more information about the competitive risks we face, refer to Item 1A. Risk Factors.
PATENTS, TRADEMARKS AND INTELLECTUAL PROPERTY LICENSES
We have used, registered or applied to register certain trademarks and service marks to distinguish our products, technologiesand services from those of our competitors in the U.S. and in foreign countries and jurisdictions. We enforce our trademark,service mark and trade name rights in the U.S. and abroad.
We hold a number of U.S. and foreign patents relating to various aspects of our products and technology. While we believe thatpatent protection is important, we believe that factors such as innovative skills and technological expertise provide even greatercompetitive differentiation. From time to time we receive assertions that we may be infringing certain patents or otherintellectual property rights of others. The action we take with respect to such assertions varies depending on our assessment ofthe nature of the particular assertion. When we believe there is a substantial likelihood that one of our products, componentparts, or activities may infringe a valid intellectual property right of another party, there are several steps we may take to addresssuch possible infringement, including securing alternative non-infringing products, designing our products or activities such thatthey do not infringe, or seeking a license on commercially reasonable terms. There is no guarantee that such efforts to remediateany infringement will be successful or that we will be able to obtain a license or that litigation will not occur. The adverseresolution of litigation arising out of such claims could adversely affect our business or financial condition, and could includeinjunctive relief that could limit our ability to market and sell certain of our products.
EXECUTIVE OFFICERS OF THE REGISTRANT
The following sets forth certain information regarding our Executive Officers as of August 28, 2008.
Name Age Position
Jonathan I. Schwartz . . . . . . . . . . 42 Chief Executive Officer and PresidentV. Kalyani Chatterjee-Tandon . . . 45 Vice President, Corporate Controller and Chief Accounting OfficerMichael A. Dillon . . . . . . . . . . . . . 49 Executive Vice President, General Counsel and SecretaryJohn F. Fowler . . . . . . . . . . . . . . . 47 Executive Vice President, Systems GroupAnil P. Gadre . . . . . . . . . . . . . . . . 51 Executive Vice President and Chief Marketing OfficerRichard L. Green . . . . . . . . . . . . . . 52 Executive Vice President, Software GroupMichael E. Lehman . . . . . . . . . . . 57 Chief Financial Officer and Executive Vice President, Corporate ResourcesWilliam N. MacGowan . . . . . . . . . 51 Chief Human Resources Officer and Executive Vice President, People and PlacesGregory M. Papadopoulos . . . . . . 50 Executive Vice President, Research and Development and Chief Technology OfficerPeter Ryan . . . . . . . . . . . . . . . . . . . 47 Executive Vice President, Global Sales and ServicesMichael E. Splain . . . . . . . . . . . . . 51 Executive Vice President, Microelectronics Group
9

Mr. Schwartz has served as President and Chief Executive Officer since April 2006, as President and Chief Operating Officerfrom April 2004 to April 2006, as Executive Vice President, Software from July 2002 to April 2004, as Senior Vice President,Corporate Strategy and Planning from July 2000 to July 2002, as Vice President, Ventures Fund from October 1999 to July2000. Prior to that, Mr. Schwartz served in several other positions with Sun.
Ms. Chatterjee-Tandon has served as Vice President, Corporate Controller and Chief Accounting Officer (Principal AccountingOfficer) since September 2006 and Vice President, Finance and Assistant Controller from February 2006 until September 2006.From March 2004 to February 2006, Ms. Chatterjee served as Sun’s Senior Director and Assistant Corporate Controller. FromJanuary 2003 to March 2004, Ms. Chatterjee served as the Vice President, Finance with Hotwire, Inc, an online travel company.From January 2000 to November 2002, Ms. Chatterjee served as a Senior Manager at KPMG LLP, an accounting firm.
Mr. Dillon has served as Executive Vice President, General Counsel and Secretary since April 2006, as Senior Vice President,General Counsel and Secretary from April 2004 to April 2006 and previously held the position of Vice President, Products LawGroup, from July 2002 to March 2004. From October 1999 until June 2002, he served as Vice President, General Counsel andCorporate Secretary of ONI Systems Corp, an optical networking company. Mr. Dillon initially joined Sun in 1993 andthereafter held successive management positions in several legal support groups until October 1999.
Mr. Fowler has served as Executive Vice President, Systems Group since May 2006, as Executive Vice President, NetworkSystems Group from May 2004 to May 2006, as Chief Technology Officer, Software Group from July 2002 to May 2004 andDirector, Corporate Development from July 2000 to July 2002.
Mr. Gadre has served as Executive Vice President, Chief Marketing Officer since November 2004, as Vice President, SoftwareMarketing from May 2002 to November 2004 and Vice President and General Manager of Solaris Software from April 1999 toMay 2002. Previously, he has held several positions related to Product and Corporate Marketing at Sun.
Mr. Green has served as Executive Vice President, Software Group since May 2006. From May 2004 to May 2006, Mr. Greenserved as Executive Vice President, Products for Cassatt Corporation, a data center software company. From April 2004 to May2004, Mr. Green served as Vice President, Java and Developer Programs and as Vice President, Java from December 1999 toApril 2004.
Mr. Lehman has served as Chief Financial Officer and Executive Vice President, Corporate Resources since February 2006 andas Executive Vice President from July 2002 until his resignation from employment in September 2002. From September 2002 toFebruary 2006, he was a member of the board of directors of Sun. He resigned from the Board when he returned to full-timeemployment at Sun. During that time, he was self-employed as a business consultant. From July 2000 to July 2002, he served asExecutive Vice President, Corporate Resources and Chief Financial Officer of Sun and from January 1998 to July 2000, as VicePresident, Corporate Resources and Chief Financial Officer. He is a director of MGIC Investment Corporation.
Mr. MacGowan has served as Chief Human Resources Officer and Executive Vice President of People and Places since April2006, as Senior Vice President, Human Resources, from April 2004 to April 2006, as Vice President, Human Resources, GlobalCenters of Expertise, from May 2003 to April 2004, as Vice President, Human Resources, Systems, Storage and Operations,from May 2002 to May 2003, Vice President, Human Resources, Enterprise Services, from May 2000 to May 2002 and asDirector, Human Resources, Enterprise Services, from June 1998 to May 2000.
Mr. Papadopoulos has served as Executive Vice President, Research and Development and Chief Technology Officer sinceMay 2006, as Executive Vice President and Chief Technology Officer from December 2002 to May 2006, as Senior VicePresident and Chief Technology Officer from July 2000 to December 2002 and as Vice President and Chief Technology Officerfrom April 1998 to July 2000. He served as Vice President and Chief Technology Officer of Sun Microsystems ComputerCorporation (SMCC), a wholly-owned subsidiary of Sun from March 1996 to April 1998, as Chief Technology Officer ofSMCC from December 1995 to March 1996 and as Chief Scientist, Server Systems Engineering from September 1994 toDecember 1995. Mr. Papadopoulos had a part-time, non-compensated appointment as a Visiting Professor of ElectricalEngineering and Computer Science at the Massachusetts Institute of Technology from September 2002 to August 2003.
Mr. Ryan has served as Executive Vice President, Global Sales and Services of Sun since June 2008, as Senior Vice President,Global Sales for the Americas Region from July 2007 to June 2008 and as Senior Vice President, Global Sales and Services forthe Europe, Middle East and Africa Region from July 2006 to July 2007. Prior to Sun, Mr. Ryan was a Consultant Executiveand served as Chairman of three technology companies: Elateral Limited, an e-solution for marketing companies, from January2003 to June 2006, Wesupply, a supply chain management company, from June 2003 to June 2006, and CopperEye Ltd., anenterprise data management solutions company, from December 2004 to September 2007. Previously, he served as President,Europe for Aspect Development, and had several leadership positions at IBM.
Mr. Splain has served as Executive Vice President, Microelectronics since April 2008, as Chief Engineer since January 2007and Chief Technology Officer, Systems Group since June 2006. From March 2004 to June 2006, Mr. Splain served as Chief
10

Technology Officer, Scalable Systems. From June 2002 to June 2004, Mr. Splain served as Chief Technology Officer, ProcessorProducts.
FORWARD-LOOKING STATEMENTS
This annual report, including the foregoing sections and “Management’s Discussion and Analysis of Financial Condition andResults of Operations,” contains forward-looking statements, particularly statements regarding: our vision and business strategy;future investments in companies, products and technologies; our expectation of competitive pressures; our solution-based salesapproach; our commitment to standards-based designs and implementations; our expectations regarding R&D investment; theestimated sublease income to be generated from sublease contracts not yet negotiated; our expectations with respect toworkforce and facility-related expenses; our expectation that the resolution of pending claims and legal proceedings will nothave a material adverse effect on us; our estimates of the impact of foreign currency exchange rates; our expectations ofaggregate selling, general and administrative and research and development expenses during fiscal 2009; our expectationsregarding our cash flow from operations for the fiscal year ending June 30, 2009; our products gross margins expectations forthe fiscal 2009 period; our expectations of severance and benefit costs and restructuring charges under our restructuring plans;our estimated contractual obligations at June 30, 2008; our expectations with respect to the effects of accountingpronouncements on our consolidated financial statements; and our belief that the liquidity provided by existing cash, cashequivalents, marketable debt securities and cash generated from operations will provide sufficient capital to meet ourrequirements for at least the next 12 months.
These forward-looking statements involve risks and uncertainties and the cautionary statements set forth above and thosecontained in the section of this report entitled “Risk Factors” identify important factors that could cause actual results to differmaterially from those predicted in any such forward-looking statements.
ITEM 1A. RISK FACTORS
If we are unable to compete effectively with existing or new competitors, the loss of our competitive position could result inprice reductions, fewer customer orders, reduced revenues, reduced margins, reduced levels of profitability and loss of marketshare.
We compete in the computer systems (hardware and software) and storage (hardware and software) products and servicesmarkets. These markets are intensely competitive. If we fail to compete successfully in these markets, the demand for ourproducts and services would decrease. Any reduction in demand could lead to fewer customer orders, reduced revenues, pricingpressures, reduced margins, reduced levels of profitability and loss of market share. These competitive pressures couldmaterially and adversely affect our business and operating results.
Our competitors are some of the largest, most successful companies in the world. They include IBM, Dell, HP, EMC, Fujitsu,HDS, the Fujitsu-Siemens joint venture, Microsoft, Oracle and Intel. We compete with (i) systems manufacturers and resellersof systems based on microprocessors from Intel, the Windows family of operating systems software from Microsoft and theLinux family of operating systems software from Red Hat and others, as well as (ii) companies that focus on providing supportand maintenance services for computer systems and storage products. A substantial majority of our computer systems productsare based on our SPARC platform, which has a significantly smaller installed base than the Windows and Linux platforms.Certain of these competitors compete aggressively on price, as well as based on their platform, and seek to maintain very lowcost structures. Some of these competitors are seeking to increase their market share, which creates increased pressure,including pricing pressure, on our product lines and service offerings. In particular, we are seeing increased competition andpricing pressures from competitors offering systems running Linux software and other open source software, as well ascompetitors offering support services. Additionally, some of these competitors are able to compete with us by using softwarepricing strategies that make it more expensive for their customers to use our hardware. Certain of our competitors, includingIBM and HP, have financial and human resources that are substantially greater than ours, which increases the competitivepressures we face. These competitors also have significant installed bases, and it can be very difficult to win a new customerthat has made significant investments in a competitor’s platform.
Customers make buying decisions based on many factors, including among other things, new product and service offerings andfeatures; product performance and quality; availability and quality of support and other services; price; platform;interoperability with hardware and software of other vendors; quality; reliability, security features and availability of products;breadth of product line; ease of doing business; a vendor’s ability to adapt to customers’ changing requirements; responsivenessto shifts in the marketplace; business model (e.g., utility computing, subscription-based software usage, consolidation versusoutsourcing); contractual terms and conditions; vendor reputation and vendor viability. As competition increases, each factor onwhich we compete becomes more important and the lack of competitive advantage with respect to one or more of these factorscould lead to a loss of competitive position, resulting in fewer customer orders, reduced revenues, reduced margins, reducedlevels of profitability and loss of market share. We expect competitive pressure to remain intense.
11
Fujitsu and its subsidiaries have, for many years, been key strategic channel partners with us, distributing substantial quantitiesof our products throughout the world. We entered into a number of agreements with Fujitsu intended to substantially increasethe scope of our relationship with them, including through collaborative selling efforts and joint development and marketing ofserver products known as the Advanced Product Line (APL). The first group of APL server products was released in April 2007and branded as the SPARC Enterprise line of servers. Enhanced versions of the SPARC Enterprise M4000, M5000, M8000 andM9000 servers, with new quad-core SPARC64 VII processor technology, were released in July 2008. However, Fujitsu is also acompetitor of ours and, as a licensee of various technologies from us and others, it has developed products that currentlycompete directly with our products.
Over the last several years, we have invested significantly in our Storage products business, including through the acquisition ofStorageTek, with a view to increasing the sales of these products both on a stand-alone basis to customers using the systems ofour competitors, and as part of the systems that we sell. The Storage products business is intensely competitive. EMC iscurrently a leader in the storage products market and our primary competitor.
We are continuing the implementation of a solution-based selling approach. While we believe that strategy will enable us toincrease our revenues and margins, there can be no assurance that we will be successful in this approach. In fact, ourimplementation of this selling model may result in reductions in our revenues and/or margins, particularly in the short term, aswe compete to attract business. In addition, because of our emphasis on solution-based sales, we face strong competition fromsystems integrators such as IBM, Fujitsu-Siemens and HP. Our inability to successfully implement this model could have amaterial adverse impact on our revenues and margins.
The products we make are very complex. If we are unable to rapidly and successfully develop and introduce new products andmanage our inventory, we will not be able to satisfy customer demand.
We operate in a highly competitive, quickly changing environment, and our future success depends on our ability to developand introduce new products that our customers choose to buy. If we are unable to develop new products, our business andoperating results could be adversely affected. We must quickly develop, introduce, and deliver in quantity new, complexsystems, software and hardware products and components. These include products that incorporate certain UltraSPARCmicroprocessors and the Solaris Operating System, the Java platform, Sun Java™ System portfolio and Sun N1™ Grid™architecture, among others. The development process for these complicated products is very uncertain. It requires high levels ofinnovation from both our product designers and the suppliers of the components used in our products. The development processis also lengthy and costly. If we fail to accurately anticipate our customers’ needs and technological trends, or are otherwiseunable to complete the development of a product on a timely basis, we will be unable to introduce new products into the marketon a timely basis, if at all, and our business and operating results would be materially and adversely affected.
The manufacture and introduction of our new products is also a complicated process. Once we have developed a new product,we face several challenges in the manufacturing process. We must be able to manufacture new products in sufficient volumes sothat we can have an adequate supply of new products to meet customer demand. We must also be able to manufacture the newproducts at acceptable costs. This requires us to be able to accurately forecast customer demand so that we can procure theappropriate components at optimal costs. Forecasting demand requires us to predict order volumes, the correct mix of ourproducts and the correct configurations of these products. We must manage new product introductions and transitions tominimize the impact of customer-delayed purchases of existing products in anticipation of new product releases. We must alsotry to reduce the levels of older product and component inventories to minimize inventory write-offs. If we have excessinventory, it may be necessary to reduce our prices or write down inventory, which could result in lower gross margins.Additionally, our customers may delay orders for existing products in anticipation of new product introductions. As a result, wemay decide to adjust prices of our existing products during this process to try to increase customer demand for these products.Our future operating results would be materially and adversely affected if such pricing adjustments were to occur and we wereunable to mitigate the resulting margin pressure by maintaining a favorable mix of systems, software, service and otherproducts, or if we were unsuccessful in achieving component cost reductions, operating efficiencies and increasing salesvolumes.
If we are unable to timely develop, manufacture and introduce new products in sufficient quantity to meet customer demand atacceptable costs, or if we are unable to correctly anticipate customer demand for our new and existing products, our businessand operating results could be materially adversely affected.
12

We expect our quarterly revenues, cash flows and operating results to fluctuate for a number of reasons.
Future operating results and cash flows will continue to be subject to quarterly fluctuations based on a wide variety of factors,including:
Seasonality. Although our sales and other operating results can be influenced by a number of factors and historical results arenot necessarily indicative of future results, our sequential quarterly operating results generally fluctuate downward in the firstand third quarters of each fiscal year when compared with the immediately preceding quarter.
Linearity. Our quarterly sales have historically reflected a pattern in which a disproportionate percentage of each quarter’stotal revenues occur in the last month of the quarter. This pattern can make prediction of revenues, earnings and working capitalfor each financial period difficult and uncertain and increase the risk of unanticipated variations in quarterly results andfinancial condition.
Foreign Currency Fluctuations. As a large portion of our business takes place outside of the U.S., we enter into transactions inother currencies. Although we employ various hedging strategies, we are exposed to changes in exchange rates, which couldcause fluctuations in our quarterly operating results.
Deferred Tax Assets. Estimates and judgments are required in the calculation of certain tax liabilities and in the determinationof the recoverability of certain of the deferred tax assets, which arise from net operating losses, tax credit carryforwards andtemporary differences between the tax and financial statement recognition of revenue and expense. SFAS 109, “Accounting forIncome Taxes,” also requires that the deferred tax assets be reduced by a valuation allowance, if based on the weight ofavailable evidence, it is more likely than not that some portion or all of the recorded deferred tax assets will not be realized infuture periods.
In evaluating our ability to recover our deferred tax assets, in full or in part, we consider all available positive and negativeevidence including our past operating results, the existence of cumulative losses in the most recent fiscal years and our forecastof future taxable income on a jurisdiction by jurisdiction basis. In determining future taxable income, we are responsible for theassumptions utilized including the amount of state, federal and international pre-tax operating income, the reversal of temporarydifferences and the implementation of feasible and prudent tax planning strategies. These assumptions require significantjudgment about the forecasts of future taxable income and are consistent with the plans and estimates we are using to managethe underlying businesses. Cumulative losses incurred in the U.S. and certain foreign jurisdictions in recent years andinsufficient forecasted future taxable income in certain other foreign jurisdictions represented sufficient negative evidence torequire full and partial valuation allowances in these jurisdictions. We have established a valuation allowance against thedeferred tax assets in these jurisdictions, which will remain until sufficient positive evidence exists to support reversal. Futurereversals or increases to our valuation allowance could have a significant impact on our future earnings.
Goodwill and Other Intangible Assets. We perform an analysis on our goodwill balances to test for impairment on an annualbasis or whenever events occur that may indicate impairment possibly exists. Goodwill is deemed to be impaired if the net bookvalue of the reporting unit exceeds the estimated fair value. The impairment of a long-lived intangible asset other than goodwillis only deemed to have occurred if the sum of the forecasted undiscounted future cash flows related to the asset are less than thecarrying value of the intangible asset we are testing for impairment. If the forecasted cash flows are less than the carrying value,then we must write down the carrying value to its estimated fair value. We recognized an impairment charge of $70 millionrelated to acquired intangible assets during the fourth quarter of fiscal 2006. As of June 30, 2008, we had a goodwill balance of$3,215 million. Going forward, we will continue to review our goodwill and other intangible assets for possible impairment.Any additional impairment charges could adversely affect our future earnings. Goodwill impairment analysis and measurementis a process that requires significant judgment. A decline in our stock price and resulting market capitalization (such as thedecline which occurred subsequent to April 2008), could result in impairment of a material amount of our $3,215 milliongoodwill balance if we determine that the decline is sustained and has reduced the fair value of any of our reporting units belowits carrying value. We cannot be certain that a future downturn in our business, changes in market conditions or a longer-termdecline in the quoted market price of our stock will not result in an impairment of goodwill and the recognition of resultingexpenses in future periods, which could adversely affect our results of operations for those periods.
We are dependent on significant customers, specific industries and geographies.
Sales to Avnet, the largest distributor of our products, accounted for approximately 11% of our net revenues in each of fiscal2008, 2007 and 2006. In January 2007, Access Distribution, the largest distributor of our products at the time, was sold to Avnetby General Electric Company. Avnet was StorageTek’s largest distributor and became a distributor of our products after ouracquisition of StorageTek in August 2005. The net revenue percentages for fiscal 2007 and 2006 represent sales to Avnet andAccess Distribution on a combined basis. No other customer accounted for more than 10% of our net revenues in fiscal 2008. Ifour distribution arrangement with Avnet significantly deteriorates or is terminated, and we are unable to find another distributorfor our products on similar financial terms, our future operating results could be adversely affected.
13
We depend on the telecommunications, financial services and government sectors for a significant portion of our revenues. Ourrevenues are dependent on the level of technology capital spending in the U.S. and international economies. If capital spendingdeclines in these industries over an extended period of time, our business will continue to be materially and adversely affected.We continue to execute on our strategy to reduce our dependence on these industries by expanding our product reach into newindustries, but no assurance can be given that this strategy will be successful.
Weakening economic conditions in specific geographic areas, particularly the U.S. or Europe, can also adversely affect ouroperating results. For example, the direction and relative strength of the U.S. economy has recently been increasingly uncertaindue to rising oil prices, difficulties in the financial services sector, softness in the housing markets and geopolitical uncertainties.If economic growth in the U.S. is slowed, many customers may delay or reduce technology capital spending which would likelyhave an adverse affect on our operating results.
We derive significant revenues from the sales of our higher end server products and decreased demand for these products couldadversely affect our revenues and gross margins.
We derive significant revenues from the sales of our higher end server products. These products are offered at higher pricepoints and may provide us with higher gross margin percentages than our entry-level products. If demand for our higher endserver products declines, this could adversely affect our revenues, gross margins and earnings.
We have licensed significant elements of our intellectual property, including our Solaris Operating System and Java technology,as open source software and intend to license additional intellectual property in the future under open source licenses, whichcould reduce the competitive advantage we derive from this intellectual property.
We have released significant elements of our intellectual property, including the Solaris Operating System, the Java EnterpriseSystem infrastructure software platform, MySQL database technology, the Sun N1 Grid Engine software and various developertools, to the open source development community as open source software under an open source license and have made thehardware source code of our UltraSPARC T1 and T2 processors available under an open source license. We have also releasedour Java Platform, Standard Edition (Java SE), Enterprise Edition (Java EE) and Micro Edition (Java ME) technologies under anopen source license. Although open source licensing models vary, generally open source software licenses permit the liberalcopying, modification and distribution of a software program allowing a diverse programming community to contribute to thesoftware. As a result of such release, there could be an impact on revenue related to this intellectual property and we may nolonger be able to exercise control over some aspects of the future development of this intellectual property. In particular, thefeature set and functionality of the Solaris Operating System may diverge from those that best serve our strategic objectives,move in directions in which we do not have competitive expertise or fork into multiple, potentially incompatible variations. Wecurrently derive a significant competitive advantage from our development, licensing and sale of the Solaris Operating System,Java and MySQL technologies, and system products based on the UltraSPARC family of microprocessors, and any of theseevents could reduce our competitive advantage or impact market demand for our products, software and services. In addition,disclosing the content of our source code could limit the intellectual property protection we can obtain or maintain for thatsource code or the products containing that source code and could facilitate intellectual property infringement claims against us.Finally, there can be no assurance that making our intellectual property freely available will yield incremental revenue to us.
Delays in product development or customer acceptance and implementation of new products and technologies could seriouslyharm our business.
Generally, the computer systems we sell to customers incorporate various hardware and software products that we sell, such asUltraSPARC microprocessors, various software elements, from the Solaris Operating System to the Java platform, Sun JavaSystem portfolio, Sun N1 Grid Engine , the Sun StorageTek SL8500 modular library system and Sun StorEdge™ arrayproducts. Any delay in the development, delivery or acceptance of key elements of the hardware or software included in oursystems could delay our shipment of these systems. Delays in the development and introduction of our products may occur forvarious reasons.
In addition, if customers decided to delay the adoption and implementation of new releases of our Solaris Operating System,this could also delay customer acceptance of new hardware products tied to that release. Implementing a new release of anoperating environment requires a great deal of time and money for a customer to convert its systems to the new release. Thecustomer must also work with software vendors who port their software applications to the new operating system and make surethese applications will run on the new operating system. As a result, customers may decide to delay their adoption of a newrelease of an operating system because of the cost of a new system and the effort involved to implement it. Such delays inproduct development and customer acceptance and implementation of new products could materially and adversely affect ourbusiness.
14

We maintain higher research and development costs, as a percentage of total net revenues, than many of our competitors andour earnings are dependent upon maintaining revenues and gross margins at a sufficient level to offset these costs.
One of our business strategies is to derive a competitive advantage and a resulting enhancement of our gross margins from ourinvestment in innovative new technologies which customers value. As a result, as a percentage of total net revenues, we incurhigher fixed R&D costs than many of our competitors. To the extent that we are unable to develop and sell products withattractive gross margins in sufficient volumes, our earnings may be materially and adversely affected by our cost structure. Wecontinue to add new products to our entry-level server product line that are offered at a lower price point and that may provideus with a lower gross margin percentage than our products as a whole. Although our strategy is to sell these products as part ofoverall systems that include other products with higher gross margin percentages, to the extent that the mix of our overallrevenues represented by sales of lower gross margin products increases, our gross margins and earnings may be materially andadversely affected.
We are currently implementing a new enterprise resource planning system, and problems with the design or implementation ofthis system could interfere with our business and operations.
We are in the process of implementing a project to consolidate all of our database infrastructure to a single global enterpriseresource planning (ERP) system. We have invested, and will continue to invest, significant capital and human resources in thedesign and implementation of the ERP system, which may be disruptive to our underlying business. Any disruptions, delays ordeficiencies in the design and implementation of the new ERP system, particularly any disruptions, delays or deficiencies thatimpact our operations, could adversely affect our ability to process customer orders, ship products, provide services and supportto our customers, bill and track our customers, fulfill contractual obligations, file SEC reports in a timely manner and otherwiserun our business. Further, as we are dependent upon our ability to gather and promptly transmit accurate information to keydecision makers, our business, results of operations and financial condition may be materially and adversely affected if ourdatabase infrastructure does not allow us to transmit accurate information, even for a short period of time. Even if we do notencounter these adverse effects, the design and implementation of the new ERP system may be much more costly than weanticipated. If we are unable to successfully design and implement the new ERP system as planned, our financial position,results of operations and cash flows could be negatively impacted.
We have experienced a number of challenges during the implementation of this project that have caused delays and affected ouroperations. Although these disruptions have not materially affected our financial results, further disruptions caused by theimplementation of the new ERP system could have a material adverse effect on our financial position, results of operations andcash flows.
Our acquisition, divestiture and alliance activities could disrupt our ongoing business and subject us to significant risks.
We expect to continue to make investments in companies, products and technologies, either through acquisitions or investmentsor alliances. For example, we have purchased several companies in the past, including MySQL and StorageTek, and have alsoformed alliances, such as our strategic relationship with Fujitsu for the development, manufacturing and marketing of serverproducts and our OEM relationship with Hitachi Data Systems for the collaboration on, and delivery of, a broad range of storageproducts and services. We also rely on IT services partners and independent software developers to enhance the value to ourcustomers of our products and services. Acquisitions and alliance activities often involve risks, including: (1) difficulty inassimilating the acquired operations and employees; (2) difficulty in managing product co-development activities with ouralliance partners; (3) retaining the key employees of the acquired operation; (4) disruption of our or the acquired company’songoing business; (5) inability to successfully integrate the acquired technology and operations into our business and maintainuniform standards, controls, policies and procedures; and (6) lacking the experience to enter into new product or technologymarkets.
From time to time, we evaluate our products and service offerings and may adjust our strategic priorities by reducing investmentin or divesting certain business operations. Decisions to eliminate or divest certain business operations may involve a number ofrisks, including the diversion of management’s attention, significant costs and expenses, the assumption of contractualobligations, realization of losses, facility consolidation, the loss or disruption of customer relationships, the loss of employees,the elimination of revenues along with associated costs and the disruption of operations in the affected business or relatedbusinesses, any of which could cause our operating results to decline and may fail to yield the expected benefits.
Our reliance on single source suppliers could delay product shipments and increase our costs.
Most of our products and components are manufactured in whole or in part by third-party manufacturers. Further, there aresome components that can only be purchased from a single vendor due to price, quality, technology or other businessconstraints. For example, we currently depend on Texas Instruments for the manufacture of our existing UltraSPARC
15

microprocessors, Imation for tape media used in certain tape storage products and several other companies for custom integratedcircuits. If we were unable to purchase any of these items from the respective single vendors on acceptable terms or experiencedsignificant delays or quality issues in the delivery of necessary parts and/or components from a particular vendor and we had tofind a new supplier for these parts and components, our new and existing product shipments could be delayed which could havea material adverse effect on our business, results of operations and financial condition.
Our future operating results depend on our ability to purchase a sufficient amount of components to meet the demands of ourcustomers.
We depend heavily on our suppliers to design, develop, manufacture, and deliver on a timely basis the necessary componentsfor our products. While many of the components we purchase are standard, we do purchase some components (standard orotherwise), including color monitors, custom power supplies, application specific integrated circuits (ASICs) and custommemory and graphics devices, that require long lead times to manufacture and deliver. Long lead times make it difficult for usto plan and procure appropriate component inventory levels to meet the customer demand for our products. In addition, in thepast, we have experienced shortages in certain of our components (including, ASICs, dynamic random access memories(DRAMs) and static random access memories (SRAMs)). If a component delivery from a supplier is delayed, if we experience ashortage in one or more components, or if we are unable to provide for adequate levels of component inventory, our new andexisting product shipments could be delayed and our business and operating results could be materially and adversely affected.
Because we may order components from suppliers in advance of receipt of customer orders for our products that include thesecomponents, we could face a material inventory risk.
As part of our component planning, we place orders with or pay certain suppliers for components in advance of receipt ofcustomer orders. We occasionally negotiate supply commitments with vendors early in the manufacturing process of ourmicroprocessors to make sure we have enough of these components for our products to meet anticipated customer demand.Because the design and manufacturing process for these components is very complicated it is possible that we could experiencea design or manufacturing flaw that could delay or even prevent the production of the components for which we have previouslycommitted to pay or need to fulfill orders from customers. We also face the risk of ordering too many components, orconversely, not enough components, since supply orders are generally based on forecasts of customer orders rather than actualcustomer orders. In addition, in some cases, we make non-cancelable order commitments to our suppliers for work-in-progress,supplier’s finished goods, custom sub-assemblies and Sun unique raw materials that are necessary to meet our lead times forfinished goods. If we cannot change or be released from supply orders, we could incur costs from the purchase of unusablecomponents, either due to a delay in the production of the components or other supplies or as a result of inaccurately predictingsupply orders in advance of customer orders. Our business and operating results could be materially and adversely affected as aresult of these increased costs.
Our products may have quality issues that could adversely affect our sales and reputation.
In the course of conducting our business, we experience and address quality issues. Some of our hardware and software productscontain defects, including defects in our engineering, design and manufacturing processes, as well as defects in third-partycomponents included in our products, which may be beyond our control. Often defects are identified during our design,development and manufacturing processes and we are able to correct many of these. Sometimes defects are identified afterintroduction and shipment of new products or enhancements to existing products.
When a quality issue is identified, we work extensively with our customers (and our suppliers) to remedy such issues. We maytest the affected product to determine the root cause of the problem and to determine appropriate solutions. We may find anappropriate solution (often called a “patch”) or offer a temporary fix while a permanent solution is being determined. If we areunable to determine the root cause, find an appropriate solution or offer a temporary fix, we may delay shipment to customers.We may, however, ship products while we continue to explore a suitable solution if we believe the defect is not significant tothe product’s functionality. Defects in our products can harm our reputation, delay or prevent sales, result in significant expenseand could materially and adversely affect our business.
Our international customers and operations subject us to a number of risks.
Currently, more than half of our revenues come from international sales. In addition, a portion of our operations consists ofmanufacturing and sales activities outside of the U.S. Our ability to sell our products and conduct our operations internationallyis subject to a number of risks. Local economic, political and labor conditions in each country could adversely affect demand forour products and services or disrupt our operations in these markets. We may also experience reduced intellectual propertyprotection or longer and more challenging collection cycles as a result of different customary business practices in certain
16
countries where we do business which could have a material adverse effect on our business operations and financial results.Currency fluctuations could also materially and adversely affect our business in a number of ways. Although we take steps toreduce or eliminate certain foreign currency exposures that can be identified or quantified, we may incur currency translationlosses as a result of our international operations. Further, in the event that currency fluctuations cause our products to becomemore expensive in overseas markets in local currencies, there could be a reduction in demand for our products or we couldlower our pricing in some or all of these markets resulting in reduced revenue and margins. Alternatively, a weakening dollarcould result in greater costs to us for our overseas operations. Changes to and compliance with a variety of foreign laws andregulations may increase our cost of doing business in these jurisdictions. Trade protection measures and import and exportlicensing requirements subject us to additional regulation and may prevent us from shipping products to a particular market, andincrease our operating costs. In addition, we could be subject to regulations, fines and penalties for violations of import andexport regulations. Although we implement policies and procedures designed to ensure compliance with these laws, there can beno assurance that all of our employees, contractors and agents, as well as those companies to which we outsource certain of ourbusiness operations, including those based in or from countries where practices which violate such United States laws may becustomary, will not take actions in violation of our policies. These violations could result in penalties, including prohibiting usfrom exporting our products to one or more countries, and could materially and adversely affect our business.
Local laws and customs in many countries differ significantly from those in the U.S. We incur additional legal compliance costsassociated with our international operations and could become subject to legal penalties in foreign countries if we do not complywith local laws and regulations, which may be substantially different from those in the United States. In many foreign countries,particularly in those with developing economies, it is common for local business people to engage in business practices thatviolate their local laws and that are prohibited by United States laws applicable to us such as the Foreign Corrupt Practices Act.We have implemented policies, training, internal controls and procedures designed to ensure compliance with these laws.However, there can be no assurance that all of our employees, contractors and agents, as well as our resellers and thosecompanies to which we outsource certain of our business operations, will not engage in actions which violate local or U.S. lawor our policies. Any such violation, even if prohibited by our policies, could have a material adverse effect on our business.
We have entered into, and intend to enter into several additional, joint ventures with distribution partners with the goal ofincreasing sales of our products and services in selected geographic markets. We have implemented policies, internal controlsand procedures designed to ensure the joint venture partners and joint venture companies comply with our policies and relevantlaws. However, entering into a joint venture subjects us to additional compliance and legal risks related to the actions of thejoint venture partner and the joint venture company.
Our business may be adversely affected if our competitors acquire or enter into exclusive arrangements with companies withwhom we do business or may do business in the future.
From time to time, our competitors may acquire or enter into exclusive arrangements with companies with whom we dobusiness or may do business in the future. Reductions in the number of partners with whom we may do business in a particularcontext may reduce our ability to enter into critical alliances on attractive terms or at all, and the termination of an existingrelationship or alliance by a business partner may disrupt our operations. As an example, HP recently acquired Electronic DataSystems Corporation (EDS), one of our customers, which may have the effect of reducing our business with EDS.
We face numerous risks associated with our strategic alliance with Fujitsu.
We have entered into a number of agreements with Fujitsu with respect to collaborative sales and marketing efforts and the jointdevelopment and manufacturing of server products known as the Advanced Product Line. The first group of APL serverproducts was released in April 2007 and branded as the Sun SPARC Enterprise line of servers. Enhanced versions of theSPARC Enterprise M4000, M5000, M8000 and M9000 servers, with new quad-core SPARC64 VII processor technology, werereleased in July 2008. The APL server products are intended to eventually replace a portion of our server product portfolio. Inaddition, the agreements contemplate that Sun and Fujitsu dedicate substantial financial and human resources to thisrelationship. As a result, our future performance and financial condition may be impacted by the success or failure of thisrelationship.
Joint development and marketing of a complex new product line is an inherently difficult undertaking and is subject tonumerous risks. If we fail to satisfy certain development or supply obligations under the agreements, or if we otherwise violatethe terms of the agreements, we may be subject to significant contractual or legal penalties. Further, if Fujitsu encounters any ofa number of potential problems in its business, such as intellectual property infringement claims, supply difficulties, ordifficulties in meeting development milestones or financial challenges, these problems could impact our strategic relationshipwith them and could result in a material adverse effect on our business or results of operations. There can be no assurance thatour strategic relationship with Fujitsu will be successful or that the economic terms of the agreements establishing the
17

relationship will ultimately prove to be favorable to us. If any of these risks come to pass, they may have a material adverseeffect on our business, results of operations or financial condition.
We are dependent on third parties for certain key business process functions such as IT services and the human resourcefunction and for the provision of certain key manufacturing activities.
We continuously seek to make our cost structure more efficient and focus on our core strengths. We continue to develop andimplement our global resourcing strategy and operating model, which includes activities that are focused on increasingworkforce flexibility and scalability, and improving overall competitiveness by leveraging external talent and skills worldwide.We rely on partners or third party service providers for the provision of certain key business process functions, including ITservices and the human resources function, and as a result, we may incur increased business continuity risks. We may no longerbe able to exercise control over some aspects of the future development, support or maintenance of outsourced operations andprocesses, including the internal controls associated with those outsourced business operations and processes, which couldadversely affect our business. If we are unable to effectively utilize or integrate and interoperate with external resources or if ourpartners or third party service providers experience business difficulties or are unable to provide business process services asanticipated, we may need to seek alternative service providers or resume providing these business processes internally, whichcould be costly and time consuming and have a material adverse effect on our operating and financial results.
We also rely on partners for the provision of key manufacturing activities. Texas Instruments indicated publicly that it will notbe making UltraSPARC microprocessors for us on a foundry basis at the 45-nm node. Consequently, we are reviewingalternative foundry solutions, and are transitioning the 45/40-nm node and any subsequent nodes for foundry operations andsupply chain to other potential vendors. If we are unable to effectively execute the transition, we may experience difficulty indelivering our 45/40-nm next generation microelectronics products and technologies, which could materially and adverselyaffect our business.
We are dependent upon our channel partners for a significant portion of our revenues.
Our channel partners include distributors, OEMs, independent software vendors, system integrators, service providers andresellers. We continue to see an increase in revenues via our reseller channel. We face ongoing business risks due to our relianceon our channel partners to maintain customer relationships and create customer demand with customers where we have a limitedor no direct relationship, including with respect to our government business. Should our relationships with our channel partnersor their effectiveness decline, we face risk of declining demand, which could affect our results of operations.
Adverse resolution of litigation may harm our operating results or financial condition.
We are a party to lawsuits in the normal course of our business. Litigation can be expensive, lengthy and disruptive to normalbusiness operations. Moreover, the results of complex legal proceedings are difficult to predict. An unfavorable resolution of aparticular lawsuit could have a material adverse effect on our business, operating results, or financial condition. We arecurrently involved in litigation with the General Services Administration (GSA). Additional information is provided in Note 11to the Consolidated Financial Statements in Item 8.
Our business may suffer if it is alleged or found that we have infringed the intellectual property rights of others.
From time to time we have been notified that we may be infringing certain patents or other intellectual property rights of others.Responding to such claims, regardless of their merit, can be time consuming, result in costly litigation, divert management’sattention and resources and cause us to incur significant expenses. There are often several pending claims in various stages ofevaluation at any particular time. From time to time, we consider the desirability of entering into licensing agreements in certainof these claims. The action we take with respect to such claims varies depending on our assessment of the nature of theparticular claim. When we believe there is a substantial likelihood that one of our products, component parts, or activities mayinfringe a valid intellectual property right of another party, there are several steps we may take to address such possibleinfringement, including securing alternative non-infringing products, designing our products or activities such that they do notinfringe, or seeking a license on commercially reasonable terms. No assurance can be given that such efforts to remediate anyinfringement will be successful or that licenses can be obtained on acceptable terms or that litigation will not occur. In the eventthere is a temporary or permanent injunction entered prohibiting us from marketing or selling certain of our products, or asuccessful claim of infringement against us requiring us to pay royalties to a third party, and we fail to license such technologyon acceptable terms and conditions or to develop or license a substitute technology, our business, results of operations orfinancial condition could be materially adversely affected.
18

Income tax laws and regulations subject us to a number of risks and could result in significant liabilities and costs.
As a multinational corporation, we are subject to income taxes in the U.S. and various foreign jurisdictions. Our domestic andforeign tax liabilities are subject to the allocation of revenues and expenses in different jurisdictions. Additionally, the amountof income taxes paid is subject to our interpretation of applicable tax laws in the jurisdictions in which we operate. We areregularly subject to audits by tax authorities. While we endeavor to comply with all applicable income tax laws, there can be noassurance that a governing tax authority will not have a different interpretation of the law than we do or that we will comply inall respects with applicable tax laws, which could result in additional taxes. We regularly review the likelihood of adverseoutcomes resulting from tax audits to determine if additional income taxes, penalties and interest would be assessed. There canbe no assurance that the outcomes from these audits will not have an adverse effect on our results of operations in the period inwhich the review is conducted.
Credit rating downgrades could adversely affect our business and financial condition.
Three credit rating agencies follow us. Fitch Ratings has rated us BBB-, which is an investment grade rating. Moody’s InvestorServices and Standard & Poor’s have assigned us non-investment grade ratings of Ba1 and BB+, respectively. Fitch Ratings andStandard & Poor’s have placed us on stable outlook. Moody’s Investor Services recently changed its outlook from stable tonegative. These ratings reflect those credit agencies’ expectations regarding our financial and competitive condition. If we aredowngraded by these ratings agencies, it could increase our costs of obtaining, or make it more difficult to obtain or issue, newdebt financing. Any of these events could materially and adversely affect our business and financial condition.
We depend on key employees and face competition in hiring and retaining qualified employees.
Our employees are vital to our success, and our key management, engineering and other employees are difficult to replace. Wegenerally do not have employment contracts with our key employees. Further, we do not maintain key person life insurance onany of our employees. Because our compensation packages include equity-based incentives, pressure on our stock price couldaffect our ability to offer competitive compensation packages to current employees. In addition, we must continue to motivateemployees and keep them focused on our strategies and goals, which may be difficult due to morale challenges posed by ourworkforce reductions, global resourcing strategies and related uncertainties. Should these conditions continue, we may not beable to retain highly qualified employees in the future, which could adversely affect our business.
Our use of a self-insurance program to cover certain claims for losses suffered and costs or expenses incurred could negativelyimpact our business upon the occurrence of an uninsured event.
We maintain a program of insurance with third-party insurers for certain property, casualty and other risks. The policies aresubject to deductibles and exclusions that result in our retention of a level of risk on a self-insurance basis. We retain risk withregard to certain loss events, such as California earthquakes, the indemnification or defense payments we may make to or onbehalf of our directors and officers as a result of obligations under applicable agreements, our by-laws and applicable law andfor potential liabilities that are not insured, and we sponsor a number of health and welfare insurance plans for our employees.The types and amounts of insurance obtained vary from time to time and from location to location, depending on availability,cost and our decisions with respect to risk retention. In the event that the frequency of losses experienced by us increasedunexpectedly, the aggregate of such losses could materially increase our liability and adversely affect our financial condition,liquidity, cash flows and results of operations. In addition, because the insurance market continues to limit the availability ofcertain insurance products and because the costs of certain products continue to increase, we will continue to evaluate the typesand magnitudes of claims we include in our self-insurance program. Additions and changes to this self insurance program mayincrease our risk exposure and therefore increase the risk of a material adverse effect on our financial condition, liquidity, cashflows and results of operations. In addition, we have made certain judgments as to the limits on our existing insurance coveragethat we believe are in line with industry standards, as well as in light of economic and product availability considerations.Unforeseen catastrophic loss scenarios could prove our limits to be inadequate, and losses incurred in connection with theknown claims we self-insure could be substantial. Either of these circumstances could materially adversely affect our financialand business condition.
Business interruptions could adversely affect our business.
Our operations and those of our suppliers are vulnerable to interruption by fire, earthquake, power loss, telecommunicationsfailure, terrorist attacks and other events beyond our control. A substantial portion of our facilities, including our corporateheadquarters and other critical business operations, are located near major earthquake faults. In addition, some of our facilitiesare located on filled land and, therefore, may be more susceptible to damage if an earthquake occurs. We generally do not carryearthquake insurance for direct earthquake-related losses. In addition, we do not carry business interruption insurance for, nordo we carry financial reserves against, business interruptions arising from earthquakes or certain other events. If a businessinterruption occurs, our business could be materially and adversely affected.
19

Our failure to comply with contractual obligations may result in significant penalties.
We offer terms to some of our distributors and other customers that, in some cases, include complex provisions for pricing, dataprotection and other terms. In connection with these contracts, we are in some cases required to allow the customer to auditcertain of our records to verify compliance with these terms. In particular, government agency customers audit and investigategovernment contractors, including us. These agencies review our performance under the applicable contracts as well ascompliance with applicable laws, regulations and standards. The government also may review the adequacy of, and ourcompliance with, contractual obligations, our internal control systems and policies, including our purchasing, property,estimating, compensation, management information systems and data protection requirements. If an audit uncovers improper orillegal activities, we may be subject to claims for damages, penalties and other sanctions. With respect to claims by governmentagencies, sanctions may include treble damages, fines and possibly debarment or suspension from sales to the federalgovernment. In addition, we may suffer serious harm to our reputation if allegations of impropriety were made against us. Thefederal government has intervened in a case filed in the United States District Court for the Eastern District of Arkansas allegingthat we violated the Federal False Claims and Anti-Kickback Acts and breached our contracts with the GSA and certain othergovernment customers, among other claims. These claims are based in part on certain audit reports prepared by the GSA Officeof the Inspector General with respect to our prior GSA Multi-Award Schedule. Claims by the federal government pursuant tothe lawsuit or otherwise in the administration of our contracts, and any judgment or settlement related thereto, could expose usto damages, penalties and other sanctions, up to and including debarment or suspension from federal sales, loss of salesopportunities, business interruption and damage to our reputation.
Some of our Restructuring Plans may not result in the anticipated cost saving and benefits.
Since March 2004, our Board of Directors and our management have approved a series of restructuring plans including therestructuring plan announced on May 1, 2008. Our ability to achieve the cost savings and operating efficiencies anticipated bythese restructuring plans is dependent on our ability to effectively implement the workforce and excess capacity reductionscontemplated. If we are unable to implement these initiatives effectively, we may not achieve the level of cost savings andefficiency benefits expected for fiscal 2009 and beyond.
Commercial real estate market conditions could affect our ability to sublease properties in our portfolio.
We implemented facility exit plans in each of the last six fiscal years as part of our ongoing efforts to consolidate excessfacilities. The commercial real estate market conditions in the United States and in many of the countries in which we havesignificant leased properties have resulted in a surplus of business facilities making it difficult to sublease properties. We maybe unable to sublease our excess properties, or we may not meet our expected estimated levels of sublease income, and,accordingly, our results of operations could be materially and adversely affected.
Environmental laws and regulations subject us to a number of risks and could result in significant liabilities and costs.
Some of our operations are subject to state, federal and international laws governing protection of the environment, humanhealth and safety, and regulating the use of certain chemical substances. We endeavor to comply with these environmental laws,yet compliance with such laws could increase our operations and product costs; increase the complexities of product design,development, procurement and manufacture; limit our ability to manage excess and obsolete non-compliant inventory; limit oursales activities; and impact our future financial results. Any violation of these laws can subject us to significant liability,including fines, penalties, and possible prohibition of sales of our products into one or more states or countries, and result in amaterial adverse effect on our financial condition.
Currently, a significant portion of our revenues come from international sales. Recent environmental legislation within theEuropean Union (EU), including the EU Directive on Waste Electrical and Electronic Equipment (WEEE) and the EU Directiveon Restriction of Hazardous Substances (RoHS), as well as China’s regulation on Management Methods for ControllingPollution Caused by Electronic Information Products (“China RoHS”), may increase our cost of doing business internationallyand impact our revenues from EU countries and China as we endeavor to comply with and implement these requirements.
In addition, similar environmental legislation has been or may be enacted in other jurisdictions, including the U.S. (underfederal and state laws), Japan, Canada, Korea and certain Latin American countries, the cumulative impact of which could besignificant. We are committed to offering products that are environmentally responsible and to complying with any current orfuture laws protecting the environment, human health and safety.
Our business may suffer if it is alleged or found that we or our contractors have violated data privacy or confidentialityobligations.
Compliance with a variety of domestic and foreign laws and regulations related to data privacy, as well as various contractualobligations related to confidentiality, increase our cost of doing business. Such obligations include regulations related to the
20
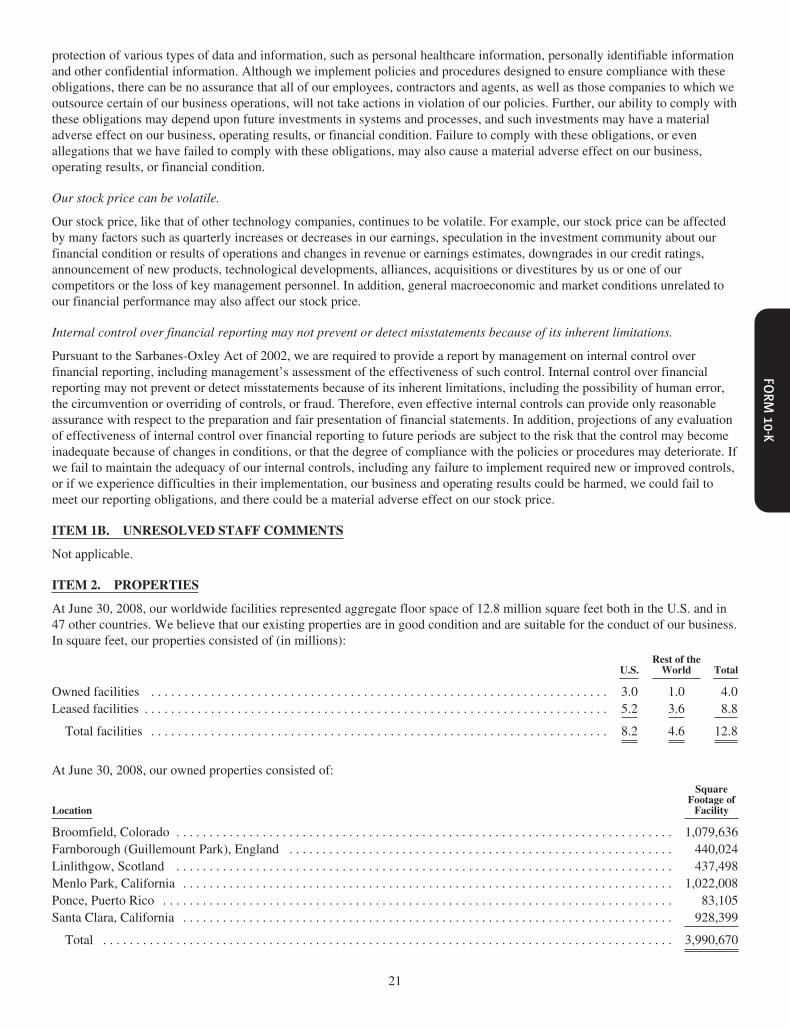
protection of various types of data and information, such as personal healthcare information, personally identifiable informationand other confidential information. Although we implement policies and procedures designed to ensure compliance with theseobligations, there can be no assurance that all of our employees, contractors and agents, as well as those companies to which weoutsource certain of our business operations, will not take actions in violation of our policies. Further, our ability to comply withthese obligations may depend upon future investments in systems and processes, and such investments may have a materialadverse effect on our business, operating results, or financial condition. Failure to comply with these obligations, or evenallegations that we have failed to comply with these obligations, may also cause a material adverse effect on our business,operating results, or financial condition.
Our stock price can be volatile.
Our stock price, like that of other technology companies, continues to be volatile. For example, our stock price can be affectedby many factors such as quarterly increases or decreases in our earnings, speculation in the investment community about ourfinancial condition or results of operations and changes in revenue or earnings estimates, downgrades in our credit ratings,announcement of new products, technological developments, alliances, acquisitions or divestitures by us or one of ourcompetitors or the loss of key management personnel. In addition, general macroeconomic and market conditions unrelated toour financial performance may also affect our stock price.
Internal control over financial reporting may not prevent or detect misstatements because of its inherent limitations.
Pursuant to the Sarbanes-Oxley Act of 2002, we are required to provide a report by management on internal control overfinancial reporting, including management’s assessment of the effectiveness of such control. Internal control over financialreporting may not prevent or detect misstatements because of its inherent limitations, including the possibility of human error,the circumvention or overriding of controls, or fraud. Therefore, even effective internal controls can provide only reasonableassurance with respect to the preparation and fair presentation of financial statements. In addition, projections of any evaluationof effectiveness of internal control over financial reporting to future periods are subject to the risk that the control may becomeinadequate because of changes in conditions, or that the degree of compliance with the policies or procedures may deteriorate. Ifwe fail to maintain the adequacy of our internal controls, including any failure to implement required new or improved controls,or if we experience difficulties in their implementation, our business and operating results could be harmed, we could fail tomeet our reporting obligations, and there could be a material adverse effect on our stock price.
ITEM 1B. UNRESOLVED STAFF COMMENTS
Not applicable.
ITEM 2. PROPERTIES
At June 30, 2008, our worldwide facilities represented aggregate floor space of 12.8 million square feet both in the U.S. and in47 other countries. We believe that our existing properties are in good condition and are suitable for the conduct of our business.In square feet, our properties consisted of (in millions):
U.S.Rest of theWorld Total
Owned facilities . . . . . . . . . . . . . . . . . . . . . . . . . . . . . . . . . . . . . . . . . . . . . . . . . . . . . . . . . . . . . . . . . . . . . 3.0 1.0 4.0Leased facilities . . . . . . . . . . . . . . . . . . . . . . . . . . . . . . . . . . . . . . . . . . . . . . . . . . . . . . . . . . . . . . . . . . . . . . 5.2 3.6 8.8
Total facilities . . . . . . . . . . . . . . . . . . . . . . . . . . . . . . . . . . . . . . . . . . . . . . . . . . . . . . . . . . . . . . . . . . . . . 8.2 4.6 12.8
At June 30, 2008, our owned properties consisted of:
Location
SquareFootage ofFacility
Broomfield, Colorado . . . . . . . . . . . . . . . . . . . . . . . . . . . . . . . . . . . . . . . . . . . . . . . . . . . . . . . . . . . . . . . . . . . . . . . . . . . 1,079,636Farnborough (Guillemount Park), England . . . . . . . . . . . . . . . . . . . . . . . . . . . . . . . . . . . . . . . . . . . . . . . . . . . . . . . . . . 440,024Linlithgow, Scotland . . . . . . . . . . . . . . . . . . . . . . . . . . . . . . . . . . . . . . . . . . . . . . . . . . . . . . . . . . . . . . . . . . . . . . . . . . . 437,498Menlo Park, California . . . . . . . . . . . . . . . . . . . . . . . . . . . . . . . . . . . . . . . . . . . . . . . . . . . . . . . . . . . . . . . . . . . . . . . . . . 1,022,008Ponce, Puerto Rico . . . . . . . . . . . . . . . . . . . . . . . . . . . . . . . . . . . . . . . . . . . . . . . . . . . . . . . . . . . . . . . . . . . . . . . . . . . . . 83,105Santa Clara, California . . . . . . . . . . . . . . . . . . . . . . . . . . . . . . . . . . . . . . . . . . . . . . . . . . . . . . . . . . . . . . . . . . . . . . . . . . 928,399
Total . . . . . . . . . . . . . . . . . . . . . . . . . . . . . . . . . . . . . . . . . . . . . . . . . . . . . . . . . . . . . . . . . . . . . . . . . . . . . . . . . . . . . . 3,990,670
21
At June 30, 2008, we had approximately 193,000 square feet under construction and approximately 120,000 square feet ofexisting shell facilities available for future build-out. We continually evaluate our facility requirements in light of our businessneeds and stage the future construction accordingly. In addition, we own approximately 52 acres of undeveloped land inColorado.
During fiscal 2008, we entered into a sale-leaseback transaction for our Louisville, Colorado facility. During fiscal 2007, weentered into sale-leaseback transactions for our Newark, California and Burlington, Massachusetts campuses. The totalreduction in owned square footage as a result of these three transactions was approximately 3.8 million square feet.
Starting in fiscal 2001, we began to vacate properties in the U.S. and internationally. Of the properties that were vacated underall facility exit plans, 2.2 million square feet remain vacant or sub-leased, of which 1 million square feet are under sub-lease tonon-Sun businesses and 1.2 million square feet are vacant.
Substantially all of our facilities are used jointly by our Product groups, Services groups, Global Sales and Services organizationand other functions. Our manufacturing facilities are located in Ponce, Puerto Rico; Linlithgow, Scotland and Beaverton,Oregon.
ITEM 3. LEGAL PROCEEDINGS
We are involved in various claims, suits, investigations and legal proceedings that arise from time to time in the ordinary courseof our business. Although we do not expect that the outcome in any of these legal proceedings, individually or collectively, willhave a material adverse effect on our financial condition or results of operations, litigation is inherently unpredictable.Therefore, we could incur judgments or enter into settlements of claims that could adversely affect our operating results or cashflows in a particular period. For further information regarding items that we deem to be significant, please refer to Note 11 tothe Consolidated Financial Statements in Item 8.
ITEM 4. SUBMISSION OF MATTERS TO A VOTE OF SECURITY HOLDERS
No matters were submitted to a vote of our stockholders during the fourth quarter of fiscal 2008.
22

PART II
ITEM 5. MARKET FOR THE REGISTRANT’S COMMON EQUITY, RELATED STOCKHOLDERMATTERSAND ISSUER PURCHASES OF EQUITY SECURITIES
Our common stock trades on The NASDAQ Global Select Market under the symbol “JAVA”. Prior to August 27, 2007, ourcommon stock traded under the symbol “SUNW”. As of August 22, 2008, there were approximately 16,531 stockholders ofrecord and the closing price of our common stock was $10.00 per share as reported by The NASDAQ Global Select Market.
On November 8, 2007, our stockholders approved a one-for-four reverse stock split, which became effective on November 12,2007. All references to share and per-share data for all periods presented in this report have been adjusted to give effect to thisreverse split.
The following table sets forth for the fiscal periods indicated the high and low sale prices for our common stock as reported byThe NASDAQ Global Select Market:
Fiscal 2008 Fiscal 2007
High Low High Low
First Quarter: July 1 – September 30 . . . . . . . . . . . . . . . . . . . . . . . . . . . . . . . $23.48 $18.00 $21.12 $15.28Second Quarter: October 1 – December 30 . . . . . . . . . . . . . . . . . . . . . . . . . . 25.04 18.01 22.92 19.88Third Quarter: December 31 – March 30 . . . . . . . . . . . . . . . . . . . . . . . . . . . . 18.19 14.20 26.56 22.16Fourth Quarter: March 31 – June 30 . . . . . . . . . . . . . . . . . . . . . . . . . . . . . . . . 16.37 10.76 23.80 19.68
No cash dividends were declared or paid in fiscal 2008 or 2007. We anticipate retaining available funds to finance future growthand have no present intention to pay cash dividends.
Shares Acquired Under Board Authorized Programs
The table below sets forth our purchases of our equity securities during each of the three months in our fiscal quarter endedJune 30, 2008.
PeriodTotal # of SharesPurchased(1)
AveragePrice perShare
Total # of SharesPurchased
Under BoardAuthorizedPrograms(2)
Maximum that maybe purchased under
current plan$ (millions)(2)
March 31, 2008 – April 30, 2008 . . . . . . . . . . . . . . . . . . . . . . . 9,125 $ 0.02 — $500
May 1, 2008 – May 31, 2008 . . . . . . . . . . . . . . . . . . . . . . . . . . 30,678,700 $13.04 30,670,143 $100
June 1, 2008 – June 30, 2008 . . . . . . . . . . . . . . . . . . . . . . . . . . 5,011,685 $12.81 5,002,560 $ 36
Total . . . . . . . . . . . . . . . . . . . . . . . . . . . . . . . . . . . . . . . . . . . . . 35,699,510 $13.01 35,672,703 $ 36
(1) The total number of shares repurchased includes those shares of our common stock that our employees surrender for taxwithholding purposes in connection with vesting of restricted stock and shares of restricted stock that we repurchased fromemployees whose employment terminated before such shares vested. As of June 30, 2008, 71,114 shares are subject torepurchase by us.
(2) In May 2007, our Board of Directors authorized management to repurchase up to $3 billion of our outstanding commonstock. Under this authorization, the timing and actual number of shares subject to repurchase are at the discretion ofmanagement and are contingent upon a number of factors, such as levels of cash generation from operations, cashrequirements for acquisitions, repayment of debt and our share price.
On July 31, 2008, our Board of Directors authorized management to repurchase up to $1 billion of our outstanding commonstock. Under this authorization, the timing and actual number of shares subject to repurchase are at the discretion ofmanagement and are contingent on a number of factors, such as levels of cash generation from operations, cash requirements foracquisitions, repayment of debt and our share price.
23

Stock Performance Graphs and Cumulative Total Return
The graph below compares the cumulative total stockholder return on our common stock with the cumulative total return on theS&P’s 500 Index and the S&P Computer Hardware Index for each of the last five fiscal years ended June 30, assuming aninvestment of $100 at the beginning of such period and the reinvestment of any dividends. The comparisons in the graphs beloware based upon historical data and are not indicative of, nor intended to forecast, future performance of our common stock.
2003 2004 2005 2006 2007 2008$0
$10
$20
$30
$40
$50
$60
$70
$80
$90
$100
$110
$120
$130
$140
$150
$160
$170
$180
$190
$200
COMPARISON OF 5 YEAR CUMULATIVE TOTAL RETURN*Among Sun Microsystems, Inc., The S&P 500 Index
And The S&P Computer Hardware Index
Sun Microsystems, Inc. S&P 500 S&P Computer Hardware
As of June 30,
2003 2004 2005 2006 2007 2008
Sun Microsystems, Inc. . . . . . . . . . . . . . . . . . . . . . . . . . . . . . . . . . . . . . . . 100.00 93.12 80.22 89.25 113.12 58.49S&P 500 . . . . . . . . . . . . . . . . . . . . . . . . . . . . . . . . . . . . . . . . . . . . . . . . . . 100.00 119.11 126.64 137.57 165.90 144.13S&P Computer Hardware . . . . . . . . . . . . . . . . . . . . . . . . . . . . . . . . . . . . . 100.00 108.87 112.31 116.24 170.42 183.60
24

ITEM 6. SELECTED FINANCIAL DATA
The following selected financial data should be read in conjunction with “Item 7. Management’s Discussion and Analysis ofFinancial Condition and Results of Operations” and our Consolidated Financial Statements included in “Item 8. FinancialStatements and Supplementary Data.”
Fiscal Years Ended June 30,
2008 2007 2006(1)(2) 2005 2004
Dollars % Dollars % Dollars % Dollars % Dollars %
(In millions, except percentages and per share amounts)
Net revenues . . . . . . . . . . . . . . . . . $13,880 100.0% $13,873 100.0% $13,068 100.0% $11,070 100.0% $11,185 100.0%Cost of sales . . . . . . . . . . . . . . . . . 7,425 53.5 7,608 54.8 7,439 56.9 6,481 58.5 6,669 59.6
Gross margin . . . . . . . . . . . . . . . . . 6,455 46.5 6,265 45.2 5,629 43.1 4,589 41.5 4,516 40.4Operating expenses:Research and development . . 1,834 13.2 2,008 14.5 2,046 15.7 1,785 16.1 1,926 17.2Selling, general andadministrative . . . . . . . . . . . 3,955 28.5 3,851 27.8 4,039 30.9 2,919 26.4 3,317 29.7
Restructuring charges andrelated impairment of long-lived assets . . . . . . . . . . . . . 263 1.9 97 0.7 284 2.2 262 2.4 344 3.1
Impairment of goodwill andother intangible assets . . . . . — — — — 70 0.5 — — 49 0.4
Purchased in-process researchand development . . . . . . . . 31 0.2 — — 60 0.5 — — 70 0.6
Total operating expenses . . . . . . . . 6,083 43.8 5,956 42.9 6,499 49.7 4,966 44.9 5,706 51.0
Operating income (loss) . . . . . . . . 372 2.7 309 2.2 (870) (6.7) (377) (3.4) (1,190) (10.6)Gain (loss) on equity investments,net . . . . . . . . . . . . . . . . . . . . . . . 32 0.2 6 — 27 0.2 6 0.1 (64) (0.6)
Interest and other income, net . . . . 161 1.2 214 1.5 114 0.9 133 1.2 94 0.8Settlement income . . . . . . . . . . . . . 45 0.3 54 0.4 54 0.4 54 0.5 1,597 14.3
Income (loss) before taxes . . . . . . 610 4.4 583 4.2 (675) (5.2) (184) (1.7) 437 3.9Provision (benefit) for incometaxes . . . . . . . . . . . . . . . . . . . . . 207 1.5 110 0.8 189 1.4 (77) (0.7) 825 7.4
Net income (loss) . . . . . . . . . . . . . $ 403 2.9% $ 473 3.4% $ (864) (6.6)%$ (107) (1.0)%$ (388) (3.5)%
Net income (loss) per commonshare — basic . . . . . . . . . . . . . . $ 0.50 $ 0.54(3) $ (1.01)(3) $ (0.13)(3) $ (0.47)(3)
Net income (loss) per commonshare — diluted . . . . . . . . . . . . . $ 0.49 $ 0.52(3) $ (1.01)(3) $ (0.13)(3) $ (0.47)(3)
Shares used in the calculation ofnet income (loss) per commonshare — basic . . . . . . . . . . . . . . 809 883(3) 859(3) 842(3) 819(3)
Shares used in the calculation ofnet income (loss) per commonshare — diluted . . . . . . . . . . . . . 822 902(3) 859(3) 842(3) 819(3)
As of June 30,
2008 2007 2006 2005 2004
Cash, cash equivalents and marketable debt securities . . . . . . . . . . . . . . . . . . . . . . $ 3,310 $ 5,942 $ 4,848 $ 7,524 $ 7,608Total assets . . . . . . . . . . . . . . . . . . . . . . . . . . . . . . . . . . . . . . . . . . . . . . . . . . . . . . . . $14,340 $15,838 $15,082 $14,190 $14,805Long-term debt . . . . . . . . . . . . . . . . . . . . . . . . . . . . . . . . . . . . . . . . . . . . . . . . . . . . . $ 1,265 $ 1,264 $ 1,078(4) $ 1,123 $ 1,432(4)
Other non-current obligations(5) . . . . . . . . . . . . . . . . . . . . . . . . . . . . . . . . . . . . . . . . $ 1,136 $ 1,285 $ 1,492 $ 1,083 $ 1,460
(1) Includes the acquisitions of StorageTek and See Beyond(2) Adoption of SFAS 123(R), Shared-Based Payment(3) Amounts have been restated to reflect the one-for-four reverse stock split effective November 12, 2007.(4) Includes approximately $503 million and $257 million classified as current portion of long-term debt as of June 30, 2006 and
2004, respectively.(5) Includes deferred settlement income from Microsoft as of June 30, 2008, 2007 and 2006, long-term tax liabilities as of June 30,
2008, 2007 and 2006 and long-term restructuring liabilities for all periods presented.
25

ITEM 7. MANAGEMENT’S DISCUSSION AND ANALYSIS OF FINANCIAL CONDITION AND RESULTS OFOPERATIONS
Executive Overview
We provide network computing infrastructure solutions that drive global network participation through shared innovation,community development and open source leadership. Guided by a singular vision, “The Network is the Computer”, we providea diversity of software, systems, storage, services and microelectronics that power everything from consumer electronics, todeveloper tools and the world’s most powerful data centers. Our core brands include the Java technology platform, the SolarisOperating System, the MySQL database management system, Sun StorageTek storage solutions and the UltraSPARC processor.Our network computing platforms are used by nearly every sector of society and industry, and provide the infrastructure behindsome of the world’s best known search, social networking, entertainment, financial services, manufacturing, healthcare, retail,news, energy and engineering companies. By investing in research and development, we create products and services thataddress the complex information technology issues facing customers today, including increasing demands for network access,bandwidth and storage. We share these innovations in order to grow communities, in turn increasing participation on thenetwork and building new market opportunities while maintaining partnerships with some of the most innovative technologycompanies in the world.
Summary of Results
For the quarter ended June 30, 2008, as compared to the quarter ended June 30, 2007:
• Total net revenue decreased by $55 million, or 1.4%, primarily as a result of decreased revenue in the U.S.
• U.S. net revenue decreased $148 million, or 9.4%.
• Computer Systems product revenue decreased by $131 million, or 7.1%.
• Gross margin as a percentage of net revenue decreased by 2.9 percentage points.
• We recorded a restructuring charge of $104 million as compared to $15 million in the fourth quarter of fiscal 2007.
• Cash flow from operations decreased from $564 million to $90 million.
For the fiscal year ended June 30, 2008, as compared to the fiscal year ended June 30, 2007:
• We improved operating income by $63 million primarily through increased gross margins and reduced research anddevelopment expenses.
• Our U.S. net revenue decreased $443 million, or 7.9%.
• We improved gross margin as a percentage of net revenue by 1.3 percentage points to 46.5% in part due to component costreductions and other operational efficiencies.
• Research and development expenses decreased by $174 million, or 8.7%.
• Selling, general and administrative expenses increased by $104 million, or 2.7%.
• We recorded restructuring charges of $263 million as compared to $97 million in the prior year.
• We recorded $31 million in charges for purchased in-process research and development associated with our recentacquisitions as compared to no charges in the prior year.
• Products and Services deferred revenues increased by $213 million, or 7.9%.
• Interest and other income decreased by $53 million, or 24.8%.
• We ended the fiscal year 2008 with a cash and marketable debt securities balance of $3.3 billion and generated positivecash flow from operations of $1.3 billion.
• We repurchased approximately 151 million shares of common stock, at an average price of $18.30 for a total cost ofapproximately $2.76 billion under our 2007 Stock Repurchase Plan.
• We introduced next generation systems and storage solutions including the Sun SPARC Enterprise M8000 and M9000servers based on the symmetric multiprocessing (SMP) architecture and utilizing the SPARC64 VI dual-core processor,specifically designed for high-volume, mission-critical computing. We introduced the Sun Netra T5220 based on the UltraSPARC T2 processor, blades based on the UltraSPARC T2 processor and AMD Opteron processor the T5140 and T5240CMT-based enterprise servers incorporating the UltraSPARC T2 Plus processor. Additionally, we introduced the T9840Denterprise tape drive and the Sun StorageTek VTL 2.0 Plus, an appliance that combines a server, disk storage and softwarein a single unit so that tape and disk storage resources can be deployed, managed, and monitored from a single point.
26

Net RevenuesFor the fiscal year ended June 30,(dollars in millions, except revenue per employee dollars in thousands)
2008 Change $ Change % 2007 Change $ Change % 2006
Computer Systems products . . . . . . . . . . . . . . $ 6,264 $(191) (3.0)% $ 6,455 $ 458 7.6% $ 5,997Storage products . . . . . . . . . . . . . . . . . . . . . . . . 2,354 38 1.6% 2,316 (58) (2.4)% 2,374
Products net revenue . . . . . . . . . . . . . . . . . . $ 8,618 $(153) (1.7)% $ 8,771 $ 400 4.8% $ 8,371Percentage of total net revenues . . . . . . . 62.1% (1.1) pts 63.2% (0.9) pts 64.1%
Support Services . . . . . . . . . . . . . . . . . . . . . . . $ 4,023 $ 61 1.5% $ 3,962 $ 284 7.7% $ 3,678Professional Services and EducationalServices . . . . . . . . . . . . . . . . . . . . . . . . . . 1,239 99 8.7% 1,140 121 11.9% 1,019
Services net revenue . . . . . . . . . . . . . . . . . . $ 5,262 $ 160 3.1% $ 5,102 $ 405 8.6% $ 4,697Percentage of total net revenues . . . . . . . 37.9% 1.1 pts 36.8% 0.9 pts 35.9%
Total net revenues . . . . . . . . . . . . . . . . . . . . . . $13,880 $ 7 0.1% $13,873 $ 805 6.2% $13,068Revenue per employee (for twelve monthsended)(1) . . . . . . . . . . . . . . . . . . . . . . . . . . . . $ 406 $ 9 2.3% $ 397 $ 57 16.8% $ 340
(1) Revenue per employee is calculated by dividing the revenue during the period by the average number of employees duringthe period, including contractors. We use this as a measure of our productivity.
Foreign Currency Exchange Impact
Due to the generally weakened U.S. dollar during fiscal 2008 and fiscal 2007, as compared with fiscal 2007 and fiscal 2006,respectively, our total net revenues were favorably impacted by foreign currency exchange rates. The net foreign currencyimpact to our total net revenues is difficult to precisely measure due to pricing and hedging actions we take to mitigate the effectof foreign currency exchange rate fluctuations. Excluding the effect of these actions in fiscal 2008, the maximum impact relatedto foreign exchange rate changes during fiscal 2008, as compared with fiscal 2007, would be approximately 3% to Products netrevenue and approximately 5% to Services net revenue. Excluding the effect of these actions in fiscal 2007, the maximumimpact related to foreign exchange rate changes during fiscal 2007, as compared with fiscal 2006, would be approximately 2%to Products net revenue and approximately 3% to Services net revenue. Due to the imprecision of these calculations, we do notexpect to provide quantitative estimates of the impact of foreign currency exchange rates in future periods.
Products Net Revenue
FY06 FY07 FY08
0
1,000
2,000
3,000
4,000
5,000
6,000
7,000
8,000
9,000
10,000
11,000
13,000
15,000
12,000
14,000
16,000
Annual Revenue Summary ($M)PROFESSIONAL SERVICES &EDUCATIONAL SERVICESSUPPORT SERVICES
STORAGE PRODUCTSCOMPUTER SYSTEMPRODUCTS
5,997
2,374
3,678
1,019
6,455
2,316
3,962
1,140
6,264
2,,354
4,023
1,239
27
Products net revenue consists of revenue generated from the sales of Computer Systems and Storage products.
We distribute our products to end users through a combination of direct sales through our Global Sales and Servicesorganization and through our independent distributors. Beginning in the second quarter of fiscal 2008, we introduced programsin certain geographic markets entitling our distributors to a reduced price on hardware when sold to the end customer with asupport services contract. Accordingly, in these cases, we are no longer able to meet the criteria for revenue recognition underU.S. generally accepted accounting principles at the time of sale to our distributors. We have deferred revenue on these salesuntil our distributors sell the hardware to the end customer. We introduced these programs in the U.S. and parts of Europe, theMiddle East, Africa and Asia during fiscal 2008. As a result of these programs, our Products revenue was adversely impacted byapproximately $150 million in fiscal 2008, as compared to fiscal 2007.
The decrease in Computer Systems products net revenue during fiscal 2008 of $191 million, as compared to fiscal 2007, wasprimarily due to the change to certain distributor programs described above. There was a corresponding increase in deferredproducts revenue over the same time period. In addition, we experienced decreased sales of our traditional volume SPARC-based server products, decreased sales of our x64-based rack server products and decreased sales of our mid-range serverproducts. Decreased sales of our traditional volume SPARC-based server products were due to reduced customer demand asproducts are near their end of life (EOL). Decreased sales of our x64-based rack server products were primarily due to thedelayed introduction of AMD quad core-based products. Decreased sales of our mid-range server products were primarily dueto a partial shift to volume products and due to certain of our products nearing their EOL. These decreases were partially offsetby increased sales of our CMT volume server products, increased sales of our blade server products and increased sales of ourrecently introduced Olympus Product Line (OPL) server products. Increased sales of our CMT volume server products and ourblade server products were primarily the result of continued acceptance of our products based on the UltraSPARC T2 plusprocessor.
The increase in Storage products net revenue during fiscal 2008 of $38 million, as compared to fiscal 2007, was due toincreased sales of enterprise and mid-range disk products, increased sales of connectivity products and increased sales of tapemedia. Increased sales of enterprise disk products were due to recent product introductions, including the SE9990 enterprisedisk model. Increased sales of mid-range disk products were due to the improved functionality and scalability of the ST6140and ST6150 product models and sales initiatives. Increased sales of our connectivity products were driven by increased sales ofour enterprise and mid-range disk products. Increased sales of our tape media products were due to the increase in our installedbase. These increases were partially offset by decreased sales of our enterprise and OEM tape drive products and VirtualStorage Manager (VSM) mainframe products. Decreased sales of our enterprise and OEM tape drive products were primarilydue to delayed product introductions. Decreased sales of our VSM mainframe products were primarily due to the competitiveand declining mainframe market.
The increase in Computer Systems products revenue during fiscal 2007 of $458 million, as compared to fiscal 2006, was due toincreased sales of our CMT entry-level volume server products, increased sales of our x64-based server products and increasedsales of our data center enterprise server products. These increases were partially offset by decreased sales of certain SPARC-based server products and decreased sales of our mid-range enterprise server products. During fiscal 2007, we drove down theworldwide level of product inventory at our channel partners. This reduction in channel inventory adversely impacted productsrevenue by approximately $90 million in fiscal 2007.
The decrease in Storage products revenue during fiscal 2007 of $58 million, as compared to fiscal 2006, was primarily due todecreased sales of data center and entry level disk storage products, decreased sales of our enterprise tape drive products anddecreased sales of our virtual tape products. These decreases were partially offset by increased sales of high-end library tapeproducts, mid-range disk storage products and the inclusion of StorageTek revenues for the full 2007 fiscal year. Declines inStorage revenues were generally due to product market competition and product age.
28

Services Net Revenue
Services net revenue consists of revenue generated from Support Services (Support Services and Managed Services) andProfessional Services and Educational Services.
46.5%
16.7%
28.6%
8.2%
Revenue - FYE 2007COMPUTER SYSTEMSPRODUCTSSTORAGE PRODUCTSSUPPORT SERVICESPROFESSIONALSERVICES & EDUCATIONALSERVICES
45.1%
17.0%
29.0%
8.9%
Revenue - FYE 2008COMPUTER SYSTEMSPRODUCTSSTORAGE PRODUCTSSUPPORT SERVICESPROFESSIONALSERVICES & EDUCATIONALSERVICES
Support Services are services that offer customers technical support, software and firmware updates, online tools, product repairand maintenance and preventive services for system, storage and software products. Managed Services include on-site andremote monitoring and management for the components of their IT infrastructure, including operating systems, third-party andcustom applications, databases, networks, security, storage and the web.
Support Services revenue consists primarily of maintenance contract revenue, which is recognized ratably over the contractualperiod and represented approximately 76%, 78% and 78% of Services net revenue in fiscal 2008, 2007 and 2006, respectively.
The increase in Support Services net revenue during fiscal 2008 of $61 million, as compared to fiscal 2007, was due toincreased sales of our Managed Services and the favorable impact of foreign currency exchange movements. Increased sales ofour Managed Services were primarily the result of increased demand for remote and managed site offerings and the shift tosingle supplier multi-vendor-support models which are displacing traditional maintenance support service models. We haveexperienced pricing pressure on maintenance contracts sold or renewed primarily due to customers choosing lower-costsolutions.
The increase in Support Services net revenue during fiscal 2007 of $284 million, as compared to fiscal 2006, was due to ourfocus on the maintenance and expansion of existing services with our largest customers and the impact of favorable movementsin foreign currency exchange rates.
Professional Services are services that enable customers to reduce costs and complexity, improve operational efficiency andbuild or transform their IT infrastructure. Professional Services include IT assessments, architectural services, implementationservices and consolidation and migration services. Educational Services include training and certification for individuals andteams.
The increase in Professional Services and Educational Services net revenue during fiscal 2008 of $99 million, as compared tofiscal 2007, was due to increased Professional Services revenue. Professional Services revenue increased due to demand forHigh Performance Computing (HPC), data management and specialized identity management projects. Additionally, we haveexperienced an increased demand for consolidation and virtualization project services, which use software applications to divideone physical server into multiple isolated environments creating greater efficiency in the use of servers. Increases in EducationalServices revenue were primarily due to continued Solaris adoption and the related training needs.
The increase in Professional Services and Educational Services net revenue during fiscal 2007 of $121 million, as compared tofiscal 2006, was primarily due to more complex engagements that allowed us to sell additional service offerings as well as astrong demand for our certification services.
29

Net Revenues by Geographic Area*For the fiscal year ended June 30,(dollars in millions)
2008 Change $ Change % 2007 Change $ Change % 2006
U.S. . . . . . . . . . . . . . . . . . . . . . . . . . . . . . . . . . . . . . . . . . . $ 5,198 $(443) (7.9)% $ 5,641 $106 1.9% $ 5,535Percentage of net revenues . . . . . . . . . . . . . . . . . . . . . . 37.4% (3.3) pts 40.7% (1.7) pts 42.4%
International revenues:International Americas (Canada and Latin America) . . . $ 1,002 $ 139 16.1% $ 863 $108 14.3% $ 755Percentage of net revenues . . . . . . . . . . . . . . . . . . . . . . 7.2% 1.0 pts 6.2% 0.4 pts 5.8%
EMEA (Europe, Middle East and Africa) . . . . . . . . . . . . $ 5,247 $ 248 5.0% $ 4,999 $353 7.6% $ 4,646Percentage of net revenues . . . . . . . . . . . . . . . . . . . . . . 37.8% 1.8 pts 36.0% 0.4 pts 35.6%
APAC (Asia, Australia and New Zealand) . . . . . . . . . . . $ 2,433 $ 63 2.7% $ 2,370 $238 11.2% $ 2,132Percentage of net revenues . . . . . . . . . . . . . . . . . . . . . . 17.6% 0.5 pts 17.1% 0.8 pts 16.3%
Total international revenues . . . . . . . . . . . . . . . . . . . . . . . $ 8,682 $ 450 5.5% $ 8,232 $699 9.3% $ 7,533Percentage of net revenues . . . . . . . . . . . . . . . . . . . . . . 62.6% 3.3 pts 59.3% 1.7 pts 57.6%
Total net revenues . . . . . . . . . . . . . . . . . . . . . . . . . . . . . . . $13,880 $ 7 0.1% $13,873 $805 6.2% $13,068
* Geographic revenue reported for the fiscal year ended June 30, 2006 has been adjusted to reflect an immaterial correctionin intercompany revenue to properly report country of origin.
FY 2006 FY 2007 FY 2008
0
1,000
2,000
3,000
4,000
5,000
6,000
7,000
8,000
9,000
10,000
11,000
12,000
13,000
15,000
14,000
Annual Revenue by Geography ($M)APAC
EMEA
INTERNATIONAL AMERICAS
UNITED STATES
5,535
755
4,646
2,132
5,641
863
4,999
2,370
5,198
1,002
5,247
2,433
United States (U.S.)
The decrease in U.S. net revenue of $443 million during fiscal 2008, as compared to fiscal 2007, was primarily due to decreasedsales of our Computer Systems and Storage products, decreased sales of our Services and a change to certain distributorprograms under which we are no longer able to meet certain criteria for revenue recognition at the time of sale in to ourdistributors. The change in certain distributor programs negatively impacted revenue in the U.S. by approximately $108 million.Decreased sales of Computer Systems products were due to decreased sales of our traditional SPARC volume products, datacenter and mid-range enterprise server products and x64-based rack server products. Decreased sales of our traditional volumeSPARC-based server products were primarily due to reduced customer demand as products are near their EOL. Decreased salesof our data center and mid-range server products were due to a partial shift to volume products and certain products nearingtheir EOL. Decreased sales of our x64-based rack server products were primarily due to the delayed introduction of AMD quadcore based products. These decreases were partially offset by increased sales of our CMT-based SPARC volume server productsand blade server products. Increased sales of our CMT volume server products and our blade server products were the result of
30

continued acceptance of our products based on the UltraSPARC T2 plus processor. Decreased sales of our Storage productswere due to decreased sales of our enterprise and entry level disk products and decreased sales of our enterprise tape driveproducts due to weak demand in the first half of fiscal 2008 for these products. These decreases were partially offset byincreased sales of tape media due to increases in our installed base. We experienced decreased Services revenue primarily due toa decrease in Support Services revenue. Decreased Support Services revenue was due to an increasingly competitiveenvironment, particularly within the telecommunications sector due to recent acquisition and consolidation activity within thesector and increased competitive pressures. We have experienced increased competitive pressures in these markets and expectthis will continue in the future.
The increase in U.S. net revenue of $106 million during fiscal 2007, as compared to fiscal 2006, was most significantlyimpacted by increased Computer Systems product sales and increased Services revenue. The increase in Computer Systemsproduct net revenue was primarily due to increased sales of our CMT-based SPARC systems, x64-based systems and data centerenterprise servers. These increases were partially offset by decreased sales of our Storage products. Computer Systemsexperienced growth in the telecommunications, government and financial services sectors. Partially offsetting these increaseswere weakness in certain areas of the energy and utility and insurance sectors.
International Revenues
In fiscal 2009, we plan to utilize a new Emerging Market geographic grouping. The geographies that will be reported under thisgrouping primarily include India, China, Latin America, and Southern and Eastern Europe.
The following table sets forth net revenues in geographic markets contributing significantly to changes in international netrevenues during the last three fiscal years ended June 30:
(dollars in millions)
2008 Change $ Change % 2007 Change $ Change % 2006
Central and North EMEA(CNE)(1) . . . . . . . . . . . . . . $1,463 $171 13.2% $1,292 $180 16.2% $1,112United Kingdom . . . . . . . . . . . . . . . . . . . . . . . . . . . . $1,155 $ 25 2.2% $1,130 $ 19 1.7% $1,111Germany . . . . . . . . . . . . . . . . . . . . . . . . . . . . . . . . . . $ 993 $ — 0.0% $ 993 $ 80 8.8% $ 913Japan . . . . . . . . . . . . . . . . . . . . . . . . . . . . . . . . . . . . . $ 673 $ (70) (9.4)% $ 743 $ (20) (2.6)% $ 763
(1) CNE consists primarily of Switzerland, Russia, the Netherlands, Sweden and Belgium. Fiscal 2007 and fiscal 2006revenues have been adjusted to reflect a change in the compilation of countries that make up CNE.
37.4%
7.2%
37.8%
17.6%
2008 World Wide Revenue %
UNITED STATESINTERNATIONALAMERICASEMEA
APAC
CNE
The increase in CNE net revenues of $171 million during fiscal 2008, as compared to fiscal 2007, was due to increased sales ofComputer Systems products, increased sales of Services and the benefit of favorable foreign currency exchange rates. Increasedsales of Computer Systems products were due to increased sales of data center server products, increased sales of CMT-basedSPARC server products and increased sales of our blade server products. Increased sales of our data center server products wereattributable to the introduction of our OPL product offering. Increased sales of our CMT volume server products and our bladeserver products were the result of the continued acceptance of our products based on the UltraSPARC T2 plus processor.Increased Services sales were due to increased Support Services sales. Increased Support Services sales were due to increased
31

demand from the government and telecommunications sectors. These increases were partially offset by decreased sales oftraditional volume SPARC-based server products. Decreased sales of our traditional volume SPARC-based server products wereprimarily due to reduced customer demand as products are near their EOL.
The increase in net revenues in CNE of $180 million during fiscal 2007, as compared to fiscal 2006, was primarily due toincreased Computer Systems sales and increased Services revenue in a variety of sectors and across the majority of our productsand services categories. Computer Systems products revenue was most significantly impacted by increased sales of our CMTvolume server products, our high-end server products and a moderate increase in sales of our Storage products.
United Kingdom (U.K.)
The increase in U.K. net revenues of $25 million during fiscal 2008, as compared to fiscal 2007, was due to increased sales ofComputer Systems products and the benefit of favorable foreign currency exchange rates. Increased sales of Computer Systemsproducts were partially offset by decreased Services revenue. Increased sales of Computer Systems products were due toincreased sales of CMT volume server products and increased sales of data center server products. Increased sales of our CMTvolume server products were the result of the continued acceptance of our products based on the UltraSPARC T2 plusprocessor. Increased sales of our data center server products were primarily attributable to the introduction of our OPL productoffering. These increases were partially offset by decreased sales of traditional volume SPARC-based server products.Decreased sales of our traditional volume SPARC-based server products were due to reduced customer demand as products arenear their EOL. We experienced decreased Services sales as a result of decreased Support Services sales partially offset byincreased Managed Services sales. The declines in Support Services sales were due to decreased spending on services within thegovernmental and financial services sectors. U.K. net revenues were negatively impacted as a result of the fourth quarterintroduction of certain sales programs with our channel partners. We have experienced overall increased sales within thegovernment, retail, education and manufacturing sectors, while financial services, telecommunications and energy/utility sectorsales have experienced overall declines.
Net revenues in the U.K. were relatively unchanged during fiscal 2007, as compared to fiscal 2006. Favorable foreign currencyexchange rates and increased Services revenue were offset by reduced product sales. Strong pricing pressure from marketcompetitors was the primary cause of reduced sales of our products. Computer Systems revenue was most adversely impactedby decreased sales of our workstation products and Storage revenue was adversely impacted by decreased sales of our tape andenterprise disk products.
Germany
Net revenues in Germany were unchanged during fiscal 2008, as compared to fiscal 2007. Increased Computer Systems productsales and the benefit of favorable foreign currency exchange rates were offset by decreased Services revenue. IncreasedComputer Systems product sales were a result of increased sales of our data center enterprise server products and our Netraserver products. Increased sales of our data center server products were primarily attributable to the introduction of our OPLproduct offering. Increased Netra server product sales were primarily due to increased demand within the telecommunicationssector. Decreased Services sales were primarily due to decreased Professional Services sales due to decreased demand from thefinancial services sector.
The increase in Germany net revenues of $80 million during fiscal 2007, as compared to fiscal 2006, was due to the benefit offoreign currency exchange rates and increased sales of Computer Systems products and Support Services. Thetelecommunications sector remained a source of overall strength during fiscal 2007. These increases were partially offset bypricing pressures caused by increased competition, weak demand for our Storage products and a challenging economicenvironment.
Japan
The decrease in net revenues in Japan of $70 million during fiscal 2008, as compared to fiscal 2007, was due to decreased salesof our Computer Systems and Storage products caused by modified sales and marketing arrangements with key channel partnersand continued competitive market conditions. These modified sales and marketing agreements allow us to improve sales ofcertain OPL and UltraSPARC-based Computer Systems products in a majority of other geographies, but negatively impactcertain related licensing revenues in Japan. These decreases were offset by increased Services sales and favorable foreigncurrency exchange rates. Increased Services sales were due to increased sales of our Professional Services. The increase inProfessional Services sales were due to increased demand for customized architectural services.
32

Net revenues in Japan decreased $20 million during fiscal 2007, as compared to fiscal 2006. Products net revenues decreasedpartially as a result of unfavorable foreign currency exchange rates the implementation of certain elements of our broad-basedstrategic alliance with Fujitsu and significant decreases in Storage product sales. Services revenue was relatively unchanged infiscal year 2007 as compared to fiscal year 2006.
Gross MarginFor the fiscal year ended June 30,(dollars in millions)
2008 Change $ Change % 2007 Change $ Change % 2006
Products gross margin . . . . . . . . . . . . . . . . . . $3,950 $ (10) (0.3)% $3,960 $416 11.7% $3,544Percentage of products net revenue . . . . . . 45.8% 0.7 pts 45.1% 2.8 pts 42.3%
Services gross margin . . . . . . . . . . . . . . . . . . $2,505 $200 8.7% $2,305 $220 10.6% $2,085Percentage of services net revenue . . . . . . 47.6% 2.4 pts 45.2% 0.8 pts 44.4%
Total gross margin . . . . . . . . . . . . . . . . . . . . . $6,455 $190 3.0% $6,265 $636 11.3% $5,629Percentage of net revenues . . . . . . . . . . . . 46.5% 1.3 pts 45.2% 2.1 pts 43.1%
Products Gross Margin
FY06 FY07 FY08
0
1,000
2,000
3,000
4,000
5,000
6,000
7,000
2,085
2,305
Annual Gross Margin ($M)Services grossmarginProducts grossmargin
3,544
2,085
3,960
2,305
3,950
2,505
Products gross margin percentage is influenced by numerous factors including product volume and mix, pricing, geographicmix, foreign currency exchange rates, the mix between sales to resellers and end-users, third-party costs (including both rawmaterial and manufacturing costs), warranty costs and charges related to excess and obsolete inventory. Many of these factorsinfluence, or are interrelated with, other factors. As a result, it is difficult to precisely quantify the impact of each itemindividually. Accordingly, the following quantification of the reasons for the change in the Products gross margin percentage isan estimate only.
Products gross margin increased by approximately one percentage point during fiscal 2008, as compared to fiscal 2007.Decreasing material costs and our supply chain restructuring efforts combined to increase gross margin by approximately tenpercentage points. Offsetting this increase was the impact of pricing and discounting actions by approximately nine percentagepoints.
Products gross margin increased by approximately three percentage points during fiscal 2007, as compared to fiscal 2006.Products gross margin increased by five percentage points due to decreasing material costs (primarily memory components andour supply chain restructuring efforts) and two percentage points due to favorable changes in volume and mix including a higherpercentage of software sales, offset by a four percentage point decrease due to pricing, discounting and other actions.
There can be no assurance that the current gross margin percentage will be maintained. In general, gross margins will remainunder downward pressure due to the variety of factors listed above, especially continued industry wide global pricing pressures,a potential shift in product mix and increases in the cost and availability of components. We may continue to take pricingactions with regard to our products in response to the competitive environment. We do however believe that our gross marginswill remain relatively stable for the fiscal 2009 period.
33

Services Gross Margin
Services gross margin percentage is influenced by numerous factors including services mix, pricing, geographic mix, foreigncurrency exchange rates and third-party costs. Many of these factors influence, or are interrelated with, other factors. As a result,it is difficult to precisely quantify the impact of each item individually. Accordingly, the following quantification of the reasonsfor the change in the Services gross margin percentage is an estimate only.
Services gross margin increased by approximately two percentage points during fiscal 2008, as compared to fiscal 2007. Costsavings associated with better utilization rates and decreased costs associated with compensation benefitted gross margin byapproximately three percentage points. This increase was partially offset by unfavorable changes in services mix ofapproximately one percentage point.
Services gross margin increased by one percentage point during fiscal 2007, as compared to fiscal 2006, primarily due to costsavings associated with better utilization rates and the positive impact of changes in services mix. These factors increased grossmargin by approximately two percentage points. This increase was partially offset by the impact of other expenses, primarilycompensation, by approximately one percentage point.
Operating ExpensesFor the fiscal year ended June 30,(dollars in millions)
2008 Change $ Change % 2007 Change $ Change % 2006
Research and development . . . . . . . . . . . . . . . . . . . $1,834 $(174) (8.7)% $2,008 $ (38) (1.9)% $2,046Percentage of net revenues . . . . . . . . . . . . . . . 13.2% (1.3) pts 14.5% (1.2) pts 15.7%
Selling, general and administrative . . . . . . . . . . . . . $3,955 $ 104 2.7% $3,851 $(188) (4.7)% $4,039Percentage of net revenues . . . . . . . . . . . . . . . 28.5% 0.7 pts 27.8% (3.1) pts 30.9%
Restructuring charges and related impairment . . . . $ 263 $ 166 171.1% $ 97 $(187) (65.8)% $ 284Percentage of net revenues . . . . . . . . . . . . . . . 1.9% 1.2 pts 0.7% (1.5) pts 2.2%
Impairment of other intangible assets . . . . . . . . . . . $ — $ — $ — $ — $ (70) N/M* $ 70Percentage of net revenues . . . . . . . . . . . . . . . — — — — (0.5) pts 0.5%
Purchased in-process research anddevelopment . . . . . . . . . . . . . . . . . . . . . . . . . . . . $ 31 $ 31 — $ — $ (60) N/M* $ 60Percentage of net revenues . . . . . . . . . . . . . . . 0.2% 0.2 pts — (0.5) pts 0.5%
Total operating expenses . . . . . . . . . . . . . . . . . . . . $6,083 $ 127 2.1% $5,956 $(543) (8.4)% $6,499*N/M— Not meaningful
Total Operating Expenses
Fiscal 2008 total operating expenses when compared to fiscal 2007 increased by $127 million. The increase in theexpense-to-revenue ratio of approximately one percentage point was due to increased restructuring expenses of approximately1.2 percentage points, an increase to selling, general and administrative (SG&A) expenses of 0.7 percentage points and a 0.2percentage point increase in expenses associated with IPRD. These increases were partially offset by a decrease in R&Dexpenses of approximately 1.3 percentage points. We expect aggregate SG&A and R&D expenses to increase slightly in fiscal2009.
34

Fiscal 2007 total operating expenses when compared to fiscal 2006 decreased by $543 million. The decrease in theexpense-to-revenue ratio of approximately seven percentage points was due to decreased restructuring expenses and impairmentcharges of approximately 2.0 percentage points, a decrease to SG&A expenses of 3.1 percentage points, decreased R&Dexpenses of approximately 1.2 percentage points, and a 0.5 percentage point decrease in expenses associated with IPRD.
FY06 FY07 FY08
0.00%
2.50%
5.00%
7.50%
10.00%
12.50%
15.00%
17.50%
20.00%
22.50%
25.00%
27.50%
30.00%
32.50%
15.7%14.5%
13.2%
30.9%
27.8%28.5%
2.2%0.7%
1.9%
Certain Operating Expenses as a percentage of revenues
R&DSG&A
RestructuringCharges
Research and Development Expenses
During fiscal 2008, as compared to fiscal 2007, R&D expenses decreased by $174 million primarily attributable to a $151million decrease in compensation and benefit expenses, including incentive based compensation, a $17 million decrease inprototype expenses associated with a new product introductions and an $11 million decrease in depreciation expense. Thesedecreases were partially offset by a $5 million increase in expenses from outside service providers. R&D expenses, as apercentage of net revenue, decreased 1.3 percentage points to 13.2% in fiscal 2008 as compared to fiscal 2007.
The decrease in R&D expenses of $38 million during fiscal 2007, as compared to fiscal 2006, was primarily due to restructuringefforts. Included in the decrease was $136 million in headcount reductions, $41 million in outside services reductions, $17million in depreciation, $13 million in prototype expenditure reductions and $10 million in stock based compensation. Thesedecreases were predominantly offset by a $179 million increase in compensation for continuing employees. R&D expenses, as apercentage of net revenues, decreased 1.2 percentage points to 14.5% in fiscal 2007 as compared to fiscal 2006.
FY06 FY07 FY08
0500
1,0001,5002,0002,5003,0003,5004,0004,5005,0005,5006,000
7,0006,500
Annual Operating Expense ($M)Restructuring Charges, IPRD, and Impairment SG&A
R&D
2,046
4,039
414
2,008
3,851
97
1,834
3,955
294
35

Selling, General and Administrative Expenses
The increase to SG&A expenses during fiscal 2008, as compared to fiscal 2007, was primarily due to increased compensationand benefits expenses, increased marketing expenses and increased expenses associated with outside services and travel. Theincrease in SG&A expenses of $104 million was primarily a result of increased compensation and benefit expenses of $37million associated with additional sales employees added to our high sales growth regions and additional employees from ourrecent acquisitions, increased marketing expenses of $32 million associated with equipment placement programs, increasedservice provider expenses of $31 million and increased travel expenses of approximately $24 million associated with our multi-year internal systems implementation effort. We experienced increased facilities and occupancy expense of approximately $14million and expenses of $6 million related to a legal settlement. These increases were partially offset by a decrease indepreciation expenses of approximately $51 million.
The decrease in SG&A expenses during fiscal 2007, as compared to fiscal 2006, was primarily due to headcount reductions andother administrative efficiencies achieved through the integration of StorageTek and SeeBeyond. Included in the decrease was$182 million in headcount reductions, $44 million in decreases in marketing expenditures, $33 million in depreciation, $32million in reductions in outside services and $6 million in stock based compensation. These decreases were partially offset by a$148 million increase in compensation for continuing employees. SG&A expenses, as a percentage of net revenues, decreased3.1 percentage points to 27.8% in fiscal 2007, as compared to fiscal 2006.
We are continuing to focus our efforts on achieving additional operating efficiencies by reviewing and improving upon ourexisting business processes and cost structure.
Restructuring and Related Impairment of Long-lived Assets
In May 2008, we initiated a restructuring plan to further align our resources with our strategic business objectives throughreducing our workforce by approximately 1,500 to 2,500 employees (Restructuring Plan VIII). Under this plan, we estimate intotal that we will incur between $180 million to $230 million in severance and benefit costs. Through the end of fiscal year2008, we recognized total related severance and benefit costs of $107 million. The remainder of the estimated costs under thisrestructuring plan are expected to be incurred during fiscal 2009.
Under our Restructuring Plan VII and through fiscal 2008, we notified approximately 1,500 employees of their termination andrecognized total expenses relating to severance and benefits costs of $135 million. In fiscal 2008, 2007 and 2006, werecognized, under all of our workforce reduction and excess facility exit plans, restructuring charges of $263 million, $97million and $284 million, respectively. The remaining cash expenditures relating to workforce reductions are expected to bepaid over the next few quarters. We anticipate recording additional charges related to our workforce and facilities reductionsover the next several quarters, the timing of which will depend upon the timing of notification of the employees leaving Sun asdetermined by local employment laws and as we exit facilities.
We will continue to emphasize productivity improvement initiatives that may result in additional restructurings. For furtherdetail regarding our restructuring balances and historical activity, refer to Note 4 and Note 6 to the Consolidated FinancialStatements in Item 8.
Purchased In-Process Research and Development (IPRD)
In fiscal 2008, we recorded an IPRD expense of $31 million, primarily related to our acquisition of MySQL. At the date of theacquisition, the projects associated with the IPRD efforts had not yet reached technological feasibility and the IPRD had noalternative future use. See Note 4 to the Consolidated Financial Statements in Item 8 for additional information regarding theacquisitions completed in fiscal 2008 and 2007.
Gain (Loss) on Equity Investments, NetFor the fiscal year ended June 30,(dollars in millions)
2008 Change $ Change % 2007 Change $ Change % 2006
Gain (loss) on equity investments, net . . . . . . . . . . . . . . . . . . $32 $26 433.3% $6 $(21) (77.8)% $27
In fiscal 2008, our gain on equity investments, net, of $32 million, was comprised of approximately $13 million in gains on thesale of certain marketable equity investments in publicly held companies and $19 million in gains from private companyinvestments.
In fiscal 2007, our gain on equity investments of $6 million was comprised of approximately $3 million in gains on the sale ofcertain equity investments in privately-held companies and $3 million in income and distributions from our joint ventures andventure fund investments.
36

As of June 30, 2008, our equity investment portfolio of $53.4 million consisted of $20.8 million in marketable equity securities,$18.9 million in equity investments in privately-held companies and $13.7 million in investments in venture capital funds andjoint ventures. The ongoing valuation of our investment portfolio may be subject to fluctuations based on whether we participatein additional investment activity or as a result of the occurrence of events outside of our control.
Interest and Other Income, NetFor the fiscal year ended June 30,(dollars in millions)
2008 Change $ Change % 2007 Change $ Change % 2006
Interest and other income, net . . . . . . . . . . . . . . . . . . . . . . $161 $(53) (24.8) $214 $100 87.7% $114
The decrease in interest income, net, during fiscal 2008, as compared to fiscal 2007, was primarily due to lower interest ratesand a lower average cash balance in fiscal 2008 resulting from the use of $2.76 billion of our cash for our stock repurchaseprogram and the use of $797 million of cash to purchase MySQL in fiscal 2008.
The increase in interest income, net, during fiscal 2007, as compared to fiscal 2006, was primarily due to an increase in interestrates, a higher average cash balance and a decrease in interest expense due to the payment of our $500 million Senior Notes inthe first quarter of fiscal 2007.
Our interest income and expense are sensitive primarily to changes in the general level of U.S. interest rates. In this regard,changes in U.S. interest rates affect the interest earned on our cash equivalents and marketable debt securities, which arepredominantly short-term fixed income instruments. To better match the interest rate characteristics of our investment portfolioand our issued fixed-rate unsecured senior debt securities, we have entered into interest rate swap transactions so that theinterest associated with these debt securities effectively becomes variable.
Income TaxesFor the fiscal year ended June 30,(dollars in millions)
2008 Change 2007 Change 2006
Provision for (benefit from) income taxes . . . . . . . . . . . . . . . . . . . . . . . . . . . . . . . . . $207 $97 $110 $(79) $189
During fiscal 2008, we recorded a tax expense of $207 million which was primarily related to taxes due on income generated inour foreign tax jurisdictions. The tax expense included a reduction in the U.S. valuation allowance that is credited to otherbalance sheet accounts and therefore did not benefit the income tax expense. The tax provision for fiscal 2008 was alsoimpacted by a reduction in foreign tax expense as a result of repaying intercompany loans of certain international subsidiariesthat occurred in the third quarter of fiscal 2007.
During fiscal 2007, we recorded a tax expense of $110 million which was primarily related to taxes due on income generated inour foreign tax jurisdictions. The foreign tax expense is net of a benefit of $14 million recorded for the reduction in accruedwithholding taxes on unremitted foreign earnings as a result of restructuring of certain European subsidiaries as well as a benefitof $13 million due to a tax law change in Germany. The U.S. tax benefit reflects a benefit of $54 million primarily relating tothe settlement of the Internal Revenue Service income tax audit for fiscal 2001 and 2002, and a benefit associated with adjustingestimated amounts to actual liabilities resulting from the filing of the FY06 U.S. tax return. This U.S. benefit was offset by theutilization of acquisition net operating losses, increases to various tax reserves, and foreign withholding taxes.
During fiscal 2006, we recorded a tax expense of $189 million, which was primarily related to taxes due on income generated inour foreign tax jurisdictions and in the U.S. associated with the repatriation of foreign earnings pursuant to the American JobsCreation Act. The tax expense included a charge of approximately $20 million associated with corrections of previously filedtax returns, which was partially offset by a benefit associated with adjusting estimated amounts to actual liabilities resultingfrom the filing of prior years’ tax returns. These adjustments were immaterial to our results of operations and financial conditionfor fiscal 2006 as well as the prior affected periods. A charge of $58 million was recorded in the fourth quarter of fiscal 2006associated with our repatriation of $1,965 million in unremitted foreign earnings, of which $1,600 million was eligible to betaxed at a reduced effective tax rate under the Foreign Earnings Repatriation Provision of the American Jobs Creation Act.
U.S. income taxes have been provided for with respect to all undistributed earnings of our foreign subsidiaries. As of June 30,2008, there are no earnings that are considered to be permanently invested in operations outside of the U.S. However, we mayelect to permanently invest in operations outside of the U.S. in the future.
37

We currently have provided a full valuation allowance on our U.S. deferred tax assets and a full or partial valuation allowanceon certain overseas deferred tax assets. We intend to maintain this valuation allowance until sufficient positive evidence existsto support reversal of the valuation allowance. Likewise, the occurrence of negative evidence with respect to our foreigndeferred tax assets could result in an increase to the valuation allowance. Our income tax expense recorded in the future will bereduced or increased to the extent of offsetting decreases or increases to our valuation allowance.
We have also provided adequate amounts for other anticipated tax audit adjustments in the U.S., state and foreign taxjurisdictions based on our estimate of whether, and the extent to which, additional taxes and interest may be due. In addition,although specific foreign country transfer pricing exposures have not been identified, the risk of potential adjustment exists. Ifour estimate of the federal, state and foreign income tax liabilities proves to be less than the ultimate assessment, a furthercharge to expense could result. If events occur which indicate payment of these amounts is unnecessary, the liabilities would bereversed, and any related tax benefits would be recognized in the period when we determine the liabilities are no longernecessary. Any reversals of assumed tax liabilities established by acquired companies will be recorded through a reallocation ofthe purchase price.
LIQUIDITY, CAPITAL RESOURCES AND FINANCIAL CONDITIONAs of and for the fiscal year ended June 30,(dollars in millions)
2008 Change 2007 Change 2006
Cash and cash equivalents . . . . . . . . . . . . . . . . . . . . . . . . . . . . . . . $ 2,272 $ (1,348) $ 3,620 $ 51 $3,569Marketable debt securities . . . . . . . . . . . . . . . . . . . . . . . . . . . . . . . 1,038 (1,284) 2,322 1,043 1,279
Total cash, cash equivalents and marketable debt securities . . . $ 3,310 $ (2,632) $ 5,942 $ 1,094 $4,848
Percentage of total assets . . . . . . . . . . . . . . . . . . . . . . . . . . . . . . 23.1% (14.4) pts 37.5% 5.4 pts 32.1%Cash provided by operating activities . . . . . . . . . . . . . . . . . . . . . . . $ 1,329 $ 371 $ 958 $ 391 $ 567Cash provided by (used in) investing activities . . . . . . . . . . . . . . . (66) 1,011 (1,077) (1,729) 652Cash provided by (used in) financing activities . . . . . . . . . . . . . . . (2,611) (2781) 170 (129) 299
Net increase (decrease) in cash and cash equivalents . . . . . . . . . . . $(1,348) $ (1,399) $ 51 $(1,467) $1,518
Changes in Cash Flow
During fiscal 2008, our cash from operating activities was significantly impacted by the following:
• Net income of $403 million included non-cash charges of approximately $965 million, which primarily included depreciationand amortization of $476 million, amortization of acquisition-related intangible assets of $310 million and stock-basedcompensation of $214 million; and
• Decreases in cash from operating assets and liabilities of $39 million was primarily due to increases in prepaid and otherassets and inventory of $313 million which were partially offset by increases in other liabilities of $298 million.
During fiscal 2008, our cash used in investing activities of $66 million was primarily attributable to our purchase of MySQLand other acquisitions, net of cash received of $923 million, purchases of marketable debt securities of $1,333 million andpurchases of property, plant and equipment of $520 million. This use of cash was predominantly offset by cash provided by theproceeds from sales and maturities of marketable debt securities of $2,608 million. Our cash used in financing activities of$2,611 million was primarily attributable to $2,764 million paid to purchase stock under our stock repurchase program.
During fiscal 2007, our operating activities generated cash flows of $958 million, $391 million higher than the cash flowsprovided by operating activities during fiscal 2006. The following items significantly impacted our cash provided by operatingactivities during fiscal 2007:
• Net income of $473 million included $1,121 million in non-cash charges, which were comprised primarily of $517 million indepreciation and amortization, $313 million in amortization of acquisition-related intangible assets, $214 million in stock-based compensation expense; and
• Payments of $345 million associated with severance and facilities restructuring liabilities.
During fiscal 2007, our cash used in investing activities of $1,077 million was primarily attributable to $1,028 million inpurchases of marketable debt securities, net of proceeds from sales and maturities, offset by $37 million of purchases ofproperty, plant and equipment, net of proceeds from the sales of property, plant and equipment and $23 million in cash used for
38
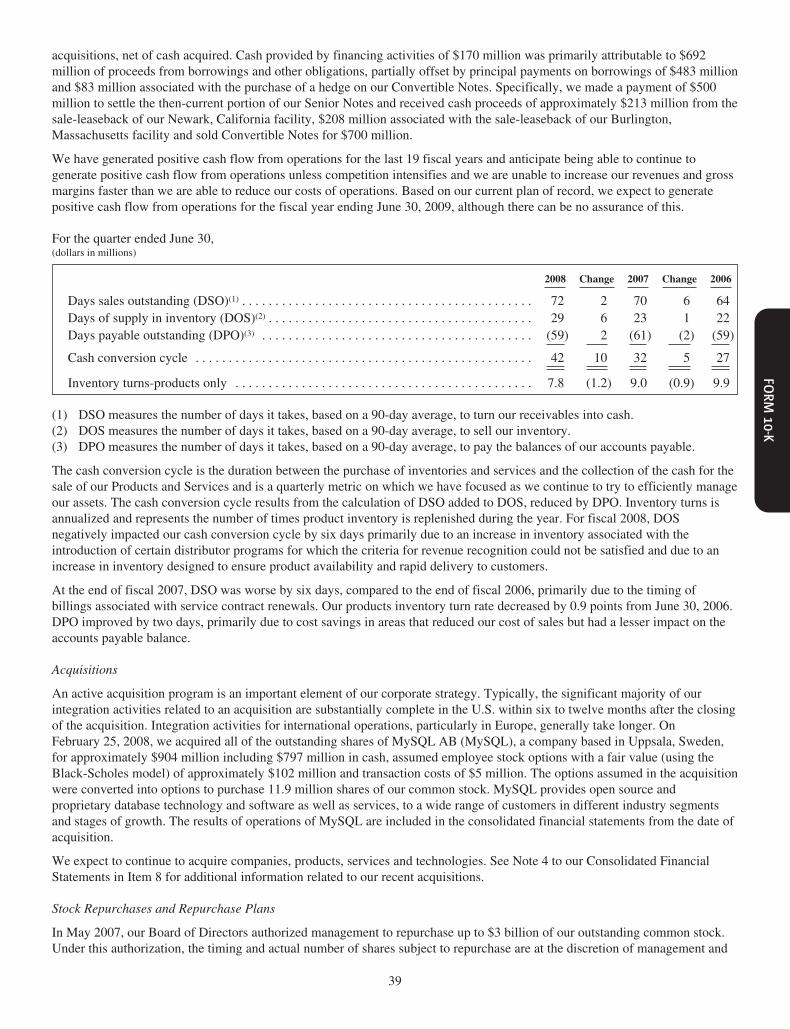
acquisitions, net of cash acquired. Cash provided by financing activities of $170 million was primarily attributable to $692million of proceeds from borrowings and other obligations, partially offset by principal payments on borrowings of $483 millionand $83 million associated with the purchase of a hedge on our Convertible Notes. Specifically, we made a payment of $500million to settle the then-current portion of our Senior Notes and received cash proceeds of approximately $213 million from thesale-leaseback of our Newark, California facility, $208 million associated with the sale-leaseback of our Burlington,Massachusetts facility and sold Convertible Notes for $700 million.
We have generated positive cash flow from operations for the last 19 fiscal years and anticipate being able to continue togenerate positive cash flow from operations unless competition intensifies and we are unable to increase our revenues and grossmargins faster than we are able to reduce our costs of operations. Based on our current plan of record, we expect to generatepositive cash flow from operations for the fiscal year ending June 30, 2009, although there can be no assurance of this.
For the quarter ended June 30,(dollars in millions)
2008 Change 2007 Change 2006
Days sales outstanding (DSO)(1) . . . . . . . . . . . . . . . . . . . . . . . . . . . . . . . . . . . . . . . . . . . . 72 2 70 6 64Days of supply in inventory (DOS)(2) . . . . . . . . . . . . . . . . . . . . . . . . . . . . . . . . . . . . . . . . 29 6 23 1 22Days payable outstanding (DPO)(3) . . . . . . . . . . . . . . . . . . . . . . . . . . . . . . . . . . . . . . . . . (59) 2 (61) (2) (59)
Cash conversion cycle . . . . . . . . . . . . . . . . . . . . . . . . . . . . . . . . . . . . . . . . . . . . . . . . . . . 42 10 32 5 27
Inventory turns-products only . . . . . . . . . . . . . . . . . . . . . . . . . . . . . . . . . . . . . . . . . . . . . 7.8 (1.2) 9.0 (0.9) 9.9
(1) DSO measures the number of days it takes, based on a 90-day average, to turn our receivables into cash.(2) DOS measures the number of days it takes, based on a 90-day average, to sell our inventory.(3) DPO measures the number of days it takes, based on a 90-day average, to pay the balances of our accounts payable.
The cash conversion cycle is the duration between the purchase of inventories and services and the collection of the cash for thesale of our Products and Services and is a quarterly metric on which we have focused as we continue to try to efficiently manageour assets. The cash conversion cycle results from the calculation of DSO added to DOS, reduced by DPO. Inventory turns isannualized and represents the number of times product inventory is replenished during the year. For fiscal 2008, DOSnegatively impacted our cash conversion cycle by six days primarily due to an increase in inventory associated with theintroduction of certain distributor programs for which the criteria for revenue recognition could not be satisfied and due to anincrease in inventory designed to ensure product availability and rapid delivery to customers.
At the end of fiscal 2007, DSO was worse by six days, compared to the end of fiscal 2006, primarily due to the timing ofbillings associated with service contract renewals. Our products inventory turn rate decreased by 0.9 points from June 30, 2006.DPO improved by two days, primarily due to cost savings in areas that reduced our cost of sales but had a lesser impact on theaccounts payable balance.
Acquisitions
An active acquisition program is an important element of our corporate strategy. Typically, the significant majority of ourintegration activities related to an acquisition are substantially complete in the U.S. within six to twelve months after the closingof the acquisition. Integration activities for international operations, particularly in Europe, generally take longer. OnFebruary 25, 2008, we acquired all of the outstanding shares of MySQL AB (MySQL), a company based in Uppsala, Sweden,for approximately $904 million including $797 million in cash, assumed employee stock options with a fair value (using theBlack-Scholes model) of approximately $102 million and transaction costs of $5 million. The options assumed in the acquisitionwere converted into options to purchase 11.9 million shares of our common stock. MySQL provides open source andproprietary database technology and software as well as services, to a wide range of customers in different industry segmentsand stages of growth. The results of operations of MySQL are included in the consolidated financial statements from the date ofacquisition.
We expect to continue to acquire companies, products, services and technologies. See Note 4 to our Consolidated FinancialStatements in Item 8 for additional information related to our recent acquisitions.
Stock Repurchases and Repurchase Plans
In May 2007, our Board of Directors authorized management to repurchase up to $3 billion of our outstanding common stock.Under this authorization, the timing and actual number of shares subject to repurchase are at the discretion of management and
39

are contingent on a number of factors, such as levels of cash generation from operations, cash requirements for acquisitions,repayment of debt and our share price. During the fiscal year ended June 30, 2008 we repurchased approximately 151 millionshares, or $2.76 billion, of common stock under this repurchase authorization.
During the fiscal year ended June 30, 2007 we repurchased approximately 9.7 million shares or $200 million of common stockunder the May 2007 repurchase authorization. During fiscal year 2006, we did not repurchase common stock under our priorrepurchase authorization announced in February 2001, which was canceled at the inception of the new plan.
All repurchases were made in compliance with Rule 10b-18 under the Securities Exchange Act of 1934, as amended.
On July 31, 2008, our Board of Directors authorized management to repurchase up to an additional $1 billion of our outstandingcommon stock. Under this authorization, the timing and actual number of shares subject to repurchase are at the discretion ofmanagement and are contingent on a number of factors, such as levels of cash generation from operations, cash requirements foracquisitions, repayment of debt and our share price.
Contractual Obligations and Contingencies
The following table summarizes our contractual obligations at June 30, 2008 (in millions):
Contractual Obligations Total
Payments Duein Less
Than 1 Year
PaymentsDue in
1-3 Years
PaymentsDue in
4-5 Years
PaymentsDue After5 Years
Senior Notes . . . . . . . . . . . . . . . . . . . . . . . . . . . . . . . . . . . . . . . . . . $ 550 $ — $550 $ — $ —Convertible Notes . . . . . . . . . . . . . . . . . . . . . . . . . . . . . . . . . . . . . . 700 — — 350 350Non-cancelable operating leases . . . . . . . . . . . . . . . . . . . . . . . . . . . 762 188 278 153 143Purchasing and manufacturing commitments . . . . . . . . . . . . . . . . . 595 595 — — —Outsourced services commitments . . . . . . . . . . . . . . . . . . . . . . . . . 16 16 — — —Interest on Senior and Convertible Notes . . . . . . . . . . . . . . . . . . . . 58 25 20 9 4Defined benefit plans . . . . . . . . . . . . . . . . . . . . . . . . . . . . . . . . . . . . 308 8 20 28 252Asset retirement obligations . . . . . . . . . . . . . . . . . . . . . . . . . . . . . . 42 8 18 6 10Other obligations(1) . . . . . . . . . . . . . . . . . . . . . . . . . . . . . . . . . . . . . 12 12 — — —
Total contractual obligations . . . . . . . . . . . . . . . . . . . . . . . . . . . . . . $3,043 $852 $886 $546 $759
(1) Other obligations include uncertain tax positions. We are unable to reliably estimate the timing of future payments of$119 million of uncertain tax positions and therefore these have been excluded from the table.
Borrowings
In August 1999, we issued $1.5 billion of unsecured senior debt securities in four tranches (the Senior Notes) of which $550million (due on August 15, 2009 and bearing interest at 7.65%) remain. Interest on the Senior Notes is payable semi-annually.We may redeem all or any part of the Senior Notes at any time at a price equal to 100% of the principal plus accrued and unpaidinterest in addition to an amount determined by a quotation agent, representing the present value of the remaining scheduledpayments. The Senior Notes are subject to compliance with certain covenants that do not contain financial ratios. We arecurrently in compliance with these covenants. In addition, we also entered into various interest-rate swap agreements to modifythe interest characteristics of the Senior Notes so that the interest associated with the Senior Notes effectively becomes variable.For our publicly traded Senior Notes, estimates of fair value are based on market prices. For our other debt, fair value iscalculated based on rates currently estimated to be available to us for debt with similar terms and remaining maturities.
Our Board of Directors has authorized our management to repurchase Senior Note debt from time to time in partial or in fulltranches based on availability of cash and market conditions. As of June 30, 2008, we have not repurchased any debt.
In January 2007, we issued $350 million principal amount of 0.625% Convertible Senior Notes due February 1, 2012 and $350million principal amount of 0.75% Convertible Senior Notes due February 1, 2014 (the Convertible Notes), to KKR PEI SolarHoldings, I, Ltd., KKR PEI Solar Holdings, II, Ltd. and Citibank, N.A. in a private placement. Each $1,000 of principal of theConvertible Notes is convertible into 34.6619 shares of our common stock (or a total of approximately 24 million shares), whichis the equivalent of $28.85 per share, subject to adjustment upon the occurrence of specified events set forth under terms of theConvertible Notes. Concurrent with the issuance of the Convertible Notes, we entered into note hedge-transactions with afinancial institution whereby we have the option to purchase up to 24 million shares of our common stock at a price of $28.85per share and we sold warrants to the same financial institution whereby they have the option to purchase up to 24 millionshares of our common stock. The separate note hedge and warrant transactions were structured to reduce the potential futureshare dilution associated with the conversion of the Convertible Notes.
40

Other Commitments
We utilize several contract manufacturers to manufacture sub-assemblies for our products and to perform final assembly andtest of finished products. These contract manufacturers acquire components and build product based on demand informationsupplied by us. We also obtain individual components for our products from a variety of individual suppliers. We acquirecomponents through a combination of purchase orders, supplier contracts and open orders based on projected demandinformation. Such purchase commitments are based on our forecasted component and manufacturing requirements and typicallyprovide for fulfillment within agreed-upon lead-times and/or commercially standard lead-times for the particular part orproduct. We estimate that these contractual obligations at June 30, 2008 were no more than $595 million and are due in less thanone year from June 30, 2008. This amount does not include contractual obligations recorded on our balance sheet as currentliabilities. Additionally, we have committed to purchase certain outsourced services where we would incur a penalty if theagreement was canceled prior to a contractual minimum term. We estimate that our contractual obligations associated withoutsourced services at June 30, 2008 were no more than $16 million. The interest on our Senior Notes reflects the net interestpayment after consideration of interest rate swap agreements that effectively makes the interest expense variable. Our variableinterest rate calculation uses the three-month LIBOR rate of approximately 2.78% as of June 30, 2008. The interest rate on ourConvertible Notes is mentioned above. Under our defined benefit plans we currently project our current obligation to be $308million using a weighted average discount rate of 4.7%. Our asset retirement obligations arise from leased facilities where wehave contractual commitments to remove leasehold improvements and return the property to a specified condition when thelease terminates. Other liabilities includes uncertain tax positions reduced U.S. deferred tax assets.
We maintain a program of insurance with third-party insurers for certain property, casualty and other risks. The policies aresubject to deductibles and exclusions that result in our retention of a level of risk on a self-insurance basis. We retain risk withregard to (i) certain loss events, such as California earthquakes and the indemnification or defense payments we, as a company,may make to or on behalf of our directors and officers as a result of obligations under applicable agreements, our by-laws andapplicable law, (ii) potential liabilities under a number of health and welfare insurance plans that we sponsor for our employeesand (iii) other potential liabilities that are not insured. The types and amounts of insurance obtained vary from time to time andfrom location to location, depending on availability, cost and our decisions with respect to risk retention. Our worldwide riskand insurance programs are regularly evaluated to seek to obtain the most favorable terms and conditions. We reserve for lossaccruals, which are primarily calculated using actuarial methods. These loss accruals include amounts for actual claims, claimgrowth and claims incurred but not yet reported. Actual experience, including claim frequency and severity as well as inflation,could result in different liabilities than the amounts currently recorded.
During the normal course of our business, we issue guarantees and letters of credit to numerous third-parties and for variouspurposes such as lease obligations, performance guarantees and state and local governmental agency requirements. At June 30,2008, we had approximately $52 million of outstanding financial letters of credit.
In the normal course of business, we may enter into contractual arrangements under which we may agree to indemnify the thirdparty to such arrangement from any losses incurred relating to the services they perform on our behalf or for losses arising fromcertain events as defined within the particular contract, which may include, for example, litigation or claims relating to pastperformance. Such indemnification obligations may not be subject to maximum loss clauses. Historically, payments maderelated to these indemnifications have not been material.
In addition, we have uncommitted lines of credit aggregating approximately $427 million. No amounts were drawn from theselines of credit as of June 30, 2008. Interest rates and other terms of borrowing under these lines of credit vary from country tocountry depending on local market conditions at the time of borrowing. There is no guarantee that the banks would approve ourrequest for funds under these uncommitted lines of credit.
In fiscal 2005, the GSA began auditing our records under the agreements it had with us at that time. A lawsuit related to theaudit and our performance under our GSA contract and other government contracts has been filed against us in the United StatesDistrict Court for the District of Arkansas. It includes claims under the Federal False Claims and Anti-Kickback Acts, as well asbreach of contract and other claims, including claims related to certain rebates, discounts and other payments or benefitsprovided by us to our resellers and technology integrators. The parties continue to discuss the nature of the government’s currentand potential claims on our GSA and other government sales. If this matter proceeds to trial, possible sanctions include anaward of damages, including treble damages, fines, penalties and other sanctions, up to and including suspension or debarmentfrom sales to the federal government. Although we are interested in pursuing an amicable resolution, we intend to present avigorous factual and legal defense throughout the course of these proceedings.
As required by Statement of Financial Accounting Standards (SFAS) No. 5, “Accounting for Contingencies,” we accrue forcontingencies when we believe that a loss is probable and that we can reasonably estimate the amount of any such loss. We havemade an assessment of the probability of incurring any such losses and such amounts are reflected in our condensed
41

consolidated financial statements. Litigation is inherently unpredictable and it is difficult to predict the outcome of particularmatters with reasonable certainty, and therefore, the actual amount of any loss may prove to be larger or smaller than theamounts reflected in our consolidated financial statements.
In fiscal 2006, as part of our service-based sales arrangement involving a governmental institution in Mexico, we were requiredto issue three guarantee bonds. The total amount of the bonds was approximately $41 million. The bonds were to be used ascollateral guaranteeing our performance under the arrangement. The bonds required a security deposit of $41 million, paid tosurety companies, which was classified as Other non-current assets, net, in our June 30, 2007 Consolidated Balance Sheet. Infiscal 2008, the security deposit of $41 million was returned to us and replaced with a cash secured letter of credit of $21million. The deposit of $21 million used to secure the letter of credit is classified as Other non-current assets, net, in ourJune 30, 2008 Consolidated Balance Sheet.
Off-Balance-Sheet Arrangements
As of June 30, 2008, we did not have any off-balance-sheet arrangements, as defined in Item 303(a)(4)(ii) of SEC RegulationS-K that have or are reasonably likely to have a current or future effect on our financial condition, changes in our financialcondition, revenues or expenses, results of operations, liquidity, capital expenditures or capital resources that is material toinvestors.
Capital Resources and Financial Condition
Our long-term strategy is to maintain a minimum amount of cash and cash equivalents in subsidiaries for operational purposesand to invest the remaining amount of our cash in interest bearing and highly liquid cash equivalents and marketable debtsecurities. At June 30, 2008, our cash and cash equivalents balance decreased to $2.3 billion. Our remaining investments of $1.0billion were held in marketable debt securities. Our cash and marketable debt securities position at June 30, 2008, wasapproximately $3.3 billion.
We believe that the liquidity provided by existing cash, cash equivalents, marketable debt securities and cash generated fromoperations will provide sufficient capital to meet our requirements for at least the next 12 months. We believe our level offinancial resources is a significant competitive factor in our industry and we may choose at any time to raise additional capital tostrengthen our financial position, facilitate growth and provide us with additional flexibility to take advantage of businessopportunities that arise.
Critical Accounting Policies
The accompanying discussion and analysis of our financial condition and results of operations are based upon our consolidatedfinancial statements, which have been prepared in accordance with generally accepted accounting principles in the U.S. (U.S.GAAP). Note 2 to the Consolidated Financial Statements in Item 8 describes the significant accounting policies and estimatesused in preparation of the Consolidated Financial Statements. Some of our accounting policies require us to make difficult andsubjective judgments, often as a result of the need to make estimates of matters that are inherently uncertain. We base ourestimates and judgments on historical experience and on various other assumptions that we believe are reasonable under thecircumstances, however, to the extent there are material differences between these estimates, judgments or assumptions and ouractual results, our financial statements will be affected. We believe the accounting policies discussed below reflect our moresignificant assumptions, estimates and judgments and are the most critical to aid in fully understanding and evaluating ourreported financial results. Our senior management has discussed the development, selection and disclosure of these criticalaccounting policies and related disclosures with the Audit Committee of our Board of Directors.
Revenue Recognition
As discussed in Note 2 to our Consolidated Financial Statements in Item 8, we enter into agreements to sell hardware, software,services and multiple deliverable arrangements that include combinations of products and/or services. Additionally, while themajority of our sales transactions contain standard business terms and conditions, there are some transactions that containnon-standard business terms and conditions. As a result, significant contract interpretation is sometimes required to determinethe appropriate accounting including: (1) whether an arrangement exists; (2) how the arrangement consideration should beallocated among the deliverables if there are multiple deliverables; (3) when to recognize revenue on the deliverables; and(4) whether undelivered elements are essential to the functionality of delivered elements. In addition, our revenue recognitionpolicy requires an assessment as to whether collectibility is reasonably assured, which requires us to evaluate thecreditworthiness of our customers. Changes in judgments on these assumptions and estimates could materially impact the timingof revenue recognition.
42
We recognize revenue as work progresses on fixed price Professional Services contracts when we can reliably evaluate progressto completion. We perform periodic analyses of these contracts in order to determine if the applicable estimates regarding totalrevenue, total cost and the extent of progress toward completion require revision. For fixed price Professional Servicescontracts, when the current estimates of total contract revenue and contract cost indicate a loss, the estimated loss is recognizedin the period the loss becomes evident. Changes in assumptions underlying these estimates and costs could materially impact thetiming of revenue recognition and loss recognition.
Distributors selling our high-end products generally purchase our products at the time an end-user is identified. Distributorsselling our higher-volume products may carry our products as inventory. We recognize revenue when we sell to our distributorsonly if all applicable revenue recognition criteria are met. These criteria include the price to the buyer being substantially fixedor determinable at the date of sale and the amount of future returns to be reasonably estimated. The revenue we recognizeassociated with channel sales transactions may require us to make estimates in several areas including: (1) the likelihood ofreturns; (2) the amount of credits we will give for subsequent changes in our price list (i.e., price protection); (3) the amount ofcredits we will give for additional discounts in certain competitive transactions (i.e., margin protection); (4) the amount of stockrotation; and (5) the creditworthiness of the distributors. When applicable, we reduce revenue in these areas using assumptionsthat are based on our historical experience. Changes in these assumptions could require us to make significant revisions to ourestimates that could materially impact the amount of net revenue recognized.
Beginning in the second quarter of fiscal 2008, we introduced programs in certain geographic markets entitling our distributorsto a reduced price on hardware when sold to the end customer with a support services contract. Accordingly, in these cases, weare no longer able to meet the criteria for revenue recognition under U.S. GAAP at the time of sale to our distributors. We havedeferred revenue on these sales until our distributors sell the hardware to the end customer.
Business Combinations
In accordance with SFAS No. 141, “Business Combinations”, we are required to allocate the purchase price of acquiredcompanies to the tangible and intangible assets acquired, liabilities assumed, as well as IPRD based on their estimated fairvalues. This valuation requires management to make significant estimates and assumptions, especially with respect to long-livedand intangible assets.
Critical estimates in valuing certain of the intangible assets include but are not limited to: relevant market sizes and growthfactors, expected industry trends, the anticipated nature and timing of new product introductions by the company and ourcompetitors, individual product sales cycles, the estimated lives of each of the products’ underlying technology, future expectedcash flows from customer contracts, customer lists, distribution agreements and acquired developed technologies and patents;expected costs to develop the IPRD into commercially viable products and estimating cash flows from the projects whencompleted; the acquired company’s brand awareness and market position, as well as assumptions about the period of time thebrand will continue to be used in the combined company’s product portfolio; and discount rates. Management’s estimates of fairvalue are based upon assumptions believed to be reasonable, but which are inherently uncertain and unpredictable. Assumptionsmay be incomplete or inaccurate and unanticipated events and circumstances may occur.
To estimate restructuring liabilities, management utilized assumptions of the number of employees that would be involuntarilyterminated and of costs associated with the disposition of duplicate or excess acquired facilities. Decreases to the estimates ofcurrently approved acquisition related restructuring plans are recorded as an adjustment to goodwill indefinitely, whereasincreases to the estimates are recorded as an adjustment to goodwill during the purchase price allocation period and as operatingexpenses thereafter.
Goodwill
Our methodology for allocating the purchase price relating to purchase acquisitions is determined through established valuationtechniques in the high-technology industry. Goodwill is measured as the excess of the cost of the acquisition over the sum of theamounts assigned to tangible and identifiable intangible assets acquired less liabilities assumed. We review goodwill forimpairment on an annual basis and whenever events or changes in circumstances indicate the carrying value of goodwill maynot be recoverable. In testing for a potential impairment of goodwill, we: (1) allocate goodwill to our various businesses towhich the acquired goodwill relates; (2) estimate the fair value of our businesses to which goodwill relates based on futureexpected discounted cash flows (income approach); and (3) determine the carrying value (book value) of those businesses, assome of the assets and liabilities related to those businesses, such as property and equipment and accounts receivable, are notheld by those businesses but by functional departments (for example, our Global Sales and Services organization andWorldwide Operations organization). Prior to this allocation of the assets to the reporting units, we are required to assess long-lived assets for impairment in accordance with SFAS 144, “Impairment of Long-Lived Assets” (SFAS 144). Furthermore, if theestimated fair value is less than the carrying value for a particular business, then we are required to estimate the fair value of all
43

identifiable assets and liabilities of the business, in a manner similar to a purchase price allocation for an acquired business.Only after this process is completed is the amount of any goodwill impairment determined.
We perform our goodwill impairment analysis at one level below the operating segment level as defined in SFAS 142. Theprocess of evaluating the potential impairment of goodwill is subjective and requires significant judgment at many points duringthe analysis. In estimating the fair value of the businesses with recognized goodwill for the purposes of our annual or periodicanalyses, we make estimates and judgments about the future cash flows of these businesses. Although our cash flow forecastsare based on assumptions that are consistent with the plans and estimates we are using to manage the underlying businesses,there is significant judgment in determining the cash flows attributable to these businesses over their estimated remaining usefullives. In addition, we make certain judgments about allocating shared assets such as accounts receivable and property andequipment to the balance sheet for those businesses. We also consider our market capitalization (adjusted for unallocatedmonetary assets such as cash, marketable debt securities and debt) on the date we perform the analysis.
At June 30, 2008, our goodwill had a carrying value of $3.2 billion. We performed our annual goodwill impairment analyses inthe fourth quarter of each of fiscal 2008, 2007 and 2006. Based on our estimates of forecasted discounted cash flows as well asour market capitalization, at each of these dates, we concluded that goodwill impairment charges were not necessary in fiscal2008, 2007 and 2006.
Other Long-lived Assets
SFAS 144 is the authoritative standard on the accounting for the impairment of other long-lived assets. In accordance withSFAS 144 and our internal accounting policy, we perform tests for impairment of intangible assets other than goodwill (OtherIntangible Assets) semi-annually and whenever events or circumstances suggest that Other Intangible Assets may be impaired.This analysis differs from our goodwill analysis in that an impairment is only deemed to have occurred if the sum of theforecasted undiscounted future cash flows related to the assets are less than the carrying value of the intangible asset we aretesting for impairment. If the forecasted cash flows are less than the carrying value, then we must write down the carrying valueto its estimated fair value. We have estimated the fair value of other intangible assets using the income approach to value theseidentifiable intangible assets which are subject to amortization.
At June 30, 2008, we had Other Intangible Assets with a carrying value of approximately $580 million. These Other IntangibleAssets consist of $565 million in acquisition-related intangible assets and $14 million in intangible assets primarily associatedwith patent licenses acquired through our settlement with Kodak. To evaluate potential impairment, SFAS 144 requires us toassess whether the future cash flows related to these assets will be greater than their carrying value at the time of the test.Accordingly, while our cash flow assumptions are consistent with the plans and estimates we are using to manage theunderlying businesses, there is significant judgment in determining the cash flows attributable to our Other Intangible Assetsover their respective estimated useful lives.
Restructuring and Impairment of Long-lived Assets
We have engaged and may continue to engage in restructuring actions and activities associated with productivity improvementinitiatives and expense reduction measures, which are accounted for under SFAS 112, “Employers’ Accounting for PostEmployment Benefits” (SFAS 112) and SFAS 146, “Accounting for Costs Associated with Exit or Disposal Activities” (SFAS146). Our restructuring actions require us to make significant estimates in several areas including: 1) realizable values of assetsmade redundant, obsolete or excess; 2) expenses for severance and other employee separation costs; 3) the ability to generatesublease income, as well as our ability to terminate lease obligations at the amounts we have estimated; and 4) other exit costs.The amounts we have accrued represent our best estimate of the obligations we expect to incur in connection with these actions,but could be subject to change due to various factors including market conditions and the outcome of negotiations with thirdparties. Should the actual amounts differ from our estimates, the amount of the restructuring charges could be materiallyimpacted.
Defined Benefit Pension Plans
We account for our defined benefit pension plans in accordance with SFAS 87, “Employers’ Accounting for Pensions”(SFAS 87) as amended by SFAS 158, “Employers’ Accounting for Defined Benefit Pension and other Postretirement Plans- AnAmendment of FASB Statements No. 87, 88, 106, and 132(R)” (SFAS 158) which requires that amounts recognized in thefinancial statements be determined on an actuarial basis. This determination involves the selection of various assumptions,including an expected rate of return on plan assets and a discount rate.
A key assumption in determining our net pension expense in accordance with SFAS 87 is the expected long-term rate of returnon plan assets. To determine the expected long-term rate of return on plan assets, we consider the current and expected assetallocations, as well as historical and expected returns on various categories of plan assets. We apply our expected rate of return
44

to a market-related value of assets, which stabilizes variability in the amounts to which we apply that expected return. While wegive appropriate consideration to recent fund performance and historical returns, the assumptions are primarily long term,prospective rates of return. Changes in the expected long-term rate could materially impact the expense and liabilities or assetsrecognized associated with our pension plans.
Another key assumption in determining our net pension expense is the assumed discount rate to be used to discount planobligations. We set the discount rate assumption annually for each of our retirement-related benefit plans at their respectivemeasurement dates to reflect the yield of a portfolio of high quality, fixed-income debt instruments that would produce cashflows sufficient in timing and amount to address projected future benefits. Changes in the expected long-term rate couldmaterially impact the expense and liabilities or assets recognized association with our pension plans.
Income Taxes
On July 1, 2007, we adopted FIN 48. See Note 10 in the Notes to Consolidated Financial Statements in Item 8 of this Form10-K for further discussion.
We must make certain estimates and judgments in determining income tax expense for financial statement purposes. Theseestimates and judgments occur in the calculation of tax credits benefits and deductions and in the calculation of certain taxassets and liabilities, which arise from differences in the timing of recognition of revenue and expense for tax and financialstatement purposes, as well as the interest and penalties relating to these uncertain tax positions. Significant changes to theseestimates may result in an increase or decrease to our tax provision in a subsequent period.
We must assess the likelihood that we will be able to recover our deferred tax assets. If recovery is not likely, we must increaseour provision for taxes by recording a valuation allowance against the deferred tax assets that we estimate will not ultimately berecoverable. We currently have provided a full valuation allowance on our U.S. deferred tax assets and a full or partial valuationallowance on certain foreign deferred tax assets. We intend to maintain these valuation allowances until sufficient positiveevidence exists to support the reversal of a valuation allowance in a specific taxing jurisdiction. Likewise, the occurrence ofnegative evidence with respect to certain of our foreign deferred tax assets could result in an increase to the valuation allowance.Our income tax expense recorded in the future will be reduced or increased to the extent of offsetting decreases or increases toour valuation allowances.
In addition, the calculation of our tax liabilities involves dealing with uncertainties in the application of complex tax regulations.As a result of the implementation of FIN 48, we recognize liabilities for uncertain tax positions based on the two-step processprescribed within the interpretation. The first step is to evaluate the tax position for recognition by determining if the weight ofavailable evidence indicates that it is more likely than not that the position will be sustained on audit, including resolution ofrelated appeals or litigation processes, if any. The second step requires us to estimate and measure the tax benefit as the largestamount that is more than 50% likely of being realized upon ultimate settlement. It is inherently difficult and subjective toestimate such amounts, as this requires us to determine the probability of various possible outcomes. We reevaluate theseuncertain tax positions on a quarterly basis. This evaluation is based on factors including, but not limited to, changes in facts orcircumstances, changes in tax law, effectively settled issues under audit and new audit activity. Such a change in recognition ormeasurement would result in the recognition of a tax benefit or an additional charge to the tax provision in the period.
Legal and Other Contingencies
We are currently involved in various claims and legal proceedings. Quarterly, we review the status of each significant matterand assess our potential financial exposure. If the potential loss from any claim or legal proceeding is considered probable andthe amount can be reasonably estimated, we accrue a liability for the estimated loss. Significant judgment is required in both thedetermination of probability and the determination as to whether an exposure is reasonably estimable. Because of uncertaintiesrelated to these matters, accruals are based only on the best information available at the time. As additional informationbecomes available, we reassess the potential liability related to our pending claims and litigation and may revise our estimates.Such revisions in the estimates of the potential liabilities could have a material impact on our results of operations and financialposition.
Stock-Based Compensation
We account for share-based payments to employees, including grants of employee stock awards and purchases under employeestock purchase plans in accordance with FASB Statement No. 123 (revised 2004), Share-Based Payment, which requires thatshare-based payments (to the extent they are compensatory) be recognized in our Consolidated Statements of Operations basedon their fair values. In addition, we have applied the provisions of the SEC’s Staff Accounting Bulletin No. 107 in ouraccounting for Statement 123(R).
45

We are required to estimate the stock awards that we ultimately expect to vest and to reduce stock-based compensation expensefor the effects of estimated forfeitures of awards over the expense recognition period. Although we estimate forfeitures based onhistorical experience, actual forfeitures in the future may differ. In addition, to the extent our actual forfeitures are different thanour estimates, we record a true-up for the difference in the period that the awards vest, and such true-ups could materially affectour operating results.
As required by Statement 123(R), we recognize stock-based compensation expense for share-based payments issued or assumedafter June 1, 2006 that are expected to vest. For all share-based payments granted or assumed beginning June 1, 2006, werecognize stock-based compensation expense on a straight-line basis over the service period of the award, which is generallyfour years. The fair value of the unvested portion of share-based payments granted prior to June 1, 2006 is recognized over theremaining service period using the accelerated expense attribution method, net of estimated forfeitures. In determining whetheran award is expected to vest, we use an estimated, forward-looking forfeiture rate based upon our historical forfeiture rates.Stock-based compensation expense recorded using an estimated forfeiture rate is updated for actual forfeitures quarterly. Wealso consider, each quarter, whether there have been any significant changes in facts and circumstances that would affect ourforfeiture rate.
We estimate the fair value of employee stock options using a Black-Scholes valuation model. The fair value of an award isaffected by our stock price on the date of grant as well as other assumptions including the estimated volatility of our stock priceover the term of the awards and the estimated period of time that we expect employees to hold their stock options. The risk-freeinterest rate assumption we use is based upon United States treasury interest rates appropriate for the expected life of theawards. We use the combination of historical volatility of our stock and implied volatility of our publicly traded, longest-termoptions in order to estimate future stock price trends as we believe that this combination is more representative of future stockprice trends than historical or implied volatility on a stand-alone basis. In order to determine the estimated period of time thatwe expect employees to hold their stock options, we have used historical rates of employee groups by job classification. Ourexpected dividend rate is zero since we do not currently pay cash dividends on our common stock and do not anticipate doing soin the foreseeable future. The aforementioned inputs entered into the option valuation model we use to fair value our stockawards are subjective estimates and changes to these estimates will cause the fair value of our stock awards and related stock-based compensation expense we record to vary.
We record deferred tax assets for stock-based awards that result in deductions on our income tax returns, based on the amount ofstock-based compensation recognized. In addition, differences between the deferred tax assets recognized for financial reportingpurposes and the actual tax deduction reported on our income tax returns are recorded in additional paid-in capital. If the taxdeduction is less than the deferred tax asset, such shortfalls reduce our pool of excess tax benefits. If the pool of excess taxbenefits is reduced to zero, then subsequent shortfalls would increase our income tax expense.
To the extent we change the terms of our employee stock-based compensation programs or refine different assumptions infuture periods such as forfeiture rates that differ from our estimates, the stock-based compensation expense that we record infuture periods and the tax benefits that we realize may differ significantly from what we have recorded in previous reportingperiods.
RECENT ACCOUNTING PRONOUNCEMENTS
See Note 2 to the Consolidated Financial Statements in Item 8 for a description of certain other recent accountingpronouncements including the expected dates of adoption and effects on our results of operations and financial condition.
NON-AUDIT SERVICES OF INDEPENDENT REGISTERED PUBLIC ACCOUNTING FIRM
Our Audit Committee has pre-approved all non-audit services including tax compliance services.
ITEM 7A. QUANTITATIVE AND QUALITATIVE DISCLOSURES ABOUTMARKET RISK
We are exposed to market risk related to changes in interest rates, foreign currency exchange rates and equity security prices. Tomitigate some of these risks, we utilize derivative financial instruments to hedge these exposures. We do not use derivativefinancial instruments for speculative or trading purposes. All of the potential changes noted below are based on sensitivityanalyses performed on our financial position at June 30, 2008. Actual results may differ materially.
Interest Rate Sensitivity
Our debt investment portfolio consists primarily of fixed income instruments with an average duration of 0.16 years, 0.25 yearsand 0.21 years as of June 30, 2008, 2007 and 2006, respectively. The decrease in the average duration of our portfolio atJune 30, 2008, as compared to June 30, 2007, was due to the decision to maintain short positions in anticipation of the stock
46

repurchase program and due to the liquidation of securities in order to repatriate $1 billion of foreign earnings. The increase inthe average duration of our portfolio at June 30, 2007, as compared to June 30, 2006, was due to the increase in our averagecash and marketable debt security positions. The primary objective of our investments in debt securities is to preserve principalwhile maximizing yields, without significantly increasing risk. These available-for-sale securities are subject to interest raterisk. The fair market value of these securities may fluctuate with changes in interest rates. A sensitivity analysis was performedon this investment portfolio based on a modeling technique that measures the hypothetical fair market value changes (using athree month horizon) that would result from a parallel shift in the yield curve of plus 150 basis points (BPS). Based on thisanalysis, for example, a hypothetical 150 BPS increase in interest rates would result in an approximate $6 million decrease inthe fair value of our investments in debt securities as of June 30, 2008, as compared with a $20 million decrease as of June 30,2007.
We also entered into various interest-rate swap agreements to modify the interest characteristics of the Senior Notes so that theinterest payable on the Senior Notes effectively becomes variable and thus matches the shorter-term rates received from ourcash and marketable securities. Accordingly, interest rate fluctuations impact the fair value of our Senior Notes outstanding,which will be offset by corresponding changes in the fair value of the swap agreements. However, by entering into these swapagreements, we have a cash flow exposure related to the risk that interest rates may increase. For example, at June 30, 2008, ahypothetical 150 BPS increase in interest rates would result in an approximate $8 million increase in interest expense over aone-year period.
Foreign Currency Exchange Risk
Our revenue, expense and capital purchasing activities are primarily transacted in U.S. dollars. However, since a portion of ouroperations consist of manufacturing and sales activities outside the U.S., we enter into transactions in other currencies. We areprimarily exposed to changes in exchange rates for the Euro, Japanese yen and British pound.
We are a net receiver of currencies other than the U.S. dollar and, as such, can benefit from a weaker dollar and can beadversely affected by a stronger dollar relative to major currencies worldwide. Accordingly, changes in exchange rates and inparticular a strengthening of the U.S. dollar, may adversely affect our consolidated sales and operating margins as expressed inU.S. dollars. To minimize currency exposure gains and losses, we often borrow funds in local currencies, enter into forwardexchange contracts, purchase foreign currency options and promote natural hedges by purchasing components and incurringexpenses in local currencies. Currently, we have no plans to discontinue our hedging programs, however, we continuallyevaluate the benefits of our hedging strategies and may choose to discontinue them in the future.
Based on our foreign currency exchange instruments outstanding at June 30, 2008, we estimate a maximum potential one-dayloss in fair value of approximately $2 million, as compared with $3 million as of June 30, 2007, using a Value-at-Risk (VAR)model. The VAR model estimates were made assuming normal market conditions and a 95% confidence level. We used aMonte Carlo simulation type model that valued foreign currency instruments against three thousand randomly generated marketprice paths. Anticipated transactions, firm commitments, receivables and accounts payable denominated in foreign currencieswere excluded from the model. The VAR model is a risk estimation tool and as such is not intended to represent actual losses infair value that will be incurred by us. Additionally, as we utilize foreign currency instruments for hedging anticipated and firmlycommitted transactions, a loss in fair value for those instruments is generally offset by increases in the value of the underlyingexposure.
Equity Security Price Risk
We are exposed to price fluctuations on the marketable portion of equity securities included in our portfolio of equityinvestments. These investments are generally in companies in the high-technology industry sector, many of which are smallcapitalization stocks. We typically do not attempt to reduce or eliminate the market exposure on these securities. A 20% adversechange in equity prices would result in an approximate $6 million decrease in the fair value of our available-for-sale equityinvestments as of June 30, 2008, as compared with $5 million as of June 30, 2007. At June 30, 2008 and 2007, two equitysecurities represented substantially all of the $27 million and $37 million total fair value of the marketable equity securities,respectively. Refer to Note 2 to the Consolidated Financial Statements in Item 8 for additional discussion on our marketableequity securities.
47

ITEM 8. FINANCIAL STATEMENTS AND SUPPLEMENTARY DATA
INDEX TO CONSOLIDATED FINANCIAL STATEMENTS
Page
Consolidated Financial Statements of Sun Microsystems, Inc.:Consolidated Statements of Operations for each of the three years in the period ended June 30, 2008 . . . . . . . . . . . . . . . 49Consolidated Balance Sheets at June 30, 2008 and June 30, 2007 . . . . . . . . . . . . . . . . . . . . . . . . . . . . . . . . . . . . . . . . . . . 50Consolidated Statements of Cash Flows for each of the three years in the period ended June 30, 2008 . . . . . . . . . . . . . . 51Consolidated Statements of Stockholders’ Equity for each of the three years in the period ended June 30, 2008 . . . . . . 52Notes to Consolidated Financial Statements . . . . . . . . . . . . . . . . . . . . . . . . . . . . . . . . . . . . . . . . . . . . . . . . . . . . . . . . . . . . 53Reports of Independent Registered Public Accounting Firm . . . . . . . . . . . . . . . . . . . . . . . . . . . . . . . . . . . . . . . . . . . . . . . 89
Schedules not listed above have been omitted since they are not applicable or are not required, or the information required to beset forth therein is included in the Consolidated Financial Statements or Notes thereto.
48
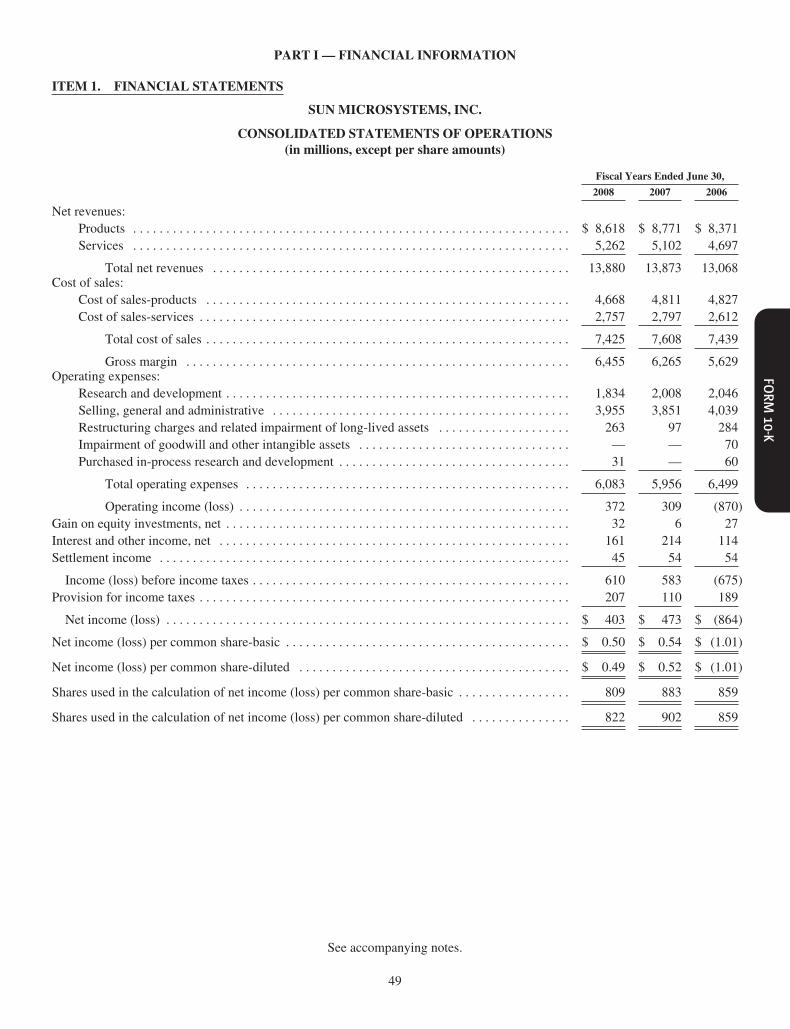
PART I — FINANCIAL INFORMATION
ITEM 1. FINANCIAL STATEMENTS
SUNMICROSYSTEMS, INC.
CONSOLIDATED STATEMENTS OF OPERATIONS(in millions, except per share amounts)
Fiscal Years Ended June 30,
2008 2007 2006
Net revenues:Products . . . . . . . . . . . . . . . . . . . . . . . . . . . . . . . . . . . . . . . . . . . . . . . . . . . . . . . . . . . . . . . . . . $ 8,618 $ 8,771 $ 8,371Services . . . . . . . . . . . . . . . . . . . . . . . . . . . . . . . . . . . . . . . . . . . . . . . . . . . . . . . . . . . . . . . . . . 5,262 5,102 4,697
Total net revenues . . . . . . . . . . . . . . . . . . . . . . . . . . . . . . . . . . . . . . . . . . . . . . . . . . . . . . 13,880 13,873 13,068Cost of sales:
Cost of sales-products . . . . . . . . . . . . . . . . . . . . . . . . . . . . . . . . . . . . . . . . . . . . . . . . . . . . . . . 4,668 4,811 4,827Cost of sales-services . . . . . . . . . . . . . . . . . . . . . . . . . . . . . . . . . . . . . . . . . . . . . . . . . . . . . . . . 2,757 2,797 2,612
Total cost of sales . . . . . . . . . . . . . . . . . . . . . . . . . . . . . . . . . . . . . . . . . . . . . . . . . . . . . . . 7,425 7,608 7,439
Gross margin . . . . . . . . . . . . . . . . . . . . . . . . . . . . . . . . . . . . . . . . . . . . . . . . . . . . . . . . . . 6,455 6,265 5,629Operating expenses:
Research and development . . . . . . . . . . . . . . . . . . . . . . . . . . . . . . . . . . . . . . . . . . . . . . . . . . . . 1,834 2,008 2,046Selling, general and administrative . . . . . . . . . . . . . . . . . . . . . . . . . . . . . . . . . . . . . . . . . . . . . 3,955 3,851 4,039Restructuring charges and related impairment of long-lived assets . . . . . . . . . . . . . . . . . . . . 263 97 284Impairment of goodwill and other intangible assets . . . . . . . . . . . . . . . . . . . . . . . . . . . . . . . . — — 70Purchased in-process research and development . . . . . . . . . . . . . . . . . . . . . . . . . . . . . . . . . . . 31 — 60
Total operating expenses . . . . . . . . . . . . . . . . . . . . . . . . . . . . . . . . . . . . . . . . . . . . . . . . . 6,083 5,956 6,499
Operating income (loss) . . . . . . . . . . . . . . . . . . . . . . . . . . . . . . . . . . . . . . . . . . . . . . . . . . 372 309 (870)Gain on equity investments, net . . . . . . . . . . . . . . . . . . . . . . . . . . . . . . . . . . . . . . . . . . . . . . . . . . . . 32 6 27Interest and other income, net . . . . . . . . . . . . . . . . . . . . . . . . . . . . . . . . . . . . . . . . . . . . . . . . . . . . . 161 214 114Settlement income . . . . . . . . . . . . . . . . . . . . . . . . . . . . . . . . . . . . . . . . . . . . . . . . . . . . . . . . . . . . . . 45 54 54
Income (loss) before income taxes . . . . . . . . . . . . . . . . . . . . . . . . . . . . . . . . . . . . . . . . . . . . . . . . 610 583 (675)Provision for income taxes . . . . . . . . . . . . . . . . . . . . . . . . . . . . . . . . . . . . . . . . . . . . . . . . . . . . . . . . 207 110 189
Net income (loss) . . . . . . . . . . . . . . . . . . . . . . . . . . . . . . . . . . . . . . . . . . . . . . . . . . . . . . . . . . . . . $ 403 $ 473 $ (864)
Net income (loss) per common share-basic . . . . . . . . . . . . . . . . . . . . . . . . . . . . . . . . . . . . . . . . . . . $ 0.50 $ 0.54 $ (1.01)
Net income (loss) per common share-diluted . . . . . . . . . . . . . . . . . . . . . . . . . . . . . . . . . . . . . . . . . $ 0.49 $ 0.52 $ (1.01)
Shares used in the calculation of net income (loss) per common share-basic . . . . . . . . . . . . . . . . . 809 883 859
Shares used in the calculation of net income (loss) per common share-diluted . . . . . . . . . . . . . . . 822 902 859
See accompanying notes.
49
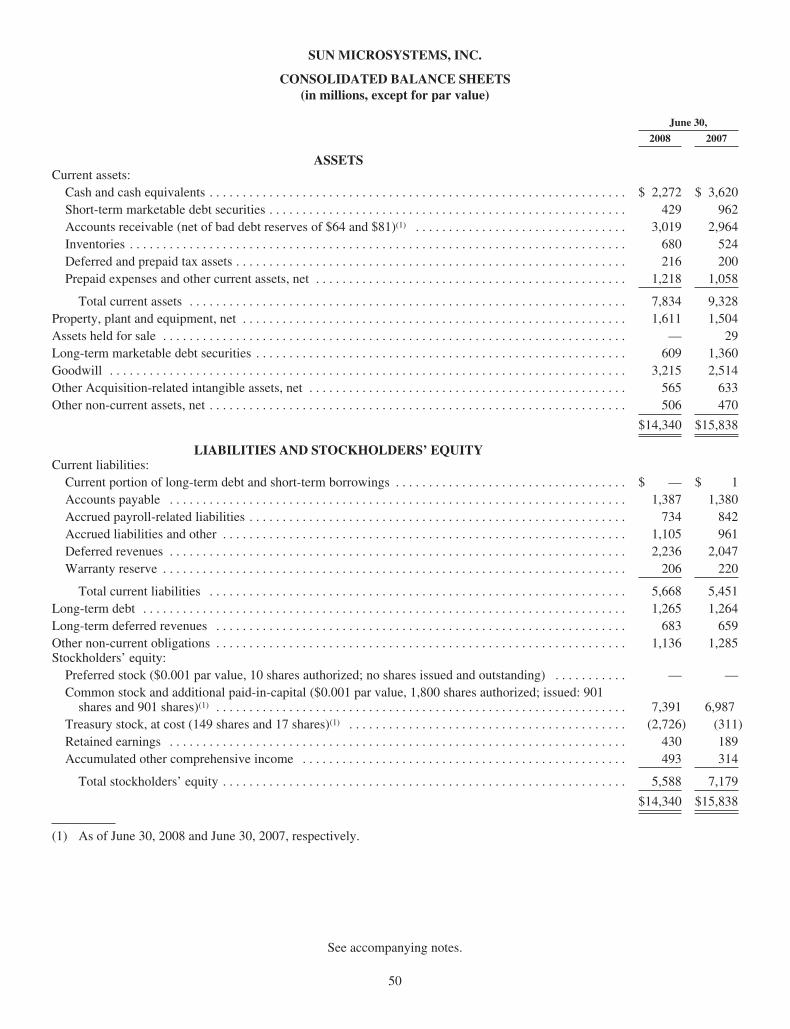
SUN MICROSYSTEMS, INC.
CONSOLIDATED BALANCE SHEETS(in millions, except for par value)
June 30,
2008 2007
ASSETSCurrent assets:Cash and cash equivalents . . . . . . . . . . . . . . . . . . . . . . . . . . . . . . . . . . . . . . . . . . . . . . . . . . . . . . . . . . . . . . . $ 2,272 $ 3,620Short-term marketable debt securities . . . . . . . . . . . . . . . . . . . . . . . . . . . . . . . . . . . . . . . . . . . . . . . . . . . . . . 429 962Accounts receivable (net of bad debt reserves of $64 and $81)(1) . . . . . . . . . . . . . . . . . . . . . . . . . . . . . . . . 3,019 2,964Inventories . . . . . . . . . . . . . . . . . . . . . . . . . . . . . . . . . . . . . . . . . . . . . . . . . . . . . . . . . . . . . . . . . . . . . . . . . . . 680 524Deferred and prepaid tax assets . . . . . . . . . . . . . . . . . . . . . . . . . . . . . . . . . . . . . . . . . . . . . . . . . . . . . . . . . . . 216 200Prepaid expenses and other current assets, net . . . . . . . . . . . . . . . . . . . . . . . . . . . . . . . . . . . . . . . . . . . . . . . 1,218 1,058
Total current assets . . . . . . . . . . . . . . . . . . . . . . . . . . . . . . . . . . . . . . . . . . . . . . . . . . . . . . . . . . . . . . . . . . 7,834 9,328Property, plant and equipment, net . . . . . . . . . . . . . . . . . . . . . . . . . . . . . . . . . . . . . . . . . . . . . . . . . . . . . . . . . . 1,611 1,504Assets held for sale . . . . . . . . . . . . . . . . . . . . . . . . . . . . . . . . . . . . . . . . . . . . . . . . . . . . . . . . . . . . . . . . . . . . . . — 29Long-term marketable debt securities . . . . . . . . . . . . . . . . . . . . . . . . . . . . . . . . . . . . . . . . . . . . . . . . . . . . . . . . 609 1,360Goodwill . . . . . . . . . . . . . . . . . . . . . . . . . . . . . . . . . . . . . . . . . . . . . . . . . . . . . . . . . . . . . . . . . . . . . . . . . . . . . . 3,215 2,514Other Acquisition-related intangible assets, net . . . . . . . . . . . . . . . . . . . . . . . . . . . . . . . . . . . . . . . . . . . . . . . . 565 633Other non-current assets, net . . . . . . . . . . . . . . . . . . . . . . . . . . . . . . . . . . . . . . . . . . . . . . . . . . . . . . . . . . . . . . . 506 470
$14,340 $15,838
LIABILITIES AND STOCKHOLDERS’ EQUITYCurrent liabilities:Current portion of long-term debt and short-term borrowings . . . . . . . . . . . . . . . . . . . . . . . . . . . . . . . . . . . $ — $ 1Accounts payable . . . . . . . . . . . . . . . . . . . . . . . . . . . . . . . . . . . . . . . . . . . . . . . . . . . . . . . . . . . . . . . . . . . . . 1,387 1,380Accrued payroll-related liabilities . . . . . . . . . . . . . . . . . . . . . . . . . . . . . . . . . . . . . . . . . . . . . . . . . . . . . . . . . 734 842Accrued liabilities and other . . . . . . . . . . . . . . . . . . . . . . . . . . . . . . . . . . . . . . . . . . . . . . . . . . . . . . . . . . . . . 1,105 961Deferred revenues . . . . . . . . . . . . . . . . . . . . . . . . . . . . . . . . . . . . . . . . . . . . . . . . . . . . . . . . . . . . . . . . . . . . . 2,236 2,047Warranty reserve . . . . . . . . . . . . . . . . . . . . . . . . . . . . . . . . . . . . . . . . . . . . . . . . . . . . . . . . . . . . . . . . . . . . . . 206 220
Total current liabilities . . . . . . . . . . . . . . . . . . . . . . . . . . . . . . . . . . . . . . . . . . . . . . . . . . . . . . . . . . . . . . . 5,668 5,451Long-term debt . . . . . . . . . . . . . . . . . . . . . . . . . . . . . . . . . . . . . . . . . . . . . . . . . . . . . . . . . . . . . . . . . . . . . . . . . 1,265 1,264Long-term deferred revenues . . . . . . . . . . . . . . . . . . . . . . . . . . . . . . . . . . . . . . . . . . . . . . . . . . . . . . . . . . . . . . 683 659Other non-current obligations . . . . . . . . . . . . . . . . . . . . . . . . . . . . . . . . . . . . . . . . . . . . . . . . . . . . . . . . . . . . . . 1,136 1,285Stockholders’ equity:Preferred stock ($0.001 par value, 10 shares authorized; no shares issued and outstanding) . . . . . . . . . . . — —Common stock and additional paid-in-capital ($0.001 par value, 1,800 shares authorized; issued: 901shares and 901 shares)(1) . . . . . . . . . . . . . . . . . . . . . . . . . . . . . . . . . . . . . . . . . . . . . . . . . . . . . . . . . . . . . . 7,391 6,987
Treasury stock, at cost (149 shares and 17 shares)(1) . . . . . . . . . . . . . . . . . . . . . . . . . . . . . . . . . . . . . . . . . . (2,726) (311)Retained earnings . . . . . . . . . . . . . . . . . . . . . . . . . . . . . . . . . . . . . . . . . . . . . . . . . . . . . . . . . . . . . . . . . . . . . 430 189Accumulated other comprehensive income . . . . . . . . . . . . . . . . . . . . . . . . . . . . . . . . . . . . . . . . . . . . . . . . . 493 314
Total stockholders’ equity . . . . . . . . . . . . . . . . . . . . . . . . . . . . . . . . . . . . . . . . . . . . . . . . . . . . . . . . . . . . . 5,588 7,179
$14,340 $15,838
(1) As of June 30, 2008 and June 30, 2007, respectively.
See accompanying notes.
50

SUN MICROSYSTEMS, INC.
CONSOLIDATED STATEMENTS OF CASH FLOWS(in millions)
Fiscal Year Ended June 30,
2008 2007 2006
Cash flows from operating activities:Net income (loss) . . . . . . . . . . . . . . . . . . . . . . . . . . . . . . . . . . . . . . . . . . . . . . . . . . . . . . . . . . . . . . $ 403 $ 473 $ (864)Adjustments to reconcile net income (loss) to net cash provided by operating activities: . . . . . .Depreciation and amortization . . . . . . . . . . . . . . . . . . . . . . . . . . . . . . . . . . . . . . . . . . . . . . . . . . 476 517 575Amortization of acquisition-related intangible assets . . . . . . . . . . . . . . . . . . . . . . . . . . . . . . . . 310 313 330Stock-based compensation expense . . . . . . . . . . . . . . . . . . . . . . . . . . . . . . . . . . . . . . . . . . . . . . 214 214 225Purchased in-process research and development . . . . . . . . . . . . . . . . . . . . . . . . . . . . . . . . . . . . 31 — 60Gain on investments and other, net . . . . . . . . . . . . . . . . . . . . . . . . . . . . . . . . . . . . . . . . . . . . . . (68) (42) (10)Impairment of long-lived assets, net . . . . . . . . . . . . . . . . . . . . . . . . . . . . . . . . . . . . . . . . . . . . . — 16 155Tax provisions for employee stock plans . . . . . . . . . . . . . . . . . . . . . . . . . . . . . . . . . . . . . . . . . . — 29 —Deferred taxes . . . . . . . . . . . . . . . . . . . . . . . . . . . . . . . . . . . . . . . . . . . . . . . . . . . . . . . . . . . . . . 2 74 (19)Changes in operating assets and liabilities: . . . . . . . . . . . . . . . . . . . . . . . . . . . . . . . . . . . . . . . .Accounts receivable, net . . . . . . . . . . . . . . . . . . . . . . . . . . . . . . . . . . . . . . . . . . . . . . . . . . . . (9) (241) (163)Inventories . . . . . . . . . . . . . . . . . . . . . . . . . . . . . . . . . . . . . . . . . . . . . . . . . . . . . . . . . . . . . . . (148) (6) 44Prepaid and other assets . . . . . . . . . . . . . . . . . . . . . . . . . . . . . . . . . . . . . . . . . . . . . . . . . . . . . (165) (191) 172Accounts payable . . . . . . . . . . . . . . . . . . . . . . . . . . . . . . . . . . . . . . . . . . . . . . . . . . . . . . . . . . (15) (8) 130Other liabilities . . . . . . . . . . . . . . . . . . . . . . . . . . . . . . . . . . . . . . . . . . . . . . . . . . . . . . . . . . . . 298 (190) (68)
Net cash provided by operating activities . . . . . . . . . . . . . . . . . . . . . . . . . . . . . . . . . . . . . . . . . . . . . 1,329 958 567
Cash flows from investing activities:Decrease (increase) in restricted cash . . . . . . . . . . . . . . . . . . . . . . . . . . . . . . . . . . . . . . . . . . . . . . 17 (5) (69)Purchases of marketable debt securities . . . . . . . . . . . . . . . . . . . . . . . . . . . . . . . . . . . . . . . . . . . . . (1,333) (3,088) (1,831)Proceeds from sales of marketable debt securities . . . . . . . . . . . . . . . . . . . . . . . . . . . . . . . . . . . . . 1,550 1,335 5,434Proceeds from maturities of marketable debt securities . . . . . . . . . . . . . . . . . . . . . . . . . . . . . . . . 1,058 725 580Proceeds from sales of equity investments, net . . . . . . . . . . . . . . . . . . . . . . . . . . . . . . . . . . . . . . . 32 16 15Purchases of property, plant and equipment, net . . . . . . . . . . . . . . . . . . . . . . . . . . . . . . . . . . . . . . (520) (488) (315)Proceeds from sales of property, plant and equipment . . . . . . . . . . . . . . . . . . . . . . . . . . . . . . . . . 79 451 —Payments for acquisitions, net of cash acquired . . . . . . . . . . . . . . . . . . . . . . . . . . . . . . . . . . . . . . (949) (23) (3,162)
Net cash provided by (used in) investing activities . . . . . . . . . . . . . . . . . . . . . . . . . . . . . . . . . . . . . . (66) (1,077) 652
Cash flows from financing activities:Purchase of common stock call options . . . . . . . . . . . . . . . . . . . . . . . . . . . . . . . . . . . . . . . . . . . . . — (228) —Sale of common stock warrants . . . . . . . . . . . . . . . . . . . . . . . . . . . . . . . . . . . . . . . . . . . . . . . . . . . — 145 —Proceeds from exercise of options and ESPP purchases . . . . . . . . . . . . . . . . . . . . . . . . . . . . . . . . 177 244 249Proceeds from issuance of convertible notes, net . . . . . . . . . . . . . . . . . . . . . . . . . . . . . . . . . . . . . — 692 —Proceeds from (principal payments on) borrowings and other obligations . . . . . . . . . . . . . . . . . . (24) (483) 50Purchases of common stock under 2007 Stock Repurchase Plan . . . . . . . . . . . . . . . . . . . . . . . . . (2,764) (200) —
Net cash provided by (used in) financing activities . . . . . . . . . . . . . . . . . . . . . . . . . . . . . . . . . . . . . . (2,611) 170 299
Net increase (decrease) in cash and cash equivalents . . . . . . . . . . . . . . . . . . . . . . . . . . . . . . . . . . . . (1,348) 51 1,518Cash and cash equivalents, beginning of year . . . . . . . . . . . . . . . . . . . . . . . . . . . . . . . . . . . . . . . . . . 3,620 3,569 2,051
Cash and cash equivalents, end of year . . . . . . . . . . . . . . . . . . . . . . . . . . . . . . . . . . . . . . . . . . . . . . . $ 2,272 $ 3,620 $ 3,569
Supplemental Disclosures of Cash Flow Information:Interest Paid (net of interest received from swap agreements of $8, $13 and $34 in fiscal 2008,2007 and 2006, respectively) . . . . . . . . . . . . . . . . . . . . . . . . . . . . . . . . . . . . . . . . . . . . . . . . . . . $ 39 $ 48 $ 46
Income taxes paid (net of refunds of $91, $76 and $196 in fiscal 2008, 2007 and 2006,respectively) . . . . . . . . . . . . . . . . . . . . . . . . . . . . . . . . . . . . . . . . . . . . . . . . . . . . . . . . . . . . . . . . $ 87 $ 182 $ 74
Supplemental schedule of non-cash investing activities:Stock options issued in connection with the acquisitions . . . . . . . . . . . . . . . . . . . . . . . . . . . . . . . $ 102 $ — $ 88Net issuance of restricted stock awards . . . . . . . . . . . . . . . . . . . . . . . . . . . . . . . . . . . . . . . . . . . . . $ 196 $ 194 $ 183
See accompanying notes.
51

SUN MICROSYSTEMS, INC.
CONSOLIDATED STATEMENTS OF STOCKHOLDERS’ EQUITY(in millions)
Common Stockand AdditionalPaid-in-Capital Treasury Stock
RetainedEarnings
(AccumulatedDeficit)
AccumulatedOther
ComprehensiveIncome
TotalStockholders’
EquityShares Amount Shares Amount
Balances as of June 30, 2005 . . . . . . . . . . . . . . . . . . 901 $6,490 (49) $(1,411) $1,387 $208 $ 6,674Net loss . . . . . . . . . . . . . . . . . . . . . . . . . . . . . . . . . . — — — — (864) — (864)Change in unrealized gain on investments, net oftaxes . . . . . . . . . . . . . . . . . . . . . . . . . . . . . . . . . . . — — — — — (2) (2)
Change in unrealized gain on derivativeinstruments and other, net of taxes . . . . . . . . . . . — — — — — (22) (22)
Translation adjustments . . . . . . . . . . . . . . . . . . . . . . — — — — — (4) (4)
Total comprehensive loss . . . . . . . . . . . . . . . . . . . . — — — — — — (892)Issuance of stock, net of repurchases . . . . . . . . . . . — — 24 1,029 (780) — 249Issuance of common stock and assumption of stockoptions in connection with acquisitions . . . . . . . — 88 — — — — 88
Stock based compensation . . . . . . . . . . . . . . . . . . . . — 225 — — — — 225
Balances as of June 30, 2006 . . . . . . . . . . . . . . . . . . 901 6,803 (25) (382) (257) 180 6,344Net income . . . . . . . . . . . . . . . . . . . . . . . . . . . . . . . . — — — — 473 — 473Change in unrealized gain on investments, net oftaxes . . . . . . . . . . . . . . . . . . . . . . . . . . . . . . . . . . . — — — — — 2 2
Change in unrealized gain on derivativeinstruments and other, net of taxes . . . . . . . . . . . — — — — — (11) (11)
Translation adjustments . . . . . . . . . . . . . . . . . . . . . . — — — — — 143 143
Total comprehensive income . . . . . . . . . . . . . . . . . . — — — — — — 607Issuance of stock, net of repurchases . . . . . . . . . . . — — 8 71 (27) — 44Purchases of Convertible Notes call options . . . . . . — (228) — — — — (228)Issuance of Convertible Notes warrants . . . . . . . . . — 145 — — — — 145Stock based compensation . . . . . . . . . . . . . . . . . . . . — 214 — — — — 214Tax benefit from employee stock transactions andother . . . . . . . . . . . . . . . . . . . . . . . . . . . . . . . . . . . — 53 — — — — 53
Balances as of June 30, 2007 . . . . . . . . . . . . . . . . . . 901 6,987 (17) (311) 189 314 7,179Net income . . . . . . . . . . . . . . . . . . . . . . . . . . . . . . . . — — — — 403 — 403Change in unrealized loss on investments, net oftaxes . . . . . . . . . . . . . . . . . . . . . . . . . . . . . . . . . . . — — — — — (24) (24)
Change in unrealized loss on derivativeinstruments and other, net of taxes . . . . . . . . . . . — — — — — (4) (4)
Change in minimum pension obligation . . . . . . . . . — — — — — 38 38Translation adjustments . . . . . . . . . . . . . . . . . . . . . . — — — — — 169 169
Total comprehensive income . . . . . . . . . . . . . . . . . . — — — — — — 582Cumulative effect of adoption of FIN 48 . . . . . . . . — — — — 9 — 9Issuance of stock, net of repurchases . . . . . . . . . . . — — (132) (2,415) (171) — (2,586)Issuance of common stock and assumption of stockoptions in connection with acquisitions . . . . . . . — 102 — — — — 102
Stock based compensation . . . . . . . . . . . . . . . . . . . . — 214 — — — — 214Tax benefit from employee stock transactions andother . . . . . . . . . . . . . . . . . . . . . . . . . . . . . . . . . . . — 88 — — — — 88
Balances as of June 30, 2008 . . . . . . . . . . . . . . . . . . 901 $7,391 (149) $(2,726) $ 430 $493 $ 5,588
See accompanying notes.
52

SUN MICROSYSTEMS, INC.
NOTES TO CONSOLIDATED FINANCIAL STATEMENTS
1. Description of Business
We provide network computing infrastructure solutions that include core brands such as the Java technology platform, theSolaris Operating System, the MySQL database management system, Sun StorageTek storage solutions and the UltraSPARCprocessor. Our network computing platforms are used by search, social networking, entertainment, financial services,manufacturing, healthcare, retail, news, energy and engineering companies. Our products and services address the complexinformation technology issues facing customers today, including increasing demands for network access, bandwidth andstorage. We share these innovations with some of the most innovative technology companies in the world.
2. Summary of Significant Accounting Policies
Basis of Presentation
Our consolidated financial statements include our accounts and the accounts of our subsidiaries. Intercompany accounts andtransactions have been eliminated. We completed our acquisition of MySQL on February 25, 2008 and have included theseresults in our consolidated financial statements since the acquisition date. We completed the acquisitions of StorageTek andSeeBeyond Technology Corporation (SeeBeyond) on August 31, 2005 and August 25, 2005, respectively. See Note 4 for furtherdetails.
Our consolidated financial statements have been prepared in accordance with generally accepted accounting principles in theUnited States (U.S. GAAP). The preparation of these financial statements requires us to make estimates and judgments thataffect the reported amounts in the consolidated financial statements and accompanying notes. We base our estimates andjudgments on historical experience and on various other assumptions that we believe are reasonable under the circumstances.These estimates are based on management’s knowledge about current events and expectation about actions we may undertake inthe future. Actual results could differ materially from those estimates.
Cash Equivalents
Cash equivalents consist primarily of highly liquid investments with insignificant interest rate risk and remaining maturities ofthree months or less at the date of purchase. We classify cash with restrictions as other current or non-current assets, dependingon the nature of the underlying restriction unless the restriction is short-term in nature and is for a period of less than threemonths. At June 30, 2008 and 2007, “Prepaid expense and other current assets, net” included $15 million and $13 million,respectively, of restricted cash. At June 30, 2008 and 2007, “Other non-current assets, net” included $102 million and $124million of long-term deposits and restricted cash, respectively.
Investments
We invest in marketable debt securities, marketable equity securities and other investments.
Marketable Debt Securities
Investments in marketable debt securities consist primarily of corporate notes and bonds, asset and mortgage backed securitiesand U.S. government notes and bonds with remaining maturities beyond three months at the date of purchase. Short-terminvestments are marketable debt securities with maturities of one year or less from the balance sheet date (except cashequivalents), while long-term investments represent all other marketable debt securities. All marketable debt securities are heldin our name and deposited with one major financial institution. Our policy is to protect the value of our investment portfolio andminimize principal risk by earning returns based on current interest rates. We only invest in marketable debt securities with aminimum rating of BBB- or above from a nationally recognized credit rating agency. At June 30, 2008 and 2007, all of ourmarketable debt securities were classified as available-for-sale and were carried at fair market value. The unrealized gains(losses) on available-for-sale securities, net of taxes, are recorded in “Accumulated other comprehensive income” in theConsolidated Statements of Stockholders’ Equity. See Note 7 for further detail.
We monitor our investment portfolio for impairment on a periodic basis. In the event that the carrying value of an investmentexceeds its fair value and the decline in value is determined to be other-than-temporary, an impairment charge is recorded and anew cost basis for the investment is established. In order to determine whether a decline in value is other-than-temporary, weevaluate, among other factors: the earning performance, credit rating and asset quality of the investee; the duration and extent towhich the fair value has been less than the carrying value; our financial condition and business outlook, including key
53

operational and cash flow metrics, current market conditions and future trends in our industry; our relative competitive positionwithin the industry; and our intent and ability to retain the investment for a period of time sufficient to allow for any anticipatedrecovery in fair value.
Marketable Equity Securities
Investments in marketable equity securities consist of equity holdings in public companies. Marketable equity securities areinitially recorded at fair value upon acquisition and are classified as available-for-sale when there are no restrictions on ourability to liquidate such securities within 12 months. Fair value is determined using quoted market prices for those securities.Investments in marketable equity securities were $21 million and $27 million at June 30, 2008 and 2007, respectively. AtJune 30, 2008, all marketable equity investments were classified as available-for-sale and are included in “Other non-currentassets, net” in the Consolidated Balance Sheets. Changes in the fair value of these securities are recognized in “AccumulatedOther Comprehensive Income,” in the Consolidated Statements of Stockholders’ Equity. Net unrealized gains on marketableequity investments were $7 million, $13 million and $20 million at June 30, 2008, 2007 and 2006, respectively. Marketableequity securities at June 30, 2008 and 2007 were (in millions):
AdjustedCost
GrossUnrealized
GainsFairValue
Fiscal 2008 Marketable equity securities . . . . . . . . . . . . . . . . . . . . . . . . . . . . . . . . . . . . . . . . . . . . . . . $14 $ 7 $21
Fiscal 2007 Marketable equity securities . . . . . . . . . . . . . . . . . . . . . . . . . . . . . . . . . . . . . . . . . . . . . . . $14 $13 $27
Realized gains on sales of marketable equity securities were $13 million, $0 million and $11 million in fiscal 2008, 2007 and2006, respectively and are recognized in “Gain on equity investments, net” in the Consolidated Statements of Operations. Inaddition, we review all marketable equity securities for other than temporary declines in fair value. In doing so, we evaluate thelength of time and the extent to which the market value has been less than cost, the financial condition and near-term prospectsof the portfolio company and our intent and ability to retain the investment for a period of time sufficient to allow for anyanticipated recovery in market value. We consider circumstances where, as of the end of any quarter, the carrying value of amarketable equity security has been greater than its market value for the last six consecutive months, to be de-facto evidence ofother than temporary impairment. We perform our evaluation of other than temporary impairment on a quarterly basis. Based onour evaluation, if a security is considered to be other than temporarily impaired, an impairment charge is recognized in “Gain onequity investments, net” in the Consolidated Statements of Operations. There was no impairment charge recorded in fiscal 2008,2007 or 2006.
Other Investments
Other investments include equity investments in privately-held companies that develop products, markets and services that arestrategic to us, investments in venture capital funds and other joint ventures, securities lent under our securities lending programand the cash surrender value of life insurance policies.
Our equity investments in privately-held companies are generally made in connection with a round of financing with other third-party investors. As our investments in privately-held companies do not permit us to exert significant influence or control overthe entity in which we are investing, the recorded amounts generally represent our cost of the investment less any adjustmentswe make when we determine that an investment’s carrying value is other-than-temporarily impaired. These investments totaled$19 million and $15 million at June 30, 2008 and 2007, respectively, and were included in “Other non-current assets, net” in theConsolidated Balance Sheets.
The process of assessing whether a particular equity investment’s fair value is less than its carrying cost requires a significantamount of judgment due to the lack of a mature and stable public market for these securities. In making this judgment amongother factors, we consider the investee’s most recent financial results, cash position, recent cash flow data, projected cash flows(both short and long-term), financing needs, recent financing rounds, most recent valuation data, the current investingenvironment, management or ownership changes and competition. This process is based primarily on information that werequest and receive from these privately-held companies and is performed on a quarterly basis. Although we evaluate all of ourprivately-held equity investments for impairment based on the criteria established above, each investment’s fair value is onlyestimated when events or changes in circumstances have occurred that may have a significant effect on its fair value (becausethe fair value of each investment is not readily determinable). Where these factors indicate that the equity investment’s fairvalue is less than its carrying cost and where we consider such reduction in value to be other than temporary, we record animpairment charge to reduce such equity investment to its estimated net realizable value. We recognized gains on sales, net ofimpairment charges, related to our investments in privately-held companies of $19 million, $3 million and $10 million for fiscal2008, 2007 and 2006, respectively, which was reflected in “Gain on equity investments, net”.
54

Investments in venture capital funds and other joint ventures totaled $14 million and $19 million at June 30, 2008 and 2007,respectively, and were accounted for using the equity method of accounting and included in “Other non-current assets, net” inthe Consolidated Balance Sheets. We recorded income of $0 million, $3 million and $6 million for fiscal 2008, 2007 and 2006,respectively, related to these investments which was reflected in “Gain on equity investments, net.”
From time to time, we enter into securities lending agreements with financial institutions to enhance investment income.Selected securities are loaned and are secured by collateral equal to an average of 102% of the fair market value of thesecurities. Collateral is in the form of cash or securities issued and our securities lending agent has provided us withcounterparty indemnification in the event of borrower default. Loaned securities continue to be classified as investment assetson the Consolidated Balance Sheets. Cash collateral is recorded as an asset with a corresponding liability. For lendingagreements collateralized by securities, no accompanying asset or liability is recorded as we are not permitted to sell or repledgethe associated collateral. The maximum amount loaned under our securities lending program in fiscal 2008 was $256 million.As of June 30, 2008, there were no outstanding securities lending transactions.
Bad Debt Reserves
We evaluate the collectibility of our accounts receivable based on a combination of factors. In cases where we are aware ofcircumstances that may impair a specific customer’s ability to meet its financial obligations to us, we record a specificallowance against amounts due to us and thereby reduce the net recognized receivable to the amount we reasonably believe willbe collected. For all other customers, we record allowances for doubtful accounts based on the length of time the receivables arepast due, the current business environment and our historical experience. For the years ended June 30, 2008, 2007 and 2006, ourbad debt reserve activity was as follows (in millions):
Fiscal Years June 30,
2008 2007 2006
Beginning bad debt reserve balance . . . . . . . . . . . . . . . . . . . . . . . . . . . . . . . . . . . . . . . . . . . . . . . . . . . . . . . . . . $ 81 $ 81 $86Bad debt expense . . . . . . . . . . . . . . . . . . . . . . . . . . . . . . . . . . . . . . . . . . . . . . . . . . . . . . . . . . . . . . . . . . . . . . . . 10 12 3Amounts written-off and other adjustments . . . . . . . . . . . . . . . . . . . . . . . . . . . . . . . . . . . . . . . . . . . . . . . . . . . . (27) (12) (8)
Ending bad debt reserve balance . . . . . . . . . . . . . . . . . . . . . . . . . . . . . . . . . . . . . . . . . . . . . . . . . . . . . . . . . . . . $ 64 $ 81 $81
Inventories
Inventories are stated at the lower of cost (first in, first out) or market (net realizable value). Inventory in-transit (included infinished goods) consists of products shipped but not recognized as revenue because they did not meet the revenue recognitioncriteria. We evaluate our ending inventories for estimated excess quantities and obsolescence. This evaluation includes analysesof sales levels by product and projections of future demand within specific time horizons (generally six months or less).Inventories in excess of future demand are reserved. In addition, we assess the impact of changing technology on ourinventory-on-hand and we write-off inventories that are considered obsolete.
Long-lived Assets
Property, Plant and Equipment, net
Property, plant and equipment, net, is stated at cost less accumulated depreciation. Depreciation is provided principally on thestraight-line method over the estimated useful lives of the assets. The estimated useful lives for machinery and equipment rangefrom one to ten years, buildings and building improvements range from five to thirty-five years and furniture and fixtures rangefrom five to ten years. Leasehold improvements are depreciated over the life of the lease or the assets, whichever is shorter.Land is not depreciated.
Intangible Assets Other than Goodwill
Long-lived assets, such as property, plant and equipment and purchased identifiable intangible assets with finite lives, areevaluated for impairment semi-annually in accordance with our policy and whenever events or changes in circumstancesindicate that the carrying value of an asset may not be recoverable in accordance with Statement of Financial AccountingStandards (SFAS) No. 144, “Accounting for the Impairment or Disposal of Long-Lived Assets” (SFAS 144). We assess therecoverability of long-lived assets (other than goodwill) by comparing the estimated undiscounted cash flows associated withthe related asset or group of assets against their respective carrying amounts. The amount of an impairment, if any, is calculatedbased on the excess of the carrying amount over the fair value of those assets.
55

As a consequence of product-line rationalization decisions taken as part of our restructuring action in the fourth quarter of fiscal2006 and resulting reductions in estimates of forecasted undiscounted cashflows, we concluded that an impairment charge of$67 million was necessary to reduce certain StorageTek acquisition-related intangible asset balances to their estimated fairvalue. In addition, during the fourth quarter of fiscal 2006, as a result of operating shortfalls and budget cuts which impacted ourability to realize the expected future benefits of developed technology assets acquired as part of our January 2004 acquisition ofNauticus, we recorded non-cash impairment charges of $3 million in our Product group segment.
Goodwill
We test goodwill for impairment on an annual basis (or whenever events occur which may indicate possible impairment) inaccordance with SFAS No. 142, “Goodwill and Other Intangible Assets” (SFAS 142). We perform the impairment analysis atone level below the operating segment level (see Note 15) as defined in SFAS 142. This analysis requires management to makea series of critical assumptions to: (1) evaluate whether any impairment exists and (2) measure the amount of impairment.
In testing for a potential impairment of goodwill, SFAS 142 requires us to: (1) allocate goodwill to our various businesses towhich the acquired goodwill relates; (2) estimate the fair value of those businesses to which goodwill relates; and (3) determinethe carrying value (book value) of those businesses, as some of the assets and liabilities related to those businesses, such asaccounts receivable and property, plant and equipment, are not held by those businesses but by functional departments (forexample, our Global Sales and Services organization and Worldwide Operations organization). Prior to this allocation of theassets to the reporting units, we are required to assess long-lived assets for impairment in accordance with SFAS 144.Furthermore, if the estimated fair value is less than the carrying value for a particular business, then we are required to estimatethe fair value of all identifiable assets and liabilities of the business in a manner similar to a purchase price allocation for anacquired business. This can require independent valuations of certain internally generated and unrecognized intangible assetssuch as in-process research and development and developed technology. Only after this process is completed can the goodwillimpairment be determined, if any.
In estimating the fair value of the businesses with recognized goodwill for the purposes of our annual or periodic analyses, wemake estimates and judgments about the future cash flows of these businesses. Our cash flow forecasts are based onassumptions that are consistent with the plans and estimates we are using to manage the underlying businesses. In addition, wemake certain judgments about allocating shared assets such as accounts receivable and property, plant and equipment to theestimated balance sheet for those businesses. We also consider our market capitalization (adjusted for unallocated monetaryassets such as cash, marketable debt securities and debt) on the date we perform the analysis.
Capitalized Software
Costs related to internally-developed software and software purchased for internal use, which are required to be capitalizedpursuant to Statement of Position (SOP) No. 98-1, “Accounting for Costs of Computer Software Developed or Obtained forInternal Use,” are included in property, plant and equipment under machinery and equipment. As of June 30, 2008 and 2007, wehad a net balance of $378 million and $237 million, respectively, of capitalized software. At June 30, 2008 and 2007, we hadapproximately $214 million and $152 million of capitalized software that was not yet in use and, as such, was not yet beingamortized. Of this $214 million, $186 million is related to our multi-year internal systems implementation effort.
Concentration of Credit Risk
Cash deposits in foreign countries of approximately $565 million are subject to local banking laws and may bear higher or lowerrisk than cash deposited in the United States. As part of our cash and investment management processes, we perform periodicevaluations of the credit standing of the financial institutions and we have not sustained any credit losses from instruments heldat these financial institutions.
Financial instruments that potentially subject us to concentrations of credit risk consist principally of trade receivables,marketable securities, foreign exchange contracts and interest rate instruments. The counterparties to the agreements relating toour investments, foreign exchange contracts and interest rate instruments consist of various major corporations and financialinstitutions with high credit standing and accordingly we do not believe there is significant risk related to non-performance bythese counterparties due to credit risk. With regard to our investment portfolio, we generally limit our exposure to anyinvestment of no more than 5% of our total portfolio excluding U.S. government and agency securities. Our trade receivablesare derived primarily from sales of our products and services to end-user customers in diversified industries, as well as variousresellers. We perform ongoing credit evaluations of our customers’ financial condition and limit the amount of credit extendedwhen deemed necessary, but generally require no collateral.
56
Revenue Recognition
We enter into revenue arrangements to sell products (hardware and software) and services in which we are obligated to deliverto our customers multiple products and/or services (multiple deliverables). Revenue arrangements with multiple deliverables areevaluated to determine if the deliverables (items) can be divided into more than one unit of accounting. An item can generallybe considered a separate unit of accounting if all of the following criteria are met:
• The delivered item(s) has value to the customer on a standalone basis;
• There is objective and reliable evidence of the fair value of the undelivered item(s); and
• If the arrangement includes a general right of return relative to the delivered item(s), delivery or performance of theundelivered item(s) is considered probable and substantially in our control.
Items that do not meet these criteria are combined into a single unit of accounting. If there is objective and reliable evidence offair value for all units of accounting, the arrangement consideration is allocated to the separate units of accounting based ontheir relative fair values. In cases where there is objective and reliable evidence of the fair value of the undelivered item(s) in anarrangement but no such evidence for the delivered item(s), the residual method is used to allocate the arrangementconsideration. For units of accounting which include more than one deliverable, we generally defer all revenue for the unit ofaccounting until the period over which the last undelivered item is delivered. The revenue policies described below are thenapplied to each unit of accounting.
We recognize revenue when the following criteria are met: 1) persuasive evidence of an arrangement exists; 2) delivery hasoccurred or services have been rendered; 3) the sales price is fixed or determinable; and 4) collectibility is reasonably assured.Our standard agreements generally do not include customer acceptance provisions. However, if there is a customer acceptanceprovision or there is uncertainty about customer acceptance, the associated revenue is deferred until we have evidence ofcustomer acceptance.
Products Revenue
Products revenue for sales to end-user customers, resellers and distributors (Channel Partners) is recognized upon the passage oftitle only if all other applicable revenue recognition criteria are met. These criteria include the price to the buyer beingsubstantially fixed or determinable at the date of sale and the amount of future returns to be reasonably estimated. Our programofferings to certain of our Channel Partners provide for the limited right to return our product for stock rotation. Whenapplicable, we reduce revenue for rights to return our product based upon our historical experience. End-user customersgenerally do not have return rights. In accordance with contractual provisions, we offer price protection to certain of ourChannel Partners and margin protection on certain transactions. When applicable under these contractual provisions, we reducerevenue based upon announced price adjustments and historical experience. In accordance with contractual provisions we mayoffer cooperative marketing funds based on a fixed dollar percentage of product sales to certain of our Channel Partners. Werecord such amounts as a reduction to revenue or, if we have evidence of fair value of the advertising benefit received, asmarketing expense.
In addition, we sell products to leasing companies that, in turn, lease these products to end-users. In transactions where theleasing companies have no recourse to us in the event of default by the end-user, we recognize revenue at point of shipment orpoint of delivery, depending on the shipping terms and if all the other revenue recognition criteria have been met. Inarrangements where the leasing companies have full recourse to us in the event of default by the end-user (defined as recourseleasing), we recognize both the product revenue and the related cost of the product as the payments are made to the leasingcompany by the end-user, generally ratably over the lease term. We had deferred revenue and related deferred costs of $12million and $5 million at June 30, 2008 and $10 million and $4 million, at June 30, 2007, respectively, related to recourse leaseswhich will be recognized in future periods.
For revenue arrangements with multiple deliverables that include or represent software products and services as well as anynon-software deliverables for which a software deliverable is essential to its functionality, we apply the accounting guidance inSOP 97-2, “Software Revenue Recognition” in determining the timing of revenue recognition. The criteria assessed include thefollowing: 1) the functionality of the delivered element(s) is not dependent on the undelivered element; 2) there is Sun-specificobjective evidence of fair value of the undelivered element(s) and 3) delivery of the delivered element(s) represents theculmination of the earnings process for those element(s). If these criteria are not met, revenue is deferred until such criteria aremet or until the last element is delivered. For arrangements within the scope of SOP 97-2, revenue is recognized ratably only insituations where one of the limited exceptions described in paragraph 12 of SOP 97-2 is met, such as where we agree to deliverunspecified additional software products in the future.
57
Beginning in the second quarter of fiscal 2008, we introduced programs in certain geographic markets entitling our distributorsto a reduced price on hardware when sold to the end customer with a support services contract. Accordingly, in these cases, weare no longer able to meet the criteria for revenue recognition under U.S. generally accepted accounting principles at the time ofsale to our distributors. We have deferred revenue on these sales until our distributors sell the hardware to the end customer.
Services Revenue
Maintenance contract revenue is generally recognized ratably over the contractual period. Educational Services revenue isrecognized as the services are rendered. Time and material and fixed price Professional Services contract revenue is recognizedas the Professional Services are rendered, or upon completion of the services contract. If we can reliably evaluate progress tocompletion (based on total projected hours to be incurred as compared with hours already incurred), we recognize the revenueas the services are rendered and recognize the related costs as they are incurred. In instances where we cannot reliably estimatethe total projected hours, we recognize revenue and the associated costs upon completion of the services contract. For fixedprice Professional Services contracts when the current estimates of total contract revenue and contract cost indicate a loss, theestimated loss is recognized in the period the loss becomes evident.
Research and Development Expenditures
Costs related to the research, design and development of products are charged to research and development expenses asincurred. Software development costs are capitalized beginning when a product’s technological feasibility has been establishedand ending when a product is available for general release to customers. Generally, our products are released soon aftertechnological feasibility has been established. As a result, costs subsequent to achieving technological feasibility have not beensignificant and all software development costs have been expensed as incurred.
Shipping Costs
Our shipping and handling costs for product sales are included in cost of sales for all periods presented.
Advertising Costs
Advertising costs consist of development and placement costs of our advertising campaigns and are charged to expense whenincurred. Advertising expense was $32 million, $25 million and $47 million for fiscal 2008, 2007 and 2006, respectively.
Self-Insurance
We maintain a program of insurance with third-party insurers for certain property, casualty and other risks. The policies aresubject to deductibles and exclusions that result in our retention of a level of risk on a self-insurance basis. We retain risk withregard to (i) certain loss events, such as California earthquakes and the indemnification or defense payments we, as a company,may make to or on behalf of our directors and officers as a result of obligations under applicable agreements, our by-laws andapplicable law, (ii) potential liabilities under a number of health and welfare insurance plans that we sponsor for our employeesand (iii) other potential liabilities that are not insured. The types and amounts of insurance obtained vary from time to time andfrom location to location, depending on availability, cost and our decisions with respect to risk retention. Our worldwide riskand insurance programs are regularly evaluated to seek to obtain the most favorable terms and conditions. We reserve for lossaccruals, which are primarily calculated using actuarial methods. These loss accruals include amounts for actual claims, claimgrowth and claims incurred but not yet reported. Actual experience, including claim frequency and severity as well as inflation,could result in different liabilities than the amounts currently recorded.
Computation of Net Income (Loss) per Common Share
Basic net income (loss) per common share is computed using the weighted-average number of common shares outstanding(adjusted for treasury stock and common stock subject to repurchase activity) during the period. Diluted net income (loss) percommon share is computed using the weighted-average number of common and dilutive common equivalent shares outstandingduring the period. Common equivalent shares are anti-dilutive when their conversion would increase earnings per share.Dilutive common equivalent shares consist primarily of stock options and restricted stock awards (restricted stock and restrictedstock units that are settled in stock).
58

On November 8, 2007, our stockholders approved a one-for-four reverse stock split, which became effective on November 12,2007. All references to share and per-share data for all periods presented have been adjusted to give effect to this reverse split.
The following table sets forth the computation of basic and diluted income (loss) per share for each of the past three fiscal years(in millions, except per share amounts):
Fiscal Years Ended June 30,
2008 2007 2006
Basic earnings per shareNet income (loss) . . . . . . . . . . . . . . . . . . . . . . . . . . . . . . . . . . . . . . . . . . . . . . . . . . . . . . . . . . . . . . . . . . $ 403 $ 473 $ (864)Basic weighted average shares outstanding . . . . . . . . . . . . . . . . . . . . . . . . . . . . . . . . . . . . . . . . . . . . . . 809 883 859
Net Income (loss) per common share-basic . . . . . . . . . . . . . . . . . . . . . . . . . . . . . . . . . . . . . . . . . . . . . $0.50 $0.54 $(1.01)
Diluted earnings per shareNet income (loss) . . . . . . . . . . . . . . . . . . . . . . . . . . . . . . . . . . . . . . . . . . . . . . . . . . . . . . . . . . . . . . . . . . $ 403 $ 473 $ (864)Diluted weighted average shares outstanding . . . . . . . . . . . . . . . . . . . . . . . . . . . . . . . . . . . . . . . . . . . . 822 902 859
Net income (loss) per common share-diluted . . . . . . . . . . . . . . . . . . . . . . . . . . . . . . . . . . . . . . . . . . . . $0.49 $0.52 $(1.01)
For the fiscal years ended June 30, 2008 and 2007, we added 13 million and 19 million common equivalent shares, respectively,to our basic-weighted-average shares outstanding to compute the diluted weighted-average shares outstanding. We are requiredto include these dilutive shares in our calculations of net income per share for fiscal 2008 because we earned a profit. As a resultof our net loss for the fiscal year ended June 30, 2006, all potentially dilutive shares were anti-dilutive and therefore excludedfrom the computation of diluted net loss per share.
Shares used in the diluted net income per share calculations exclude anti-dilutive common equivalent shares, consisting of stockoptions, restricted stock awards, written call options and shares associated with convertible notes. These anti-dilutive commonshares totaled 113 million shares, 89 million shares and 137 million shares for the fiscal years ending June 30, 2008, 2007 and2006, respectively. While these common equivalent shares are currently anti-dilutive, they could be dilutive in the future.
Foreign Currency Translation
We translate the assets and liabilities of our international non-U.S. dollar functional currency subsidiaries into dollars at therates of exchange in effect at the balance sheet date. Revenue and expenses are translated using rates that approximate those ineffect during the period. Translation adjustments are included in stockholders’ equity in the Consolidated Balance Sheetscaption “Accumulated other comprehensive income.” Currency transaction gains (losses), net of our hedging activities (seeNote 8), derived from monetary assets and liabilities stated in a currency other than the functional currency, are recognized incurrent operations and were $14 million, $6 million and $(13) million in fiscal 2008, 2007 and 2006, respectively. The effect offoreign currency rate changes on cash and cash equivalents is not material.
Recent Pronouncements
Income Taxes: In June 2006, the Financial Accounting Standards Board (FASB) issued Interpretation No. 48, “Accounting forUncertainty in Income Taxes — An Interpretation of FASB Statement No. 109” (FIN 48), which became effective for us onJuly 1, 2007. FIN 48 clarifies the accounting for uncertainty in income taxes recognized in an enterprise’s financial statementsin accordance with FASB Statement No. 109, “Accounting for Income Taxes”. FIN 48 also prescribes a recognition thresholdand measurement attribute for the financial statement recognition and measurement of a tax position taken or expected to betaken in a tax return that results in a tax benefit. Additionally, FIN 48 provides guidance on de-recognition, income statementclassification of interest and penalties, accounting in interim periods and disclosure. Additionally, in May 2007, the FASBpublished FASB Staff Position (FSP) No. FIN 48-1, “Definition of Settlement in FASB Interpretation No. 48” (FSP FIN 48-1).It clarifies how an enterprise should determine whether a tax position is effectively settled for the purpose of recognizingpreviously unrecognized tax benefits. FSP FIN 48-1 was effective upon the initial adoption of FIN 48. Our policy is torecognize interest and penalty expense associated with uncertain tax positions as a component of income tax expense in theconsolidated statements of operations. Refer to Footnote 10 of our consolidated financial statements for further informationregarding the impact of this pronouncement.
Fair Value Measurements: In September 2006, the FASB issued Statement No. 157, “Fair Value Measurements” (SFAS 157).SFAS 157 defines fair value, establishes a framework and gives guidance regarding the methods used in measuring fair valueand expands disclosures about fair value measurements. SFAS 157 is effective for financial statements issued for fiscal yearsbeginning after November 15, 2007 and interim periods within those fiscal years and we are required to adopt thepronouncement in the first quarter of our fiscal 2009. On February 12, 2008, the FASB issued No. SFAS 157-2, “Effective Dateof FASB Statement No. 157” (FSP SFAS 157-2). FSP SFAS 157-2 amends SFAS No. 157, to delay the effective date of SFAS
59

157 for nonfinancial assets and nonfinancial liabilities, except for the items that are recognized or disclosed at fair value in thefinancial statements on a recurring basis. For items within its scope, FSP SFAS 157-2 defers the effective date of SFAS 157 tofiscal years beginning after November 15, 2008 and interim periods within those fiscal years and we are required to adopt thepronouncement in our first quarter of our fiscal 2010. We do not expect the adoption of SFAS 157 and FSP SFAS 157-2 to havea material impact on our consolidated financial statements.
Fair Value Option For Financial Assets and Financial Liabilities: In February 2007, the FASB issued SFAS No. 159, “The FairValue Option for Financial Assets and Financial Liabilities-including an amendment of FASB Statement No. 115” (SFAS 159).SFAS 159 allows an entity the irrevocable option to elect fair value for the initial and subsequent measurement of certainfinancial assets and liabilities on an instrument-by-instrument election. Subsequent measurements for the financial assets andliabilities an entity elects to fair value will be recognized in earnings. SFAS 159 also establishes additional disclosurerequirements. This standard is effective for fiscal years beginning after November 15, 2007 and we are required to adopt thepronouncement in our first quarter of fiscal 2009. We do not expect the adoption of SFAS 159 to have a material impact on ourconsolidated financial statements.
Accounting For Advanced Payments For Future Research and Development: In June 2007, the FASB ratified Emerging IssuesTask Force (EITF) 07-03, “Accounting for Nonrefundable Advance Payments for Goods or Services Received for Use in FutureResearch and Development Activities” (EITF 07-03). EITF 07-03 requires that nonrefundable advance payments for goods orservices that will be used or rendered for future research and development activities be deferred and capitalized and recognized asan expense as the goods are delivered or the related services are performed. EITF 07-3 is effective, on a prospective basis, for fiscalyears beginning after December 15, 2007 and we are required to adopt the pronouncement in our first quarter of fiscal 2009. Weare currently evaluating the impact that the adoption of EITF 07-03 will have on our consolidated financial statements.
Collaborative Arrangements: In November 2007, the FASB ratified EITF 07-01, “Accounting for Collaborative Arrangements”(EITF 07-01). EITF 07-01 requires collaborators to present the result of activities for which they act as the principal on a grossbasis and report any payments received from (made to) other collaborators based on other applicable GAAP or, in the absenceof other applicable GAAP, based on analogy to authoritative accounting literature or a reasonable, rational and consistentlyapplied accounting policy election. In addition, a participant in a collaborative arrangement should provide the followingdisclosures separately for each collaborative arrangement: (a) the nature and purpose of the arrangement, (b) its rights andobligations under the collaborative arrangement, (c) the accounting policy for the arrangement in accordance with APB Opinion22, “Disclosure of Accounting Policies,” and (d) the income statement classification and amounts arising from the collaborativearrangement between participants for each period an income statement is presented. EITF 07-01 will be effective for annualperiods beginning after December 15, 2008 and we are required to adopt the pronouncement in our first quarter of fiscal 2010.We are currently evaluating the impact that the adoption of EITF 07-01 will have on our consolidated financial statements.
Business Combinations: In December 2007, the FASB issued SFAS No. 141(R), “Business Combinations” (SFAS 141(R)) andSFAS No. 160, “Non-Controlling Interests in Consolidated Financial Statements, an Amendment of ARB No. 51” (SFAS 160).These new standards will significantly change the accounting for and reporting for business combination transactions andnon-controlling interests in consolidated financial statements. SFAS 141(R) and SFAS 160 are required to be adoptedsimultaneously and are effective for the first annual reporting period beginning on or after December 15, 2008 and we arerequired to adopt the pronouncement in the first quarter of our fiscal 2010. We are currently evaluating the impact that theadoption of SFAS 141(R) and SFAS 160 will have on our consolidated financial statements.
Derivative Instruments and Hedging Activities Disclosures: In March 2008, the FASB issued SFAS No. 161, “Disclosures aboutDerivative Instruments and Hedging Activities — An Amendment of FASB Statement No. 133” (SFAS 16). SFAS 161 expandsthe disclosure requirements for derivative instruments and hedging activities. This Statement specifically requires entities toprovide enhanced disclosures addressing the following: (a) how and why an entity uses derivative instruments, (b) howderivative instruments and related hedged items are accounted for under Statement 133 and its related interpretations and(c) how derivative instruments and related hedged items affect an entity’s financial position, financial performance and cashflows. SFAS 161 is effective for fiscal years and interim periods beginning after November 15, 2008 and we are required toadopt the pronouncement in our first quarter of fiscal 2010. We are currently evaluating the impact that the adoption of SFAS161 will have on our consolidated financial statements.
Intangibles: In April 2008, FASB issued FSP 142-3, which amends the factors that must be considered in developing renewal orextension assumptions used to determine the useful life over which to amortize the cost of a recognized intangible asset underFASB Statement No. 142, “Goodwill and Other Intangible Assets” (FSP 142-3). The FSP requires an entity to consider its ownassumptions about renewal or extension of the term of the arrangement, consistent with its expected use of the asset. The FSPalso requires that we disclose the weighted-average period prior to the next renewal or extension for each major intangible assetclass, our accounting policy for the treatment of costs incurred to renew or extend the term of a recognized intangible assets andfor intangible assets renewed or extended during the period, if we capitalize renewal or extension costs, the costs incurred to
60
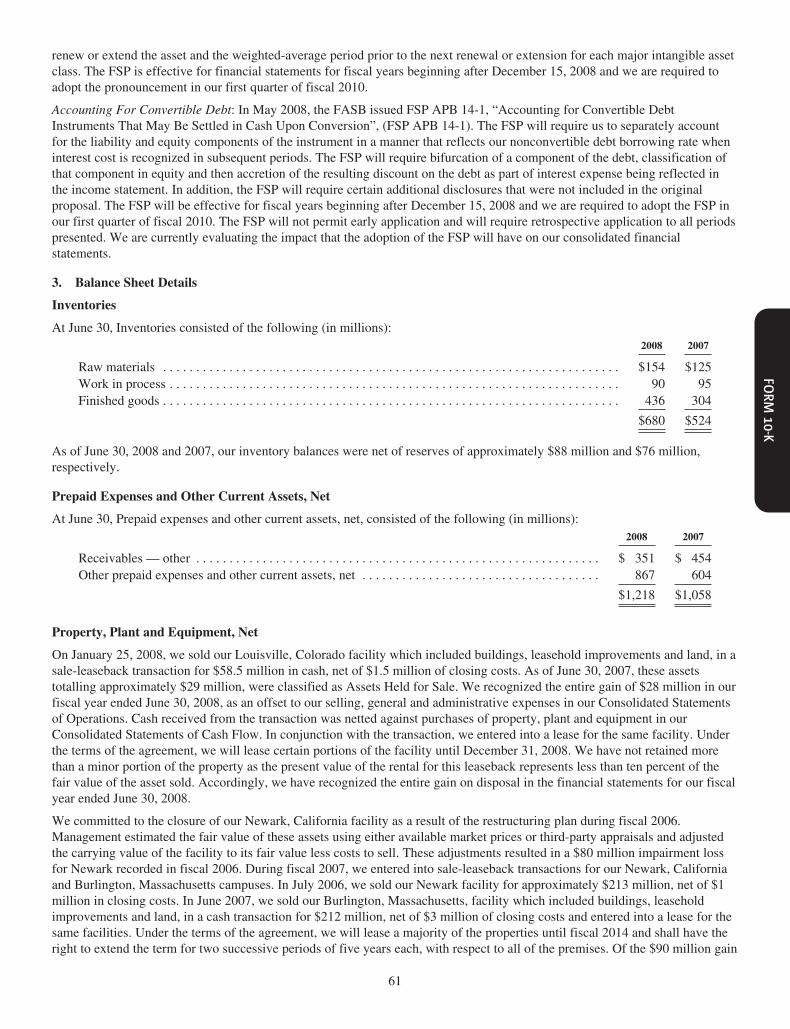
renew or extend the asset and the weighted-average period prior to the next renewal or extension for each major intangible assetclass. The FSP is effective for financial statements for fiscal years beginning after December 15, 2008 and we are required toadopt the pronouncement in our first quarter of fiscal 2010.
Accounting For Convertible Debt: In May 2008, the FASB issued FSP APB 14-1, “Accounting for Convertible DebtInstruments That May Be Settled in Cash Upon Conversion”, (FSP APB 14-1). The FSP will require us to separately accountfor the liability and equity components of the instrument in a manner that reflects our nonconvertible debt borrowing rate wheninterest cost is recognized in subsequent periods. The FSP will require bifurcation of a component of the debt, classification ofthat component in equity and then accretion of the resulting discount on the debt as part of interest expense being reflected inthe income statement. In addition, the FSP will require certain additional disclosures that were not included in the originalproposal. The FSP will be effective for fiscal years beginning after December 15, 2008 and we are required to adopt the FSP inour first quarter of fiscal 2010. The FSP will not permit early application and will require retrospective application to all periodspresented. We are currently evaluating the impact that the adoption of the FSP will have on our consolidated financialstatements.
3. Balance Sheet Details
Inventories
At June 30, Inventories consisted of the following (in millions):2008 2007
Raw materials . . . . . . . . . . . . . . . . . . . . . . . . . . . . . . . . . . . . . . . . . . . . . . . . . . . . . . . . . . . . . . . . . . . . . $154 $125Work in process . . . . . . . . . . . . . . . . . . . . . . . . . . . . . . . . . . . . . . . . . . . . . . . . . . . . . . . . . . . . . . . . . . . . 90 95Finished goods . . . . . . . . . . . . . . . . . . . . . . . . . . . . . . . . . . . . . . . . . . . . . . . . . . . . . . . . . . . . . . . . . . . . . 436 304
$680 $524
As of June 30, 2008 and 2007, our inventory balances were net of reserves of approximately $88 million and $76 million,respectively.
Prepaid Expenses and Other Current Assets, Net
At June 30, Prepaid expenses and other current assets, net, consisted of the following (in millions):2008 2007
Receivables — other . . . . . . . . . . . . . . . . . . . . . . . . . . . . . . . . . . . . . . . . . . . . . . . . . . . . . . . . . . . . . $ 351 $ 454Other prepaid expenses and other current assets, net . . . . . . . . . . . . . . . . . . . . . . . . . . . . . . . . . . . . 867 604
$1,218 $1,058
Property, Plant and Equipment, Net
On January 25, 2008, we sold our Louisville, Colorado facility which included buildings, leasehold improvements and land, in asale-leaseback transaction for $58.5 million in cash, net of $1.5 million of closing costs. As of June 30, 2007, these assetstotalling approximately $29 million, were classified as Assets Held for Sale. We recognized the entire gain of $28 million in ourfiscal year ended June 30, 2008, as an offset to our selling, general and administrative expenses in our Consolidated Statementsof Operations. Cash received from the transaction was netted against purchases of property, plant and equipment in ourConsolidated Statements of Cash Flow. In conjunction with the transaction, we entered into a lease for the same facility. Underthe terms of the agreement, we will lease certain portions of the facility until December 31, 2008. We have not retained morethan a minor portion of the property as the present value of the rental for this leaseback represents less than ten percent of thefair value of the asset sold. Accordingly, we have recognized the entire gain on disposal in the financial statements for our fiscalyear ended June 30, 2008.
We committed to the closure of our Newark, California facility as a result of the restructuring plan during fiscal 2006.Management estimated the fair value of these assets using either available market prices or third-party appraisals and adjustedthe carrying value of the facility to its fair value less costs to sell. These adjustments resulted in a $80 million impairment lossfor Newark recorded in fiscal 2006. During fiscal 2007, we entered into sale-leaseback transactions for our Newark, Californiaand Burlington, Massachusetts campuses. In July 2006, we sold our Newark facility for approximately $213 million, net of $1million in closing costs. In June 2007, we sold our Burlington, Massachusetts, facility which included buildings, leaseholdimprovements and land, in a cash transaction for $212 million, net of $3 million of closing costs and entered into a lease for thesame facilities. Under the terms of the agreement, we will lease a majority of the properties until fiscal 2014 and shall have theright to extend the term for two successive periods of five years each, with respect to all of the premises. Of the $90 million gain
61

on the Burlington, Massachusetts transaction, we recognized $39 million in our fiscal year ended June 30, 2007, as an offset toour selling, general and administrative expenses and deferred the remaining $51 million (see Other non-current obligationsbelow).
At June 30, Property, plant and equipment, net consisted of the following (in millions):2008 2007
Machinery and equipment . . . . . . . . . . . . . . . . . . . . . . . . . . . . . . . . . . . . . . . . . . . . . . . . . . . . . . . $ 2,429 $ 2,716Land, buildings and building improvements . . . . . . . . . . . . . . . . . . . . . . . . . . . . . . . . . . . . . . . . . 1,084 1,070Capitalized software . . . . . . . . . . . . . . . . . . . . . . . . . . . . . . . . . . . . . . . . . . . . . . . . . . . . . . . . . . . . 624 512Leasehold improvements . . . . . . . . . . . . . . . . . . . . . . . . . . . . . . . . . . . . . . . . . . . . . . . . . . . . . . . . 521 512Furniture and fixtures . . . . . . . . . . . . . . . . . . . . . . . . . . . . . . . . . . . . . . . . . . . . . . . . . . . . . . . . . . . 222 267
4,880 5,077Less accumulated depreciation and amortization . . . . . . . . . . . . . . . . . . . . . . . . . . . . . . . . . . . . . . (3,269) (3,573)
$ 1,611 $ 1,504
Depreciation expense was $377 million, $407 million and $441 million for fiscal 2008, 2007 and 2006, respectively.
Accrued Liabilities and Other
At June 30, Accrued liabilities and other consisted of the following (in millions):2008 2007
Restructuring liabilities . . . . . . . . . . . . . . . . . . . . . . . . . . . . . . . . . . . . . . . . . . . . . . . . . . . . . . . . . . . . $ 173 $ 81Acquisition-related restructuring liabilities . . . . . . . . . . . . . . . . . . . . . . . . . . . . . . . . . . . . . . . . . . . . . 17 42Other accrued liabilities . . . . . . . . . . . . . . . . . . . . . . . . . . . . . . . . . . . . . . . . . . . . . . . . . . . . . . . . . . . . 915 838
$1,105 $961
Warranty Reserve
We accrue for our product warranty costs at the time of shipment. These product warranty costs are estimated based upon ourhistorical experience and specific identification of product requirements and may fluctuate based on product mix.
The following table sets forth an analysis of warranty reserve activity (in millions):
Balance at June 30, 2006 . . . . . . . . . . . . . . . . . . . . . . . . . . . . . . . . . . . . . . . . . . . . . . . . . . . . . . . . . . . . . . . . . . . $ 261Charged to costs and expenses . . . . . . . . . . . . . . . . . . . . . . . . . . . . . . . . . . . . . . . . . . . . . . . . . . . . . . . . . . . . . 295Utilized . . . . . . . . . . . . . . . . . . . . . . . . . . . . . . . . . . . . . . . . . . . . . . . . . . . . . . . . . . . . . . . . . . . . . . . . . . . . . . . (336)
Balance at June 30, 2007 . . . . . . . . . . . . . . . . . . . . . . . . . . . . . . . . . . . . . . . . . . . . . . . . . . . . . . . . . . . . . . . . . . . $ 220Charged to costs and expenses . . . . . . . . . . . . . . . . . . . . . . . . . . . . . . . . . . . . . . . . . . . . . . . . . . . . . . . . . . . . . 290Utilized . . . . . . . . . . . . . . . . . . . . . . . . . . . . . . . . . . . . . . . . . . . . . . . . . . . . . . . . . . . . . . . . . . . . . . . . . . . . . . . (304)
Balance at June 30, 2008 . . . . . . . . . . . . . . . . . . . . . . . . . . . . . . . . . . . . . . . . . . . . . . . . . . . . . . . . . . . . . . . . . . . $ 206
Other Non-Current Obligations
At June 30, Other non-current obligations, consisted of the following (in millions):2008 2007
Income taxes liabilities, net . . . . . . . . . . . . . . . . . . . . . . . . . . . . . . . . . . . . . . . . . . . . . . . . . . . . . . . . $ 316 $ 373Restructuring liabilities . . . . . . . . . . . . . . . . . . . . . . . . . . . . . . . . . . . . . . . . . . . . . . . . . . . . . . . . . . . 163 194Deferred settlement income from Microsoft . . . . . . . . . . . . . . . . . . . . . . . . . . . . . . . . . . . . . . . . . . . 352 352Other non-current obligations . . . . . . . . . . . . . . . . . . . . . . . . . . . . . . . . . . . . . . . . . . . . . . . . . . . . . . 305 366
1,136 $1,285
In connection with the sale-leaseback of our Burlington, Massachusetts, facility we deferred $51 million of the gain on sale infiscal year 2007. Of the initial amount deferred, $6 million remains in Accrued liabilities and other and $38 million remains inOther non-current obligations at June 30, 2008. The amounts deferred will be amortized as an offset to selling, general andadministrative expenses over the remaining lease term. In fiscal year 2008 we recognized $6 million of the deferred gain as anoffset to our selling, general and administrative expenses.
62

Accumulated Other Comprehensive Income
At June 30, the components of Accumulated other comprehensive income, reflected in the Consolidated Statements ofStockholders’ Equity consisted of the following (in millions):
2008 2007 2006
Unrealized gains (losses) on investments, net . . . . . . . . . . . . . . . . . . . . . . . . . . . . . . . . . . . . . . $ (13) $ 11 $ 9Unrealized losses on derivative instruments and other, net . . . . . . . . . . . . . . . . . . . . . . . . . . . (9) (5) (7)Unrealized gains (losses) on pensions . . . . . . . . . . . . . . . . . . . . . . . . . . . . . . . . . . . . . . . . . . . . 12 (26) (13)Cumulative translation adjustments . . . . . . . . . . . . . . . . . . . . . . . . . . . . . . . . . . . . . . . . . . . . . 503 334 191
$493 $314 $180
At June 30, the net change in unrealized gains (losses) on investments consisted of the following (in millions):2008 2007 2006
Net unrealized gains (losses) . . . . . . . . . . . . . . . . . . . . . . . . . . . . . . . . . . . . . . . . . . . . . . . . . . . . . $(14) $ 9 $ (9)Add (gains) losses:Included in net income (loss) for the period . . . . . . . . . . . . . . . . . . . . . . . . . . . . . . . . . . . . . . . . . (10) (9) 7Written off due to impairment . . . . . . . . . . . . . . . . . . . . . . . . . . . . . . . . . . . . . . . . . . . . . . . . . . . — 2 —
Net change in unrealized gains (losses) on investments . . . . . . . . . . . . . . . . . . . . . . . . . . . . . . . . $(24) $ 2 $ (2)
4. Business Combinations
A summary of our acquisitions for the fiscal years ended June 30, 2008, 2007 and 2006 is included in the following table(in millions):
Entity Name and Descriptionof Acquisition Date Form of Consideration Goodwill
DevelopedTechnology
OtherIntangibleAssets
NetTangible Assets(Liabilities) and
UnearnedCompensation IPRD
Fiscal 2008 Acquisitions
MySQL 02/08 $ 797 Cash paid $ 711 $ 82 $103 $ (20) $28Database Software 102 Fair value of options assumed
5 Cash paid for acquisition costs
$ 904
Other fiscal 2008 acquisitions(1) Various $ 160 Cash paid $ 103 $ 21 $ 36 $ — $ 3— Fair value of options assumed3 Cash paid for acquisition costs
$ 163
Fiscal 2007 Acquisitions
Fiscal 2007 acquisitions(1) Various $ 23 Cash paid $ 7 $ 15 $ 2 $ — $—— Fair value of options assumed1 Cash paid for acquisition costs
$ 24
Fiscal 2006 Acquisitions
Storage Technology Corporation(2) 08/05 $3,987 Cash paid $1,886 $507 $606 $1,034 $49Data storage hardware & software 80 Fair value of options assumed
15 Cash paid for acquisition costs
$4,082
SeeBeyond Technology Corporation(2) 08/05 $ 362 Cash paid $ 252 $ 34 $ 53 $ 25 $11Business integration software 8 Fair value of options assumed
5 Cash paid for acquisition costs
$ 375
Other fiscal 2006 Acquisitions Various $ 37 Cash paid $ 31 $ 11 $ 5 $ (8) $—Patch management application, Software to — Fair value of options assumedaccess and manage information, data andapplications 2 Cash paid for acquisition costs
$ 39
63

(1) In accordance with SFAS 141 “Business Combinations,” some of these acquisitions were accounted for as a purchase ofassets as defined by EITF Issue No. 98-3 “Determining Whether a Nonmonetary Transaction Involves Receipt ofProductive Assets or of a Business” rather than as a business combination. Accordingly, no goodwill was recorded fromthese acquisitions, as consideration in excess of the fair value of identified assets was allocated pro-rata to the identifiedintangible assets.
(2) Net tangible assets acquired included acquisition-related restructuring liabilities of $172 million (StorageTek) and $11million (SeeBeyond).
MySQL
On February 25, 2008, we acquired all of the outstanding shares of MySQL, a company based in Uppsala, Sweden, forapproximately $904 million including $797 million in cash, assumed employee stock options with a fair value (estimated usingthe Black-Scholes model) of approximately $102 million and transaction costs of $5 million. The options assumed in theacquisition were converted into options to purchase 11.9 million shares of our common stock. MySQL provides open source andproprietary database technology and software as well as services, to a wide range of customers in different industry segmentsand stages of growth. The results of operations of MySQL are included in the Consolidated Statement of Operations from thedate of acquisition.
Purchase Price Allocation
The total purchase price of approximately $904 million was allocated as follows (in millions):
Goodwill . . . . . . . . . . . . . . . . . . . . . . . . . . . . . . . . . . . . . . . . . . . . . . . . . . . . . . . . . . . . . . . . . . . . . . . . . . . . . . . . $711Other intangible assets:Customer base . . . . . . . . . . . . . . . . . . . . . . . . . . . . . . . . . . . . . . . . . . . . . . . . . . . . . . . . . . . . . . . . . . . . . . . . . . . . 71Developed technology . . . . . . . . . . . . . . . . . . . . . . . . . . . . . . . . . . . . . . . . . . . . . . . . . . . . . . . . . . . . . . . . . . . . . . 82Trademarks . . . . . . . . . . . . . . . . . . . . . . . . . . . . . . . . . . . . . . . . . . . . . . . . . . . . . . . . . . . . . . . . . . . . . . . . . . . . . . 32Tangible assets acquired and net liabilities assumed . . . . . . . . . . . . . . . . . . . . . . . . . . . . . . . . . . . . . . . . . . . . . . (20)In-process research and development (IPRD) . . . . . . . . . . . . . . . . . . . . . . . . . . . . . . . . . . . . . . . . . . . . . . . . . . . . 28
Total . . . . . . . . . . . . . . . . . . . . . . . . . . . . . . . . . . . . . . . . . . . . . . . . . . . . . . . . . . . . . . . . . . . . . . . . . . . . . . . . . . . $904
Other Acquisitions in Fiscal 2008
During fiscal 2008, we acquired three other companies and purchased certain technology and development assets for a totalpurchase price of approximately $163 million. We recorded approximately $103 million of goodwill, $57 million of identifiableintangible assets and $3 million of in-process research and development in connection with these acquisitions. We haveincluded the effects of these transactions in our results of operations prospectively from the respective dates of the acquisitions.Projects that qualify for treatment as IPRD have not yet reached technological feasibility and have no alternative use.
Pro forma results of operations have not been presented for MySQL or our other acquisitions because the effects of theseacquisitions were not material to our consolidated results of operations on either an individual or on an aggregate basis.
Acquisitions Prior to Fiscal 2008
SeeBeyond
On August 25, 2005, we acquired all of the outstanding shares of SeeBeyond, a publicly held company based in Monrovia,California (NASDAQ: SBYN). Under the terms of the agreement, SeeBeyond stockholders received $4.25 per share in cash foreach SeeBeyond share and certain SeeBeyond stock option holders received cash equal to the difference between $4.25 pershare and the exercise price of such stock options. In addition, certain other outstanding options to purchase SeeBeyondcommon stock were converted into options to purchase shares of our stock. SeeBeyond provided business integration softwarevia its Integrated Composite Application Network (ICAN) suite (now part of Sun’s Java CAPS products), which enables thereal-time flow of information within the enterprise and among customers, suppliers and partners. This acquisition strengthenedour software portfolio and created a complete offering for the development, deployment and management of enterpriseapplications and Service Oriented Architectures.
StorageTek
On August 31, 2005, we acquired all of the outstanding shares of StorageTek, a publicly held company based in Louisville,Colorado (NYSE: STK). Under the terms of the agreement, StorageTek stockholders received $37 per share in cash for each
64
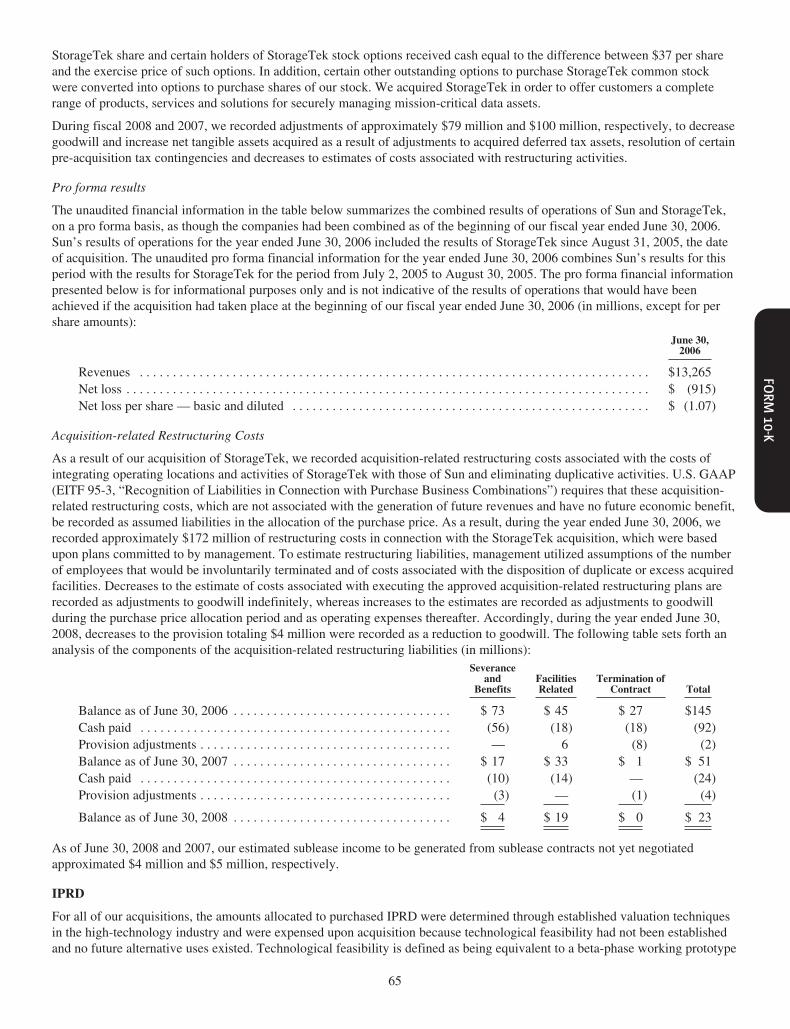
StorageTek share and certain holders of StorageTek stock options received cash equal to the difference between $37 per shareand the exercise price of such options. In addition, certain other outstanding options to purchase StorageTek common stockwere converted into options to purchase shares of our stock. We acquired StorageTek in order to offer customers a completerange of products, services and solutions for securely managing mission-critical data assets.
During fiscal 2008 and 2007, we recorded adjustments of approximately $79 million and $100 million, respectively, to decreasegoodwill and increase net tangible assets acquired as a result of adjustments to acquired deferred tax assets, resolution of certainpre-acquisition tax contingencies and decreases to estimates of costs associated with restructuring activities.
Pro forma results
The unaudited financial information in the table below summarizes the combined results of operations of Sun and StorageTek,on a pro forma basis, as though the companies had been combined as of the beginning of our fiscal year ended June 30, 2006.Sun’s results of operations for the year ended June 30, 2006 included the results of StorageTek since August 31, 2005, the dateof acquisition. The unaudited pro forma financial information for the year ended June 30, 2006 combines Sun’s results for thisperiod with the results for StorageTek for the period from July 2, 2005 to August 30, 2005. The pro forma financial informationpresented below is for informational purposes only and is not indicative of the results of operations that would have beenachieved if the acquisition had taken place at the beginning of our fiscal year ended June 30, 2006 (in millions, except for pershare amounts):
June 30,2006
Revenues . . . . . . . . . . . . . . . . . . . . . . . . . . . . . . . . . . . . . . . . . . . . . . . . . . . . . . . . . . . . . . . . . . . . . . . . . . . . . $13,265Net loss . . . . . . . . . . . . . . . . . . . . . . . . . . . . . . . . . . . . . . . . . . . . . . . . . . . . . . . . . . . . . . . . . . . . . . . . . . . . . . . $ (915)Net loss per share — basic and diluted . . . . . . . . . . . . . . . . . . . . . . . . . . . . . . . . . . . . . . . . . . . . . . . . . . . . . . $ (1.07)
Acquisition-related Restructuring Costs
As a result of our acquisition of StorageTek, we recorded acquisition-related restructuring costs associated with the costs ofintegrating operating locations and activities of StorageTek with those of Sun and eliminating duplicative activities. U.S. GAAP(EITF 95-3, “Recognition of Liabilities in Connection with Purchase Business Combinations”) requires that these acquisition-related restructuring costs, which are not associated with the generation of future revenues and have no future economic benefit,be recorded as assumed liabilities in the allocation of the purchase price. As a result, during the year ended June 30, 2006, werecorded approximately $172 million of restructuring costs in connection with the StorageTek acquisition, which were basedupon plans committed to by management. To estimate restructuring liabilities, management utilized assumptions of the numberof employees that would be involuntarily terminated and of costs associated with the disposition of duplicate or excess acquiredfacilities. Decreases to the estimate of costs associated with executing the approved acquisition-related restructuring plans arerecorded as adjustments to goodwill indefinitely, whereas increases to the estimates are recorded as adjustments to goodwillduring the purchase price allocation period and as operating expenses thereafter. Accordingly, during the year ended June 30,2008, decreases to the provision totaling $4 million were recorded as a reduction to goodwill. The following table sets forth ananalysis of the components of the acquisition-related restructuring liabilities (in millions):
Severanceand
BenefitsFacilitiesRelated
Termination ofContract Total
Balance as of June 30, 2006 . . . . . . . . . . . . . . . . . . . . . . . . . . . . . . . . . $ 73 $ 45 $ 27 $145Cash paid . . . . . . . . . . . . . . . . . . . . . . . . . . . . . . . . . . . . . . . . . . . . . . . (56) (18) (18) (92)Provision adjustments . . . . . . . . . . . . . . . . . . . . . . . . . . . . . . . . . . . . . . — 6 (8) (2)Balance as of June 30, 2007 . . . . . . . . . . . . . . . . . . . . . . . . . . . . . . . . . $ 17 $ 33 $ 1 $ 51Cash paid . . . . . . . . . . . . . . . . . . . . . . . . . . . . . . . . . . . . . . . . . . . . . . . (10) (14) — (24)Provision adjustments . . . . . . . . . . . . . . . . . . . . . . . . . . . . . . . . . . . . . . (3) — (1) (4)
Balance as of June 30, 2008 . . . . . . . . . . . . . . . . . . . . . . . . . . . . . . . . . $ 4 $ 19 $ 0 $ 23
As of June 30, 2008 and 2007, our estimated sublease income to be generated from sublease contracts not yet negotiatedapproximated $4 million and $5 million, respectively.
IPRD
For all of our acquisitions, the amounts allocated to purchased IPRD were determined through established valuation techniquesin the high-technology industry and were expensed upon acquisition because technological feasibility had not been establishedand no future alternative uses existed. Technological feasibility is defined as being equivalent to a beta-phase working prototype
65

in which there is no remaining risk relating to the development. Research and development costs to bring the products from theacquired companies to technological feasibility are not expected to have a material impact on our future results of operations orcash flows.
The value assigned to IPRD was determined by considering the importance of each project to the overall development plan,estimating costs to develop the purchased IPRD into commercially viable products, estimating the resulting net cash flows fromthe projects when completed and discounting the net cash flows to their present value. The revenue estimates used to value thepurchased IPRD were based on estimates of the relevant market sizes and growth factors, expected trends in technology and thenature and expected timing of new product introductions.
The rates utilized to discount the net cash flows to their present values were based on weighted-average cost of capital. Theweighted-average cost of capital was adjusted to reflect the difficulties and uncertainties in completing each project and therebyachieving technological feasibility, the percentage of completion of each project, anticipated market acceptance and penetration,market growth rates and risks related to the impact of potential changes in future target markets. Based on these factors,discount rates that generally range from 12% to 22% were deemed appropriate for valuing the purchased IPRD.
The estimates used in valuing IPRD were based upon assumptions believed to be reasonable but which are inherently uncertainand unpredictable. Assumptions may be incomplete or inaccurate, and unanticipated events and circumstances may occur.Accordingly, actual results may differ from the projected results.
5. Goodwill and Other Acquisition-related Intangible Assets, Net
Information regarding our goodwill by operating segment is as follows (in millions):
ProductGroup
ServicesGroup Total
Balance as of June 30, 2006 . . . . . . . . . . . . . . . . . . . . . . . . . . . . . . . . . . . . . . . . . . . . . . . $1,321 1,289 2,610Goodwill acquired during the period . . . . . . . . . . . . . . . . . . . . . . . . . . . . . . . . . . . . . . — 7 7Adjustment to acquired companies’ tax and restructuring reserves . . . . . . . . . . . . . . (43) (60) (103)
Balance as of June 30, 2007 . . . . . . . . . . . . . . . . . . . . . . . . . . . . . . . . . . . . . . . . . . . . . . . $1,278 $1,236 $2,514Goodwill acquired during the period . . . . . . . . . . . . . . . . . . . . . . . . . . . . . . . . . . . . . . 609 205 814Adjustment to acquired companies’ tax and restructuring reserves . . . . . . . . . . . . . . (59) (54) (113)
Balance as of June 30, 2008 . . . . . . . . . . . . . . . . . . . . . . . . . . . . . . . . . . . . . . . . . . . . . . . $1,828 $1,387 $3,215
Information regarding our other acquisition-related intangible assets is as follows (in millions):
Gross Carrying Amount Accumulated Amortization Net
June 30,2007 Additions
June 30,2008
June 30,2007 Additions
June 30,2008
June 30,2008
Developed technology . . . . . . . . . . . . . . . . . . . . . . . . $ 904 $103 $1,007 $ (612) $(141) $ (753) $254Customer base . . . . . . . . . . . . . . . . . . . . . . . . . . . . . . 651 80 731 (361) (162) (523) 208Trademark . . . . . . . . . . . . . . . . . . . . . . . . . . . . . . . . . 63 34 97 (14) (5) (19) 78Acquired workforce and other . . . . . . . . . . . . . . . . . . 95 25 120 (93) (2) (95) 25
$1,713 $242 $1,955 $(1,080) $(310) $(1,390) $565
Gross Carrying Amount Accumulated Amortization Net
June 30,2006 Additions Impairment
June 30,2007
June 30,2006 Additions Impairment
June 30,2007
June 30,2007
Developed technology . . . . . . . . . . . $ 889 $15 $— $ 904 $(471) $(141) $— $ (612) $292Customer base . . . . . . . . . . . . . . . . . . 650 1 — 651 (204) (157) — (361) 290Trademark . . . . . . . . . . . . . . . . . . . . . 63 — — 63 (10) (4) — (14) 49Acquired workforce and other . . . . . 94 1 — 95 (82) (11) — (93) 2
$1,696 $17 $— $1,713 $(767) $(313) $— $(1,080) $633
Amortization expense of other acquisition-related intangible assets was $310 million and $313 million for the fiscal years endedJune 30, 2008 and June 30, 2007. Our acquisition-related intangible assets are amortized generally over periods ranging betweenone and five years on a straight-line basis.
66

Estimated amortization expense for other acquisition-related intangible assets on our June 30, 2008 balance sheet for the fiscalyears ending June 30, is as follows (in millions):
2009 . . . . . . . . . . . . . . . . . . . . . . . . . . . . . . . . . . . . . . . . . . . . . . . . . . . . . . . . . . . . . . . . . . . . . . . . . . . . . . . . . . . $ 2942010 . . . . . . . . . . . . . . . . . . . . . . . . . . . . . . . . . . . . . . . . . . . . . . . . . . . . . . . . . . . . . . . . . . . . . . . . . . . . . . . . . . . 1032011 . . . . . . . . . . . . . . . . . . . . . . . . . . . . . . . . . . . . . . . . . . . . . . . . . . . . . . . . . . . . . . . . . . . . . . . . . . . . . . . . . . . 552012 . . . . . . . . . . . . . . . . . . . . . . . . . . . . . . . . . . . . . . . . . . . . . . . . . . . . . . . . . . . . . . . . . . . . . . . . . . . . . . . . . . . 462013 and thereafter . . . . . . . . . . . . . . . . . . . . . . . . . . . . . . . . . . . . . . . . . . . . . . . . . . . . . . . . . . . . . . . . . . . . . . . . 67
$ 565
As a result of our Phase VI restructuring activities, we exited certain acquired StorageTek product lines and recordedimpairment charges of $67 million during fiscal 2006. These product line exits were not part of our acquisition integration planand were conducted to meet our fiscal 2006 operating goals. The impairment charge related to acquired StorageTek developedtechnology and was recorded in our Product group segment. As a result of the product line exit plans, we do not expect futurecash flows from these acquired technologies. The full amount of the remaining intangible asset balances for these product lineswere written off as an impairment charge during fiscal 2006.
During the fourth quarter of fiscal 2006, as a result of operating shortfalls and budget cuts which impacted our ability to realizethe expected future benefits of developed technology assets acquired as part of our January 2004 acquisition of Nauticus, werecorded non-cash impairment charges of $3 million in our Product group segment.
6. Restructuring Charges and Related Impairment of Long-Lived Assets
In accordance with SFAS 112, “Employers’ Accounting for Post Employment Benefits” (SFAS 112) and SFAS 146,“Accounting for Costs Associated with Exit or Disposal Activities” (SFAS 146), we recognized a total of $263 million, $97million and $284 million in restructuring and related impairment of long-lived assets for the fiscal years ended June 30, 2008,2007 and 2006, respectively. The determination of when we accrue for severance costs and which standard applies depends onwhether the termination benefits are provided under a one-time benefit arrangement as defined by SFAS 146 or under anon-going benefit arrangement as described in SFAS 112.
We estimated the cost of exiting and terminating our facility leases or acquired leases by referring to the contractual terms of theagreements and by evaluating the current real estate market conditions. In addition, we have estimated sublease income byevaluating the current real estate market conditions or, where applicable, by referring to amounts being negotiated. Our abilityto generate this amount of sublease income, as well as our ability to terminate lease obligations at the amounts we haveestimated, is highly dependent upon the commercial real estate market conditions in certain geographies at the time we performour evaluations or negotiate the lease termination and sublease arrangements with third parties. The amounts we have accruedrepresent our best estimate of the obligations we expect to incur and could be subject to adjustment as market conditionschange.
Restructuring Plan VIII
In May 2008, we initiated a restructuring plan to further align our resources with our strategic business objectives throughreducing our workforce by approximately 1,500 to 2,500 employees. Under this plan, we estimate in total that we will incurbetween $130 million to $220 million in severance and benefit costs. Through the end of fiscal year 2008, we recognized totalrelated severance and benefit costs of $107 million. The remainder of the estimated costs under this restructuring plan areexpected to be incurred during fiscal 2009.
Restructuring Plan VII
In August 2007, we initiated a restructuring plan to further align our resources with our strategic business objectives(Restructuring Plan VII). Through the end of fiscal year 2008, we notified approximately 1,450 employees of their terminationand recognized total related severance and benefit costs of $135 million. Additionally, we incurred $6 million in expensesrelated to facilities other restructuring related charges.
Restructuring Plan VI
In May 2006, we implemented a plan to better align our resources with our strategic business objectives (Restructuring PlanVI). This plan included reducing our workforce across certain business functions, operating units and geographic regions as wellas implementing other expense reduction measures. Through the end of fiscal year 2008, excluding natural attrition andacquisition-related restructuring activity, we reduced our workforce by approximately 2,150 employees and recognizedcumulative expenses relating to severance and benefit costs of $192 million, primarily in workforce reduction chargesassociated with Restructuring Plan VI.
67
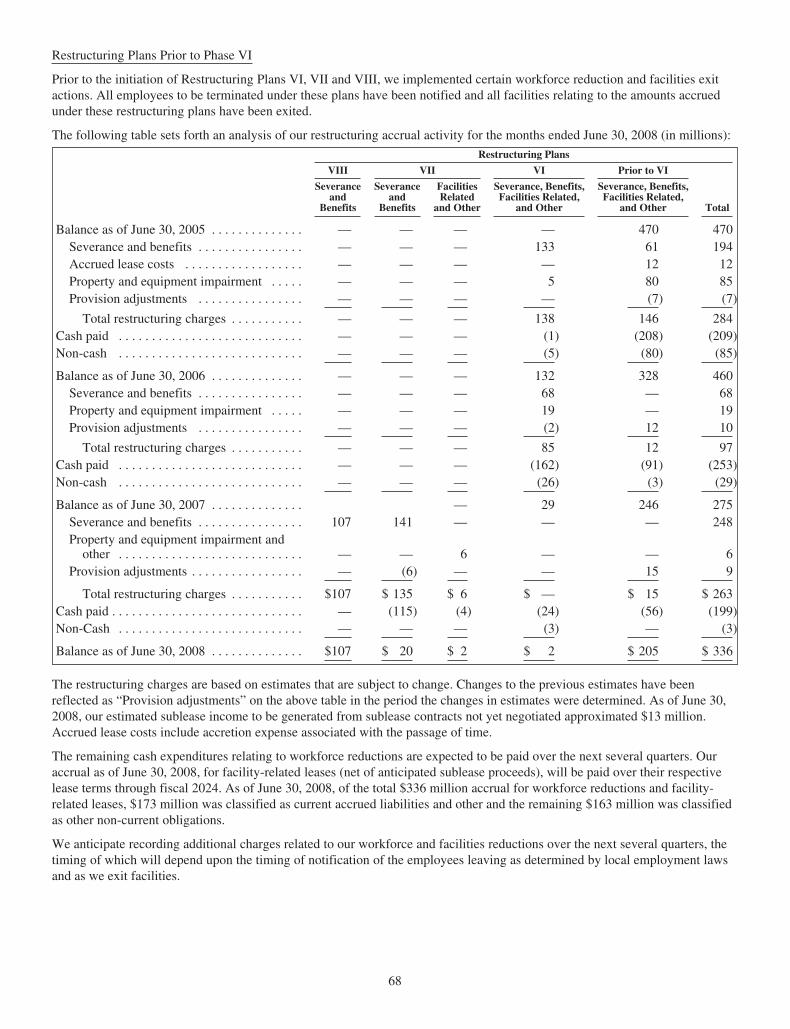
Restructuring Plans Prior to Phase VI
Prior to the initiation of Restructuring Plans VI, VII and VIII, we implemented certain workforce reduction and facilities exitactions. All employees to be terminated under these plans have been notified and all facilities relating to the amounts accruedunder these restructuring plans have been exited.
The following table sets forth an analysis of our restructuring accrual activity for the months ended June 30, 2008 (in millions):
Restructuring Plans
VIII VII VI Prior to VI
Total
Severanceand
Benefits
Severanceand
Benefits
FacilitiesRelated
and Other
Severance, Benefits,Facilities Related,
and Other
Severance, Benefits,Facilities Related,
and Other
Balance as of June 30, 2005 . . . . . . . . . . . . . . — — — — 470 470Severance and benefits . . . . . . . . . . . . . . . . — — — 133 61 194Accrued lease costs . . . . . . . . . . . . . . . . . . — — — — 12 12Property and equipment impairment . . . . . — — — 5 80 85Provision adjustments . . . . . . . . . . . . . . . . — — — — (7) (7)
Total restructuring charges . . . . . . . . . . . — — — 138 146 284Cash paid . . . . . . . . . . . . . . . . . . . . . . . . . . . . — — — (1) (208) (209)Non-cash . . . . . . . . . . . . . . . . . . . . . . . . . . . . — — — (5) (80) (85)
Balance as of June 30, 2006 . . . . . . . . . . . . . . — — — 132 328 460Severance and benefits . . . . . . . . . . . . . . . . — — — 68 — 68Property and equipment impairment . . . . . — — — 19 — 19Provision adjustments . . . . . . . . . . . . . . . . — — — (2) 12 10
Total restructuring charges . . . . . . . . . . . — — — 85 12 97Cash paid . . . . . . . . . . . . . . . . . . . . . . . . . . . . — — — (162) (91) (253)Non-cash . . . . . . . . . . . . . . . . . . . . . . . . . . . . — — — (26) (3) (29)
Balance as of June 30, 2007 . . . . . . . . . . . . . . — 29 246 275Severance and benefits . . . . . . . . . . . . . . . . 107 141 — — — 248Property and equipment impairment andother . . . . . . . . . . . . . . . . . . . . . . . . . . . . — — 6 — — 6
Provision adjustments . . . . . . . . . . . . . . . . . — (6) — — 15 9
Total restructuring charges . . . . . . . . . . . $107 $ 135 $ 6 $ — $ 15 $ 263Cash paid . . . . . . . . . . . . . . . . . . . . . . . . . . . . . — (115) (4) (24) (56) (199)Non-Cash . . . . . . . . . . . . . . . . . . . . . . . . . . . . — — — (3) — (3)
Balance as of June 30, 2008 . . . . . . . . . . . . . . $107 $ 20 $ 2 $ 2 $ 205 $ 336
The restructuring charges are based on estimates that are subject to change. Changes to the previous estimates have beenreflected as “Provision adjustments” on the above table in the period the changes in estimates were determined. As of June 30,2008, our estimated sublease income to be generated from sublease contracts not yet negotiated approximated $13 million.Accrued lease costs include accretion expense associated with the passage of time.
The remaining cash expenditures relating to workforce reductions are expected to be paid over the next several quarters. Ouraccrual as of June 30, 2008, for facility-related leases (net of anticipated sublease proceeds), will be paid over their respectivelease terms through fiscal 2024. As of June 30, 2008, of the total $336 million accrual for workforce reductions and facility-related leases, $173 million was classified as current accrued liabilities and other and the remaining $163 million was classifiedas other non-current obligations.
We anticipate recording additional charges related to our workforce and facilities reductions over the next several quarters, thetiming of which will depend upon the timing of notification of the employees leaving as determined by local employment lawsand as we exit facilities.
68
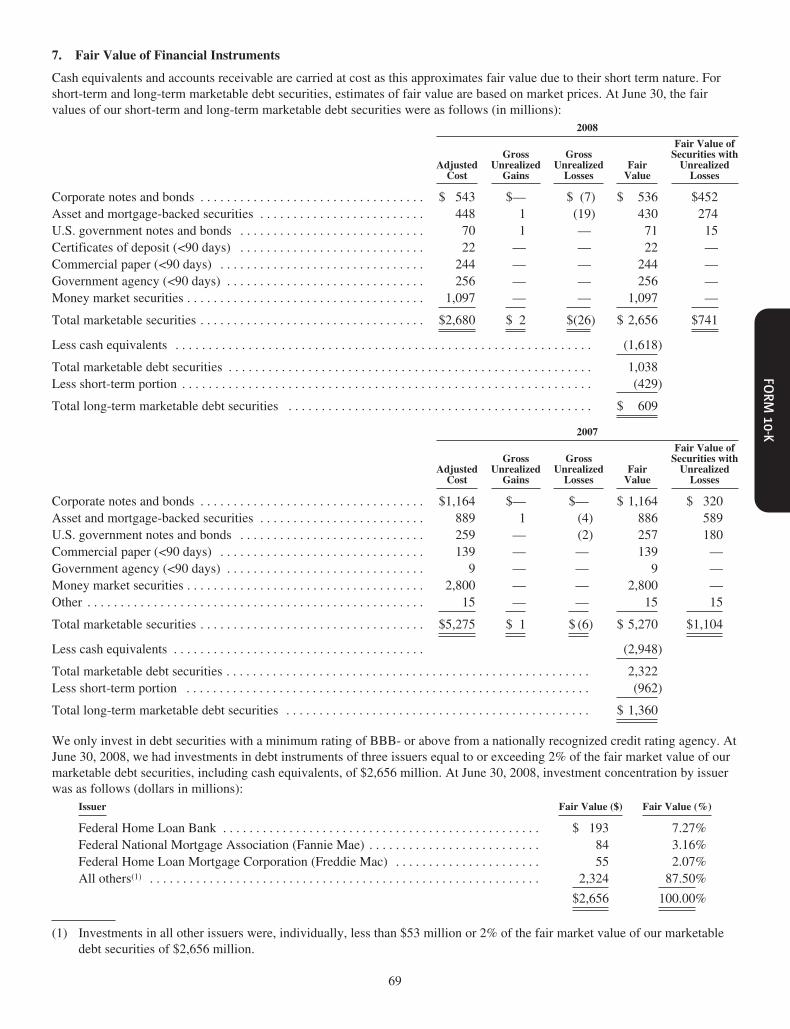
7. Fair Value of Financial Instruments
Cash equivalents and accounts receivable are carried at cost as this approximates fair value due to their short term nature. Forshort-term and long-term marketable debt securities, estimates of fair value are based on market prices. At June 30, the fairvalues of our short-term and long-term marketable debt securities were as follows (in millions):
2008
AdjustedCost
GrossUnrealized
Gains
GrossUnrealizedLosses
FairValue
Fair Value ofSecurities withUnrealizedLosses
Corporate notes and bonds . . . . . . . . . . . . . . . . . . . . . . . . . . . . . . . . . . $ 543 $— $ (7) $ 536 $452Asset and mortgage-backed securities . . . . . . . . . . . . . . . . . . . . . . . . . 448 1 (19) 430 274U.S. government notes and bonds . . . . . . . . . . . . . . . . . . . . . . . . . . . . 70 1 — 71 15Certificates of deposit (<90 days) . . . . . . . . . . . . . . . . . . . . . . . . . . . . 22 — — 22 —Commercial paper (<90 days) . . . . . . . . . . . . . . . . . . . . . . . . . . . . . . . 244 — — 244 —Government agency (<90 days) . . . . . . . . . . . . . . . . . . . . . . . . . . . . . . 256 — — 256 —Money market securities . . . . . . . . . . . . . . . . . . . . . . . . . . . . . . . . . . . . 1,097 — — 1,097 —
Total marketable securities . . . . . . . . . . . . . . . . . . . . . . . . . . . . . . . . . . $2,680 $ 2 $(26) $ 2,656 $741
Less cash equivalents . . . . . . . . . . . . . . . . . . . . . . . . . . . . . . . . . . . . . . . . . . . . . . . . . . . . . . . . . . . . . . . (1,618)
Total marketable debt securities . . . . . . . . . . . . . . . . . . . . . . . . . . . . . . . . . . . . . . . . . . . . . . . . . . . . . . . 1,038Less short-term portion . . . . . . . . . . . . . . . . . . . . . . . . . . . . . . . . . . . . . . . . . . . . . . . . . . . . . . . . . . . . . . (429)
Total long-term marketable debt securities . . . . . . . . . . . . . . . . . . . . . . . . . . . . . . . . . . . . . . . . . . . . . . $ 609
2007
AdjustedCost
GrossUnrealized
Gains
GrossUnrealizedLosses
FairValue
Fair Value ofSecurities withUnrealizedLosses
Corporate notes and bonds . . . . . . . . . . . . . . . . . . . . . . . . . . . . . . . . . . $1,164 $— $— $ 1,164 $ 320Asset and mortgage-backed securities . . . . . . . . . . . . . . . . . . . . . . . . . 889 1 (4) 886 589U.S. government notes and bonds . . . . . . . . . . . . . . . . . . . . . . . . . . . . 259 — (2) 257 180Commercial paper (<90 days) . . . . . . . . . . . . . . . . . . . . . . . . . . . . . . . 139 — — 139 —Government agency (<90 days) . . . . . . . . . . . . . . . . . . . . . . . . . . . . . . 9 — — 9 —Money market securities . . . . . . . . . . . . . . . . . . . . . . . . . . . . . . . . . . . . 2,800 — — 2,800 —Other . . . . . . . . . . . . . . . . . . . . . . . . . . . . . . . . . . . . . . . . . . . . . . . . . . . 15 — — 15 15
Total marketable securities . . . . . . . . . . . . . . . . . . . . . . . . . . . . . . . . . . $5,275 $ 1 $ (6) $ 5,270 $1,104
Less cash equivalents . . . . . . . . . . . . . . . . . . . . . . . . . . . . . . . . . . . . . . (2,948)
Total marketable debt securities . . . . . . . . . . . . . . . . . . . . . . . . . . . . . . . . . . . . . . . . . . . . . . . . . . . . . . . 2,322Less short-term portion . . . . . . . . . . . . . . . . . . . . . . . . . . . . . . . . . . . . . . . . . . . . . . . . . . . . . . . . . . . . . (962)
Total long-term marketable debt securities . . . . . . . . . . . . . . . . . . . . . . . . . . . . . . . . . . . . . . . . . . . . . . $ 1,360
We only invest in debt securities with a minimum rating of BBB- or above from a nationally recognized credit rating agency. AtJune 30, 2008, we had investments in debt instruments of three issuers equal to or exceeding 2% of the fair market value of ourmarketable debt securities, including cash equivalents, of $2,656 million. At June 30, 2008, investment concentration by issuerwas as follows (dollars in millions):
Issuer Fair Value ($) Fair Value (%)
Federal Home Loan Bank . . . . . . . . . . . . . . . . . . . . . . . . . . . . . . . . . . . . . . . . . . . . . . . . $ 193 7.27%Federal National Mortgage Association (Fannie Mae) . . . . . . . . . . . . . . . . . . . . . . . . . . 84 3.16%Federal Home Loan Mortgage Corporation (Freddie Mac) . . . . . . . . . . . . . . . . . . . . . . 55 2.07%All others(1) . . . . . . . . . . . . . . . . . . . . . . . . . . . . . . . . . . . . . . . . . . . . . . . . . . . . . . . . . . . 2,324 87.50%
$2,656 100.00%
(1) Investments in all other issuers were, individually, less than $53 million or 2% of the fair market value of our marketabledebt securities of $2,656 million.
69

Net realized losses before taxes on marketable debt securities totaled $4 million, $0 million and $15 million in fiscal 2008, 2007and 2006, respectively, and were recorded in Interest and other income, net. The cost of securities sold during the year wasdetermined based on the specific identification method. On April 27, 2006, our Chief Executive Officer and Board of Directorsapproved our domestic reinvestment plan. As a result, we repatriated $2 billion in unremitted foreign earnings during the fourthquarter of fiscal 2006 and realized a loss of $14 million associated with the liquidation of a portion of our marketable debtsecurities portfolio.
The following table summarizes the fair value and gross unrealized losses related to available-for-sale securities, aggregated byinvestment category and length of time that individual securities have been in a continuous unrealized loss position, as ofJune 30, 2008 (in millions):
Less Than 12 Months 12 Months or Greater Total
AdjustedCost
GrossUnrealizedLosses
FairValue
AdjustedCost
GrossUnrealizedLosses
FairValue
AdjustedCost
GrossUnrealizedLosses
FairValue
Corporate Notes and Bonds . . . . . . . . . . . . . . . . . $349 $ (4) $345 $110 $ (3) $107 $459 $ (7) $452Asset and Mortgage Backed Securities . . . . . . . . 206 (14) 192 87 (5) 82 293 (19) 274U.S. Government Notes and Bonds . . . . . . . . . . . 15 — 15 — — — 15 — 15
Total Marketable Securities with UnrealizedLosses . . . . . . . . . . . . . . . . . . . . . . . . . . . . . . . $570 $(18) $552 $197 $ (8) $189 $767 $(26) $741
Corporate Notes and Bonds
The unrealized losses were caused by interest rate fluctuations. All of the securities are rated investment grade or better byStandard & Poors or Moody’s. Because the decline in market value is attributed to changes in interest rates and not creditquality, and because we have the ability to hold those investments until recovery of fair value, which may be at maturity, we donot consider those investments to be other-than-temporarily impaired at June 30, 2008.
Asset Backed and Mortgage Backed Securities
Our unrealized loss on investments in asset backed and mortgage backed securities were caused by interest rate fluctuations. Allof these securities are rated investment grade by Standard & Poors or Moody’s. Because the decline in market value is attributedto changes in interest rates and not credit quality and because we have the ability to hold those investments until recovery of fairvalue, which may be at maturity, we do not consider those investments to be other-than-temporarily impaired at June 30, 2008.
U.S. Government Notes and Bonds
The unrealized losses were caused by interest rate fluctuations. These securities are direct obligations of the U.S. Treasury orU.S. Government Agency. Because we have the ability to hold those investments until a recovery, which may be maturity, wedo not consider those investments to be other-than-temporarily impaired at June 30, 2008.
At June 30, 2008, the cost and estimated fair values of short-term and long-term marketable debt securities (excluding cashequivalents) by contractual maturity were as follows (in millions):
Cost Fair Value
Less than one year . . . . . . . . . . . . . . . . . . . . . . . . . . . . . . . . . . . . . . . . . . . . . . . . . . . . . . . . . . . . . $ 432 $ 429Mature in 1-2 years . . . . . . . . . . . . . . . . . . . . . . . . . . . . . . . . . . . . . . . . . . . . . . . . . . . . . . . . . . . . 282 276Mature in 3-5 years . . . . . . . . . . . . . . . . . . . . . . . . . . . . . . . . . . . . . . . . . . . . . . . . . . . . . . . . . . . . 189 186Mature after 5 years . . . . . . . . . . . . . . . . . . . . . . . . . . . . . . . . . . . . . . . . . . . . . . . . . . . . . . . . . . . . 159 147
Total . . . . . . . . . . . . . . . . . . . . . . . . . . . . . . . . . . . . . . . . . . . . . . . . . . . . . . . . . . . . . . . . . . . . . . . . $1,062 $1,038
Asset and mortgage-backed securities were allocated based on their contractual maturity.
Foreign Exchange and Interest Rate Contracts
Foreign currency forward contracts, interest-rate swap agreements and foreign currency option contracts are financialinstruments with carrying values that approximate fair value. The fair value of foreign currency forward contracts is based onthe estimated amount at which they could be settled based on market exchange rates. The fair value of the interest-rate swapagreements and the foreign currency option contracts is obtained from dealer quotes and represents the estimated amount wewould receive or pay to terminate the agreements. However, analysis of market data is required to develop these estimates offair value. Accordingly, the estimates presented herein are not necessarily indicative of the amounts that we could realize in acurrent market exchange.
70
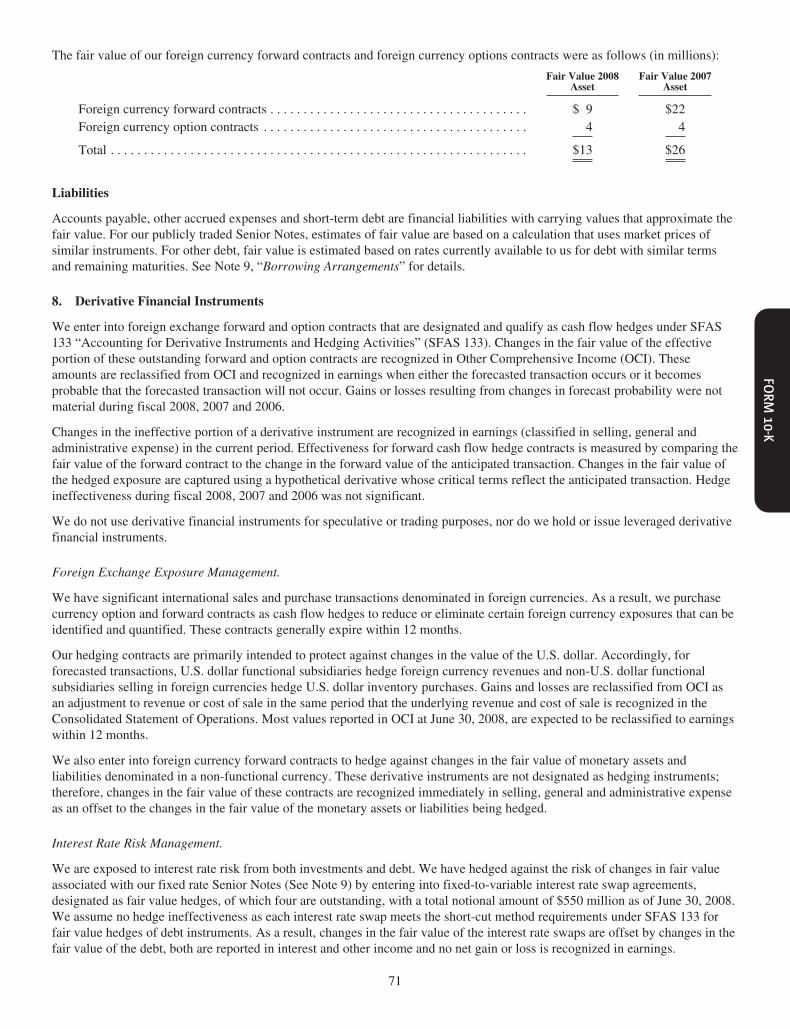
The fair value of our foreign currency forward contracts and foreign currency options contracts were as follows (in millions):
Fair Value 2008Asset
Fair Value 2007Asset
Foreign currency forward contracts . . . . . . . . . . . . . . . . . . . . . . . . . . . . . . . . . . . . . . . $ 9 $22Foreign currency option contracts . . . . . . . . . . . . . . . . . . . . . . . . . . . . . . . . . . . . . . . . 4 4
Total . . . . . . . . . . . . . . . . . . . . . . . . . . . . . . . . . . . . . . . . . . . . . . . . . . . . . . . . . . . . . . . $13 $26
Liabilities
Accounts payable, other accrued expenses and short-term debt are financial liabilities with carrying values that approximate thefair value. For our publicly traded Senior Notes, estimates of fair value are based on a calculation that uses market prices ofsimilar instruments. For other debt, fair value is estimated based on rates currently available to us for debt with similar termsand remaining maturities. See Note 9, “Borrowing Arrangements” for details.
8. Derivative Financial Instruments
We enter into foreign exchange forward and option contracts that are designated and qualify as cash flow hedges under SFAS133 “Accounting for Derivative Instruments and Hedging Activities” (SFAS 133). Changes in the fair value of the effectiveportion of these outstanding forward and option contracts are recognized in Other Comprehensive Income (OCI). Theseamounts are reclassified from OCI and recognized in earnings when either the forecasted transaction occurs or it becomesprobable that the forecasted transaction will not occur. Gains or losses resulting from changes in forecast probability were notmaterial during fiscal 2008, 2007 and 2006.
Changes in the ineffective portion of a derivative instrument are recognized in earnings (classified in selling, general andadministrative expense) in the current period. Effectiveness for forward cash flow hedge contracts is measured by comparing thefair value of the forward contract to the change in the forward value of the anticipated transaction. Changes in the fair value ofthe hedged exposure are captured using a hypothetical derivative whose critical terms reflect the anticipated transaction. Hedgeineffectiveness during fiscal 2008, 2007 and 2006 was not significant.
We do not use derivative financial instruments for speculative or trading purposes, nor do we hold or issue leveraged derivativefinancial instruments.
Foreign Exchange Exposure Management.
We have significant international sales and purchase transactions denominated in foreign currencies. As a result, we purchasecurrency option and forward contracts as cash flow hedges to reduce or eliminate certain foreign currency exposures that can beidentified and quantified. These contracts generally expire within 12 months.
Our hedging contracts are primarily intended to protect against changes in the value of the U.S. dollar. Accordingly, forforecasted transactions, U.S. dollar functional subsidiaries hedge foreign currency revenues and non-U.S. dollar functionalsubsidiaries selling in foreign currencies hedge U.S. dollar inventory purchases. Gains and losses are reclassified from OCI asan adjustment to revenue or cost of sale in the same period that the underlying revenue and cost of sale is recognized in theConsolidated Statement of Operations. Most values reported in OCI at June 30, 2008, are expected to be reclassified to earningswithin 12 months.
We also enter into foreign currency forward contracts to hedge against changes in the fair value of monetary assets andliabilities denominated in a non-functional currency. These derivative instruments are not designated as hedging instruments;therefore, changes in the fair value of these contracts are recognized immediately in selling, general and administrative expenseas an offset to the changes in the fair value of the monetary assets or liabilities being hedged.
Interest Rate Risk Management.
We are exposed to interest rate risk from both investments and debt. We have hedged against the risk of changes in fair valueassociated with our fixed rate Senior Notes (See Note 9) by entering into fixed-to-variable interest rate swap agreements,designated as fair value hedges, of which four are outstanding, with a total notional amount of $550 million as of June 30, 2008.We assume no hedge ineffectiveness as each interest rate swap meets the short-cut method requirements under SFAS 133 forfair value hedges of debt instruments. As a result, changes in the fair value of the interest rate swaps are offset by changes in thefair value of the debt, both are reported in interest and other income and no net gain or loss is recognized in earnings.
71

Accumulated Derivative Gains or Losses.
The following table summarizes activity in OCI related to foreign exchange derivatives held by us during the fiscal years endedJune 30, (in millions):
2008 2007 2006
Unrealized gain (loss), net, on derivative instruments, at beginning of period . . . . . . . . . . . . . $ (5) $ (7) $ 11Decrease in fair value of derivatives . . . . . . . . . . . . . . . . . . . . . . . . . . . . . . . . . . . . . . . . . . . . . . (45) (24) (17)Losses (gains) reclassified from OCI:Revenues . . . . . . . . . . . . . . . . . . . . . . . . . . . . . . . . . . . . . . . . . . . . . . . . . . . . . . . . . . . . . . . . . 31 27 5Cost of sales . . . . . . . . . . . . . . . . . . . . . . . . . . . . . . . . . . . . . . . . . . . . . . . . . . . . . . . . . . . . . . 10 (1) (6)
Unrealized loss, net, on derivative instruments, at end of period . . . . . . . . . . . . . . . . . . . . . . . . $ (9) $ (5) $ (7)
9. Borrowing Arrangements
As of June 30, 2008 and 2007, the balance of long-term debt is as follows (in millions):
MaturitiesJune 30,2008
June 30,2007
7.65% Senior Notes . . . . . . . . . . . . . . . . . . . . . . . . . . . . . . . . . . . . . . . . . . . . . . . . . . . . . . . . . . . . . . 2009 $ 550 $ 5500.625% Convertible Notes . . . . . . . . . . . . . . . . . . . . . . . . . . . . . . . . . . . . . . . . . . . . . . . . . . . . . . . . . 2012 350 3500.75% Convertible Notes . . . . . . . . . . . . . . . . . . . . . . . . . . . . . . . . . . . . . . . . . . . . . . . . . . . . . . . . . . 2014 350 350Interest rate swap agreements . . . . . . . . . . . . . . . . . . . . . . . . . . . . . . . . . . . . . . . . . . . . . . . . . . . . . . 21 17Other . . . . . . . . . . . . . . . . . . . . . . . . . . . . . . . . . . . . . . . . . . . . . . . . . . . . . . . . . . . . . . . . . . . . . . . . . . (6) (2)Total borrowing arrangements . . . . . . . . . . . . . . . . . . . . . . . . . . . . . . . . . . . . . . . . . . . . . . . . . . . . . . $1,265 $1,265Less: current maturities . . . . . . . . . . . . . . . . . . . . . . . . . . . . . . . . . . . . . . . . . . . . . . . . . . . . . . . . . . . — (1)
Total carrying value long-term borrowing arrangements . . . . . . . . . . . . . . . . . . . . . . . . . . . . . . . . . $1,265 $1,264
Total fair value of long-term borrowings arrangements . . . . . . . . . . . . . . . . . . . . . . . . . . . . . . . . . . $1,165 $1,233
In August 1999, we issued $1.5 billion of unsecured senior debt securities in four tranches (the Senior Notes) of which $550million (due on August 15, 2009 and bearing interest at 7.65%) remain. Interest on the Senior Notes is payable semi-annually.We may redeem all or any part of the Senior Notes at any time at a price equal to 100% of the principal plus accrued and unpaidinterest in addition to an amount determined by a quotation agent, representing the present value of the remaining scheduledpayments. The Senior Notes are subject to compliance with certain covenants that do not contain financial ratios. We arecurrently in compliance with these covenants. If we failed to be in compliance with these covenants, the trustee of the SeniorNotes or holders of not less than 25% in principal amount of the Senior Notes would have the ability to demand immediatepayment of all amounts outstanding. In addition, we also entered into various interest-rate swap agreements to modify theinterest characteristics of the Senior Notes so that the interest associated with the Senior Notes effectively becomes variable. Forour publicly traded Senior Notes, estimates of fair value are based on market prices. For our other debt, fair value is calculatedbased on rates currently estimated to be available to us for debt with similar terms and remaining maturities.
Interest expense on our Senior Notes, including the effect of related interest rate swap agreements was $30 million, $39 millionand $55 million in fiscal 2008, 2007 and 2006, respectively.
In January 2007, we issued $350 million principal amount of 0.625% Convertible Senior Notes due February 1, 2012 and $350million principal amount of 0.75% Convertible Senior Notes due February 1, 2014 (the Convertible Notes), to KKR PEI SolarHoldings, I, Ltd., KKR PEI Solar Holdings, II, Ltd. and Citibank, N.A. in a private placement. We received proceeds of $700million from the Convertible Notes and incurred net transaction costs of approximately $9 million, which were allocatedproportionately to the 2012 Notes and the 2014 Notes. The net transaction costs of $9 million included: $8 million paid toKohlberg Kravis Roberts & Co., L.P. (the sponsor) and recorded as a discount on debt in Long-term debt, and $1 million ofother costs recorded in Other non-current assets, net. The net transaction costs are being amortized to interest expense ratablyover five years for the 2012 Notes and seven years for the 2014 Notes. The Convertible Notes are being carried at cost lessunamortized discount. The 2012 Notes and 2014 Notes were each issued at par and bear interest at 0.625% and 0.75% perannum, respectively. Interest is payable semi-annually in arrears on February 1 and August 1, beginning August 1, 2007.
Each $1,000 of principal of the Convertible Notes was initially convertible into 34.6619 shares of our common stock (or a totalof approximately 24 million shares), which is the equivalent of $28.85 per share, subject to adjustment upon the occurrence ofspecified events set forth under terms of the Convertible Notes. Upon conversion, we would pay the holder the cash value of theapplicable number of shares of our common stock, up to the principal amount of the note. Amounts in excess of the principal
72
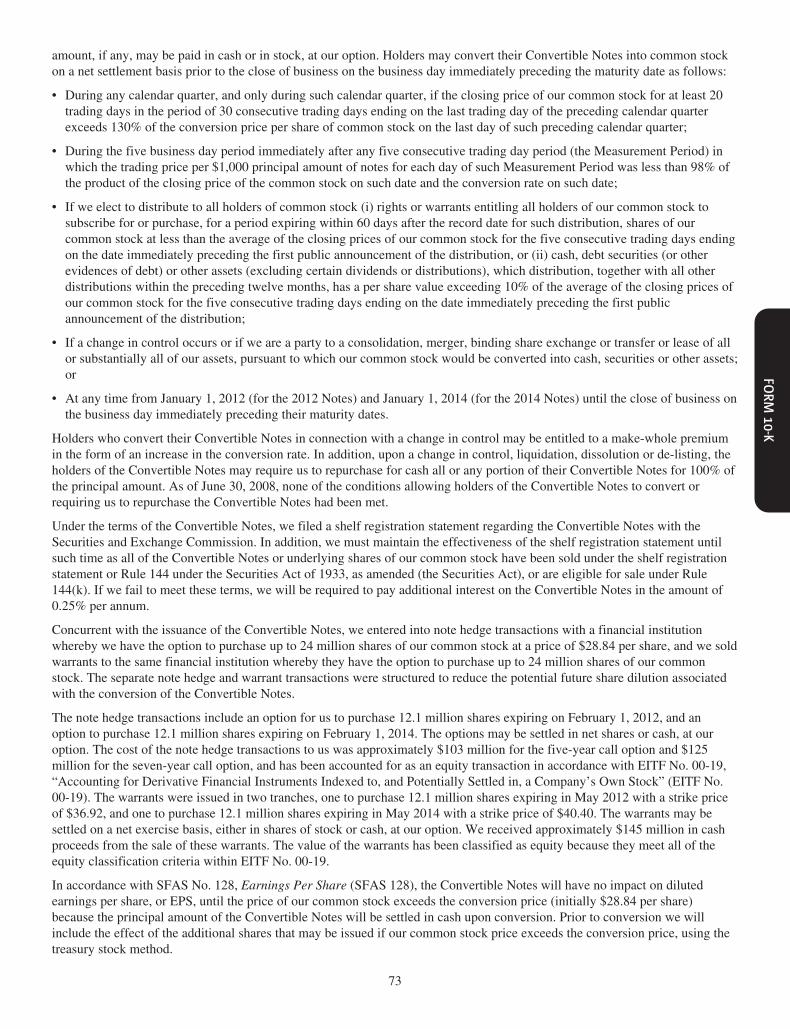
amount, if any, may be paid in cash or in stock, at our option. Holders may convert their Convertible Notes into common stockon a net settlement basis prior to the close of business on the business day immediately preceding the maturity date as follows:
• During any calendar quarter, and only during such calendar quarter, if the closing price of our common stock for at least 20trading days in the period of 30 consecutive trading days ending on the last trading day of the preceding calendar quarterexceeds 130% of the conversion price per share of common stock on the last day of such preceding calendar quarter;
• During the five business day period immediately after any five consecutive trading day period (the Measurement Period) inwhich the trading price per $1,000 principal amount of notes for each day of such Measurement Period was less than 98% ofthe product of the closing price of the common stock on such date and the conversion rate on such date;
• If we elect to distribute to all holders of common stock (i) rights or warrants entitling all holders of our common stock tosubscribe for or purchase, for a period expiring within 60 days after the record date for such distribution, shares of ourcommon stock at less than the average of the closing prices of our common stock for the five consecutive trading days endingon the date immediately preceding the first public announcement of the distribution, or (ii) cash, debt securities (or otherevidences of debt) or other assets (excluding certain dividends or distributions), which distribution, together with all otherdistributions within the preceding twelve months, has a per share value exceeding 10% of the average of the closing prices ofour common stock for the five consecutive trading days ending on the date immediately preceding the first publicannouncement of the distribution;
• If a change in control occurs or if we are a party to a consolidation, merger, binding share exchange or transfer or lease of allor substantially all of our assets, pursuant to which our common stock would be converted into cash, securities or other assets;or
• At any time from January 1, 2012 (for the 2012 Notes) and January 1, 2014 (for the 2014 Notes) until the close of business onthe business day immediately preceding their maturity dates.
Holders who convert their Convertible Notes in connection with a change in control may be entitled to a make-whole premiumin the form of an increase in the conversion rate. In addition, upon a change in control, liquidation, dissolution or de-listing, theholders of the Convertible Notes may require us to repurchase for cash all or any portion of their Convertible Notes for 100% ofthe principal amount. As of June 30, 2008, none of the conditions allowing holders of the Convertible Notes to convert orrequiring us to repurchase the Convertible Notes had been met.
Under the terms of the Convertible Notes, we filed a shelf registration statement regarding the Convertible Notes with theSecurities and Exchange Commission. In addition, we must maintain the effectiveness of the shelf registration statement untilsuch time as all of the Convertible Notes or underlying shares of our common stock have been sold under the shelf registrationstatement or Rule 144 under the Securities Act of 1933, as amended (the Securities Act), or are eligible for sale under Rule144(k). If we fail to meet these terms, we will be required to pay additional interest on the Convertible Notes in the amount of0.25% per annum.
Concurrent with the issuance of the Convertible Notes, we entered into note hedge transactions with a financial institutionwhereby we have the option to purchase up to 24 million shares of our common stock at a price of $28.84 per share, and we soldwarrants to the same financial institution whereby they have the option to purchase up to 24 million shares of our commonstock. The separate note hedge and warrant transactions were structured to reduce the potential future share dilution associatedwith the conversion of the Convertible Notes.
The note hedge transactions include an option for us to purchase 12.1 million shares expiring on February 1, 2012, and anoption to purchase 12.1 million shares expiring on February 1, 2014. The options may be settled in net shares or cash, at ouroption. The cost of the note hedge transactions to us was approximately $103 million for the five-year call option and $125million for the seven-year call option, and has been accounted for as an equity transaction in accordance with EITF No. 00-19,“Accounting for Derivative Financial Instruments Indexed to, and Potentially Settled in, a Company’s Own Stock” (EITF No.00-19). The warrants were issued in two tranches, one to purchase 12.1 million shares expiring in May 2012 with a strike priceof $36.92, and one to purchase 12.1 million shares expiring in May 2014 with a strike price of $40.40. The warrants may besettled on a net exercise basis, either in shares of stock or cash, at our option. We received approximately $145 million in cashproceeds from the sale of these warrants. The value of the warrants has been classified as equity because they meet all of theequity classification criteria within EITF No. 00-19.
In accordance with SFAS No. 128, Earnings Per Share (SFAS 128), the Convertible Notes will have no impact on dilutedearnings per share, or EPS, until the price of our common stock exceeds the conversion price (initially $28.84 per share)because the principal amount of the Convertible Notes will be settled in cash upon conversion. Prior to conversion we willinclude the effect of the additional shares that may be issued if our common stock price exceeds the conversion price, using thetreasury stock method.
73

Also, in accordance with SFAS 128, the warrants sold in connection with the hedge transactions will have no impact on EPSuntil our share price exceeds $36.92 for the warrants that expire on May 1, 2012 and $40.40 for the warrants that expire onMay 1, 2014. Prior to exercise, we will include the effect of additional shares that may be issued using the treasury stockmethod. The call options purchased as part of the note hedge transactions are anti-dilutive and therefore will have no impact onEPS.
As discussed in Note 2, in May 2008, the FASB issued FSP APB 14-1. The FSP will require us to separately account for theliability and equity components of the instrument in a manner that reflects our nonconvertible debt borrowing rate when interestcost is recognized in subsequent periods. The FSP will require bifurcation of a component of the debt, classification of thatcomponent in equity and then accretion of the resulting discount on the debt as part of interest expense being reflected in theincome statement. In addition, the FSP will require certain additional disclosures that were not included in the original proposal.The FSP will be effective for fiscal years beginning after December 15, 2008 and we are required to adopt the FSP in our firstquarter of fiscal 2010. The FSP will not permit early application and will require retrospective application to all periodspresented.
Uncommitted lines of credit
At June 30, 2008 and June 30, 2007, we and our subsidiaries had uncommitted lines of credit aggregating approximately $427million and $386 million, respectively. No amounts were drawn from these lines of credit as of June 30, 2008 and June 30,2007. Interest rates and other terms of borrowing under these lines of credit vary from country to country depending on localmarket conditions at the time of borrowing. There is no guarantee that the banks would approve our request for funds underthese uncommitted lines of credit.
10. Income Taxes
Income tax expense is based on pretax financial accounting income. Deferred tax assets and liabilities are determined based onthe difference between the U.S. GAAP financial statements and tax basis of assets and liabilities using enacted tax rates in effectfor the year in which the differences are expected to reverse.
In the fiscal years ended June 30, income (loss) before income taxes and the provision for (benefit from) income taxes consistedof the following (in millions):
2008 2007 2006
Income (loss) before income taxes:United States . . . . . . . . . . . . . . . . . . . . . . . . . . . . . . . . . . . . . . . . . . . . . . . . . . . . . . . . . . $ 155 $129 $(1,097)Foreign . . . . . . . . . . . . . . . . . . . . . . . . . . . . . . . . . . . . . . . . . . . . . . . . . . . . . . . . . . . . . . . 455 454 422
Total income (loss) before income taxes . . . . . . . . . . . . . . . . . . . . . . . . . . . . . . . . . . . $ 610 $583 $ (675)
Provision for (benefit from) income taxes:Current:United States federal . . . . . . . . . . . . . . . . . . . . . . . . . . . . . . . . . . . . . . . . . . . . . . . . . . . . $(113) $ (42) $ 77State . . . . . . . . . . . . . . . . . . . . . . . . . . . . . . . . . . . . . . . . . . . . . . . . . . . . . . . . . . . . . . . . . 5 (9) (5)Foreign . . . . . . . . . . . . . . . . . . . . . . . . . . . . . . . . . . . . . . . . . . . . . . . . . . . . . . . . . . . . . . . 154 126 143
Total current income taxes . . . . . . . . . . . . . . . . . . . . . . . . . . . . . . . . . . . . . . . . . . . . . 46 75 215Deferred:United States federal . . . . . . . . . . . . . . . . . . . . . . . . . . . . . . . . . . . . . . . . . . . . . . . . . . . . 220 33 1State . . . . . . . . . . . . . . . . . . . . . . . . . . . . . . . . . . . . . . . . . . . . . . . . . . . . . . . . . . . . . . . . . (23) 3 —Foreign . . . . . . . . . . . . . . . . . . . . . . . . . . . . . . . . . . . . . . . . . . . . . . . . . . . . . . . . . . . . . . . (36) (1) (27)
Total deferred income taxes . . . . . . . . . . . . . . . . . . . . . . . . . . . . . . . . . . . . . . . . . . . . 161 35 (26)
Provision for (benefit from) income taxes . . . . . . . . . . . . . . . . . . . . . . . . . . . . . . . . . . . . . . $ 207 $110 $ 189
Deferred income taxes reflect the net tax effects of temporary differences between the carrying amounts of assets and liabilitiesfor financial reporting purposes and the amounts used for income tax purposes.
74
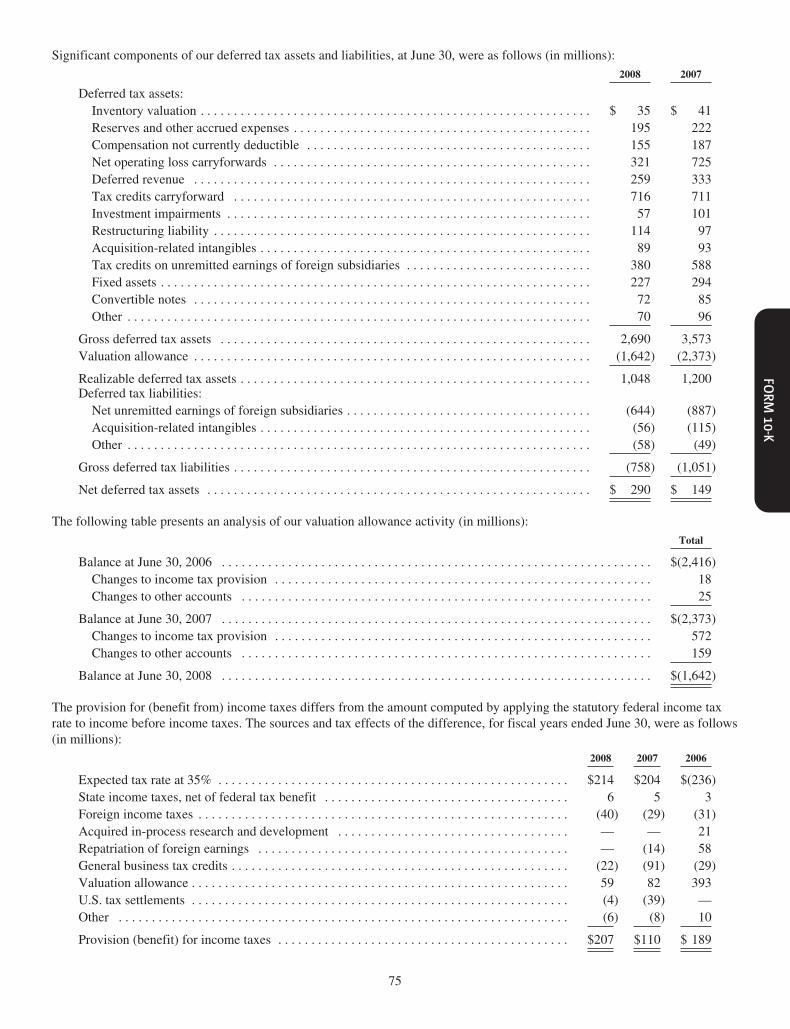
Significant components of our deferred tax assets and liabilities, at June 30, were as follows (in millions):2008 2007
Deferred tax assets:Inventory valuation . . . . . . . . . . . . . . . . . . . . . . . . . . . . . . . . . . . . . . . . . . . . . . . . . . . . . . . . . . . $ 35 $ 41Reserves and other accrued expenses . . . . . . . . . . . . . . . . . . . . . . . . . . . . . . . . . . . . . . . . . . . . . 195 222Compensation not currently deductible . . . . . . . . . . . . . . . . . . . . . . . . . . . . . . . . . . . . . . . . . . . 155 187Net operating loss carryforwards . . . . . . . . . . . . . . . . . . . . . . . . . . . . . . . . . . . . . . . . . . . . . . . . 321 725Deferred revenue . . . . . . . . . . . . . . . . . . . . . . . . . . . . . . . . . . . . . . . . . . . . . . . . . . . . . . . . . . . . 259 333Tax credits carryforward . . . . . . . . . . . . . . . . . . . . . . . . . . . . . . . . . . . . . . . . . . . . . . . . . . . . . . 716 711Investment impairments . . . . . . . . . . . . . . . . . . . . . . . . . . . . . . . . . . . . . . . . . . . . . . . . . . . . . . . 57 101Restructuring liability . . . . . . . . . . . . . . . . . . . . . . . . . . . . . . . . . . . . . . . . . . . . . . . . . . . . . . . . . 114 97Acquisition-related intangibles . . . . . . . . . . . . . . . . . . . . . . . . . . . . . . . . . . . . . . . . . . . . . . . . . . 89 93Tax credits on unremitted earnings of foreign subsidiaries . . . . . . . . . . . . . . . . . . . . . . . . . . . . 380 588Fixed assets . . . . . . . . . . . . . . . . . . . . . . . . . . . . . . . . . . . . . . . . . . . . . . . . . . . . . . . . . . . . . . . . . 227 294Convertible notes . . . . . . . . . . . . . . . . . . . . . . . . . . . . . . . . . . . . . . . . . . . . . . . . . . . . . . . . . . . . 72 85Other . . . . . . . . . . . . . . . . . . . . . . . . . . . . . . . . . . . . . . . . . . . . . . . . . . . . . . . . . . . . . . . . . . . . . . 70 96
Gross deferred tax assets . . . . . . . . . . . . . . . . . . . . . . . . . . . . . . . . . . . . . . . . . . . . . . . . . . . . . . . . 2,690 3,573Valuation allowance . . . . . . . . . . . . . . . . . . . . . . . . . . . . . . . . . . . . . . . . . . . . . . . . . . . . . . . . . . . . (1,642) (2,373)
Realizable deferred tax assets . . . . . . . . . . . . . . . . . . . . . . . . . . . . . . . . . . . . . . . . . . . . . . . . . . . . . 1,048 1,200Deferred tax liabilities:Net unremitted earnings of foreign subsidiaries . . . . . . . . . . . . . . . . . . . . . . . . . . . . . . . . . . . . . (644) (887)Acquisition-related intangibles . . . . . . . . . . . . . . . . . . . . . . . . . . . . . . . . . . . . . . . . . . . . . . . . . . (56) (115)Other . . . . . . . . . . . . . . . . . . . . . . . . . . . . . . . . . . . . . . . . . . . . . . . . . . . . . . . . . . . . . . . . . . . . . . (58) (49)
Gross deferred tax liabilities . . . . . . . . . . . . . . . . . . . . . . . . . . . . . . . . . . . . . . . . . . . . . . . . . . . . . . (758) (1,051)
Net deferred tax assets . . . . . . . . . . . . . . . . . . . . . . . . . . . . . . . . . . . . . . . . . . . . . . . . . . . . . . . . . . $ 290 $ 149
The following table presents an analysis of our valuation allowance activity (in millions):Total
Balance at June 30, 2006 . . . . . . . . . . . . . . . . . . . . . . . . . . . . . . . . . . . . . . . . . . . . . . . . . . . . . . . . . . . . . . . . . $(2,416)Changes to income tax provision . . . . . . . . . . . . . . . . . . . . . . . . . . . . . . . . . . . . . . . . . . . . . . . . . . . . . . . . . 18Changes to other accounts . . . . . . . . . . . . . . . . . . . . . . . . . . . . . . . . . . . . . . . . . . . . . . . . . . . . . . . . . . . . . . 25
Balance at June 30, 2007 . . . . . . . . . . . . . . . . . . . . . . . . . . . . . . . . . . . . . . . . . . . . . . . . . . . . . . . . . . . . . . . . . $(2,373)Changes to income tax provision . . . . . . . . . . . . . . . . . . . . . . . . . . . . . . . . . . . . . . . . . . . . . . . . . . . . . . . . . 572Changes to other accounts . . . . . . . . . . . . . . . . . . . . . . . . . . . . . . . . . . . . . . . . . . . . . . . . . . . . . . . . . . . . . . 159
Balance at June 30, 2008 . . . . . . . . . . . . . . . . . . . . . . . . . . . . . . . . . . . . . . . . . . . . . . . . . . . . . . . . . . . . . . . . . $(1,642)
The provision for (benefit from) income taxes differs from the amount computed by applying the statutory federal income taxrate to income before income taxes. The sources and tax effects of the difference, for fiscal years ended June 30, were as follows(in millions):
2008 2007 2006
Expected tax rate at 35% . . . . . . . . . . . . . . . . . . . . . . . . . . . . . . . . . . . . . . . . . . . . . . . . . . . . . $214 $204 $(236)State income taxes, net of federal tax benefit . . . . . . . . . . . . . . . . . . . . . . . . . . . . . . . . . . . . . 6 5 3Foreign income taxes . . . . . . . . . . . . . . . . . . . . . . . . . . . . . . . . . . . . . . . . . . . . . . . . . . . . . . . . (40) (29) (31)Acquired in-process research and development . . . . . . . . . . . . . . . . . . . . . . . . . . . . . . . . . . . — — 21Repatriation of foreign earnings . . . . . . . . . . . . . . . . . . . . . . . . . . . . . . . . . . . . . . . . . . . . . . . — (14) 58General business tax credits . . . . . . . . . . . . . . . . . . . . . . . . . . . . . . . . . . . . . . . . . . . . . . . . . . . (22) (91) (29)Valuation allowance . . . . . . . . . . . . . . . . . . . . . . . . . . . . . . . . . . . . . . . . . . . . . . . . . . . . . . . . . 59 82 393U.S. tax settlements . . . . . . . . . . . . . . . . . . . . . . . . . . . . . . . . . . . . . . . . . . . . . . . . . . . . . . . . . (4) (39) —Other . . . . . . . . . . . . . . . . . . . . . . . . . . . . . . . . . . . . . . . . . . . . . . . . . . . . . . . . . . . . . . . . . . . . (6) (8) 10
Provision (benefit) for income taxes . . . . . . . . . . . . . . . . . . . . . . . . . . . . . . . . . . . . . . . . . . . . $207 $110 $ 189
75

U.S. income taxes have been provided on all undistributed earnings of our foreign subsidiaries. As of June 30, 2008, there areno earnings that are considered to be permanently invested in operations outside of the U.S. However, we may elect topermanently invest in operations outside of the U.S. in the future. During the fourth quarter of fiscal 2006, we repatriated $2billion of foreign earnings, the majority of which was eligible to be taxed at a reduced effective tax rate under the ForeignEarnings Repatriation Provision of the American Jobs Creation Act.
As of June 30, 2008, we had aggregate federal net operating loss carryforwards of $88 million. If not utilized, thesecarryforwards will expire in fiscal years 2012 through 2026. The use of the federal net operating loss carryforwards in any onefiscal year is limited due to prior changes in ownership incurred by acquired companies. As of June 30, 2008, we had aggregatestate net operating loss carryforwards of $995 million. If not utilized, these carryforwards will expire in fiscal years 2009through 2027.
As of June 30, 2008, we had aggregate foreign net operating loss carryforwards of $937 million. Foreign net operating losscarryforwards of $52 million, if unused, will expire in fiscal years 2011 through 2018. The remaining foreign operating losscarryforwards of $885 million have an indefinite life.
As of June 30, 2008, we had federal and state tax credit carryforwards for income tax purposes of $555 and $370 million,respectively. If not utilized, the federal credits of $550 million will expire in fiscal years 2011 through 2028. The remainingfederal tax credit carryforwards of $5 million have an indefinite life. State tax credit carryforwards of $55 million will expire infiscal years 2009 through 2026. The remaining state tax credit carryforwards of $315 million have an indefinite life.
For fiscal 2008 and 2007, the provision includes a reduction in income taxes payable in the U.S. of $3 million and $24 million,respectively, from deductions associated with our various stock option plans with a credit to stockholders’ equity. The provisionfor fiscal 2006 does not reflect the tax savings resulting from deductions associated with our various stock option plans.
Deferred tax assets of approximately $5 million pertain to certain deductible temporary differences and net operating losscarryforwards acquired in certain purchase business combinations. When realized, the reversal of the valuation allowance willbe accounted for as a credit to existing goodwill or other long-term intangibles of the acquired entity rather than as a reductionof the period’s income tax provision. If no goodwill or long-term intangible assets remain, the credit would reduce the incometax provision in the current period.
In connection with our fiscal 2008 acquisitions, we recorded $814 million of goodwill. Of that total amount, approximately$686 million is expected to be deductible for tax purposes over 15 years. None of the goodwill recorded for our fiscal 2007 and2006 acquisitions is expected to be deductible. Refer to Footnote 4 of our consolidated financial statements for furtherinformation regarding business combinations.
Deferred tax assets of approximately $72 million relate to convertible debt. When realized, the reversal of the valuationallowance will be accounted for as a credit to stockholders’ equity rather than as a reduction to the income tax provision.
We believe it is more likely than not that $290 million of deferred tax assets will be realized in the foreseeable future.Realization of our net deferred tax assets is dependent upon our generation of sufficient taxable income in future years inappropriate tax jurisdictions to obtain benefit from the reversal of temporary differences, net operating loss carryforwards, andfrom tax credit carryforwards. The amount of deferred tax assets considered realizable is subject to adjustment in future periodsif estimates of future taxable income are reduced.
In evaluating our ability to recover our deferred tax assets, we consider all available positive and negative evidence includingour past operating results, the existence of cumulative losses in the most recent fiscal years and our forecast of future taxableincome. In determining future taxable income, we are responsible for assumptions utilized including the amount of state, federaland international pre-tax operating income, the reversal of temporary differences and the implementation of feasible and prudenttax planning strategies. These assumptions require significant judgment about the forecasts of future taxable income and areconsistent with the plans and estimates we are using to manage the underlying businesses.
On July 1, 2007, we adopted FIN 48. As a result of the implementation of FIN 48, we increased the liability for netunrecognized tax benefits by $204 million. The cumulative effect of the change in accounting principle resulted in an increase inretained earnings of $9 million. In addition, the requirements of the adoption of FIN 48 resulted in adjustments to other balancesheet accounts of $213 million, principally related to the reclassification of a portion of the valuation allowance on our deferredtax assets. The total amount of gross unrecognized tax benefits at the date of adoption was $410 million, including interest andpenalties of $35 million.
76
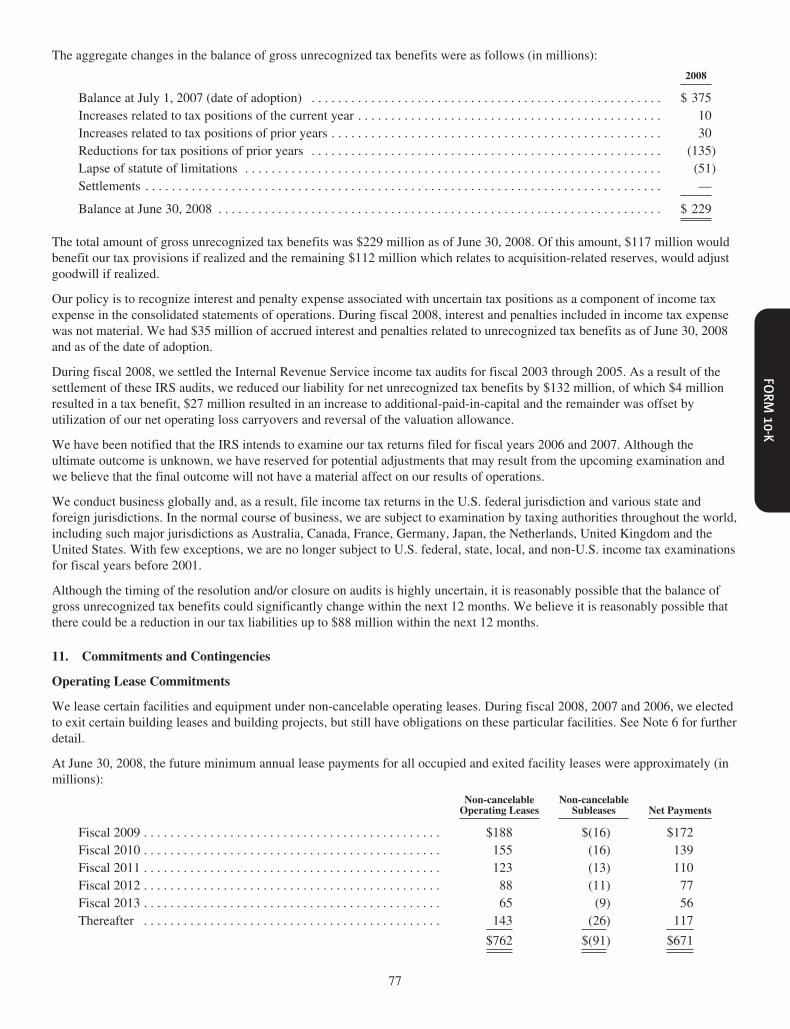
The aggregate changes in the balance of gross unrecognized tax benefits were as follows (in millions):
2008
Balance at July 1, 2007 (date of adoption) . . . . . . . . . . . . . . . . . . . . . . . . . . . . . . . . . . . . . . . . . . . . . . . . . . . . . $ 375Increases related to tax positions of the current year . . . . . . . . . . . . . . . . . . . . . . . . . . . . . . . . . . . . . . . . . . . . . . 10Increases related to tax positions of prior years . . . . . . . . . . . . . . . . . . . . . . . . . . . . . . . . . . . . . . . . . . . . . . . . . . 30Reductions for tax positions of prior years . . . . . . . . . . . . . . . . . . . . . . . . . . . . . . . . . . . . . . . . . . . . . . . . . . . . . (135)Lapse of statute of limitations . . . . . . . . . . . . . . . . . . . . . . . . . . . . . . . . . . . . . . . . . . . . . . . . . . . . . . . . . . . . . . . (51)Settlements . . . . . . . . . . . . . . . . . . . . . . . . . . . . . . . . . . . . . . . . . . . . . . . . . . . . . . . . . . . . . . . . . . . . . . . . . . . . . . —
Balance at June 30, 2008 . . . . . . . . . . . . . . . . . . . . . . . . . . . . . . . . . . . . . . . . . . . . . . . . . . . . . . . . . . . . . . . . . . . $ 229
The total amount of gross unrecognized tax benefits was $229 million as of June 30, 2008. Of this amount, $117 million wouldbenefit our tax provisions if realized and the remaining $112 million which relates to acquisition-related reserves, would adjustgoodwill if realized.
Our policy is to recognize interest and penalty expense associated with uncertain tax positions as a component of income taxexpense in the consolidated statements of operations. During fiscal 2008, interest and penalties included in income tax expensewas not material. We had $35 million of accrued interest and penalties related to unrecognized tax benefits as of June 30, 2008and as of the date of adoption.
During fiscal 2008, we settled the Internal Revenue Service income tax audits for fiscal 2003 through 2005. As a result of thesettlement of these IRS audits, we reduced our liability for net unrecognized tax benefits by $132 million, of which $4 millionresulted in a tax benefit, $27 million resulted in an increase to additional-paid-in-capital and the remainder was offset byutilization of our net operating loss carryovers and reversal of the valuation allowance.
We have been notified that the IRS intends to examine our tax returns filed for fiscal years 2006 and 2007. Although theultimate outcome is unknown, we have reserved for potential adjustments that may result from the upcoming examination andwe believe that the final outcome will not have a material affect on our results of operations.
We conduct business globally and, as a result, file income tax returns in the U.S. federal jurisdiction and various state andforeign jurisdictions. In the normal course of business, we are subject to examination by taxing authorities throughout the world,including such major jurisdictions as Australia, Canada, France, Germany, Japan, the Netherlands, United Kingdom and theUnited States. With few exceptions, we are no longer subject to U.S. federal, state, local, and non-U.S. income tax examinationsfor fiscal years before 2001.
Although the timing of the resolution and/or closure on audits is highly uncertain, it is reasonably possible that the balance ofgross unrecognized tax benefits could significantly change within the next 12 months. We believe it is reasonably possible thatthere could be a reduction in our tax liabilities up to $88 million within the next 12 months.
11. Commitments and Contingencies
Operating Lease Commitments
We lease certain facilities and equipment under non-cancelable operating leases. During fiscal 2008, 2007 and 2006, we electedto exit certain building leases and building projects, but still have obligations on these particular facilities. See Note 6 for furtherdetail.
At June 30, 2008, the future minimum annual lease payments for all occupied and exited facility leases were approximately (inmillions):
Non-cancelableOperating Leases
Non-cancelableSubleases Net Payments
Fiscal 2009 . . . . . . . . . . . . . . . . . . . . . . . . . . . . . . . . . . . . . . . . . . . . . $188 $(16) $172Fiscal 2010 . . . . . . . . . . . . . . . . . . . . . . . . . . . . . . . . . . . . . . . . . . . . . 155 (16) 139Fiscal 2011 . . . . . . . . . . . . . . . . . . . . . . . . . . . . . . . . . . . . . . . . . . . . . 123 (13) 110Fiscal 2012 . . . . . . . . . . . . . . . . . . . . . . . . . . . . . . . . . . . . . . . . . . . . . 88 (11) 77Fiscal 2013 . . . . . . . . . . . . . . . . . . . . . . . . . . . . . . . . . . . . . . . . . . . . . 65 (9) 56Thereafter . . . . . . . . . . . . . . . . . . . . . . . . . . . . . . . . . . . . . . . . . . . . . 143 (26) 117
$762 $(91) $671
77
Rent expense under the non-cancelable operating leases was $180 million, $186 million and $155 million in fiscal 2008, 2007and 2006, respectively.
Asset Retirement Obligations and Environmental Liabilities
We have asset retirement obligations primarily resulting from certain leased facilities where we have contractual commitmentsto remove leasehold improvements and return the property to a specified condition when the lease terminates. At June 30, 2008and 2007, the net present value of these obligations was $42 million and $32 million, respectively, and were primarily classifiedin other non-current obligations. At June 30, 2008 and 2007, the asset balances related to our asset retirement obligationsapproximated $14 million and $6 million, respectively. The amount of amortization of the associated leasehold assets andaccretion expense associated with our asset retirement obligations have not been material.
Guarantees, Letters of Credit and Indemnification Obligations
In the normal course of our business, we issue guarantees and letters of credit to numerous third-parties and for various purposessuch as lease obligations, performance guarantees and state and local governmental agencies, requirements. At June 30, 2008,we had approximately $52 million of outstanding financial letters of credit.
In the normal course of business, we may enter into contractual arrangements under which we may agree to indemnify the thirdparty to such arrangement from any losses incurred relating to the services they perform on our behalf or for losses arising fromcertain events as defined within the particular contract, which may include, for example, litigation or claims relating to pastperformance. Such indemnification obligations may not be subject to maximum loss clauses. Historically, payments maderelated to these indemnifications have not been material.
We utilized several contract manufacturers to manufacture sub-assemblies for our products and to perform final assembly andtest of finished products. These contract manufacturers acquire components and build product based on demand informationsupplied by us. We also obtain individual components for our products from a variety of individual suppliers. We acquirecomponents through a combination of purchase orders, supplier contracts and open orders based on projected demandinformation. Such purchase commitments are based on our forecasted component and manufacturing requirements and typicallyprovide for fulfillment within agreed-upon lead-times and/or commercially standard lead-times for the particular part orproduct. We estimate that these contractual obligations at June 30, 2008 were no more than $595 million and were primarily duein less than one year from June 30, 2008. This amount does not include contractual obligations recorded on the ConsolidatedBalance Sheets as current liabilities. Additionally, we have committed to purchase certain outsourced services where we wouldincur a penalty if the agreement was canceled prior to a contractual minimum term. We estimate that our contractual obligationsassociated with outsourced services at June 30, 2008 were no more than $16 million. Our asset retirement obligations arise fromleased facilities where we have contractual commitments to remove leasehold improvements and return the property to aspecified condition when the lease terminates.
In fiscal 2006, as part of our service-based sales arrangement involving a governmental institution in Mexico, we were requiredto issue three guarantee bonds, with the total amount of approximately $41 million, as collateral guaranteeing our performanceunder the arrangement. The bonds required a security deposit of $41 million, paid to surety companies, which was classified asOther non-current assets, net, in our June 30, 2007 Consolidated Balance Sheet. In fiscal 2008, the security deposit of $41million was returned to us and replaced with a cash secured letter of credit of $21 million. The deposits of $21 million used tosecure the letter of credit is classified as Other non-current assets, net, in our June 30, 2008 Consolidated Balance Sheet,respectively.
Litigation and Other Contingencies
In fiscal 2005, the GSA began auditing our records under the agreements it had with us at that time. A lawsuit related to theaudit and our performance under our GSA contract and other government contracts has been filed against us in the United StatesDistrict Court for the District of Arkansas. It includes claims under the Federal False Claims and Anti-Kickback Acts, as well asbreach of contract and other claims, including claims related to certain rebates, discounts and other payments or benefitsprovided by us to our resellers and technology integrators. The parties continue to discuss the nature of the government’s currentand potential claims on our GSA and other government sales. If this matter proceeds to trial, possible sanctions include anaward of damages, including treble damages, fines, penalties and other sanctions, up to and including suspension or debarmentfrom sales to the federal government. Although we are interested in pursuing an amicable resolution, we intend to present avigorous factual and legal defense throughout the course of these proceedings.
As required by SFAS 5, we accrue for contingencies when we believe that a loss is probable and that we can reasonablyestimate the amount of any such loss. We have made an assessment of the probability of incurring any such losses and such
78

amounts are reflected in our Consolidated Financial Statements. Litigation is inherently unpredictable and it is difficult topredict the outcome of particular matters with reasonable certainty and, therefore, the actual amount of any loss may prove to belarger or smaller than the amounts reflected in our Consolidated Financial Statements.
12. Settlement Income
On March 8, 2002, we filed suit against Microsoft Corporation (Microsoft), pursuant to United States and State of Californiaantitrust and other laws. In February 2003, Microsoft filed four counterclaims against us. The presiding judge dismissed two ofthe four Microsoft counterclaims.
On April 1, 2004, we entered into several agreements with Microsoft including an agreement to settle all pending litigationbetween the two companies. Pursuant to the settlement agreement, Microsoft agreed to pay to us the amount of $700 million.
Pursuant to a patent covenant and stand-still agreement, the parties agreed not to sue each other for past damages for patentinfringement with respect to the other party’s products and technologies (the Covenant Not to Sue for Damages). Each year until2014, Microsoft has the option of extending the Covenant Not to Sue for Damages to apply to the preceding year in exchangefor an annual extension payment, so long as Microsoft has made all previous annual extension payments and so long asMicrosoft has not sued us or authorized licensees of our commercial products for patent infringement prior to such time. At theend of the ten-year term, if Microsoft has made all such payments and not brought any such suits, then each party willautomatically grant to the other party irrevocable, non-exclusive, perpetual licenses under all of its patents and patentapplications existing at the end of such period in order to allow such other party to continue to commercialize its productsshipping at the end of such period. Microsoft also agreed to pay to us the amount of $900 million under this patent covenant andstandstill agreement.
Pursuant to a technical collaboration agreement, each party agreed to provide the other party with access to aspects of itsdesktop and server-based technology for use in developing interoperable server products. Microsoft also agreed to pay to us theamount of $350 million as a prepaid nonrefundable royalty under this technical collaboration agreement.
Based on the agreements with Microsoft described above, we recognized $45 million, $54 million and $54 million in settlementincome in the fiscal years ended 2008, 2007 and 2006, respectively, and will maintain a deferred gain of approximately $352million, primarily related to the prepaid nonrefundable royalty paid by Microsoft under the technical collaboration agreement,as other non-current obligations until the earlier of usage of the royalties by Microsoft or such time as all our obligations havebeen met.
13. Stockholders’ Equity
Stockholders’ Rights Plan
Effective May 31, 2006, our Board of Directors voted to terminate our Stockholders’ Rights Plan, which was originallyscheduled to expire on July 25, 2012.
Authorized Preferred Stock
We are authorized to issue up to 10 million shares of preferred stock, with preferences to be determined at the discretion of theBoard of the Directors at the time of the issuance. As of June 30, 2008, we have no preferred stock issued and outstanding.
Common Stock Repurchase Programs
In May 2007, our Board of Directors authorized management to repurchase up to $3 billion of our outstanding common stock.Under this authorization, the timing and actual number of shares subject to repurchase are at the discretion of management andare contingent on a number of factors, such as levels of cash generation from operations, cash requirements for acquisitions,repayment of debt and our share price. During the fiscal years ended June 30, 2008 and 2007, we repurchased approximately151 million shares or $2.8 billion, and 9.7 million shares or $200 million, respectively, of common stock under this repurchaseauthorization. During fiscal years 2007 and 2006, we did not repurchase common stock under our prior repurchase authorizationannounced in February 2001, which was canceled at the inception of the new plan. All repurchases were made in compliancewith Rule 10b-18 under the Securities Exchange Act of 1934, as amended.
When treasury shares are reissued, any excess of the acquisition costs of the shares, determined on a first-in-first-out basis, overthe proceeds from reissuance is charged to additional paid-in-capital to the extent of previous credits on similar transactions,with any remaining amounts charged to retained earnings.
79
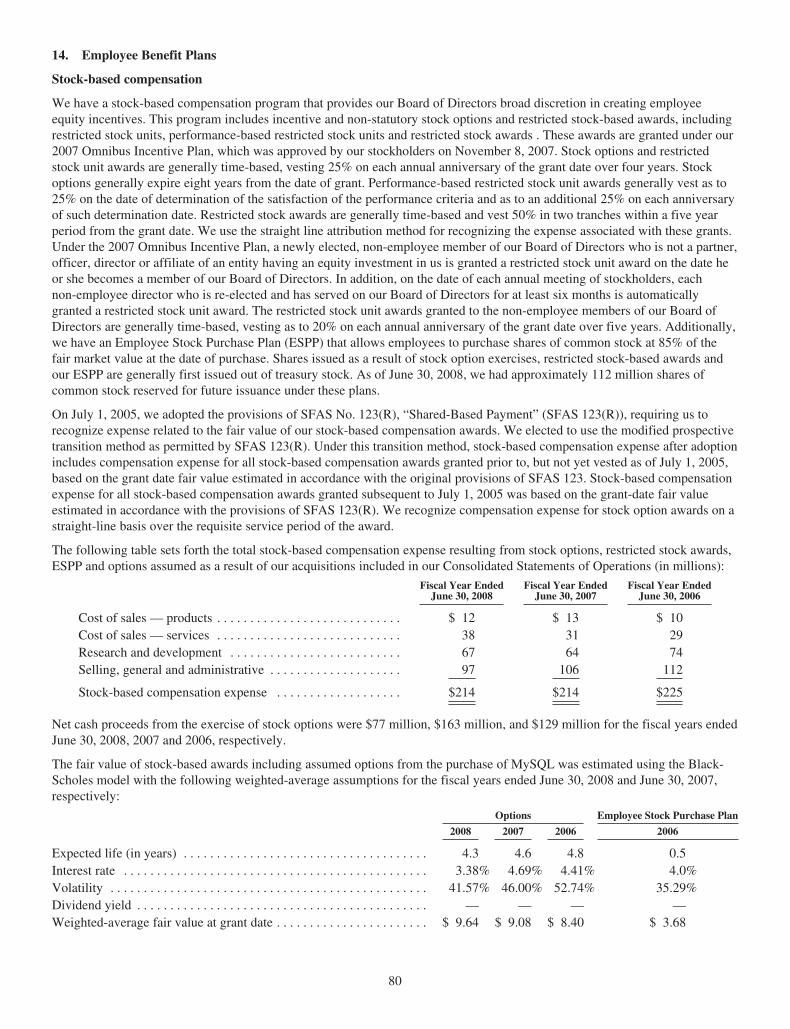
14. Employee Benefit Plans
Stock-based compensation
We have a stock-based compensation program that provides our Board of Directors broad discretion in creating employeeequity incentives. This program includes incentive and non-statutory stock options and restricted stock-based awards, includingrestricted stock units, performance-based restricted stock units and restricted stock awards . These awards are granted under our2007 Omnibus Incentive Plan, which was approved by our stockholders on November 8, 2007. Stock options and restrictedstock unit awards are generally time-based, vesting 25% on each annual anniversary of the grant date over four years. Stockoptions generally expire eight years from the date of grant. Performance-based restricted stock unit awards generally vest as to25% on the date of determination of the satisfaction of the performance criteria and as to an additional 25% on each anniversaryof such determination date. Restricted stock awards are generally time-based and vest 50% in two tranches within a five yearperiod from the grant date. We use the straight line attribution method for recognizing the expense associated with these grants.Under the 2007 Omnibus Incentive Plan, a newly elected, non-employee member of our Board of Directors who is not a partner,officer, director or affiliate of an entity having an equity investment in us is granted a restricted stock unit award on the date heor she becomes a member of our Board of Directors. In addition, on the date of each annual meeting of stockholders, eachnon-employee director who is re-elected and has served on our Board of Directors for at least six months is automaticallygranted a restricted stock unit award. The restricted stock unit awards granted to the non-employee members of our Board ofDirectors are generally time-based, vesting as to 20% on each annual anniversary of the grant date over five years. Additionally,we have an Employee Stock Purchase Plan (ESPP) that allows employees to purchase shares of common stock at 85% of thefair market value at the date of purchase. Shares issued as a result of stock option exercises, restricted stock-based awards andour ESPP are generally first issued out of treasury stock. As of June 30, 2008, we had approximately 112 million shares ofcommon stock reserved for future issuance under these plans.
On July 1, 2005, we adopted the provisions of SFAS No. 123(R), “Shared-Based Payment” (SFAS 123(R)), requiring us torecognize expense related to the fair value of our stock-based compensation awards. We elected to use the modified prospectivetransition method as permitted by SFAS 123(R). Under this transition method, stock-based compensation expense after adoptionincludes compensation expense for all stock-based compensation awards granted prior to, but not yet vested as of July 1, 2005,based on the grant date fair value estimated in accordance with the original provisions of SFAS 123. Stock-based compensationexpense for all stock-based compensation awards granted subsequent to July 1, 2005 was based on the grant-date fair valueestimated in accordance with the provisions of SFAS 123(R). We recognize compensation expense for stock option awards on astraight-line basis over the requisite service period of the award.
The following table sets forth the total stock-based compensation expense resulting from stock options, restricted stock awards,ESPP and options assumed as a result of our acquisitions included in our Consolidated Statements of Operations (in millions):
Fiscal Year EndedJune 30, 2008
Fiscal Year EndedJune 30, 2007
Fiscal Year EndedJune 30, 2006
Cost of sales — products . . . . . . . . . . . . . . . . . . . . . . . . . . . . $ 12 $ 13 $ 10Cost of sales — services . . . . . . . . . . . . . . . . . . . . . . . . . . . . 38 31 29Research and development . . . . . . . . . . . . . . . . . . . . . . . . . . 67 64 74Selling, general and administrative . . . . . . . . . . . . . . . . . . . . 97 106 112
Stock-based compensation expense . . . . . . . . . . . . . . . . . . . $214 $214 $225
Net cash proceeds from the exercise of stock options were $77 million, $163 million, and $129 million for the fiscal years endedJune 30, 2008, 2007 and 2006, respectively.
The fair value of stock-based awards including assumed options from the purchase of MySQL was estimated using the Black-Scholes model with the following weighted-average assumptions for the fiscal years ended June 30, 2008 and June 30, 2007,respectively:
Options Employee Stock Purchase Plan
2008 2007 2006 2006
Expected life (in years) . . . . . . . . . . . . . . . . . . . . . . . . . . . . . . . . . . . . . 4.3 4.6 4.8 0.5Interest rate . . . . . . . . . . . . . . . . . . . . . . . . . . . . . . . . . . . . . . . . . . . . . . 3.38% 4.69% 4.41% 4.0%Volatility . . . . . . . . . . . . . . . . . . . . . . . . . . . . . . . . . . . . . . . . . . . . . . . . 41.57% 46.00% 52.74% 35.29%Dividend yield . . . . . . . . . . . . . . . . . . . . . . . . . . . . . . . . . . . . . . . . . . . . — — — —Weighted-average fair value at grant date . . . . . . . . . . . . . . . . . . . . . . . $ 9.64 $ 9.08 $ 8.40 $ 3.68
80

Our computation of expected volatility for the fiscal year ended June 30, 2008, is based on a combination of historical andmarket-based implied volatility. Our computation of expected life is based on historical settlement patterns. The interest rate forperiods within the contractual life of the award is based on the U.S. Treasury yield curve in effect at the time of grant.
Prior to May 2006, our ESPP allowed employees to purchase shares of common stock at 85% of the fair market value at thelower of either the date of enrollment or the date of purchase. Effective May 2006, our ESPP plan was modified to allowemployees to purchase shares of common stock at 85% of the fair market value solely at the date of purchase. Accordingly, theBlack-Scholes model is no longer used to estimate the fair value of ESPP stock awards granted after May 2006.
Stock option activity for the fiscal years ended June 30, 2008, is as follows (in millions, except per share amounts):
SharesWeighted-AverageExercise Price
Weighted-AverageRemaining
Contractual Term(in years)
AggregateIntrinsic Value
Outstanding at June 30, 2005 . . . . . . . . . . . . . . . . . . . . . . . . . . . . . . . 139 $47.76 4.6 $ 38Grants and acquisition-related assumed options . . . . . . . . . . . . . . . . 24 13.60Exercises . . . . . . . . . . . . . . . . . . . . . . . . . . . . . . . . . . . . . . . . . . . . . . . (10) 12.68Forfeitures or expirations . . . . . . . . . . . . . . . . . . . . . . . . . . . . . . . . . . (22) 42.20
Outstanding at June 30, 2006 . . . . . . . . . . . . . . . . . . . . . . . . . . . . . . . 131 $45.12 4.3 $140Grants and acquisition-related assumed options . . . . . . . . . . . . . . . . 7 20.36Exercises . . . . . . . . . . . . . . . . . . . . . . . . . . . . . . . . . . . . . . . . . . . . . . . (12) 13.84Forfeitures or expirations . . . . . . . . . . . . . . . . . . . . . . . . . . . . . . . . . . (22) 49.40
Outstanding at June 30, 2007 . . . . . . . . . . . . . . . . . . . . . . . . . . . . . . . 104 $46.11 3.8 $329Grants (includes options assumed from MySQL) . . . . . . . . . . . . . . . 20 9.38Exercises . . . . . . . . . . . . . . . . . . . . . . . . . . . . . . . . . . . . . . . . . . . . . . . (12) 6.67Forfeitures or expirations . . . . . . . . . . . . . . . . . . . . . . . . . . . . . . . . . . (21) 93.41
Outstanding at June 30, 2008 . . . . . . . . . . . . . . . . . . . . . . . . . . . . . . . 91 $32.05 3.92 $ 46
Exercisable at June 30, 2008 . . . . . . . . . . . . . . . . . . . . . . . . . . . . . . . 65 $38.26 2.94 $ 24
The aggregate intrinsic value in the table above represents the total pretax intrinsic value (i.e., the difference between ourclosing stock price on the last trading day of our fiscal 2008 and the exercise price, times the number of shares) that would havebeen received by the option holders had all option holders exercised their options on June 30, 2008. This amount changes basedon the fair market value of our stock. The total intrinsic value of options exercised was $124 million and $99 million for thefiscal years ended June 30, 2008 and June 30, 2007, respectively. The total fair value of options that vested during the fiscalyears ended June 30, 2008 and June 30, 2007, was $117 million and $120 million, respectively.
As of June 30, 2008, $188 million of total unrecognized compensation cost related to stock options is expected to be recognizedover a weighted-average period of two years.
The following table summarizes our restricted stock award activity for the fiscal years ended June 30, 2008 (in millions, exceptper share amounts):
Number ofShares
Weighted-AverageGrant Date Fair Value
(per share)
Restricted stock at June 30, 2005 . . . . . . . . . . . . . . . . . . . . . . . . . . . . . . . . . . . . . . . 1 $19.20Granted . . . . . . . . . . . . . . . . . . . . . . . . . . . . . . . . . . . . . . . . . . . . . . . . . . . . . . . . . . . 12 16.59Vested . . . . . . . . . . . . . . . . . . . . . . . . . . . . . . . . . . . . . . . . . . . . . . . . . . . . . . . . . . . . — —Forfeited . . . . . . . . . . . . . . . . . . . . . . . . . . . . . . . . . . . . . . . . . . . . . . . . . . . . . . . . . . (1) 16.35
Restricted stock at June 30, 2006 . . . . . . . . . . . . . . . . . . . . . . . . . . . . . . . . . . . . . . . 12 $16.65
Granted . . . . . . . . . . . . . . . . . . . . . . . . . . . . . . . . . . . . . . . . . . . . . . . . . . . . . . . . . . . 10 21.15Vested . . . . . . . . . . . . . . . . . . . . . . . . . . . . . . . . . . . . . . . . . . . . . . . . . . . . . . . . . . . . (5) 15.18Forfeited . . . . . . . . . . . . . . . . . . . . . . . . . . . . . . . . . . . . . . . . . . . . . . . . . . . . . . . . . . (2) 18.28
Restricted stock awards at June 30, 2007 . . . . . . . . . . . . . . . . . . . . . . . . . . . . . . . . . 15 $20.01Granted . . . . . . . . . . . . . . . . . . . . . . . . . . . . . . . . . . . . . . . . . . . . . . . . . . . . . . . . . . . 11 19.65Vested . . . . . . . . . . . . . . . . . . . . . . . . . . . . . . . . . . . . . . . . . . . . . . . . . . . . . . . . . . . . (1) 19.49Forfeited . . . . . . . . . . . . . . . . . . . . . . . . . . . . . . . . . . . . . . . . . . . . . . . . . . . . . . . . . . (2) 20.00
Restricted stock awards at June 30, 2008 . . . . . . . . . . . . . . . . . . . . . . . . . . . . . . . . . 23 $19.90
81

As of June 30, 2008, we retained purchase rights to 71,114 shares issued pursuant to stock purchase agreements and other stockplans at a weighted-average price of approximately $0.02. As of June 30, 2008, $334 million of total unrecognizedcompensation costs related to restricted stock based awards is expected to be recognized over a weighted-average period ofthree years.
Defined contribution plans
We have a 401(k) plan known as the Sun Microsystems, Inc. Tax Deferred Retirement Savings Plan (Plan). The Plan isavailable to all regular employees on our U.S. payroll and provides employees with tax deferred salary deductions andalternative investment options. The Plan does not provide employees with the option to invest in our common stock. Employeesmay contribute up to 30% of their salary, subject to certain limitations. We match employees’ contributions to the Plan at amaximum of 4% of eligible compensation up to the annual maximum of $6,800. We expensed $80 million, $86 million and $83million in the fiscal 2008, 2007 and 2006, respectively, for our contributions to the Plan. Our contributions to the Plan vest100% upon contribution.
Defined benefit plans
Effective June 30, 2007, we adopted SFAS 158, which requires us to record non-cash adjustments to recognize the funded statusof each of our defined pension and postretirement benefit plans as a net asset or liability in our statement of financial positionwith a corresponding amount recorded in accumulated other comprehensive income, and to recognize changes in that fundedstatus in the year in which changes occur through comprehensive income. For the period ended June 30, 2007, SFAS 158required us to measure the funded status of each of our plans as of the date of our year-end statement of financial position. Theeffect of applying SFAS 158 on the individual line items in the consolidated balance sheet as of June 30, 2007 was immaterial.Additionally, for the period ended June 30, 2008, SFAS 158 requires that the measurement date of benefit obligations be thesame as our fiscal year-end. The measurement date for a majority of our plans historically has been June 30, therefore, themeasurement date provisions of SFAS 158 did not result in a material adjustment in fiscal 2008.
We sponsor a number of qualified defined benefit pension plans primarily outside the United States. We also have an unfundednonqualified pension plan covering certain executives that are based on targeted wage replacement percentages. We depositfunds for these plans, consistent with the requirements of local law, with insurance companies, third-party trustees, or intogovernment-managed accounts and accrue for the unfunded portion of the obligation.
We aggregate all of our defined benefit plans for disclosure purposes, as the amounts that would be reported individually for ourplans are considered insignificant.
There were no material plan amendments, benefit modifications or related events that took place during fiscal 2008 or fiscal2007.
Change in benefit obligations, for the fiscal years ended June 30, were as follows (in millions):
2008 2007
Benefit obligation at beginning of year . . . . . . . . . . . . . . . . . . . . . . . . . . . . . . . . . . . . . . . . . . . . . . . . . . $310 $295Service cost . . . . . . . . . . . . . . . . . . . . . . . . . . . . . . . . . . . . . . . . . . . . . . . . . . . . . . . . . . . . . . . . . . . . . . . 18 20Interest cost . . . . . . . . . . . . . . . . . . . . . . . . . . . . . . . . . . . . . . . . . . . . . . . . . . . . . . . . . . . . . . . . . . . . . . . 15 13Plan participants’ contributions . . . . . . . . . . . . . . . . . . . . . . . . . . . . . . . . . . . . . . . . . . . . . . . . . . . . . . . . 2 1Amendments . . . . . . . . . . . . . . . . . . . . . . . . . . . . . . . . . . . . . . . . . . . . . . . . . . . . . . . . . . . . . . . . . . . . . . 1Actuarial gains . . . . . . . . . . . . . . . . . . . . . . . . . . . . . . . . . . . . . . . . . . . . . . . . . . . . . . . . . . . . . . . . . . . . . (65 ) (10 )Benefits paid . . . . . . . . . . . . . . . . . . . . . . . . . . . . . . . . . . . . . . . . . . . . . . . . . . . . . . . . . . . . . . . . . . . . . . (8 ) (5 )Exchange rate movements . . . . . . . . . . . . . . . . . . . . . . . . . . . . . . . . . . . . . . . . . . . . . . . . . . . . . . . . . . . . 38 14Curtailments, settlements, and other . . . . . . . . . . . . . . . . . . . . . . . . . . . . . . . . . . . . . . . . . . . . . . . . . . . . (2 ) (19)
Benefit obligation at end of year . . . . . . . . . . . . . . . . . . . . . . . . . . . . . . . . . . . . . . . . . . . . . . . . . . . . . . . $308 $310
82

Change in plan assets, for the fiscal year ended June 30, were as follows (in millions):
2008 2007
Fair value of plan assets at beginning of year . . . . . . . . . . . . . . . . . . . . . . . . . . . . . . . . . . . . . . . . . . . . $206 $ 172Actual return on plan assets . . . . . . . . . . . . . . . . . . . . . . . . . . . . . . . . . . . . . . . . . . . . . . . . . . . . . . . . . . (5) 14Employer contributions . . . . . . . . . . . . . . . . . . . . . . . . . . . . . . . . . . . . . . . . . . . . . . . . . . . . . . . . . . . . . 24 24Plan participants’ contributions . . . . . . . . . . . . . . . . . . . . . . . . . . . . . . . . . . . . . . . . . . . . . . . . . . . . . . . 2 1Benefits paid . . . . . . . . . . . . . . . . . . . . . . . . . . . . . . . . . . . . . . . . . . . . . . . . . . . . . . . . . . . . . . . . . . . . . (7) (5)Exchange rate movements . . . . . . . . . . . . . . . . . . . . . . . . . . . . . . . . . . . . . . . . . . . . . . . . . . . . . . . . . . . 30 8Curtailments, settlements, and other . . . . . . . . . . . . . . . . . . . . . . . . . . . . . . . . . . . . . . . . . . . . . . . . . . . (4) (8)
Fair value of plan assets at end of year . . . . . . . . . . . . . . . . . . . . . . . . . . . . . . . . . . . . . . . . . . . . . . . . . 246 206
Unfunded status . . . . . . . . . . . . . . . . . . . . . . . . . . . . . . . . . . . . . . . . . . . . . . . . . . . . . . . . . . . . . . . . . . . $ (62) $(104)
Noncurrent asset . . . . . . . . . . . . . . . . . . . . . . . . . . . . . . . . . . . . . . . . . . . . . . . . . . . . . . . . . . . . . . . . . . . $ 27 $ 4Current liability . . . . . . . . . . . . . . . . . . . . . . . . . . . . . . . . . . . . . . . . . . . . . . . . . . . . . . . . . . . . . . . . . . . (20) (25)Noncurrent liability . . . . . . . . . . . . . . . . . . . . . . . . . . . . . . . . . . . . . . . . . . . . . . . . . . . . . . . . . . . . . . . . (69) (83)
Net obligation recognized in the statement of financial position . . . . . . . . . . . . . . . . . . . . . . . . . . . . . $ (62) $(104)
Amounts recognized in accumulated other comprehensive income consist of:Net actuarial unrecognized (gain) loss . . . . . . . . . . . . . . . . . . . . . . . . . . . . . . . . . . . . . . . . . . . . . . . . . . $ (25) $ 5Net prior service cost . . . . . . . . . . . . . . . . . . . . . . . . . . . . . . . . . . . . . . . . . . . . . . . . . . . . . . . . . . . . . . . 13 14Transition obligation . . . . . . . . . . . . . . . . . . . . . . . . . . . . . . . . . . . . . . . . . . . . . . . . . . . . . . . . . . . . . . . 1 1
$ (11) $ 20
The total accumulated benefit obligation, the accumulated benefit obligation (ABO) and fair value of plan assets for our definedbenefit pension plans with accumulated benefit obligations in excess of plan assets, and the projected benefit obligation and fairvalue of plan assets for defined benefit pension plans with projected benefit obligations (PBO) in excess of plan assets, for thefiscal year ended June 30, were as follows (in millions):
2008 2007
Accumulated Benefit Obligation . . . . . . . . . . . . . . . . . . . . . . . . . . . . . . . . . . . . . . . . . . . . . . . . . . . . . . . $251 $240Plans with ABO in excess of plan assetsABO . . . . . . . . . . . . . . . . . . . . . . . . . . . . . . . . . . . . . . . . . . . . . . . . . . . . . . . . . . . . . . . . . . . . . . . . . . $113 $135Fair value of plan assets . . . . . . . . . . . . . . . . . . . . . . . . . . . . . . . . . . . . . . . . . . . . . . . . . . . . . . . . . . . $ 68 $ 88
Plans with PBO in excess of plan assetsPBO . . . . . . . . . . . . . . . . . . . . . . . . . . . . . . . . . . . . . . . . . . . . . . . . . . . . . . . . . . . . . . . . . . . . . . . . . . . $241 $276Fair value of plan assets . . . . . . . . . . . . . . . . . . . . . . . . . . . . . . . . . . . . . . . . . . . . . . . . . . . . . . . . . . . $152 $175
The components of pension expense along with the assumptions used to determine benefit obligations, for the fiscal year endedJune 30, were as follows (in millions):
2008 2007 2006
Service cost . . . . . . . . . . . . . . . . . . . . . . . . . . . . . . . . . . . . . . . . . . . . . . . . . . . . . . . . . . . . . . . . . $ 19 $ 20 $ 24Interest cost . . . . . . . . . . . . . . . . . . . . . . . . . . . . . . . . . . . . . . . . . . . . . . . . . . . . . . . . . . . . . . . . . 14 12 13Expected return on plan assets . . . . . . . . . . . . . . . . . . . . . . . . . . . . . . . . . . . . . . . . . . . . . . . . . . (11) (9) (10)Amortization of prior service cost . . . . . . . . . . . . . . . . . . . . . . . . . . . . . . . . . . . . . . . . . . . . . . . . 2 2 2Recognized net actuarial loss . . . . . . . . . . . . . . . . . . . . . . . . . . . . . . . . . . . . . . . . . . . . . . . . . . . 1 2 2Curtailments, settlements, and other losses . . . . . . . . . . . . . . . . . . . . . . . . . . . . . . . . . . . . . . . . . 1 1Net expense . . . . . . . . . . . . . . . . . . . . . . . . . . . . . . . . . . . . . . . . . . . . . . . . . . . . . . . . . . . . . . . . . $ 26 $ 28 $ 31
Weighted-average assumptions used to determine benefit obligations at June 30(a):Discount rate . . . . . . . . . . . . . . . . . . . . . . . . . . . . . . . . . . . . . . . . . . . . . . . . . . . . . . . . . . . . . . . . 4.7% 4.4% 4.1%Rate of compensation increase . . . . . . . . . . . . . . . . . . . . . . . . . . . . . . . . . . . . . . . . . . . . . . . . . . 2.7% 2.8% 3.1%Weighted-average assumptions used to determine net expense for years ended June 30(b):Discount rate . . . . . . . . . . . . . . . . . . . . . . . . . . . . . . . . . . . . . . . . . . . . . . . . . . . . . . . . . . . . . . . . 4.3% 4.1% 3.9%Expected return on plan assets . . . . . . . . . . . . . . . . . . . . . . . . . . . . . . . . . . . . . . . . . . . . . . . . . . 4.8% 5.3% 5.1%Rate of compensation increase . . . . . . . . . . . . . . . . . . . . . . . . . . . . . . . . . . . . . . . . . . . . . . . . . . 2.9% 2.8% 3.0%
83
(a) Determined as of end of year.(b) Determined as of beginning of year and updated for remeasurements. Appropriate discount rates were used during 2008 to
measure the effects of curtailments and plan amendments on various plans.
Estimated amounts to be amortized from Accumulated other comprehensive income into net periodic benefit cost during 2009based on June 30, 2008 plan measurements, were as follows (in millions):
Amortization of prior service cost . . . . . . . . . . . . . . . . . . . . . . . . . . . . . . . . . . . . . . . . . . . . . . . . . . . . . . . . . . . . . . $ 2Amortization of transition obligation . . . . . . . . . . . . . . . . . . . . . . . . . . . . . . . . . . . . . . . . . . . . . . . . . . . . . . . . . . . —Recognized net actuarial loss . . . . . . . . . . . . . . . . . . . . . . . . . . . . . . . . . . . . . . . . . . . . . . . . . . . . . . . . . . . . . . . . . —
$ 2
Discount Rate
We set the discount rate assumption annually for each of our retirement-related benefit plans at their respective measurementdates to reflect the yield of a portfolio of high quality, fixed-income debt instruments that would produce cash flows sufficientin timing and amount to address projected future benefits. The weighted average rate established discount rate for our definedbenefit pension plans was 4.7% for the fiscal year-end 2008.
Long-term Rate of Return on Plan Assets and Target Asset Allocations
To determine the expected long-term rate of return on plan assets, we consider the current and expected asset allocations, aswell as historical and expected returns on various categories of plan assets. We apply our expected rate of return to a market-related value of assets, which stabilizes variability in the amounts to which we apply that expected return. While we giveappropriate consideration to recent fund performance and historical returns, the assumptions are primarily long term,prospective rates of return. Plan fiduciaries set investment policies and strategies for the plan assets and oversee its investmentallocation, which includes selecting investment managers and setting long-term strategic targets. Long-term strategic investmentobjectives include preserving the funded status of the plan and balancing risk and return. Target allocation ranges are guidelines,not limitations, and occasionally plan fiduciaries will approve allocations above or below a target range. Because of thediversity in practice between geographies and our different pension funds in how target allocations are determined, we have notsupplied this information as it is not considered useful to the readers of the financial statements. The weighted average expectedlong-term rate of return on our defined benefit plans assets used to determine net pension expense for fiscal 2008 was 4.8%compared to 5.3% for fiscal 2007 and 5.1% in fiscal 2006.
Plan Assets
Plan assets are valued using quoted market prices when available. Assets for which quoted market prices are not available arevalued using independent pricing vendors, dealer or counterparty supplied valuations and net asset values provided by fundmanagers or portfolio investment advisors whose fair value estimates may utilize appraisals of the underlying assets ordiscounted cash flow models.
Our defined benefit pension plans have the following asset allocations, as of their respective measurement dates in fiscal yearsended June 30:
Plans ActualPercentage ofPlan Assets
Asset Category 2008 2007
Equity securities . . . . . . . . . . . . . . . . . . . . . . . . . . . . . . . . . . . . . . . . . . . . . . . . . . . . . . . . . . . . . . . . . . . . 25.7% 30.6%Debt securities . . . . . . . . . . . . . . . . . . . . . . . . . . . . . . . . . . . . . . . . . . . . . . . . . . . . . . . . . . . . . . . . . . . . . . 68.8% 63.4%Real estate . . . . . . . . . . . . . . . . . . . . . . . . . . . . . . . . . . . . . . . . . . . . . . . . . . . . . . . . . . . . . . . . . . . . . . . . . 2.4% 3.0%Other . . . . . . . . . . . . . . . . . . . . . . . . . . . . . . . . . . . . . . . . . . . . . . . . . . . . . . . . . . . . . . . . . . . . . . . . . . . . . 3.1% 3.0%
Total . . . . . . . . . . . . . . . . . . . . . . . . . . . . . . . . . . . . . . . . . . . . . . . . . . . . . . . . . . . . . . . . . . . . . . . . . . . . . 100% 100%
84

Plan Funding Policy and Contributions
Our practice is to fund the various pension plans in amounts at least sufficient to meet the minimum requirements of local lawsand regulations or to directly pay benefit payments where appropriate. We made pension contributions to the defined benefitpension plans, or made direct payments where appropriate, for the fiscal year ended June 30, as follows (in millions):
June 30,
2008 2007 2006
Pension plan contributions and direct payments to plan participants . . . . . . . . . . . . . . . . . . . . . . $31 $26 $21
As of June 30, 2008, we do not have any contributions due, and we do not expect to make any discretionary contributions intothe defined benefit pension plans. During fiscal 2009 we expect to contribute or pay benefits of approximately $20 million toour defined benefit pension plans.
Benefit Payments
The following benefit payments, which include assumptions related to estimated future employee service, as appropriate, areexpected to be paid in the future (in millions):
PensionBenefits(a)
2009 . . . . . . . . . . . . . . . . . . . . . . . . . . . . . . . . . . . . . . . . . . . . . . . . . . . . . . . . . . . . . . . . . . . . . . . . . . . . . . . . . $ 82010 . . . . . . . . . . . . . . . . . . . . . . . . . . . . . . . . . . . . . . . . . . . . . . . . . . . . . . . . . . . . . . . . . . . . . . . . . . . . . . . . . $ 72011 . . . . . . . . . . . . . . . . . . . . . . . . . . . . . . . . . . . . . . . . . . . . . . . . . . . . . . . . . . . . . . . . . . . . . . . . . . . . . . . . . $132012 . . . . . . . . . . . . . . . . . . . . . . . . . . . . . . . . . . . . . . . . . . . . . . . . . . . . . . . . . . . . . . . . . . . . . . . . . . . . . . . . . $122013 . . . . . . . . . . . . . . . . . . . . . . . . . . . . . . . . . . . . . . . . . . . . . . . . . . . . . . . . . . . . . . . . . . . . . . . . . . . . . . . . . $162014-2018 . . . . . . . . . . . . . . . . . . . . . . . . . . . . . . . . . . . . . . . . . . . . . . . . . . . . . . . . . . . . . . . . . . . . . . . . . . . . $50
(a) Benefits for most non-U.S. pension plans are paid out of plan assets rather than our cash.
15. Operating Segments
We design, manufacture, market and service network computing infrastructure solutions that consist of Computer Systems(hardware and software), Storage (hardware and software), Support Services (Support Services and Managed Services) andProfessional Services and Educational Services. Our organization is primarily structured in a functional manner. During theperiods presented, our Chief Executive Officer was identified as our Chief Operating Decision Maker (CODM) as defined bySFAS No. 131, “Disclosures About Segments of an Enterprise and Related Information” (SFAS 131).
Our CODM manages our company based primarily on broad functional categories of sales, services, manufacturing, productdevelopment and engineering and marketing and strategy. Starting in fiscal 2008, our CODM reviews consolidated financialinformation on revenues and gross margins for products and services and also reviews operating expenses. Our CODM does notuse assets allocation for purposes of making decisions about allocating resources to the segment and assessing segment’sperformance. Our Product Group segment comprises our end-to-end networking architecture of computing products includingour Computer Systems and Storage product lines. Our Services Group segment comprises a full range of services to existing andnew customers, including Support Services (Support Services and Managed Services) and Professional Services andEducational Services.
We have a Worldwide Operations (WWOPS) organization and a Global Sales and Services (GSS) organization that areresponsible for the manufacturing and sale, respectively, of all of our products. CODM holds GSS accountable for overallproducts and services revenue and margins on a consolidated level. GSS and WWOPS manage the majority of our accountsreceivable and inventory, respectively. In addition, we have a Worldwide Marketing Organization (WMO) that is responsiblefor developing and executing our overall corporate, strategic and product marketing and advertising strategies. The CODMlooks to this functional organization for advertising, pricing and other marketing strategies for the products and servicesdelivered to market.
Operating expenses (primarily sales, marketing and administrative) related to the GSS and the WMO are not allocated to thereportable segments and, accordingly, are included under the Other segment reported below. With the exception of goodwill, wedo not identify or allocate assets by operating segment, nor does the CODM evaluate operating segments using discrete assetinformation. We do not report inter-segment revenue because the operating segments do not record it. We do not allocateinterest and other income, interest expense, or taxes to operating segments. Although the CODM uses operating income toevaluate the segments, operating costs included in one segment may benefit other segments.
85
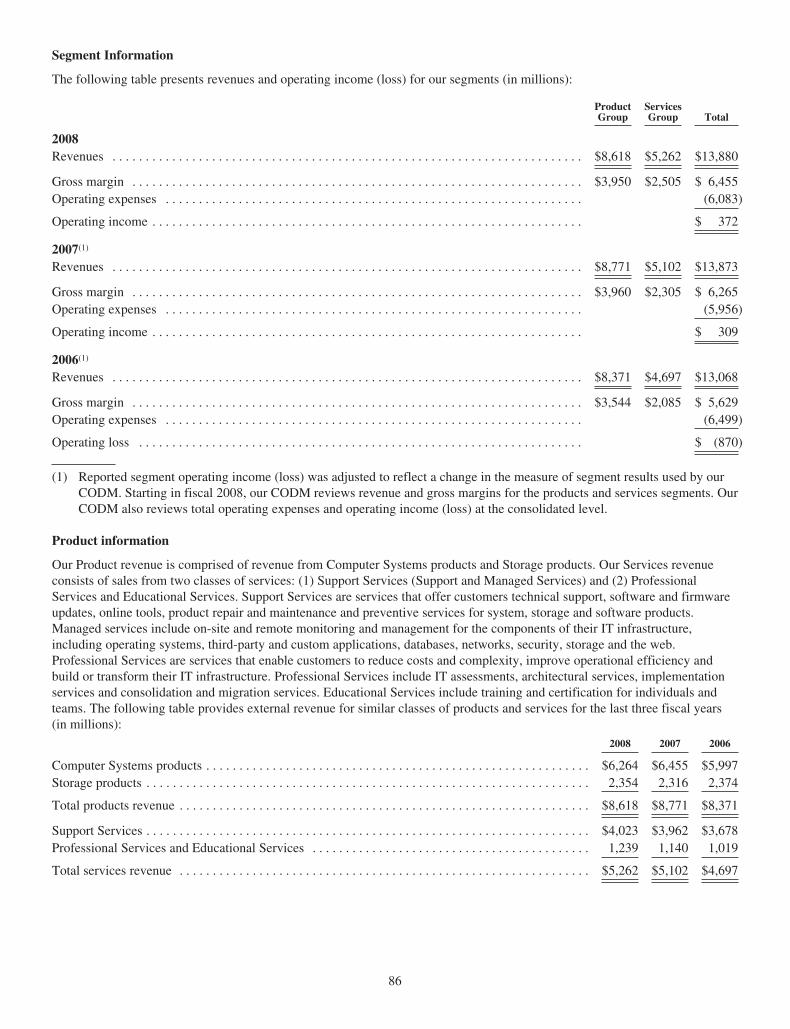
Segment Information
The following table presents revenues and operating income (loss) for our segments (in millions):
ProductGroup
ServicesGroup Total
2008Revenues . . . . . . . . . . . . . . . . . . . . . . . . . . . . . . . . . . . . . . . . . . . . . . . . . . . . . . . . . . . . . . . . . . . . . . . $8,618 $5,262 $13,880
Gross margin . . . . . . . . . . . . . . . . . . . . . . . . . . . . . . . . . . . . . . . . . . . . . . . . . . . . . . . . . . . . . . . . . . . . $3,950 $2,505 $ 6,455Operating expenses . . . . . . . . . . . . . . . . . . . . . . . . . . . . . . . . . . . . . . . . . . . . . . . . . . . . . . . . . . . . . . . (6,083)
Operating income . . . . . . . . . . . . . . . . . . . . . . . . . . . . . . . . . . . . . . . . . . . . . . . . . . . . . . . . . . . . . . . . . $ 372
2007(1)
Revenues . . . . . . . . . . . . . . . . . . . . . . . . . . . . . . . . . . . . . . . . . . . . . . . . . . . . . . . . . . . . . . . . . . . . . . . $8,771 $5,102 $13,873
Gross margin . . . . . . . . . . . . . . . . . . . . . . . . . . . . . . . . . . . . . . . . . . . . . . . . . . . . . . . . . . . . . . . . . . . . $3,960 $2,305 $ 6,265Operating expenses . . . . . . . . . . . . . . . . . . . . . . . . . . . . . . . . . . . . . . . . . . . . . . . . . . . . . . . . . . . . . . . (5,956)
Operating income . . . . . . . . . . . . . . . . . . . . . . . . . . . . . . . . . . . . . . . . . . . . . . . . . . . . . . . . . . . . . . . . . $ 309
2006(1)
Revenues . . . . . . . . . . . . . . . . . . . . . . . . . . . . . . . . . . . . . . . . . . . . . . . . . . . . . . . . . . . . . . . . . . . . . . . $8,371 $4,697 $13,068
Gross margin . . . . . . . . . . . . . . . . . . . . . . . . . . . . . . . . . . . . . . . . . . . . . . . . . . . . . . . . . . . . . . . . . . . . $3,544 $2,085 $ 5,629Operating expenses . . . . . . . . . . . . . . . . . . . . . . . . . . . . . . . . . . . . . . . . . . . . . . . . . . . . . . . . . . . . . . . (6,499)
Operating loss . . . . . . . . . . . . . . . . . . . . . . . . . . . . . . . . . . . . . . . . . . . . . . . . . . . . . . . . . . . . . . . . . . . $ (870)
(1) Reported segment operating income (loss) was adjusted to reflect a change in the measure of segment results used by ourCODM. Starting in fiscal 2008, our CODM reviews revenue and gross margins for the products and services segments. OurCODM also reviews total operating expenses and operating income (loss) at the consolidated level.
Product information
Our Product revenue is comprised of revenue from Computer Systems products and Storage products. Our Services revenueconsists of sales from two classes of services: (1) Support Services (Support and Managed Services) and (2) ProfessionalServices and Educational Services. Support Services are services that offer customers technical support, software and firmwareupdates, online tools, product repair and maintenance and preventive services for system, storage and software products.Managed services include on-site and remote monitoring and management for the components of their IT infrastructure,including operating systems, third-party and custom applications, databases, networks, security, storage and the web.Professional Services are services that enable customers to reduce costs and complexity, improve operational efficiency andbuild or transform their IT infrastructure. Professional Services include IT assessments, architectural services, implementationservices and consolidation and migration services. Educational Services include training and certification for individuals andteams. The following table provides external revenue for similar classes of products and services for the last three fiscal years(in millions):
2008 2007 2006
Computer Systems products . . . . . . . . . . . . . . . . . . . . . . . . . . . . . . . . . . . . . . . . . . . . . . . . . . . . . . . . . . $6,264 $6,455 $5,997Storage products . . . . . . . . . . . . . . . . . . . . . . . . . . . . . . . . . . . . . . . . . . . . . . . . . . . . . . . . . . . . . . . . . . . 2,354 2,316 2,374
Total products revenue . . . . . . . . . . . . . . . . . . . . . . . . . . . . . . . . . . . . . . . . . . . . . . . . . . . . . . . . . . . . . . $8,618 $8,771 $8,371
Support Services . . . . . . . . . . . . . . . . . . . . . . . . . . . . . . . . . . . . . . . . . . . . . . . . . . . . . . . . . . . . . . . . . . . $4,023 $3,962 $3,678Professional Services and Educational Services . . . . . . . . . . . . . . . . . . . . . . . . . . . . . . . . . . . . . . . . . . 1,239 1,140 1,019
Total services revenue . . . . . . . . . . . . . . . . . . . . . . . . . . . . . . . . . . . . . . . . . . . . . . . . . . . . . . . . . . . . . . $5,262 $5,102 $4,697
86

Geographic information
Our significant operations outside the U.S. include manufacturing facilities, design centers and sales offices in Europe, MiddleEast and Africa (EMEA), as well as the Asia Pacific (APAC) and Canada and Latin America (International Americas).Intercompany transfers between operating segments and geographic areas are primarily accounted for at prices that approximatearm’s length transactions. In fiscal 2008, 2007 and 2006, sales between segments are recorded at standard cost. Informationregarding geographic areas at June 30 and for each of the years then ended, was as follows (in millions):
U.S.InternationalAmericas
Americas —Total EMEA APAC Total
2008Sales to unaffiliated customers . . . . . . . . . . . . . . . . . . . . . . . . . . $5,198 $1,002 $6,200 $5,247 $2,433 $13,880Long-lived assets (excluding investments and deferred taxassets) . . . . . . . . . . . . . . . . . . . . . . . . . . . . . . . . . . . . . . . . . . . $4,875 $ 77 $4,952 $ 421 $ 31 $ 5,404
2007Sales to unaffiliated customers . . . . . . . . . . . . . . . . . . . . . . . . . . $5,641 $ 863 $6,504 $4,999 $2,370 $13,873Long-lived assets (excluding investments and deferred taxassets) . . . . . . . . . . . . . . . . . . . . . . . . . . . . . . . . . . . . . . . . . . . $3,925 $ 158 $4,083 $ 797 $ 88 $ 4,968
2006(1)
Sales to unaffiliated customers . . . . . . . . . . . . . . . . . . . . . . . . . . $5,535 $ 755 $6,290 $4,646 $2,132 $13,068Long-lived assets (excluding investments and deferred taxassets) . . . . . . . . . . . . . . . . . . . . . . . . . . . . . . . . . . . . . . . . . . . $4,993 $ 133 $5,126 $ 617 $ 104 $ 5,847
(1) Geographic revenue reported for fiscal 2006 has been adjusted to reflect an immaterial correction in intercompany revenueto properly report country origin.
Customer Information
Sales to Avnet, the largest distributor of our products, accounted for approximately 11% of our net revenues in each of fiscal2008, 2007 and 2006. In January 2007, Access Distribution, the largest distributor of our products at the time, was sold to Avnetby General Electric Company. Avnet was StorageTek’s largest distributor and became a distributor of Sun products after ouracquisition of StorageTek in August 2005. The net revenue percentages for fiscal 2007 and 2006 represent sales to Avnet andAccess Distribution on a combined basis. No other customer accounted for more than 10% of our net revenues in fiscal 2008.Accounts receivable from Avnet and Access Distribution and its subsidiaries in the aggregate was approximately 9% and 13%of total accounts receivable as of June 30, 2008 and 2007, respectively.
16. Related Parties
In fiscal 2008, 2007 and 2006, we conducted transactions with Intuit, Inc. (Intuit), a company considered to be a related party.Stephen Bennett was the President and Chief Executive Officer of Intuit until January 2008, and was appointed a member of ourBoard of Directors effective June 2004. Since Mr. Bennett’s appointment through January 1, 2008, the amount of net revenuesand expenses recognized for Intuit were not material. In fiscal 2007 and 2008, we conducted transactions with FlextronicsInternational Ltd. and its subsidiaries (Flextronics), entities considered to be related parties. Michael Marks was the Chairmanof Flextronics’s Board of Directors until January 10, 2008, and was appointed a member of our Board of Directors effectiveApril 2007. During fiscal 2008 through January 10, 2008, we recognized approximately $18 million in net revenue andapproximately $2 million in expenses with Flextronics. In fiscal 2007 we recognized approximately $16 million in net revenuesand approximately $2 million in expenses from Flextronics since Mr. Mark’s appointment.
17. Legal Proceedings and Contingencies
In fiscal 2005, the GSA began auditing our records under the agreements it had with us at that time. A lawsuit related to theaudit and our performance under our GSA contract and other government contracts has been filed against us in the United StatesDistrict Court for the District of Arkansas. It includes claims under the Federal False Claims and Anti-Kickback Acts, as well asbreach of contract and other claims, including claims related to certain rebates, discounts and other payments or benefitsprovided by us to our resellers and technology integrators. The parties continue to discuss the nature of the government’s currentand potential claims on our GSA and other government sales. If this matter proceeds to trial, possible sanctions include anaward of damages, including treble damages, fines, penalties and other sanctions, up to and including suspension or debarmentfrom sales to the federal government. Although we are interested in pursuing an amicable resolution, we intend to present avigorous factual and legal defense throughout the course of these proceedings.
87
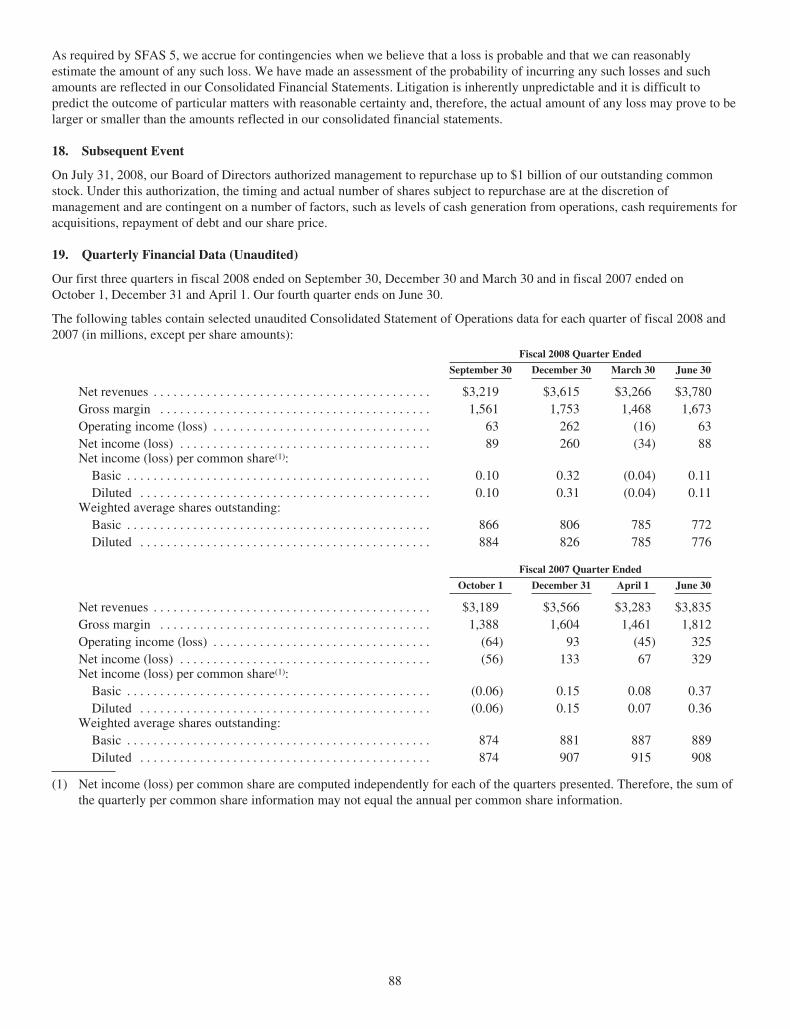
As required by SFAS 5, we accrue for contingencies when we believe that a loss is probable and that we can reasonablyestimate the amount of any such loss. We have made an assessment of the probability of incurring any such losses and suchamounts are reflected in our Consolidated Financial Statements. Litigation is inherently unpredictable and it is difficult topredict the outcome of particular matters with reasonable certainty and, therefore, the actual amount of any loss may prove to belarger or smaller than the amounts reflected in our consolidated financial statements.
18. Subsequent Event
On July 31, 2008, our Board of Directors authorized management to repurchase up to $1 billion of our outstanding commonstock. Under this authorization, the timing and actual number of shares subject to repurchase are at the discretion ofmanagement and are contingent on a number of factors, such as levels of cash generation from operations, cash requirements foracquisitions, repayment of debt and our share price.
19. Quarterly Financial Data (Unaudited)
Our first three quarters in fiscal 2008 ended on September 30, December 30 and March 30 and in fiscal 2007 ended onOctober 1, December 31 and April 1. Our fourth quarter ends on June 30.
The following tables contain selected unaudited Consolidated Statement of Operations data for each quarter of fiscal 2008 and2007 (in millions, except per share amounts):
Fiscal 2008 Quarter Ended
September 30 December 30 March 30 June 30
Net revenues . . . . . . . . . . . . . . . . . . . . . . . . . . . . . . . . . . . . . . . . . . $3,219 $3,615 $3,266 $3,780Gross margin . . . . . . . . . . . . . . . . . . . . . . . . . . . . . . . . . . . . . . . . . 1,561 1,753 1,468 1,673Operating income (loss) . . . . . . . . . . . . . . . . . . . . . . . . . . . . . . . . . 63 262 (16) 63Net income (loss) . . . . . . . . . . . . . . . . . . . . . . . . . . . . . . . . . . . . . . 89 260 (34) 88Net income (loss) per common share(1):
Basic . . . . . . . . . . . . . . . . . . . . . . . . . . . . . . . . . . . . . . . . . . . . . . 0.10 0.32 (0.04) 0.11Diluted . . . . . . . . . . . . . . . . . . . . . . . . . . . . . . . . . . . . . . . . . . . . 0.10 0.31 (0.04) 0.11
Weighted average shares outstanding:Basic . . . . . . . . . . . . . . . . . . . . . . . . . . . . . . . . . . . . . . . . . . . . . . 866 806 785 772Diluted . . . . . . . . . . . . . . . . . . . . . . . . . . . . . . . . . . . . . . . . . . . . 884 826 785 776
Fiscal 2007 Quarter Ended
October 1 December 31 April 1 June 30
Net revenues . . . . . . . . . . . . . . . . . . . . . . . . . . . . . . . . . . . . . . . . . . $3,189 $3,566 $3,283 $3,835Gross margin . . . . . . . . . . . . . . . . . . . . . . . . . . . . . . . . . . . . . . . . . 1,388 1,604 1,461 1,812Operating income (loss) . . . . . . . . . . . . . . . . . . . . . . . . . . . . . . . . . (64) 93 (45) 325Net income (loss) . . . . . . . . . . . . . . . . . . . . . . . . . . . . . . . . . . . . . . (56) 133 67 329Net income (loss) per common share(1):
Basic . . . . . . . . . . . . . . . . . . . . . . . . . . . . . . . . . . . . . . . . . . . . . . (0.06) 0.15 0.08 0.37Diluted . . . . . . . . . . . . . . . . . . . . . . . . . . . . . . . . . . . . . . . . . . . . (0.06) 0.15 0.07 0.36
Weighted average shares outstanding:Basic . . . . . . . . . . . . . . . . . . . . . . . . . . . . . . . . . . . . . . . . . . . . . . 874 881 887 889Diluted . . . . . . . . . . . . . . . . . . . . . . . . . . . . . . . . . . . . . . . . . . . . 874 907 915 908
(1) Net income (loss) per common share are computed independently for each of the quarters presented. Therefore, the sum ofthe quarterly per common share information may not equal the annual per common share information.
88

Report of Independent Registered Public Accounting Firm
The Board of Directors and Stockholders of Sun Microsystems, Inc.
We have audited the accompanying consolidated balance sheets of Sun Microsystems, Inc. as of June 30, 2008 and 2007, andthe related consolidated statements of operations, stockholders’ equity, and cash flows for each of the three years in the periodended June 30, 2008. These financial statements are the responsibility of the Company’s management. Our responsibility is toexpress an opinion on these financial statements based on our audits.
We conducted our audits in accordance with the standards of the Public Company Accounting Oversight Board (United States).Those standards require that we plan and perform the audit to obtain reasonable assurance about whether the financialstatements are free of material misstatement. An audit includes examining, on a test basis, evidence supporting the amounts anddisclosures in the financial statements. An audit also includes assessing the accounting principles used and significant estimatesmade by management, as well as evaluating the overall financial statement presentation. We believe that our audits provide areasonable basis for our opinion.
In our opinion, the financial statements referred to above present fairly, in all material respects, the consolidated financialposition of Sun Microsystems, Inc. at June 30, 2008 and 2007, and the consolidated results of its operations and its cash flowsfor each of the three years in the period ended June 30, 2008, in conformity with U.S. generally accepted accounting principles.
As discussed in Note 2 to the consolidated financial statements, in fiscal year 2008, Sun Microsystems, Inc. changed its methodof accounting for uncertain tax positions in accordance with guidance provided in Financial Accounting Standards BoardInterpretation No. 48, “Accounting for Uncertainty in Income Taxes — an interpretation of FASB Statement No. 109”.
We also have audited, in accordance with the standards of the Public Company Accounting Oversight Board (United States),Sun Microsystems, Inc.’s internal control over financial reporting as of June 30, 2008, based on criteria established in InternalControl — Integrated Framework issued by the Committee of Sponsoring Organizations of the Treadway Commission and ourreport dated August 26, 2008 expressed an unqualified opinion thereon.
/s/ Ernst & Young LLP
San Jose, CaliforniaAugust 26, 2008
89

Report of Independent Registered Public Accounting Firm
The Board of Directors and Stockholders of Sun Microsystems, Inc.
We have audited Sun Microsystems, Inc.’s internal control over financial reporting as of June 30, 2008, based on criteriaestablished in Internal Control — Integrated Framework issued by the Committee of Sponsoring Organizations of the TreadwayCommission (the COSO criteria). Sun Microsystems, Inc.’s management is responsible for maintaining effective internalcontrol over financial reporting, and for its assessment of the effectiveness of internal control over financial reporting includedin the accompanying Management’s Report on Internal Control over Financial Reporting. Our responsibility is to express anopinion on the company’s internal control over financial reporting based on our audit.
We conducted our audit in accordance with the standards of the Public Company Accounting Oversight Board (United States).Those standards require that we plan and perform the audit to obtain reasonable assurance about whether effective internalcontrol over financial reporting was maintained in all material respects. Our audit included obtaining an understanding ofinternal control over financial reporting, assessing the risk that a material weakness exists, testing and evaluating the design andoperating effectiveness of internal control based on the assessed risk, and performing such other procedures as we considerednecessary in the circumstances. We believe that our audit provides a reasonable basis for our opinion.
A company’s internal control over financial reporting is a process designed to provide reasonable assurance regarding thereliability of financial reporting and the preparation of financial statements for external purposes in accordance with generallyaccepted accounting principles. A company’s internal control over financial reporting includes those policies and proceduresthat (1) pertain to the maintenance of records that, in reasonable detail, accurately and fairly reflect the transactions anddispositions of the assets of the company; (2) provide reasonable assurance that transactions are recorded as necessary to permitpreparation of financial statements in accordance with generally accepted accounting principles, and that receipts andexpenditures of the company are being made only in accordance with authorizations of management and directors of thecompany; and (3) provide reasonable assurance regarding prevention or timely detection of unauthorized acquisition, use, ordisposition of the company’s assets that could have a material effect on the financial statements.
Because of its inherent limitations, internal control over financial reporting may not prevent or detect misstatements. Also,projections of any evaluation of effectiveness to future periods are subject to the risk that controls may become inadequatebecause of changes in conditions, or that the degree of compliance with the policies or procedures may deteriorate.
In our opinion, Sun Microsystems, Inc. maintained, in all material respects, effective internal control over financial reporting asof June 30, 2008, based on the COSO criteria.
We also have audited, in accordance with the standards of the Public Company Accounting Oversight Board (United States), theconsolidated balance sheets of Sun Microsystems, Inc. as of June 30, 2008 and 2007, and the related consolidated statements ofoperations, stockholders’ equity, and cash flows for each of the three years in the period ended June 30, 2008 and our reportdated August 26, 2008 expressed an unqualified opinion thereon.
/s/ Ernst & Young LLP
San Jose, CaliforniaAugust 26, 2008
90
ITEM 9. CHANGES IN AND DISAGREEMENTSWITH ACCOUNTANTS ON ACCOUNTING AND FINANCIALDISCLOSURE
Not applicable.
ITEM 9A. CONTROLS AND PROCEDURES
Disclosure Controls and Procedures
Management, with the participation of the Chief Executive Officer and Chief Financial Officer, has performed an evaluation ofour disclosure controls and procedures (as defined in Rules 13a-15(c) and 15d-15(c) of the Securities Exchange Act of 1934).This evaluation included consideration of the controls, processes and procedures that are designed to ensure that informationrequired to be disclosed by us in the reports we file under the Securities Exchange Act of 1934 is recorded, processed,summarized and reported within the time periods specified in the Securities and Exchange Commission’s rules and forms andthat such information is accumulated and communicated to our management, including our Chief Executive Officer and ChiefFinancial Officer, as appropriate to allow timely decisions regarding required disclosure. Based on such evaluation, our ChiefExecutive Officer and Chief Financial Officer concluded that, as of June 30, 2008, our disclosure controls and procedures wereeffective.
Management’s Report on Internal Control Over Financial Reporting
Management is responsible for establishing and maintaining adequate internal control over financial reporting as defined inRules 13a-15(c) and 15d-15(c) under the Securities Exchange Act of 1934. Our internal control over financial reporting isdesigned to provide reasonable assurance regarding the reliability of financial reporting and the preparation of financialstatements for external purposes in accordance with generally accepted accounting principles. Our internal control over financialreporting includes those policies and procedures that:
(i) pertain to the maintenance of records that, in reasonable detail, accurately and fairly reflect the transactions anddispositions of our assets;
(ii) provide reasonable assurance that transactions are recorded as necessary to permit preparation of financial statements inaccordance with generally accepted accounting principles, and that our receipts and expenditures are being made only inaccordance with authorizations of our management and directors; and
(iii) provide reasonable assurance regarding prevention or timely detection of unauthorized acquisition, use or dispositionof our assets that could have a material effect on the financial statements.
There are inherent limitations in the effectiveness of any system of internal control, including the possibility of human error andthe circumvention or overriding of controls. Accordingly, even an effective internal control system may not prevent or detectmisstatements and can provide only reasonable assurance with respect to financial statement preparation. Also, projections ofany evaluation of effectiveness to future periods are subject to the risk that controls may become inadequate because of changesin conditions or that the degree of compliance with the policies or procedures may deteriorate.
Based on the results of our evaluation, management assessed the effectiveness of our internal control over financial reporting asof June 30, 2008, utilizing the criteria set forth by the Committee of Sponsoring Organizations of the Treadway Commission(COSO) in Internal Control — Integrated Framework. Based on the results of this assessment, management (including our chiefexecutive officer and our chief financial officer) has concluded that, as of that date, our internal control over financial reportingwas effective.
The attestation report concerning the effectiveness of our internal control over financial reporting as of June 30, 2008, issued byErnst & Young LLP, Independent Registered Public Accounting Firm, appears on page 90 of our Form 10-K.
Changes in Internal Control Over Financial Reporting
There have been no changes in our internal control over financial reporting during the fourth quarter of fiscal 2008 that havematerially affected, or are reasonably likely to materially affect, our internal control over financial reporting.
ITEM 9B. OTHER INFORMATION
None.
91

PART III
ITEM 10. DIRECTORS AND EXECUTIVE OFFICERS OF THE REGISTRANT
Information regarding our directors is incorporated herein by reference to the information contained under the caption “Proposal1 — Election of Directors” in our 2008 Proxy Statement for the 2008 Annual Meeting of Stockholders (the 2008 ProxyStatement). Information regarding our current executive officers is found under the caption “Executive Officers of theRegistrant” in Part I hereof and is incorporated by reference herein. Information regarding Section 16 reporting compliance isincorporated herein by reference to information contained under the caption “Section 16(a) Beneficial Ownership ReportingCompliance” in our 2008 Proxy Statement. The identity of our Audit Committee members and information regarding the “auditcommittee financial experts” on our Audit Committee is incorporated herein by reference to information contained under thecaption “About our Board and Its Committees” in our 2008 Proxy Statement. Finally, information regarding our code of ethicsis contained under the caption “Corporate Governance — Standards of Business Conduct” in our 2008 Proxy Statement and isincorporated herein by reference.
ITEM 11. EXECUTIVE COMPENSATION
The information required by this item is incorporated by reference to the information contained under the captions “DirectorCompensation,” “Executive Compensation,” “Compensation Committee Interlocks and Insider Participation” and “Report of theLeadership Development and Compensation Committee” in our 2008 Proxy Statement.
ITEM 12. SECURITY OWNERSHIP OF CERTAIN BENEFICIAL OWNERS ANDMANAGEMENT ANDRELATED STOCKHOLDERMATTERS
The information required by this item is incorporated by reference to the information contained under the caption “SecurityOwnership of Certain Beneficial Owners and Management” in our 2008 Proxy Statement.
Equity Compensation Plan Information
The following table presents a summary of outstanding stock options and securities available for future grant under ourstockholder approved and non-stockholder-approved equity compensation plans as of June 30, 2008 (in millions, except pershare amounts).
Plan Category
Number of Securitiesto be Issued upon
Exercise ofOutstanding
Options, Warrantsand Rights
Weighted AverageExercise Price ofOutstanding
Options, Warrantsand Rights
Number ofSecurities
Remaining Availablefor Future Issuance
Under EquityCompensation Plans
Equity compensation plans approved by security holders (excluding ESPP) . . . . 106 $26.30 101Equity compensation plans not approved by security holders (excludingESPP) . . . . . . . . . . . . . . . . . . . . . . . . . . . . . . . . . . . . . . . . . . . . . . . . . . . . . . . . . 8 $15.52 N/A
Total (excluding ESPP) . . . . . . . . . . . . . . . . . . . . . . . . . . . . . . . . . . . . . . . . . . . . . . 114 $25.53 101Equity compensation plans approved by security holders (ESPP only) . . . . . . . . . N/A N/A 11Equity compensation plans not approved by security holders (ESPP only) . . . . . . N/A N/A N/A
Total (ESPP only) . . . . . . . . . . . . . . . . . . . . . . . . . . . . . . . . . . . . . . . . . . . . . . . . . . N/A N/A 11
All plans . . . . . . . . . . . . . . . . . . . . . . . . . . . . . . . . . . . . . . . . . . . . . . . . . . . . . . . . . 114 $25.53 112
ITEM 13. CERTAIN RELATIONSHIPS AND RELATED TRANSACTIONS
The information required by this item is incorporated by reference to the information contained under the captions “About OurBoard and Its Committees,” “Proposal 1 — Election of Directors,” “Related Person Transactions Policy and Procedures,” and“Certain Related Person Transactions” in our 2008 Proxy Statement.
ITEM 14. PRINCIPAL ACCOUNTANT FEES AND SERVICES
The information required by this item is incorporated herein by reference to the information contained under the caption “Auditand Non-Audit Fees” in our 2008 Proxy Statement.
92
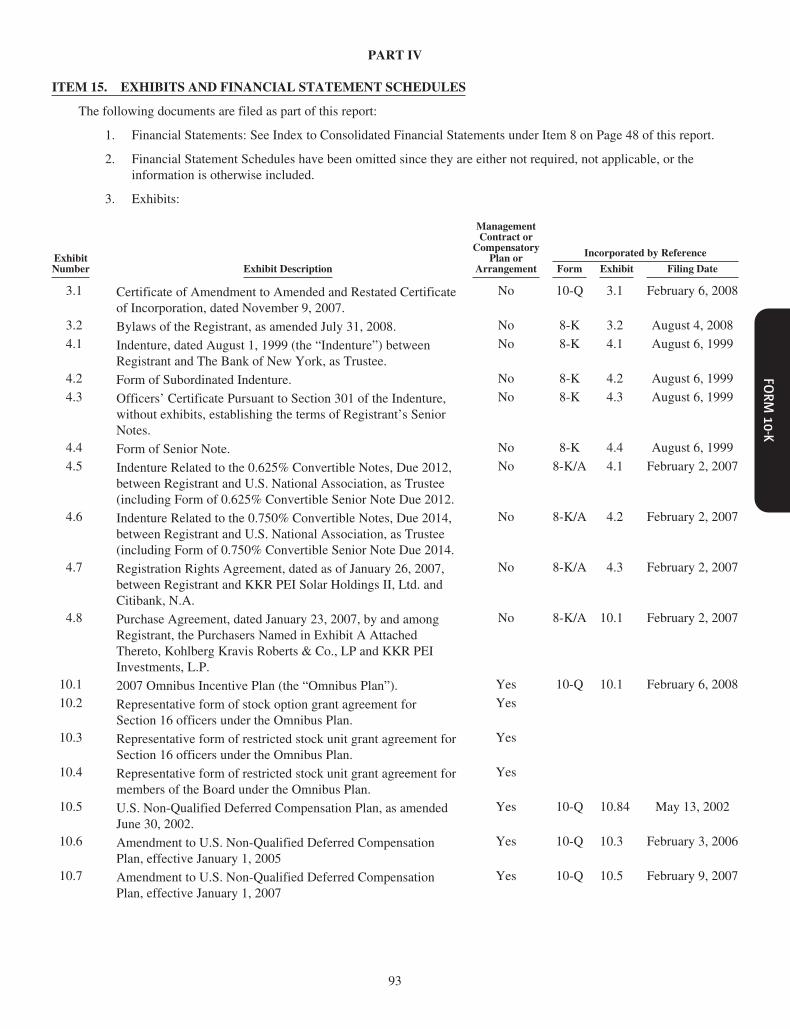
PART IV
ITEM 15. EXHIBITS AND FINANCIAL STATEMENT SCHEDULES
The following documents are filed as part of this report:
1. Financial Statements: See Index to Consolidated Financial Statements under Item 8 on Page 48 of this report.
2. Financial Statement Schedules have been omitted since they are either not required, not applicable, or theinformation is otherwise included.
3. Exhibits:
ExhibitNumber Exhibit Description
ManagementContract or
CompensatoryPlan or
Arrangement
Incorporated by Reference
Form Exhibit Filing Date
3.1 Certificate of Amendment to Amended and Restated Certificateof Incorporation, dated November 9, 2007.
No 10-Q 3.1 February 6, 2008
3.2 Bylaws of the Registrant, as amended July 31, 2008. No 8-K 3.2 August 4, 2008
4.1 Indenture, dated August 1, 1999 (the “Indenture”) betweenRegistrant and The Bank of New York, as Trustee.
No 8-K 4.1 August 6, 1999
4.2 Form of Subordinated Indenture. No 8-K 4.2 August 6, 1999
4.3 Officers’ Certificate Pursuant to Section 301 of the Indenture,without exhibits, establishing the terms of Registrant’s SeniorNotes.
No 8-K 4.3 August 6, 1999
4.4 Form of Senior Note. No 8-K 4.4 August 6, 1999
4.5 Indenture Related to the 0.625% Convertible Notes, Due 2012,between Registrant and U.S. National Association, as Trustee(including Form of 0.625% Convertible Senior Note Due 2012.
No 8-K/A 4.1 February 2, 2007
4.6 Indenture Related to the 0.750% Convertible Notes, Due 2014,between Registrant and U.S. National Association, as Trustee(including Form of 0.750% Convertible Senior Note Due 2014.
No 8-K/A 4.2 February 2, 2007
4.7 Registration Rights Agreement, dated as of January 26, 2007,between Registrant and KKR PEI Solar Holdings II, Ltd. andCitibank, N.A.
No 8-K/A 4.3 February 2, 2007
4.8 Purchase Agreement, dated January 23, 2007, by and amongRegistrant, the Purchasers Named in Exhibit A AttachedThereto, Kohlberg Kravis Roberts & Co., LP and KKR PEIInvestments, L.P.
No 8-K/A 10.1 February 2, 2007
10.1 2007 Omnibus Incentive Plan (the “Omnibus Plan”). Yes 10-Q 10.1 February 6, 2008
10.2 Representative form of stock option grant agreement forSection 16 officers under the Omnibus Plan.
Yes
10.3 Representative form of restricted stock unit grant agreement forSection 16 officers under the Omnibus Plan.
Yes
10.4 Representative form of restricted stock unit grant agreement formembers of the Board under the Omnibus Plan.
Yes
10.5 U.S. Non-Qualified Deferred Compensation Plan, as amendedJune 30, 2002.
Yes 10-Q 10.84 May 13, 2002
10.6 Amendment to U.S. Non-Qualified Deferred CompensationPlan, effective January 1, 2005
Yes 10-Q 10.3 February 3, 2006
10.7 Amendment to U.S. Non-Qualified Deferred CompensationPlan, effective January 1, 2007
Yes 10-Q 10.5 February 9, 2007
93

ExhibitNumber Exhibit Description
ManagementContract or
CompensatoryPlan or
Arrangement
Incorporated by Reference
Form Exhibit Filing Date
10.8 2005 U.S. Non-Qualified Deferred Compensation Plan,amended and restated effective January 1, 2005
Yes 10-Q 10.4 February 9, 2007
10.9 Amendment to 2005 U.S. Non-Qualified DeferredCompensation Plan, effective January 1, 2008
Yes 10-Q 10.5 February 6, 2008
10.10 Section 162(m) Executive Officer Performance-Based BonusPlan, effective July 1, 2006.
Yes 10-K 10.11 September 8, 2006
10.11 U.S. Vice President Severance Plan and Summary PlanDescription, effective as of May 1, 2006.
Yes 10-K 10.12 September 8, 2006
10.12 U.S. Vice President Involuntary Separation Plan andSummary Plan Description, effective as of November 2,2006.
Yes 10-K 10.13 September 8, 2006
10.13 Form of Change of Control Agreement executed by eachexecutive officer, other than the Chief Executive Officer ofRegistrant.
Yes
10.14 Form of Change of Control Agreement executed by theChairman of the Board and Chief Executive Officer ofRegistrant.
Yes
10.15 Form of Indemnification Agreement executed by each Boardmember and executive officer of Registrant.
Yes 10-K 10.104 September 30, 2002
10.16 Chief Executive Officer Bonus Terms for FY09 under theSection 162(m) Executive Officer Performance-Based BonusPlan.
Yes 8-K 10.1 August 4, 2008
10.17 Executive Officer Bonus Terms for FY09 under the Section162(m) Executive Officer Performance-Based Bonus Plan.
Yes
10.18 Chairman of the Board Bonus Terms for FY09 under theSection 162(m) Executive Officer Performance-Based BonusPlan
Yes
10.19 Changes to the Named Executive Officer Base Salary andBonus Targets.
Yes 10-Q 10.3 February 9, 2007
10.20 Compensation Terms for Jonathan Schwartz. Yes 10-K 10.20 September 8, 2006
10.21 Compensation Terms for Scott McNealy. Yes 10-K 10.19 September 8, 2006
10.22 Amendment to Compensation Terms for Jonathan I.Schwartz.
Yes 10-Q 10.1 February 9, 2007
10.23 Amendment to Compensation Terms for Scott G. McNealy. Yes 10-Q 10.2 February 9, 2007
21.1 Subsidiaries of Registrant. No
23.1 Consent of Independent Registered Public Accounting Firm. No
31.1 Rule 13a-14(a) Certification of Chief Executive Officer. No
31.2 Rule 13a-14(a) Certification of Chief Financial Officer. No
32.1 Section 1350 Certificate of Chief Executive Officer. No
32.2 Section 1350 Certificate of Chief Financial Officer. No
94

SIGNATURES
Pursuant to the requirements of Section 13 or 15(d) of the Securities Exchange Act of 1934, the registrant has duly caused thisreport to be signed on its behalf by the undersigned, thereunto duly authorized.
August 28, 2008 SUN MICROSYSTEMS, INC.Registrant
By: /s/ MICHAEL E. LEHMAN
(Michael E. Lehman)Chief Financial Officer and ExecutiveVice President, Corporate Resources
POWER OF ATTORNEY
KNOW ALL PERSONS BY THESE PRESENTS, that each person whose signature appears below constitutes and appointsJonathan I. Schwartz and Michael A. Dillon, jointly and severally, his attorney-in-fact, each with the full power of substitution,for such person, in any and all capacities, to sign any and all amendments to this Annual Report on Form 10-K and to file thesame, with all exhibits thereto and other documents in connection therewith, with the Securities and Exchange Commission,granting unto said attorney-in-fact and agent full power and authority to do and perform each and every act and thing requisiteand necessary to be done in connection therewith, as fully to all intents and purposes as he might do or could do in personhereby ratifying and confirming all that each of said attorneys-in-fact and agents, or his substitute, may do or cause to be doneby virtue hereof.
Pursuant to the requirements of the Securities Exchange Act of 1934, this report has been signed below by the following personson behalf of the registrant and in the capacities and on the dates indicated.
Signature Title Date
/s/ SCOTT G. McNEALY
(Scott G. McNealy)
Chairman of the Board of Directors August 28, 2008
/s/ JONATHAN I. SCHWARTZ
(Jonathan I. Schwartz)
Chief Executive Officer, President andDirector (Principal Executive Officer)
August 28, 2008
/s/ MICHAEL E. LEHMAN
(Michael E. Lehman)
Chief Financial Officer and Executive VicePresident, Corporate Resources (PrincipalFinancial Officer)
August 28, 2008
/s/ VENGALIL K. CHATTERJEE-TANDON
(Vengalil K. Chatterjee-Tandon)
Vice President and Corporate Controller(Principal Accounting Officer)
August 28, 2008
/s/ JAMES L. BARKSDALE
(James L. Barksdale)
Director August 28, 2008
/s/ STEPHEN M. BENNETT
(Stephen M. Bennett)
Director August 28, 2008
/s/ PETER L.S. CURRIE
(Peter L.S. Currie)
Director August 28, 2008
/s/ ROBERT J. FINOCCHIO, Jr.
(Robert J. Finocchio, Jr.)
Director August 28, 2008
/s/ JAMES H. GREENE, JR.
(James H. Greene, Jr.)
Director August 28, 2008
95

Signature Title Date
/s/ MICHAEL E. MARKS
(Michael E. Marks)
Director August 28, 2008
/s/ PATRICIA E. MITCHELL
(Patricia E. Mitchell)
Director August 28, 2008
/s/ M. KENNETH OSHMAN
(M. Kenneth Oshman)
Director August 28, 2008
/s/ P. ANTHONY RIDDER
(P. Anthony Ridder)
Director August 28, 2008
96


![ZYBO - Digilent Documentation [Reference.Digilentinc] Z7 B.2 out of 14 2017 MIPI, General I/O 10K R60 10K R62 10K R64 10K R67 GND VCC3V3 SW3 SW2 SW1 SW0 10K R57 10K R71 10K R72 GND](https://img.dokumen.tips/doc/110x75/5abecaa37f8b9a3a428d6851/zybo-digilent-documentation-z7-b2-out-of-14-2017-mipi-general-io-10k-r60.jpg)