Embed Size (px)
Citation preview

Sergey Syntulsky
Smart grid: technology and market
evidence

Smart grid ecosystem transition
Current state Target state
(Mostly) price and volume-
taking consumer
Prosumer with internal
optimization
Utility as unilateral service
provider
Utility as adaptive network
of prosumers
B2B utilities equipment
vendors
B2B + B2C vendors and
lessors
Regulation of power system
technical and economic
issues
Regulation of information
exchange (privacy,
interoperability) and pricing
of information/control
services

Current stateRole Current state
Consumers Demand response mostly for large consumers, PV
devices for household consumption, AMI, time-based
rates. But hard to engage in complicated cooperation,
need to be seamless.
Utilities Economic stimuli are not aligned enough. Later timing
option benefits (no exponential growth for early
adopters). It is easier to force new hardware installation,
but harder to encourage new business-processes.
Vendors Those who can work in emerging business model
achieve exponential growth, others have moderate
margins.
Governments Face transition problems: stranded assets, subsidies for
early adopters, problems with regulation for both old
and new ecosystem.

Open issues
Full equipment replacement :
Move to advanced metering and control devices
Move to distributed generators
Storage, consumer devices, electrical cars
Mechanism design, proper stimuli for each side:
New technical and economic regulation (information
exchange protocols, market model)
Good patterns for small (esp. household) consumers
involvement
Right risk/return for private funding

Plan
Technology changes
Bi-directional communications with consumer (AMI)
Intermittent (solar and wind) and cheap balancing
(gas and biofuel) power generation
Demand response/energy efficiency
Distribution automation
Moderate increase in reliability
Financial data perspective
Valuation of smart grid projects
Some cases in Russia

Technology trends
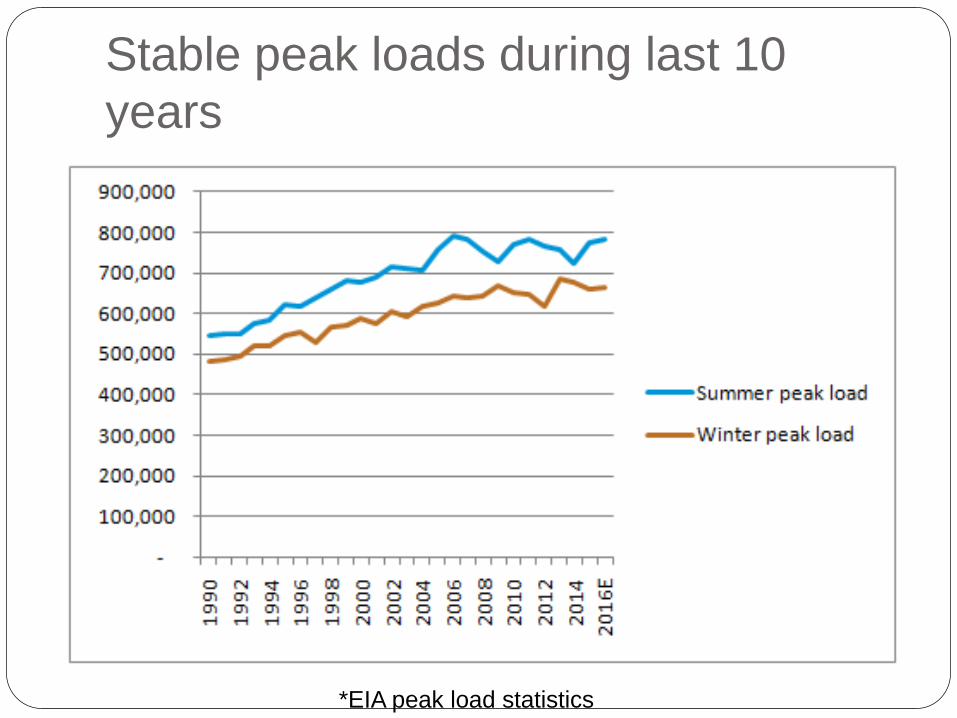
Stable peak loads during last 10
years
*EIA peak load statistics

Demand response ~700 000 customer-based devices under SGIG
prpgram (mostly direct load control devices and
controllable thermostats)
Customers enrolled in time-based pricing:
*chart from smartgrid.gov

Distribution automation
~8000 automated feeder switches installed (5%
of distribution circuits) in SGIG (smart grid
investment grant) program
=>50% shorter and 11%-49% less frequent
outages
Utilities data analytics market for utilities and
regulators is expected to grow 33% per year
Cybersecurity plan requirements for subsidized
projects

Reliability
*Charts from Larsen, LaCommare, Eto, Sweeney, Assessing Changes in reliability of the US Electric power
system, 2015

Plan
Technology changes
Financial data perspective
Changes in utilities cost structure
Historical growth of sales and earnings
Fundamental growth rate
Sales/asset ratio
ETF historical returns and PEG
Valuation of smart grid projects
Some cases in Russia

Utilities cost structure change
*EIA utilities expenses report

Historical growth High sales growth in
equipment sector
(>market)
Small growth in utilities
and power sectors
(<market)
Strong margin growth
relative to weak sales
growth in utilities and
power sectors
*data published by Aswath Damodaran:
http://people.stern.nyu.edu/adamodar/New_Home_Page/dataarchived.html

Fundamental growth rate = ROC *
reinvestment rate

Reinvestment rate (NetCapEx/EBIT)
NetCapEx = CapEx - Depreciation

Return on capital (EBIT/Assets)

Sales/assets ratio

Net investments / sales by industry
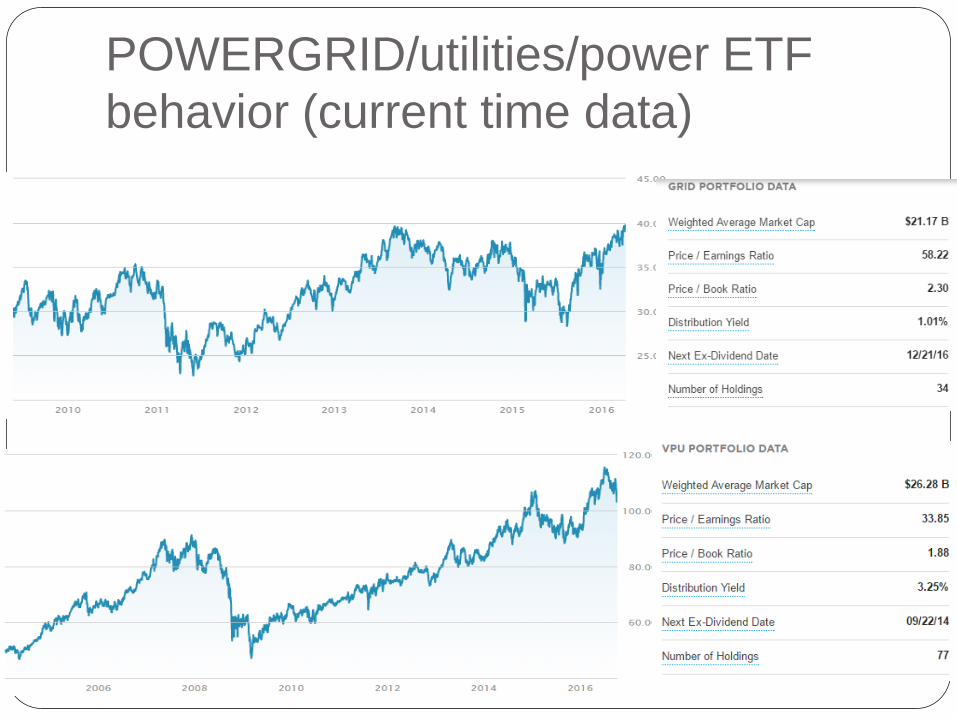
POWERGRID/utilities/power ETF
behavior (current time data)

Price/Earnings/Growth
*data published by Aswath Damodaran:
http://people.stern.nyu.edu/adamodar/New_Home_Page/dataarchived.html

Plan
Technology changes
Financial data perspective
Valuation of smart grid projects
Smart grid as real option
Generator valuation
Smart grid valuation
Some cases in Russia

Real option characteristics Some of smart grid value is delivered in straight-
forward way:
Reliability/QOS increase
Reduction in losses due to better dispatch
Decrease in capacity reserves needed
Other part of smart grid value is an option:
To build new generation (small scale and on consumer
side)
To establish new pricing and shared control schemes
While first part can be estimated under existing
regulatory framework, second is non-trivial

Example
Consider option:
to build small-scale gas-fired power plant on
consumer side
connect it to the grid,
sell excess energy to the grid for years.
Its value depends on gas and power market
prices
Gas power fired plant can be valued as spark
spread option

t – hour
Vt – consumption
C – generator capacity
K – efficiency coefficient
Gt – gas price
Xt – electricity price
f – price of electricity consumed from grid
g – price for selling electricity
Example: generator valuation

Example: smart grid valuation
Cost – cost function to build generator with capacity
C
Build 2D tree:
1st dimension – long-term gas price
2nd dimension – long-term electricity price
Plan
Technology changes
Financial data perspective
Valuation of smart grid projects
Some cases in Russia
Smart grids in Russia: pros and cons
UIAS FTS of Russia regulation approach
Utilities automation issues

Smart grids in Russia: cons
Some factors are against immediate smart grid
development:
Low demand for non-hydro renewables (cheap gas)
Low household tariffs (cross-subsidies)
Low median household income (will not invest in
smart appliances)
Access to cheap financing is limited for small
entities
Poor contracts enforcement (incumbent can
preserve market share)

Smart grids in Russia: pros Some new initiatives like virtual power plant and
smart grid in Crimea, not enough information
On opposite there are some markets with good economic potential: Wind and fossil-based microgrids for power supply of
isolated or remote sites (like mines and related housing) Insolated territories of Northern Caucasus with
extremely high transmission expenses Large energy-intensive consumers (including world
largest district heating systems, water supply and disposal)
Smart grid creation seems to be less relevant task than power grid automation and quantitative decision support

UAIS scheme
SCADA and
metering system
ERP and
accounting
Computer-aided
design systems
Balance management system
Investments planning
Abnormal situations (losses,
outages) root cause analysis
Regulatory accounting and
cost allocation
Regional
regulatory
bodies
Holding
Federal
regulatory body
Cross-
validation
between grids
Forecasting and planning next
year balance

Scheme of typical contracts between
power grids in single region

Issues with utilities grid automation Technological state of different power grid parts can
be very different, often managed on different platforms
Accounting, CAD and metering entities are often not mapped
No explicit topology information is combined with metering data, unable to localize losses
Data exchange between power grid (operates metering) and energy retail (billing function) is poorly formalized (no single protocol)
Most value can be gained after full data model consolidation, it is time-consuming and expensive
Hard to prove value of analytical work to regulator under weak institutions

High corruption level leads to:
high abnormal power losses (stealing of energy)
unnecessary investments,
Projects, that are dedicated to prevent such
things can face opposition
Issues with utilities grid automation


![[Smart Grid Market Research] Smart Grid Hiring Trends Study (Part 2 of 2)- Zpryme Smart Grid Insights](https://img.dokumen.tips/doc/110x75/5414021c8d7f7284698b47a9/smart-grid-market-research-smart-grid-hiring-trends-study-part-2-of-2-zpryme-smart-grid-insights.jpg)


![[Smart Grid Market Research] South Korea: Smart Grid Revolution, Zpryme Smart Grid Insights, July 2011](https://img.dokumen.tips/doc/110x75/5414026d8d7f727d698b47c7/smart-grid-market-research-south-korea-smart-grid-revolution-zpryme-smart-grid-insights-july-2011.jpg)


![[Smart Grid Market Research] Smart Grid Index: November 2012 - Zpryme Smart Grid Insights](https://img.dokumen.tips/doc/110x75/541402018d7f728a698b47a5/smart-grid-market-research-smart-grid-index-november-2012-zpryme-smart-grid-insights.jpg)