Embed Size (px)
Citation preview

Investor sentiment seems "stable" even though the market in the first days of the month received a lot of information of the type that had created many "dark" sessions in the past. In addition, the rise of stocks that have a large impact on the basket of indexes such as SAB, VNM, VCB, BID, or ROS are supporting the VNIndex. We believe that VNIndex can easily reach 800 points in August.
Despite of that, after considering other factors, we think the index could not go further from this point in the short term. VNIndex has increased 17.9% YTD, lifting the overall P/E of the market to 16.3 by the end of July from 15.5 at the end of 2016. Our earlier assumption that market’s P/E will be mean-reversed has not occurred yet, thanks to the abundance of cash inflows. It looks like the rally of VNIndex, however, has fully reflected the listed companies’ business prospects as well as supported information. The 6M 2017 NPAT of 611 out of 733 listed companies in the HSX and HNX increased 14.4% YoY, but most of them just fulfilled a little bit more than 50% of their business plans in 2017. Besides, around 50% of corporations under RongViet Research coverage reported their business results just in line with our forecast, while more than 30% of coverage stocks showed disappointing business results. Moreover, after the positive rally since the beginning of the year, the recommendation on many stocks under our coverage has changed to “Neutral” rating. In other words, it is not easy to select stocks that are attractive at the moment. Typically, in such conditions, investors would be psychologically waiting for the business picture of macro and firms to be more open and clearer.
Given the supposed conditions, we believe that support news will not be much while there are many points to note: (1) The Government's commitment to tackle and fight corruption can lead to unexpected events that negatively impact public sentiment; (2) Regardless of the SBV's efforts to withdraw money via open the market or the Government’s oriented to speed up capital disbursement, our macro team believes that the banking liquidity is still redundant. However, as the results of that, cash flow for the stock market at the end of the year will be much less than that of the first haft of the year; (3) The effect of the second business result season will continue to be digested in August and September without supporting news, (4) CDS has ended its downtrend since early 2017 and has been fluctuating during last month, and (5) The derivative market is expected to be active in August but does not have much to attract investors.
Therefore, although we believe that the indices may increase in the first weeks of August, the profit-taking activities may overwhelm the buying which has turned into cautious at current historical-high of VNIndex. We believe the VNIndex will strongly fluctuate between 770 to 800 points, and may decrease to lower than this level in late August.
Strategy Board
Truc Doan – Head of Research
Ha My Tran
Lam Nguyen
Thien Bui
Hieu Nguyen
Quang Vo
Ha Tran
Please see penultimate page for additional important disclosure
Viet Dragon Securities Corp. (“VDSC”) is a foreign broker-dealer unregistered in the USA. VDSC research is prepared by research analysts who are not registered in the USA. VDSC research is distributed in the USA pursuant to Rule 15a-6 of the Securities Exchange Act of 1934 solely by Rosenblatt Securities Inc, an SEC registered and FINRA-member broker-dealer.
5
10
15
20
251/1/2009
5/1/2009
9/1/2009
1/1/2010
5/1/2010
9/1/2010
1/1/2011
5/1/2011
9/1/2011
1/1/2012
5/1/2012
9/1/2012
1/1/2013
5/1/2013
9/1/2013
1/1/2014
5/1/2014
9/1/2014
1/1/2015
5/1/2015
9/1/2015
1/1/2016
5/1/2016
9/1/2016
1/1/2017
5/1/2017
PE - VNIndex PE Average
07/08/2017
Investment Strategy August 2017
Will the Good Buy Opportunity Arise for Patient Investors?

Rong Viet Securities Corporation – Investment Strategy Report August 2017 2
CONTENTS
WORLD ECONOMY .............................................................................................................................................................................................................................. 3
US: Positive GDP Growth in Q2 2017 ................................................................................................................................................................. 3
EU: Still Awaits for a Shift in Monetary Policy ................................................................................................................................................. 3
China: Sustained Growth Momentum ............................................................................................................................................................... 4
GLOBAL STOCK MARKETS ............................................................................................................................................................................................................... 5
VIETNAM MACRO ................................................................................................................................................................................................................................. 6
Credit into the Economy in H1 2017: The Credit Structure Focused on Production & Real Estate ........................................... 6
Accommodative Monetary Policy Amidst Low Inflation Environment ................................................................................................ 7
The Third Quarter Features Ample Liquidity in the Banking System .................................................................................................... 7
VIETNAM STOCK MARKET IN JULY: Q2’S EARNINGS GROWTH SLOWED DOWN COMPARED TO Q1 ....................................................... 9
AUGUST STOCK MARKET OUTLOOKS..................................................................................................................................................................................... 13
INVESTMENT STRATEGY ............................................................................................................................................................................................................... 15
Foreign investors kept net buying the VN30 basket was supportive to the market sentiment during the strongly fluctuating period of the market in July. As a result, VNIndex recovered quickly just after declining to under 760 points. The selling pressure became more intense during the market’s rising sessions, which implies that despite the insignificant amount of withdrawals from the market, there was very little preference for aggressive buying strategy when VNIndex surpassed 780 points.
Most H1 2017 business results have been similar to the market expectation as well as RongViet Research’s forecasts (for stocks of our conviction list). Macroeconomic indices were considered stable but the growth potential appears to be weaker than the policy makers’ targets. The 6.7% GDP growth rate target for 2017 was considered unfeasible. Therefore, taking into account the abundant cash flows into the stock market in the first half of the year, the expectations on the whole-year profit growth have mostly been reflected in the increase since the beginning of the year.
The effects of the H1 2017’s business result announcements can still be displayed during the first three weeks of August. Thus, investors may still seek short term opportunities from stocks that have performed well but the effects on stock prices have not been fully reflected. However, such investors should also follow strictly the loss-cutting rule and restrain from aggressive buying, especially during the market’s strong rises. We believe that patient investors will have best buying opportunities for long-term targets.
In July 2017, we also released five company analysis reports, including HTI, BFC, DRC, DQC, NKG, HSG, HPG, CHP, SHP, and CTD. Investors who are interested in these stocks can find the full report on our website at Company reports.
HIGHLIGHT STOCKS ......................................................................................................................................................................................................................... 18 45 stocks of RongViet Research (analyzing, discussing with companies) and have analysis and specific evaluation in “Company report” or “Analyst pinboard”.

Rong Viet Securities Corporation – Investment Strategy Report August 2017 3
WORLD ECONOMY • US: Positive GDP Growth in Q2 2017
• EU: Still Awaits for a Shift in Monetary Policy
• China: Sustained Growth Momentum
US: Positive GDP Growth in Q2 2017
The FOMC decided to maintain the Fed funds rate at a range between 1.00% and 1.25% after the July meeting. The Fed also repeated the message to unwind of its balance sheet relatively soon. Despite the prospect of the Fed draining liquidity, the US dollar weakened and treasury yields dipped after the meeting. As of the end of July, the DXY index decreased by 2.9% MoM and 9.64% compared to the beginning of the year.
Preliminary data showed that US GDP expanded at 2.6% in the second quarter of 2017. This result was better than the previous quarter mainly thanks to strong consumer spending and increased investment. Specifically, personal consumption expenditure rose 2.8% this quarter while companies increased investment in equipment. The bright spot is exports rose twice as fast as imports, implying positive external demand as well as weaker dollar. The US economy is forecasted to grow 2.7% in the third quarter due to strong labor markets, improved consumer and business sentiment and growing domestic demand.
EU: Still Awaits for a Shift in Monetary Policy
According to Eurostat, “flash” estimate for EU GDP growth was 0.6% in the second quarter of 2017, following the 0.5% expansion in the previous quarter. This was sustained by a better performance of domestic demand as well as stronger external sectors. Spain has the fastest growing economy with a growth of 0.9%. Germany – the main growth pillar of the Eurozone – grew 0.6% in Q2, followed by France at 0.5%. On the other hand, Italy is the region’s laggard, growing at around 0.4%.
After the July meeting, the ECB decided to keep interest rates unchanged and made no changes to its bond-buying programs. There is an expectation that the ECB will discuss about its taper program in September meeting, however, it is likely to be too soon for the debate given the price pressures that remained. Inflation continued to ease to 1.3% YoY in July, far off the target of just under 2%.
Figure 1: US GDP (%) Figure 2: DXY movement
Source: Bloomberg Source: BBVA
3.2
2.7
1.6
0.5 0.6
2.2
2.8
1.8
1.2
2.6
0.0
0.5
1.0
1.5
2.0
2.5
3.0
3.5
Q12
015
Q22
015
Q32
015
Q42
015
Q12
016
Q22
016
Q32
016
Q42
016
Q12
017
Q22
017 108011001120114011601180120012201240126012801300
02/0
1
16/0
1
30/0
1
13/0
2
27/0
2
13/0
3
27/0
3
10/0
4
24/0
4
08/0
5
22/0
5
05/0
6
19/0
6
03/0
7
17/0
7
31/0
7
Rong Viet Securities Corporation – Investment Strategy Report August 2017 4
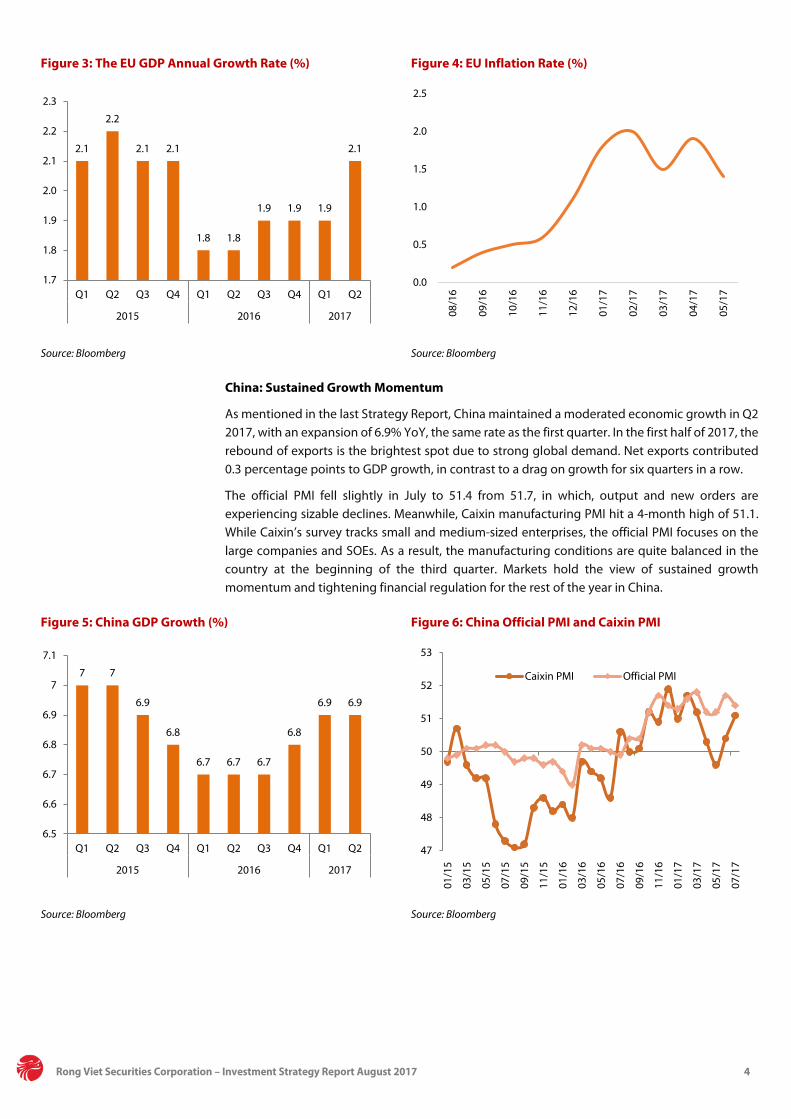
Figure 3: The EU GDP Annual Growth Rate (%) Figure 4: EU Inflation Rate (%)
Source: Bloomberg Source: Bloomberg
China: Sustained Growth Momentum
As mentioned in the last Strategy Report, China maintained a moderated economic growth in Q2 2017, with an expansion of 6.9% YoY, the same rate as the first quarter. In the first half of 2017, the rebound of exports is the brightest spot due to strong global demand. Net exports contributed 0.3 percentage points to GDP growth, in contrast to a drag on growth for six quarters in a row.
The official PMI fell slightly in July to 51.4 from 51.7, in which, output and new orders are experiencing sizable declines. Meanwhile, Caixin manufacturing PMI hit a 4-month high of 51.1. While Caixin’s survey tracks small and medium-sized enterprises, the official PMI focuses on the large companies and SOEs. As a result, the manufacturing conditions are quite balanced in the country at the beginning of the third quarter. Markets hold the view of sustained growth momentum and tightening financial regulation for the rest of the year in China.
Figure 5: China GDP Growth (%) Figure 6: China Official PMI and Caixin PMI
Source: Bloomberg Source: Bloomberg
2.1
2.2
2.1 2.1
1.8 1.8
1.9 1.9 1.9
2.1
1.7
1.8
1.9
2.0
2.1
2.2
2.3
Q1 Q2 Q3 Q4 Q1 Q2 Q3 Q4 Q1 Q2
2015 2016 2017
0.0
0.5
1.0
1.5
2.0
2.5
08/1
6
09/1
6
10/1
6
11/1
6
12/1
6
01/1
7
02/1
7
03/1
7
04/1
7
05/1
7
7 7
6.9
6.8
6.7 6.7 6.7
6.8
6.9 6.9
6.5
6.6
6.7
6.8
6.9
7
7.1
Q1 Q2 Q3 Q4 Q1 Q2 Q3 Q4 Q1 Q2
2015 2016 2017
47
48
49
50
51
52
53
01/1
5
03/1
5
05/1
5
07/1
5
09/1
5
11/1
5
01/1
6
03/1
6
05/1
6
07/1
6
09/1
6
11/1
6
01/1
7
03/1
7
05/1
7
07/1
7
Caixin PMI Official PMI

Rong Viet Securities Corporation – Investment Strategy Report August 2017 5
GLOBAL STOCK MARKETS
Figure 7: Performance of some major global stock market indices in July
Source: Bloomberg, RongViet Research
Unlike the same period of last year, when most markets tried to rebalance after the shocking “Brexit”, July 2017 witnessed a “calm” month.
In July, FED decided to keep the rates unchanged. Although the inflation still came in 1.6%, below the target of 2%, the FED Chairman Janet Yellen suggested in her testimony that this would not be very significant. She was also quite positive on the labor market. Many financial institutions forecast that FED will increase the rate and announce its plan to reduce the balance sheet in September. Thanks to the stable economy, the US stock market gained quite well in July. In addition, the Dow Jones, the S&P 500 and the Nasdaq Index have been witnessing strong gains since beginning of 2017.
European markets did not fluctuate much. Like FED, the ECB still withholds the rate. The inflation rate of EU only reached 1.3%, far below the target of 2%. This might be one reason why ECB did not decide to increase the interest rate in July.
Asian markets also moved up in July. Shanghai Index and Hang Sheng Index closed the month up 3.46% and 6.05%. Solid economic data of China such as GDP growth 6.9%, retail sales up 11% and industrial production up 7.6% supported the stock market. Another noticeable economic event in the Asian region was the BoJ meeting. BoJ did not give any significant announcements except for the changing of expectation on inflation reaching its 2% target level from 2018 to 2019.
Oil price increased 8.9% in July. The oil price crossed above USD50/barrel. US production figures fell and inventories dropped by 10.2 million barrels, giving the opportunity for oil price to move up.
11% 10%
21%
3% 5% 6% 4%
15%
24%
13%
19%
10%
5%
18%
26%
10%
-7%
-15%
-5%
5%
15%
25%
35%
Dow
Jone
s
S&P
500
Nas
daq
FTSE
100
CAC
40
DA
X
Nik
kei 2
25
SSE
(Sha
ngha
i)
Han
g Se
ng (H
ongk
ong)
TSEC
(Tai
wan
)
Kosp
i (Ko
rean
)
JKSE
(Ind
ones
ia)
KLSE
(Mal
aysi
a)
VNIn
dex
(Vie
tnam
)
HN
X-In
dex
(Vie
tnam
)
Gol
d Oil
From 30/06/2017 to 31/07/2017 From 31/12/2016 to 31/07/2017

Rong Viet Securities Corporation – Investment Strategy Report August 2017 6
VIETNAM MACRO • Credit into the Economy in H1 2017: The Credit Structure Focused on Production & Real Estate
• Accommodative Monetary Policy Amidst Low Inflation Environment
• The Third Quarter Features Ample Liquidity in the Banking System
Credit into the Economy in H1 2017: The Credit Structure Focused on Production & Real Estate
According to the SBV, credit to manufacturing & construction expanded robustly at the beginning of 2017. This movement is different from the previous period when the contribution from real estate related activities to credit growth was above 50% most of the time. In the first 4 months, credit to manufacturing and construction grew 10.53% and 17.15%, respectively, compared to the end of 2016. Based on the data, preliminary evidence suggests credit is being channeled to the manufacturing sector and is consistent with the authorities’ target. In H1 2017, manufacturing sector grew 10.52% YoY, contributing 1/3 of GDP growth.
Regarding the construction sector, reported data sent out conflicting messages. According to GSO, in the first 6 months, total construction value was VND506,600 billion (+11% YoY), in which, house building construction expanded at the fastest pace (+16.6% YoY and accounted for 42.1% of total construction value). Credit to construction, however, grew at faster pace and reached a similar size as total construction value at the end of April 2017 (~VND595,000 billion, +27%YoY). It is noticeable that credit to other sectors (including real estates, financial services and other services) witnessed a negative growth of 0.24% compared to the end of 2016. But according to National Financial Supervisory Commission (NFSC), compared to the end of 2016 loans to consumer finance grew by 29.7% in Q1 2017, in which, loans to mortgages increased by 38.4%. From our understanding, the raise of risk weight for loans related to real estate (excluding mortgages and construction loans) from 150% to 250%, which became effective in January 2017, has moderated the pace of credit expansion in other sectors. While there is only limited data about real estate and consumer finance lending, it is considered that a substantial amount of credit appears to be directed at real estate related sectors through direct lending to developers, loans for construction and mortgages. As a result, we think the Government’s efforts are not enough to curb excessive or speculative real estate loans in the banking system.
Generally, we appreciate the efforts of the Government to drive capital into manufacturing sector to boost GDP expansion. However, there are still concerns about the accelerating lending to real estate sector. In recent reports about Vietnam economy, the World Bank and IMF both issued warnings about the high credit growth rate. In particular, IMF has recommended reducing the credit growth targets to below 15%.
Figure 8: Contribution to Credit Growth (YoY percent change)
Source: GSO, RongViet Research complied
0%
5%
10%
15%
20%
25%
Q12
014
Q22
014
Q32
014
Q42
014
Q12
015
Q22
015
Q32
015
Q42
015
Q12
016
Q22
016
Q32
016
Q42
016
Q12
017
Agriculture Manufacturing & Construction
Retail & Transportation Others
Credit Growth

Rong Viet Securities Corporation – Investment Strategy Report August 2017 7
Accommodative Monetary Policy Amidst Low Inflation Environment
In July 2017, headline inflation has moderated to 2.52% on falling food prices and base effects in health care prices. Meanwhile, core inflation has expanded a mild 1.49% compared to 2016. In the remaining months of 2017, the authorities are going to raise administered prices. According to Circular 02/2017/TT/BYT, higher fees for healthcare services will be applied for patients without health insurance from June 20, 2017. However, healthcare price index only increased by 0.36% in July. Based on the agenda, 30 provinces and 2 big cities (Ho Chi Minh City, Hanoi) will apply new fees in August, another 15 provinces in October, and 18 more provinces will follow in December. We estimate the hike may add 1% to headline CPI. Besides, the new school year is staring this month will likely add 0.4% to the headline CPI. As we know, after the plunge in May and June, pork prices recovered in mid-July and remained stable at the range of VND34,000-VND38,000/kg. Chinese traders are expected to be back in the coming months because the gap of pork prices between Vietnam and China has been expanding. Hence, we expect food and foodstuff index could increase slightly for the rest of this year. After all, we expect the headline inflation will be in line with the targeted CPI (~4%). Inflationary pressure remains moderate next year with the same CPI target of 4%. In addition, core inflation remains subdued at below 2%. We think the monetary policy directions will remain accommodative amidst low inflation environment.
Figure 9: Contribution to Headline Inflation Figure 10: World Price Index
Source: GSO, RongViet Research
Source: FAO
The Third Quarter Features Ample Liquidity in the Banking System
The State Bank of Vietnam (SBV) cut several interest rates for the first time since March 2014 in early of July. Specifically, the refinancing rate was reduced from 6.5% to 6.25%; the rediscount rate from 4.5% to 4.25%. In addition, the maximum annual short-term interest rate for loans in some prioritized sectors (agricultural, export, auxiliary industries, SMEs and hi-tech businesses) was cut by 0.5 percentage pointsto 6.5%. These adjustments are supposed to help increase liquidity for banks to provide loans, and then boost economic growth. Nonetheless, we see the SBV is still cautious in its monetary policy and market reactions have not shown any clues about the impact of this rate cut.
As we are concerned, after a rapid credit growth in the first half of 2017, the credit demand has slowed down recently. The evidence is interbank interest rates are on the downward trend since the beginning of the third quarter. Last year, interbank interest rates also declined to a low level during the same period and lasted until December 2016. Another reason is that most of the commercial banks are awaiting expansion of credit growth limit from the SBV. In the first six months of 2017, credit growth of banking system was 9.06% compared to the end of 2016. However, looking to specific banks, we see most of the banks have almost used up their credit growth room assigned in 2017 (VIB, MBB, HD Bank, SCB, Kien Long Bank) while top banks (BID,
-2%-1%0%1%2%3%4%5%6%
01/2
016
02/2
016
03/2
016
04/2
016
05/2
016
06/2
016
07/2
016
08/2
016
09/2
016
10/2
016
11/2
016
12/2
016
01/2
017
02/2
017
03/2
017
04/2
017
05/2
017
06/2
017
07/2
017
Food TransportEducation & Healthcare Other goodsHeadline Core
90
110
130
150
170
190
210
2301/
2010
6/20
1011
/201
04/
2011
9/20
112/
2012
7/20
1212
/201
25/
2013
10/2
013
3/20
148/
2014
1/20
156/
2015
11/2
015
4/20
169/
2016
2/20
177/
2017
Food Price Index Meat Price Index
Oils Price Index
Rong Viet Securities Corporation – Investment Strategy Report August 2017 8
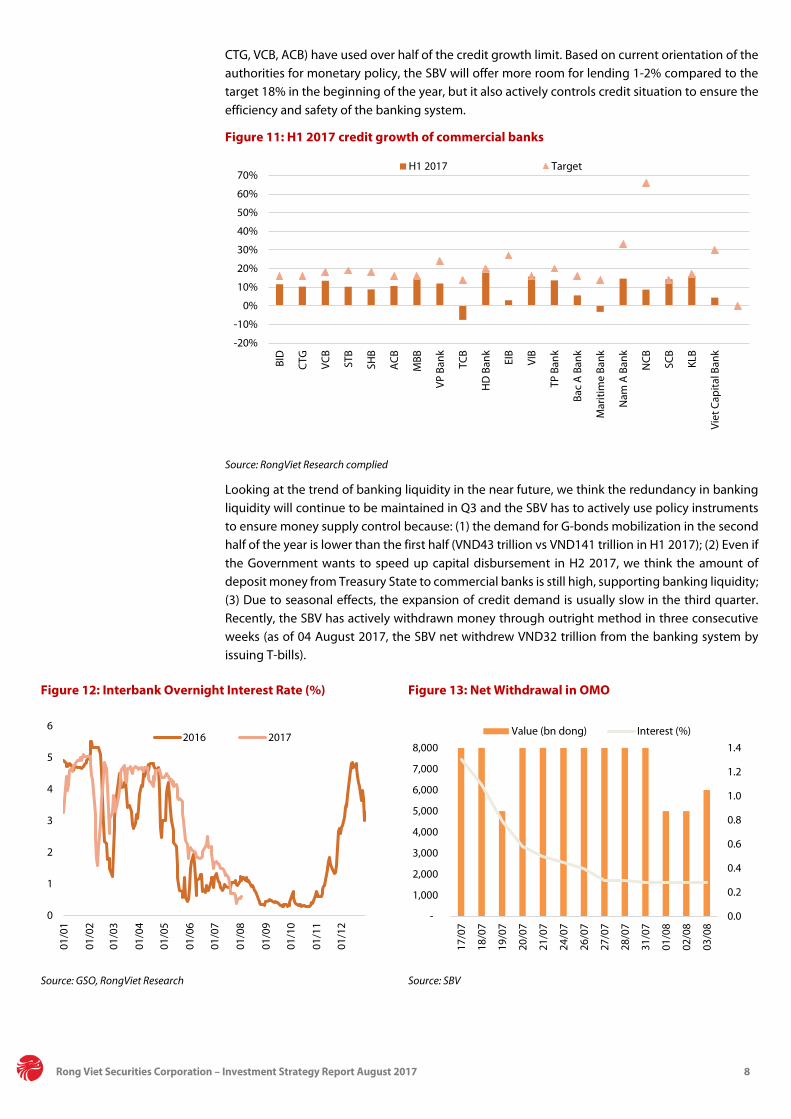
CTG, VCB, ACB) have used over half of the credit growth limit. Based on current orientation of the authorities for monetary policy, the SBV will offer more room for lending 1-2% compared to the target 18% in the beginning of the year, but it also actively controls credit situation to ensure the efficiency and safety of the banking system.
Figure 11: H1 2017 credit growth of commercial banks
Source: RongViet Research complied
Looking at the trend of banking liquidity in the near future, we think the redundancy in banking liquidity will continue to be maintained in Q3 and the SBV has to actively use policy instruments to ensure money supply control because: (1) the demand for G-bonds mobilization in the second half of the year is lower than the first half (VND43 trillion vs VND141 trillion in H1 2017); (2) Even if the Government wants to speed up capital disbursement in H2 2017, we think the amount of deposit money from Treasury State to commercial banks is still high, supporting banking liquidity; (3) Due to seasonal effects, the expansion of credit demand is usually slow in the third quarter. Recently, the SBV has actively withdrawn money through outright method in three consecutive weeks (as of 04 August 2017, the SBV net withdrew VND32 trillion from the banking system by issuing T-bills).
Figure 12: Interbank Overnight Interest Rate (%) Figure 13: Net Withdrawal in OMO
Source: GSO, RongViet Research Source: SBV
-20%
-10%
0%
10%
20%
30%
40%
50%
60%
70%
BID
CTG
VCB
STB
SHB
ACB
MBB
VP B
ank
TCB
HD
Ban
k
EIB
VIB
TP B
ank
Bac
A B
ank
Mar
itim
e Ba
nk
Nam
A B
ank
NCB SC
B
KLB
Viet
Cap
ital B
ank
H1 2017 Target
0
1
2
3
4
5
6
01/0
1
01/0
2
01/0
3
01/0
4
01/0
5
01/0
6
01/0
7
01/0
8
01/0
9
01/1
0
01/1
1
01/1
2
2016 2017
0.0
0.2
0.4
0.6
0.8
1.0
1.2
1.4
-
1,000
2,000
3,000
4,000
5,000
6,000
7,000
8,000
17/0
7
18/0
7
19/0
7
20/0
7
21/0
7
24/0
7
26/0
7
27/0
7
28/0
7
31/0
7
01/0
8
02/0
8
03/0
8
Value (bn dong) Interest (%)

Rong Viet Securities Corporation – Investment Strategy Report August 2017 9
VIETNAM STOCK MARKET IN JULY: Q2’S EARNINGS GROWTH SLOWED DOWN
COMPARED TO Q1
The market faced with trouble in July. Passing through the correction territory from July 7 to July 24, the market indices recorded positive gains thanks to the recovery seen in the last five sessions. The VNIndex increased 0.9%, while the HNXIndex also gained 2.1%. That said, without the support of SAB which has benefited from the news that the Ministry of Industry and Trade will divest its ownership of the company, the VNIndex is likely to close under the unchanged line, similar to the VN-30 (-1.2%) and the VN-Mid (-0.3%).
Figure 14 : VN-Index movement in July Figure 15 : HNX-Index movement in July
Source: RongViet Research Source: RongViet Research
Penny stocks outperformed the market. According to our statistics, 127 out of 236 penny stocks outperformed the market. Besides, stocks enjoying three-digit growth rate in July including HAI, HAR, SPI, and CMC were also penny stocks.
There were many drivers for capital flowing to penny stocks, including better earnings results (compared with same period last year) that speculators can rely on to trade. Another reason is that capital is ample. The market liquidity in 2017 jumped by 65%, compared with the average of 2016, partly due to the increasing capital used for margin. Based on a sample of the 59 largest brokers on the market, outstanding loans for such activity arrived at VND27,520 billion (+19.9% YoY).
710
730
750
770
790
0
50
100
150
200
250
300
28/04 16/05 30/05 13/06 27/06 11/07 25/07
Trading Volume (mil. shares) VNINdex (right axis)
85
89
93
97
101
105
0
20
40
60
80
100
120
28/04 16/05 30/05 13/06 27/06 11/07 25/07
Trading Volume (mil. shares) HNXIndex (right axis)

Rong Viet Securities Corporation – Investment Strategy Report August 2017 10
Reviewing Q2 2017 Business Results of Listed Companies
Table 1: Revenue and NPAT growth of different sectors
Revenue growth Q2 NPAT growth Q2 Revenue growth
YTD NPAT growth
YTD Retail -5.6% -41.5% -2.7% -13.2% Insurance 17.7% 65.3% 16.7% 35.7% Real Estate 57.8% 17.4% 33.4% 22.9% Technology 11.4% 5.7% 10.6% 16.1% Oil & Gas -9.7% -1333.5% -24.0% -571.3% Financial Services 19.2% 76.1% 16.9% 63.5% Utilities 9.4% 29.9% 14.9% 46.0% Travel & Leisure 53.4% 82.7% 10.8% 63.0% Industrial Goods & Services 12.2% -1.7% 11.8% 3.3% Personal & Household Goods 13.0% -6.5% 14.6% 13.4% Chemicals 6.6% -5.3% 9.2% 1.1% Banks 26.9% 30.0% 23.8% 22.7% Automobiles & Parts 10.0% -48.3% 8.6% -35.5% Basic Resources 32.9% -28.1% 30.6% 8.5% Food & Beverage -1.9% -12.3% -1.4% 0.2% Media 5.6% -3.0% 7.2% 4.2% Construction & Materials 5.2% 7.8% 6.0% 5.2% Health Care 12.1% 21.9% 12.8% 16.6%
Source: Fiin Pro, RongViet Research *Excluding CII, STG (high abnormal financial income) HAG, HNG (result influenced by retroactive effect) and OGC
Until August 1st, 612 companies listed on HSX and HNX exchanges have announced their Q2 business results. While the results of some sectors are influenced by a single stock like BVH (Insurance), PVD (Oil & Gas), VJC (Travel & Leisure), stocks in other sectors have displayed a clear trend.
Sectors enjoying good growth include utilities, financial services, real estate and banking sectors. GAS, PPC, and hydropower stocks (CHP, TMP, and SHP) have joined the group of companies with strong growth in Q2 as well as H1 2017. As we have mentioned several times, weather and hydrology conditions, coupled with favorable supply-and-demand situation have supported the hydropower stocks strongly.
Sectors with poor growth: Automobile & Parts and Basic Resources. The fact that tax on imported cars from ASEAN countries will fall to 0% in early 2018 has triggered a discount race among car distributors. This causes a phenomenon in which people are waiting for the car price to drop even lower, and in turn leads to lower demand of consumers and weak performance of the Automobile & Parts stocks. Meanwhile, despite the increase in revenue, raw material price hike has affected the gross margin of steel companies, hampering the profit of these companies.
Figure 16: NPAT Growth of Automobile & Parts Stocks in Q2 Figure 17: NPAT Growth of Basic Resources Stocks in Q2
Source: Fiin Pro, RongViet Research
Overall, in the H1 2017, the NPAT growth of enterprises on the VNIndex reached 14.4%. Meanwhile, the 21.6% NPAT growth of enterprises on the HNXIndex is mainly contributed by a
-200% -150% -100% -50% 0% 50%
CMCSVCTCHSRCHHSTMTVKCDRCCSMHTL
HAX
-80% -60% -40% -20% 0% 20% 40% 60%
HPG
HSG
NKG
KSB
TLH
POM
SMC

Rong Viet Securities Corporation – Investment Strategy Report August 2017 11
few stocks only (ACB, VCS, SHB, CHP, VGC, PVI and SHS). Accordingly, this profit growth seemed to be a bit outpaced by the growth of the VNIndex (17.9%) and the HNXIndex (26.3%).
Figure 18: Revenue and NPAT Growth of Sectors in H1 2017
Foreign Investors Trading: Net Buyers for Seven Consecutive Months
Figure 19: Net trading value of foreign investors
Source: RongViet Research
Foreign investors have been net buyers for seven consecutive months on the HSX but net sellers on the HNX. In July, foreigners were net buyers of VND2,808 billion on the HSX, including VND1,300 billion in put-through transactions. Tokyo GAS Asia has bought 22.4 million shares of PGD at VND56,600 per share. The strong acquisition of PGD to raise ownership to 24.9% demonstrates the partnership between Tokyo Gas and PV GAS. Tokyo Gas will assist PGD in terms of technical areas such as energy-saving technology. On one hand, this net purchase is not necessarily representative of the positive sentiment of foreign investors. Nevertheless, if such transaction is excluded, foreign investors’ net accumulation value in July on the HSX remains very significant. Financial services (+VND791 billion) led the net bought list with VCI overwhelming the net buying value of over VND717 billion. Food and beverage continued to appear in the sector with strong net buying with VNM and SAB - both are now familiar stocks.
In contrast, foreigners net sold more than VND264 billion on the HNX, in which oil and gas and banking groups came out to be the two strongest sellers. Poor business results coupled with sensitive information when Spain's Repsol officially confirmed the drilling of oil exploration at
20.4%
32.8%
23.7%
17.9%
26.3%
19.2%
3.2%
7.8%
14.4%12.2%13.1% 13.5%
-1.0%
14.4%
21.6%
VN-30 VN-MID VN-SML HOSE HNX
Performance YTD Revenue Growth NPAT Growth
0
2000
4000
6000
8000
10000
12000
14000
-600-400-200
0200400600800
1000120014001600
03/01 21/03 02/06
Net bought/sold Accumulated Value

Rong Viet Securities Corporation – Investment Strategy Report August 2017 12
block 136/3 in the last week of July. PVS was net sold nearly VND117 billion by foreigners. For banking group, SHB was the strongest net seller. Although (1) it has a low PBR (~ 0.7x) along with (2) good performance, foreign net sellers have shown that they have a certain degree of caution on SHB due to not being able to fully assess their bad debts related to Vinalines and Habubank.
In general, foreign cash flow into the market is still plentiful. In the first seven months, the net accumulative value was over VND11,609 billion. Of the 142 trading sessions, foreign net sellers were 32 on the HSX and 62 on the HNX. The average net buying value of this session was VND82 billion per session. Despite such positive trading, the average level of intraday participation was only around 11% in daily trading volume, mostly made up of domestic investors.
Rong Viet Securities Corporation – Investment Strategy Report August 2017 13
AUGUST STOCK MARKET OUTLOOKS
Investor sentiment seems "stable" even though the market in the first days of the month received a lot of information of the type that had created many "dark" sessions in the past. In addition, the rise of stocks that have a large impact on the basket of indexes such as SAB, VNM, VCB, BID, or ROS are supporting the VNIndex. We believe that VNIndex can easily reach 800 points in August.
Despite of that, after considering other factors, we think the index could not go further from this point in the short term. VNIndex has increased 17.9% YTD, lifting the overall P/E of the market to 16.3 by the end of July from 15.5 at the end of 2016. Our earlier assumption that market’s P/E will be mean-reversed has not occurred yet, thanks to the abundance of cash inflows. It looks like the rally of VNIndex, however, has fully reflected the listed companies’ business prospects as well as supported information. The 6M 2017 NPAT of 611 out of 733 listed companies in the HSX and HNX increased 14.4% YoY, but most of them just fulfilled a little bit more than 50% of their business plans in 2017. Besides, around 50% of corporations under RongViet Research coverage reported their business results just in line with our forecast, while more than 30% of coverage stocks showed disappointing business results. Moreover, after the positive rally since the beginning of the year, the recommendation on many stocks under our coverage has changed to “Neutral” rating. In other words, it is not easy to select stocks that are attractive at the moment. Typically, in such conditions, investors would be psychologically waiting for the business picture of macro and firms to be more open and clearer.
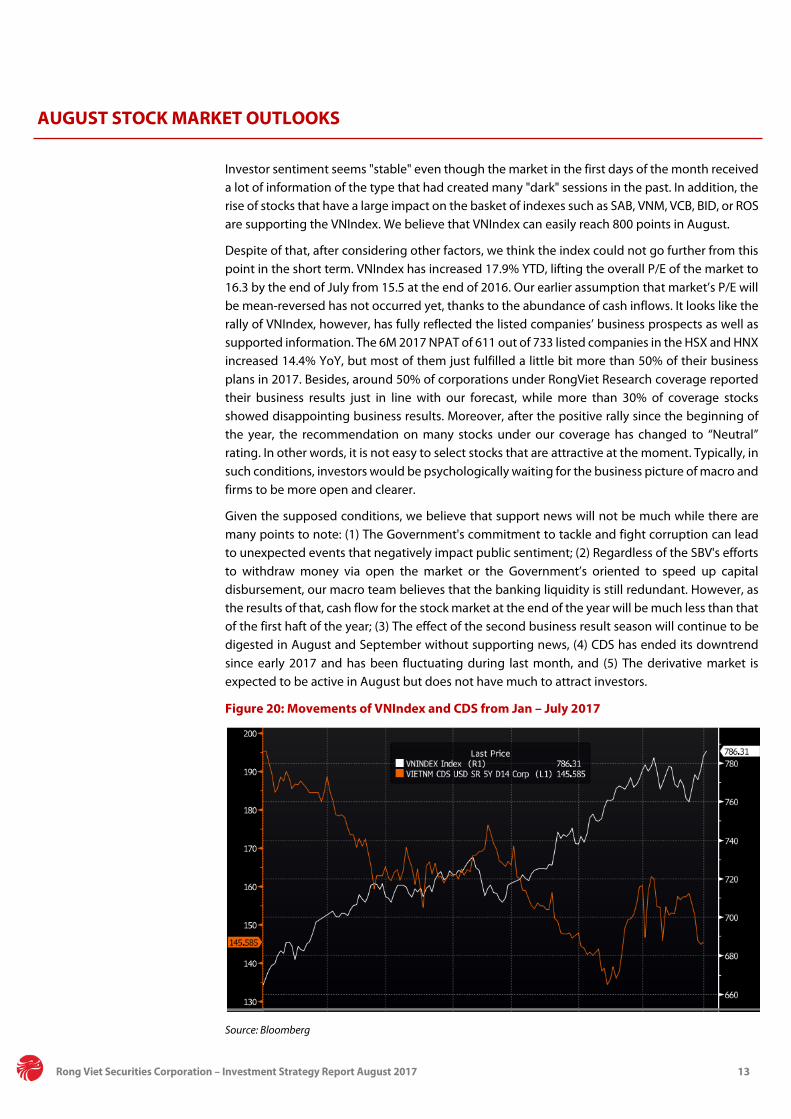
Given the supposed conditions, we believe that support news will not be much while there are many points to note: (1) The Government's commitment to tackle and fight corruption can lead to unexpected events that negatively impact public sentiment; (2) Regardless of the SBV's efforts to withdraw money via open the market or the Government’s oriented to speed up capital disbursement, our macro team believes that the banking liquidity is still redundant. However, as the results of that, cash flow for the stock market at the end of the year will be much less than that of the first haft of the year; (3) The effect of the second business result season will continue to be digested in August and September without supporting news, (4) CDS has ended its downtrend since early 2017 and has been fluctuating during last month, and (5) The derivative market is expected to be active in August but does not have much to attract investors.
Figure 20: Movements of VNIndex and CDS from Jan – July 2017
Source: Bloomberg

Rong Viet Securities Corporation – Investment Strategy Report August 2017 14
Figure 21: Movement of PE VNIndex from 2009 – current
Source: Bloomberg
Therefore, although we believe that the indices may increase in the first weeks of August, the profit-taking activities may overwhelm the buying which has turned into cautious at current historical-high of VNIndex. We believe the VNIndex will strongly fluctuate between 770 to 800 points, and may decrease to lower than this level in late August.
Table 2: Key sectors performance
No Name % 1M Price Change % 1Y Price Change Market Cap (VND Billion)
ROA (%) ROE (%)
Basic P/E P/B
1 Retail -2,5 118,2 35.820 12,9 39,8 15,7 5,9 2 Insurance -0,3 10,7 60.022 2,6 10,6 21,8 2,4 3 Real Estate 2,0 21,6 245.965 3,0 7,0 24,9 3,1 4 Technology 4,9 43,8 33.505 18,1 16,2 13,5 2,4 5 Oil & Gas -3,4 15,2 87.021 5,6 16,3 14,8 3,2 6 Financial Services -1,0 40,0 47.498 4,3 14,2 13,5 1,9 7 Utilities 5,9 30,6 170.638 11,0 18,8 14,3 2,7 8 Travel & Leisure 0,1 3,8 50.726 3,3 60,7 13,9 6,7 9 Industrial Goods & Services -2,3 23,6 80.210 7,7 16,1 12,2 1,8
10 Personal & Household Goods -2,6 29,0 31.582 10,8 25,8 14,8 3,5 11 Chemicals 5,4 20,3 46.548 7,5 13,1 11,1 1,4 12 Banks 1,4 22,6 406.730 0,9 12,6 15,7 1,9 13 Automobiles & Parts -11,4 -10,0 16.263 6,1 12,2 13,1 1,5 14 Basic Resources -4,9 45,9 101.392 10,6 11,5 6,6 1,8 15 Food & Beverage 3,9 48,4 527.361 9,1 31,5 23,3 6,4 16 Media 0,2 26,7 11.126 6,5 4,0 16,8 1,9 17 Construction & Material 2,0 86,5 180.901 6,7 20,0 16,5 3,8 18 Health Care -2,3 95,8 35.519 9,4 21,3 19,1 4,2
5
7
9
11
13
15
17
19
21
23
25
1/1/2009
5/1/2009
9/1/2009
1/1/2010
5/1/2010
9/1/2010
1/1/2011
5/1/2011
9/1/2011
1/1/2012
5/1/2012
9/1/2012
1/1/2013
5/1/2013
9/1/2013
1/1/2014
5/1/2014
9/1/2014
1/1/2015
5/1/2015
9/1/2015
1/1/2016
5/1/2016
9/1/2016
1/1/2017
5/1/2017
PE - VNIndex PE Average

Rong Viet Securities Corporation – Investment Strategy Report August 2017 15
INVESTMENT STRATEGY
Foreign investors kept net buying the VN30 basket was supportive to the market sentiment during the strongly fluctuating period of the market in July. As a result, VNIndex recovered quickly just after declining to under 760 points. The selling pressure became more intense during the market’s rising sessions, which implies that despite the insignificant amount of withdrawals from the market, there was very little preference for aggressive buying strategy when VNIndex surpassed 780 points.
Most H1 2017 business results have been similar to the market expectation as well as RongViet Research’s forecasts (for stocks of our conviction list). Macroeconomic indices were considered stable but the growth potential appears to be weaker than the policy makers’ targets. The 6.7% GDP growth rate target for 2017 was considered unfeasible. Therefore, taking into account the abundant cash flows into the stock market in the first half of the year, the expectations on the whole-year profit growth have mostly been reflected in the increase since the beginning of the year.
The effects of the H1 2017’s business result announcements can still be displayed during the first three weeks of August. Thus, investors may still seek short term opportunities from stocks that have performed well but the effects on stock prices have not been fully reflected. However, such investors should also follow strictly the loss-cutting rule and restrain from aggressive buying, especially during the market’s strong rises. We believe that patient investors will have best buying opportunities for long-term targets.
In July 2017, we also released five company analysis reports, including HTI, BFC, DRC, DQC, NKG, HSG, HPG, CHP, SHP, and CTD. Investors who are interested in these stocks can find the full report on our website at Company reports.
Tickers Target price (VND)
Overall Opinions
HTI 26,200 IDICO IDI (HTI–HSX) specializes in building bridge and road infrastructure. The firm is the investor of BOT An Suong – An Lac road in the Northwest of HCMC. This is the vital transport route for cargo from Southeastern and Central region to Mekong Delta region. Fast growing industrial activities and rising vehicle ownership would support traffic growth passing by HTI’s tollbooth project. The MOT forecasted traffic from HCMC to Long An to record annualized growth of 3.5% from 2011 to 2020 and 5.1% from 2021 to 2030. To strengthen its breadwinner project, HTI is investing flyovers at An Suong-An Lac’s major junctions to speed up traffic pace and create long-term competitiveness against the newly built Ho Chi Minh-Long Thanh-Dau Giay and Ben Luc-Long Thanh expressways. Mid-term catalyst comes from the upward revision of toll to finance Go May flyover in 2020. Having yet to raise equity in 10 years, HTI shows cautious leadership style focusing on stable business growth. Strong toll cash flow enables itself to mobilize funding for new investments without having to raise new equity. Therefore, shareholder interest is protected by stable bottom-line growth and little dilution concern.
Forecasted EPS for 2017 and 2018 are VND2,649 and VND2,494, respectively.
BFC 41,000 The rainy season starting earlier this year led to a stronger fertilization consumprion in Q1when compared with the same period, indicating that the strong growth in Q1 just reflects the fact that demand came earlier. Considering Q1 is the off-season for fertilizer consumption, while Q2 is the peak season, we stand by our view that Q2 2017 results will not record strong YoY growth as in Q1 2017. Considering the above update (compared with our 2017 Strategy Report), we stay NEUTRAL on the stock in the short term. We recommend investors should hold the stock because we expect better results in Q3. According to our check, input prices are on pace to return to lower levels. We will consider raising our target price when we have more evidence.
Forecasted EPS for 2017 and 2018 are VND5,215 and VND6,118, respectively.
DRC 33,100 Da Nang Rubber JSC (DRC – HSX) is a leading domestic manufacturer in the tire and tube industry in Vietnam. In recent years, the company's new product - the Radial tire is still in the process of market penetration so that the result has not been as expected. In the short term, we think DRC is still experiencing the difficulty of the industry including the volatility of raw material prices, especially the radial tire sector with additional accelerated depreciation resulting to negative profit margins. However, considering better sales results and rubber price expected to be stable in the low price range, we believe that DRC's business performance will prosper quickly in the following quarters of 2017. Notably, based on the domestic and foreign consumption in the first six months as well as the existing orders, we estimate the output of radial tires will reach 100% of the first phase designed capacity (equivalent to 300,000 tires), and this segment will return positive margins. In addition, we find that DRC usually pays high and regular annual dividends of VND2,000-VND3,000

Rong Viet Securities Corporation – Investment Strategy Report August 2017 16
per share, similar to many companies of Vietnam National Chemical Group (Vinachem). Vinachem has already planned for an IPO this year, but it is not yet known whether the Group will divest from DRC. We assess that a divestment will be unlikely in the near future. As a result, DRC cash dividend rate is likely to remain and can be lifted after the radial project has a steady return.
Forecasted EPS for 2017 and 2018 are VND2,599 and VND3,144, respectively.
DQC 49,400 2017 onwards, the Cuba receivables and export markets will no longer contribute to DQC’s earnings. This negative effect, however, will be partially offset, thanks to the booming of LED technology in Vietnam. Having products with reliable quality and a 44-year-old national brand, DQC should be able to utilize this trend and enjoy strong growth in LED business in the coming years, despite fierce competition from small enterprises and imported products from China. Due to the two reasons mentioned above, it would take a long time for DQC’s earnings to climb back to the level of 2013-2016 period. This, combined with the negative effects from the investigation on DQC’s former chairwoman, has caused DQC’s price to plummet over 40% from its peak in July 2016. Yet, the stock is still trading at an all-time high P/E forward of 15.6x, yielding a chance to decrease further. However, we think P/E valuation does not fully reflect potential earnings when LED lighting will become more and more common in the future. Accordingly, we choose DCF method instead and estimate DQC’s fair value at VND49,400/share, assuming the 2016-2021 CAGR of DQC’s LED revenue will be 36%. If DQC price falls to an attractive level, investors still need to choose appropriate time to buy, as we have not seen any short-term catalyst for the stock price.
Forecasted EPS for 2017 and 2018 are VND3,001 and VND3,501, respectively.
NKG 39,800 NKG has been delivering radical changes in its internal business performance, regarding production, sales and financial strength. Moreover, the company has been taking advantage of countervailing measures against Chinese steel in both Vietnam and other export markets. As the construction of the new plant is concluding, NKG’s efficiency and profitability has been advancing to a new level, and the company has been making rapid improvements in its financial strength by successful private placements. Firmly maintaining the second highest rank in terms of capacity among local names, NKG’s remarkable profit growth is offering the market an attractive valuation as the lowest P/E ticker among leading producers in the steel industry.
Forecasted EPS for 2017 and 2018 are VND7,497 and VND10,667, respectively.
HSG 36,300 As all the duties on coated steel imports are in favor of HSG, the company can take advantage of the ability to control negative effects of the unfavorable HRC price movement to stabilizing their profitability. However, we expect HSG to see a moderate decrease in their gross margin, thus a slightly lower quarterly bottom line YoY. More importantly, Ca Na project being called off can be a positive sign, as HSG can stay focused on its core business, which is still highly profitable.
Forecasted EPS for 2017 and 2018 are VND4,756 and VND5,102, respectively.
HPG 40,000 While a strong capacity growth is not the spotlight for HPG in 2017, Hai Duong Steel complex will continue to be state-of-the-art in the domestic market and bring about a remarkable stability for the company’s attractive gross margin. We maintain our positive point of view on the superior profitability of Hoa Phat’s steel business, which is going to keep 2017 EPS stable in spite of the 20% dilution caused by the right issuance. In a longer term, we expect that HPG’s growth will be boosted by the operation of Dung Quat, a steel complex that will triple HPG’s capacity.
Forecasted EPS for 2017 and 2018 are VND4,898 and VND4,836, respectively.
CHP 31,900 We highly appreciate the business of CHP for its (1) ability to maintain stable results even in adverse hydrological conditions, thanks to the special location A Luoi plant and (2) strong growth prospect in the long-term with production capacity expansion. Compared to our most recent recommendation on CHP in the Strategic Report published on 15 March 2017, CHP’s business results in the first half of this year is beyond our expectations. Moreover, the newly announced solar power project also helps to enhance the long-term prospect of the company.
Forecasted EPS for 2017 and 2018 are VND3,008 and VND2,421, respectively.
SHP 25,400 At the closing price on 10 July 2017, SHP is trading at trailing 12M P/E of 15.6x, which is not attractive for a hydropower company being in a year of favorable weather. However, due to its potential capacity expansion in the intermediate-term and extraordinary profit growth in 2017, we expect P/E of SHP to stay at 12x in 2017. Compared to our most recent recommendation on SHP in the Strategic Report published on 15 March 2017, the business results of the company in the first half was better than our expectations and the outlook of hydrological conditions in the second half is better as well. Moreover, the long-term prospect of the company is much brighter, thanks to the new solar project. In the longer term, we still maintain our positive view on the company and believe that SHP stock would have considerable profitability at low risk. Therefore, investor can consider holding SHP in the long term.
Forecasted EPS for 2017 and 2018 are VND2,081 and VND1,830, respectively.
CTD 251,200 CTD is an outstanding construction contractor in the domestic market and the company has proven the power to win the largest bids as well as the internal resources to satisfy clients’ demand in terms of design capacity and progress. Despite the market concerns over the peaking housing sector, we anticipate a sustainable growth in other segments of the real estate market including industrial, commercial and infrastructure, which will manage to keep the construction demand growth. Subsequently, as the leading firm, CTD is able to develop new growth drivers as well as to skim the most profitable jobs in the market. The company is going to adapt to a new revenue structure, which allows them to diversify their portfolio and maintain a decent growth rates over the next three-year period.
Forecasted EPS for 2017 and 2018 are VND20,564 and VND25,196, respectively.

Rong Viet Securities Corporation – Investment Strategy Report August 2017 17
Figure 22: RongViet Research’s stock pick
Source: RongViet Research; Price @ Aug 3rd, 2017

Rong Viet Securities Corporation – Investment Strategy Report August 2017 18
Ticker Exchange Target
price (VND)
Price @ Aug 3rd
(VND)
Total Return (*) Rating (**)
2016 2017F 2018F PER
Trailing (x)
PER 2017F
(x)
PBR Cur. (x)
Div Yield (%)
+/- Price
1y (%)
3-month avg. daily
vol. (shares)
3-month avg. daily
turnover (USD
thousand)
Market cap (USD mn)
Foreign remaining
room (%)
+/- Rev. (%)
+/- NPAT
(%)
+/- Rev. (%)
+/- NPAT
(%)
+/- Rev. (%)
+/- NPAT
(%) STK HSX 24,200 15,700 57.3% Buy 31.2 -59.9 38.6 272.4 7.8 33.3 22.5 7.9 1.1 3.2 -22.3 5,229 4 41 37.3
BMP HSX 113,800 78,000 48.5% Buy 18.5 20.9 11.2 7.9 13.1 10.0 12.6 10.5 2.7 2.6 -1.8 178,065 951 281 3.4
HTI HSX 26,200 19,400 41.2% Buy 33.1 8.7 -16.5 20.8 90.8 -5.8 6.3 7.3 1.2 6.2 22.3 43,623 38 21 34.3
DRC HSX 33,100 25,800 39.9% Buy 1.3 -4.8 7.8 -15.0 1.9 20.8 10.2 9.9 2.0 11.6 -25.9 561,218 755 135 19.3
PVS HNX 21,900 16,700 38.3% Buy -20.0 -31.5 -0.8 -17.6 17.1 39.6 8.6 8.8 0.7 7.2 0.4 1,626,593 1,201 329 25.9
NKG HSX 39,800 30,750 32.7% Buy 55.4 310.7 62.0 29.0 14.6 10.4 5.1 4.1 1.6 3.3 83.8 556,152 837 135 18.6
ACV UPCOM 67,000 51,900 32.0% Buy 11.2 -70.1 16.2 -20.1 17.1 26.3 23.4 23.6 4.4 2.9 0.0 217,275 484 4,982 45.5
NTC UPCOM 73,800 58,500 30.4% Buy 17.8 121.4 21.6 -17.7 14.0 12.0 5.5 9.9 2.9 4.3 0.0 48,406 113 41 49.0
HSG HSX 34,200 27,300 28.9% Buy 16.5 145.3 29.9 18.5 21.4 7.3 6.0 5.8 1.9 3.7 25.4 3,323,912 4,896 421 21.1
DQC HSX 49,400 41,100 27.5% Buy -4.4 -1.7 -1.3 -43.7 16.6 16.7 8.3 13.7 1.3 7.3 -46.3 80,499 167 58 25.7
NNC HSX 67,570 57,700 25.8% Buy 14.9 49.8 23.5 25.7 8.1 3.4 6.8 7.4 2.1 8.7 -1.8 26,559 89 56 27.4
PGI HSX 24,900 20,100 23.9% Buy 0.0 5.2 10.3 55.5 13.2 -13.5 11.7 9.0 1.6 0.0 3.5 48,826 47 63 47.8
HPG HSX 40,000 32,300 23.8% Buy 21.2 89.4 20.8 9.3 26.6 9.4 5.9 6.6 1.8 0.0 42.1 4,434,086 6,092 2,158 9.6
VFG HSX 69,800 58,300 23.2% Buy 13.4 5.2 9.9 16.2 6.1 7.6 10.8 9.1 1.8 3.4 6.3 14,123 37 61 27.9
VIT HNX 33,900 29,600 23.0% Buy 41.6 53.5 17.8 18.2 33.4 25.7 7.2 6.9 1.8 8.4 14.7 31,466 40 20 47.7
CTD HSX 251,200 208,800 21.7% Buy 52.0 113.5 30.4 25.8 24.7 24.0 9.8 10.2 2.5 1.4 31.3 107,478 983 708 14.0
KLB UPCOM 12,000 10,000 20.0% Buy 9.0 26.8 24.8 67.7 22.0 30.5 6.3 14.6 0.9 0.0 0.0 137,082 63 130 11.0
NT2 HSX 31,900 28,300 18.0% Neutral 18.6 -4.9 -13.2 -10.6 4.5 0.3 9.6 8.8 1.7 5.3 -8.7 499,849 637 359 28.1
TNG HNX 14,100 12,000 17.5% Neutral -1.9 13.9 17.0 16.5 10.5 11.1 5.9 6.0 0.7 0.0 -1.0 234,672 143 22 26.8
CHP HSX 31,900 27,250 17.1% Neutral -10.9 -21.5 28.6 54.2 -14.2 -19.0 7.6 9.1 2.1 0.0 0.0 110,032 124 151 45.4
DPM HSX 25,000 23,200 16.4% Neutral -18.8 -23.3 16.4 4.9 20.5 -3.8 11.4 8.9 1.1 8.6 -9.7 1,063,883 1,089 400 28.3
VNR HNX 27,300 23,600 15.7% Neutral -2.8 -1.2 18.2 9.6 4.3 6.8 12.1 11.8 1.1 0.0 29.8 8,586 9 136 19.3
HT1 HSX 21,200 18,400 15.2% Neutral 8.3 9.5 6.6 13.7 5.2 6.7 10.5 8.9 1.3 0.0 -22.3 692,915 662 309 42.2
PGS HNX 20,900 19,100 14.7% Neutral -16.5 206.7 36.4 -63.7 6.8 6.5 9.2 7.8 1.0 5.2 35.5 163,542 133 42 34.5
VCB HSX 41,900 38,300 13.6% Neutral 17.3 28.6 8.0 18.2 19.8 31.6 18.1 21.3 2.7 4.2 4.5 1,522,170 2,534 6,070 9.1
SHP HSX 25,400 24,000 12.1% Neutral -13.7 -40.4 23.8 94.6 -3.8 -7.3 13.0 11.8 2.1 6.3 27.7 19,613 19 99 45.1
PNJ HSX 114,000 105,200 9.3% Neutral 11.1 496.3 33.1 63.3 21.8 28.6 17.8 15.5 6.0 1.0 69.6 434,886 1,878 455 -
HIGHLIGHT STOCKS

Rong Viet Securities Corporation – Investment Strategy Report August 2017 19
Ticker Exchange Target
price (VND)
Price @ Aug 3rd
(VND)
Total Return (*)
Rating (**)
2016 2017F 2018F PER
Trailing (x)
PER 2017F
(x)
PBR Cur. (x)
Div Yield (%)
+/- Price
1y (%)
3-month avg. daily
vol. (shares)
3-month avg. daily
turnover (USD
thousand)
Market cap (USD mn)
Foreign remaining
room (%)
+/- Rev. (%)
+/- NPAT
(%)
+/- Rev. (%)
+/- NPAT
(%)
+/- Rev. (%)
+/- NPAT
(%) CTG HSX 21,200 20,150 8.7% Neutral 16.3 20.0 8.3 17.4 9.2 17.3 10.3 11.8 1.2 3.5 22.8 1,954,835 1,681 3,305 0.2
FPT HSX 53,200 50,100 8.2% Neutral 4.1 3.1 21.7 21.0 13.2 46.7 12.9 8.7 2.7 2.0 48.7 1,310,012 2,729 1,172 -
CTI HSX 31,500 31,600 7.0% Neutral 23.8 58.4 22.3 12.4 12.8 22.3 11.1 17.3 1.7 7.3 24.4 560,554 742 88 15.6
SVC HSX 54,500 53,100 4.9% Neutral 38.0 18.4 8.2 20.4 -5.0 4.5 11.2 5.1 1.5 2.3 40.5 56,909 134 58 6.0
BFC HSX 41,000 43,000 3.5% Neutral -1.6 21.0 14.1 16.9 8.9 7.9 7.8 8.2 2.5 8.1 62.6 292,692 515 108 28.7
PC1 HSX 37,000 36,100 2.5% Neutral -3.0 24.1 13.6 5.8 46.1 76.2 15.6 12.2 1.7 0.0 0.0 122,014 199 156 19.1
VNM HSX 149,800 154,000 -0.8% Neutral 16.8 20.3 19.9 12.0 13.4 10.9 21.8 23.7 9.1 1.9 24.5 816,122 5,429 9,846 44.8
PTB HSX 128,800 131,500 -1.3% Neutral 20.2 52.8 25.6 25.6 16.1 9.8 11.5 9.5 4.0 0.8 61.7 71,136 381 150 35.1
REE HSX 35,500 38,200 -2.9% Neutral 38.4 28.2 23.1 10.1 0.0 11.4 7.7 10.1 1.6 4.2 107.2 1,605,974 2,408 522 -
VJC HSX 121,000 125,000 -3.2% Neutral 38.6 113.3 41.5 42.5 22.0 25.2 15.0 12.9 7.9 0.0 0.0 353,760 1,977 1,775 5.9
ACB HNX 24,500 26,000 -5.8% Neutral 21.6 28.9 12.8 24.1 27.8 45.8 15.6 17.4 1.8 0.0 65.3 2,199,655 2,462 1,129 -
PPC HSX 19,400 22,600 -6.2% Neutral -22.0 -2.2 13.9 61.6 1.7 -7.9 4.8 9.5 1.3 8.0 69.4 294,007 267 317 32.8
MBB HSX 21,000 23,500 -8.1% Neutral 12.4 16.7 16.5 16.7 7.4 18.4 12.0 13.0 1.5 2.6 72.7 3,094,122 2,788 1,773 -
PAC HSX 40,600 51,700 -17.6% Neutral 8.2 107.5 16.0 -27.0 11.4 20.4 16.2 19.3 3.5 3.9 67.9 182,051 382 106 17.4
TCM HSX 24,095 30,400 -19.1% Neutral 10.0 -25.6 6.2 55.6 1.9 7.4 8.6 9.9 1.5 1.6 77.5 916,583 1,207 69 0.1
DHG HSX 83,500 114,400 -24.4% Sell 4.9 20.6 12.4 10.0 9.7 9.2 19.6 14.6 5.3 2.6 102.1 279,416 1,524 659 0.3
MWG HSX 67,250 100,100 -32.8% Sell 76.7 47.2 63.2 41.4 35.9 16.5 16.8 8.3 6.6 0.0 62.8 339,464 1,696 1,357 (0.0)
SAB HSX 158,400 245,000 -33.9% Sell 12.6 31.3 11.2 4.2 12.9 4.2 35.3 35.8 11.5 1.4 0.0 108,768 967 6,921 39.1
(*) Total Return = Stocks’ Upside plus dividend yield

Rong Viet Securities Corporation – Investment Strategy Report August 2017 20
MACRO WATCH IN JULY
Low Inflation Continued Continuous Improving in Retail Sales
Source: GSO, RongViet Research Source: GSO, RongViet Research
PMI Declined to 51.7 in July Trade Growth Steadied
Source: GSO, RongViet Research Source: GSO, RongViet Research
Stable Foreign Capital Winning Volume Decreased in July
Source: FII, RongViet Research Source: VBMA, RongViet Research
260,000
280,000
300,000
320,000
340,000
0%
4%
8%
12%
07/2
016
08/2
016
09/2
016
10/2
016
11/2
016
12/2
016
01/2
017
02/2
017
03/2
017
04/2
017
05/2
017
06/2
017
07/2
017
Retail Sales (VND B) Growth (Ex inflation)
-2.0
.0
2.0
4.0
6.0
07/2
016
08/2
016
09/2
016
10/2
016
11/2
016
12/2
016
01/2
017
02/2
017
03/2
017
04/2
017
05/2
017
06/2
017
07/2
017
50
51
52
53
54
55
PMI IP (3m moving average)
-5%0%5%
10%15%20%25%30%35%
07/2
016
08/2
016
09/2
016
10/2
016
11/2
016
12/2
016
01/2
017
02/2
017
03/2
017
04/2
017
05/2
017
06/2
017
07/2
017
Export Import
0
1000
2000
3000
4000
5000
6000
7000
07/2
016
08/2
016
09/2
016
10/2
016
11/2
016
12/2
016
01/2
017
02/2
017
03/2
017
04/2
017
05/2
017
06/2
017
07/2
017
Implemented capital Registered capital
0%
20%
40%
60%
80%
100%
05000
10000150002000025000300003500040000
07/2
016
08/2
016
09/2
016
10/2
016
11/2
016
12/2
016
01/2
017
02/2
017
03/2
017
04/2
007
05/2
007
06/2
017
07/2
017
Winning volumeOffering volumeWinning/Offering Ratio
0.0%
0.1%
0.2%
0.3%
0.4%
0.5%
0.6%
07/2
016
08/2
016
09/2
016
10/2
016
11/2
016
12/2
016
01/2
017
02/2
017
03/2
017
04/2
017
05/2
017
06/2
017
07/2
017
Headline inflation Core inflation

Rong Viet Securities Corporation – Investment Strategy Report August 2017 21
INDUSTRY INDEX
Level 1 industry movement Level 2 industry movement
Source: RongViet Research Source: RongViet Research
Industry PE comparison Industry PB comparison
Source: RongViet Research Source: RongViet Research
3%
0%
-4%
-1%
-2%
2%1% 0%
2%
7%
-6%
-4%
-2%
0%
2%
4%
6%
8%
Tech
nolo
gy
Indu
stria
ls
Oil
& G
as
Cons
umer
Ser
vice
s
Hea
lth C
are
Cons
umer
Goo
ds
Bank
s
Basi
c M
ater
ials
Fina
ncia
ls
Util
ities
-2%2%
1%3%
-4%4%
7%-1%
-2%-2%
3%1%
-8%-1%
2%-1%
2%-2%
-10% -5% 0% 5% 10%
RetailInsurance
Real EstateTechnology
Oil & GasFinancial Services
UtilitiesTravel & Leisure
Industrial Goods & ServicesPersonal & Household Goods
ChemicalsBanks
Automobiles & PartsBasic Resources
Food & BeverageMedia
Construction & MaterialsHealth Care
13.114.0
14.9 15.5
19.518.7
15.1
8.0
20.2
13.9
17.2
12.3
Tech
nolo
gy
Indu
stria
ls
Oil
& G
as
Cons
umer
…
Hea
lth C
are
Cons
umer
…
Bank
s
Basi
c…
Fina
ncia
ls
Util
ities
HSX
HN
X
2.3
3.13.4
2.9
4.4
5.7
1.81.6
2.8 2.7
3.8
1.7
Tech
nolo
gy
Indu
stria
ls
Oil
& G
as
Cons
umer
…
Hea
lth C
are
Cons
umer
…
Bank
s
Basi
c M
ater
ials
Fina
ncia
ls
Util
ities
HSX
HN
X

Rong Viet Securities Corporation – Investment Strategy Report August 2017 22
Table 3: Net buying/selling value of foreign investors classifying by sectors in June
HSX HNX Net volume (mn
shares) Net value (bn VND) Net volume (mn
shares) Net value (bn VND)
Oil & gas -2.4 16 -11.2 -178 Chemicals 7.4 146 0.2 4 Basic resource 2.4 82 1.2 4 Construction & building materials -2.4 84 1.0 32 Industrial goods & services 4.4 71 0.3 8 Automobiles & parts 2.2 39 -0.7 -6 Food & beverage 8.5 328 0.6 14 Personal and household goods -0.9 -24 -0.3 -4 Healthcare -0.3 -10 0.1 -1 Retail 0.3 -1 0.0 0 Communication 0.0 0 0.3 3 Travel & leisure -0.1 -17 0.3 6 Utilities 22.5 1,355 0.1 2 Banks 3.9 134 -20.3 -186 Insurance -0.3 -25 0.1 2 Real estate -12.2 -165 0.9 13 Financial services 29.7 791 1.7 26 Technology 0.0 3 -0.2 0 Total 62.9 2,808 -25.9 -264

Rong Viet Securities Corporation – Investment Strategy Report August 2017 23
ANALYSIS & INVESTMENT ADVISORY DEPARTMENT
Truc Doan Head of Research [email protected]
+ 84 28 62992006 (1308)
Ha My Tran Deputy Manager [email protected] + 84 28 62992006 (1309) • Macroeconomics
Lam Nguyen Senior Strategist [email protected] + 84 28 6299 2006 (1313) • Banking • Conglomerates
Thien Bui Senior Analyst [email protected] + 84 28 6299 2006 (1321) • Market Strategy • Financial Services • Personal Goods
Hoang Nguyen Senior Analyst [email protected] + 84 28 6299 2006 (1319) • Transportation • Industrial Real Estates
Hieu Nguyen Senior Analyst [email protected] + 84 28 6299 2006 (1514) • Market Strategy • Pharmaceuticals • Durable Household Goods
Duong Lai Senior Analyst [email protected] + 84 28 6299 2006 (1522) • Real Estates • Building Materials
Vu Tran Senior Analyst [email protected] + 84 28 6299 2006 (1518) • Oil & Gas • Food & Beverage
Ha Trinh Analyst [email protected] + 84 28 6299 2006 (1331) • Steel • Construction • Technology
Quang Vo Analyst [email protected] + 84 28 6299 2006 (1517) • Market Strategy • Basic Materials • Personal Goods
Son Phan Analyst [email protected] + 84 28 6299 2006 (1519) • Utilities • Natural Rubber
Thu Le Analyst [email protected] + 84 28 6299 2006 (1521) • Automobiles and Parts
Ha Tran Assistant [email protected]
+ 84 28 6299 2006 (1526)
RONG VIET SECURITIES CORPORATION
Floor 1-2-3-4, Viet Dragon Tower,
141 Nguyen Du St. - Dist 1 – HCMC
Tel: (84 28) 6299 2006
Fax: (84 28) 6291 7986
Email: [email protected]
Website: www.vdsc.com.vn
Hanoi Branch
2C Thai Phien St., Hai Ba Trung Dist, Hanoi
Tel: (84 24) 6288 2006
Fax: (84 24) 6288 2008
Can Tho Branch
95-97-99 Vo Van Tan – Ninh Kieu - Can Tho
Tel: (84 292) 381 7578
Fax: (84 292) 381 8387
Nha Trang Branch
50Bis Yersin St, Nha Trang
Tel: (84 258) 382 0006
Fax: (84 258) 382 0008

Rong Viet Securities Corporation – Investment Strategy Report August 2017 24
DISCLAIMERS
This report is prepared in order to provide information and analysis to clients of Rong Viet Securities only. It is and should not be construed as an offer to sell or a solicitation of an offer to purchase any securities. No consideration has been given to the investment objectives, financial situation or particular needs of any specific. The readers should be aware that Rong Viet Securities may have a conflict of interest that can compromise the objectivity this research. This research is to be viewed by investors only as a source of reference when making investments. Investors are to take full responsibility of their own decisions. VDSC shall not be liable for any loss, damages, cost or expense incurring or arising from the use or reliance, either full or partial, of the information in this publication.
The opinions expressed in this research report reflect only the analyst's personal views of the subject securities or matters; and no part of the research analyst's compensation was, is, or will be, directly or indirectly, related to the specific recommendations or opinions expressed in the report.
The information herein is compiled by or arrived at Rong Viet Securities from sources believed to be reliable. We, however, do not guarantee its accuracy or completeness. Opinions, estimations and projections expressed in this report are deemed valid up to the date of publication of this report and can be subject to change without notice.
This research report is copyrighted by Rong Viet Securities. All rights reserved. Therefore, copy, reproduction, republish or redistribution by any person or party for any purpose is strictly prohibited without the written permission of VDSC.
IMPORTANT DISCLOSURES FOR U.S. PERSONS
This research report was prepared by Viet Dragon Securities Corp. (“VDSC”), a company authorized to engage in securities activities in Vietnam. VDSC is not a registered broker-dealer in the United States and, therefore, is not subject to U.S. rules regarding the preparation of research reports and the independence of research analysts. This research report is provided for distribution to “major U.S. institutional investors” in reliance on the exemption from registration provided by Rule 15a-6 of the U.S. Securities Exchange Act of 1934, as amended (the “Exchange Act”).
Any U.S. recipient of this research report wishing to effect any transaction to buy or sell securities or related financial instruments based on the information provided in this research report should do so only through Rosenblatt Securities Inc., 40 Wall Street 59th Floor, New York, NY 10005, a registered broker dealer in the United States. Under no circumstances should any recipient of this research report effect any transaction to buy or sell securities or related financial instruments through VDSC. Rosenblatt Securities Inc. accepts responsibility for the contents of this research report, subject to the terms set out below, to the extent that it is delivered to a U.S. person other than a major U.S. institutional investor.
The analyst whose name appears in this research report is not registered or qualified as a research analyst with the Financial Industry Regulatory Authority (“FINRA”) and may not be an associated person of Rosenblatt Securities Inc. and, therefore, may not be subject to applicable restrictions under FINRA Rules on communications with a subject company, public appearances and trading securities held by a research analyst account.
Ownership and Material Conflicts of Interest
Rosenblatt Securities Inc. or its affiliates does not ‘beneficially own,’ as determined in accordance with Section 13(d) of the Exchange Act, 1% or more of any of the equity securities mentioned in the report. Rosenblatt Securities Inc, its affiliates and/or their respective officers, directors or employees may have interests, or long or short positions, and may at any time make purchases or sales as a principal or agent of the securities referred to herein. Rosenblatt Securities Inc. is not aware of any material conflict of interest as of the date of this publication.
Compensation and Investment Banking Activities
Rosenblatt Securities Inc. or any affiliate has not managed or co-managed a public offering of securities for the subject company in the past 12 months, nor received compensation for investment banking services from the subject company in the past 12 months, neither does it or any affiliate expect to receive, or intends to seek compensation for investment banking services from the subject company in the next 3 months.
Additional Disclosures
This research report is for distribution only under such circumstances as may be permitted by applicable law. This research report has no regard to the specific investment objectives, financial situation or particular needs of any specific recipient, even if sent only to a single recipient. This research report is not guaranteed to be a complete statement or summary of any securities, markets, reports or developments referred to in this research report. Neither VDSC nor any of its directors, officers, employees or agents shall have any liability, however arising, for any error, inaccuracy or incompleteness of fact or opinion in this research report or lack of care in this research report’s preparation or publication, or any losses or damages which may arise from the use of this research report.
VDSC may rely on information barriers, such as “Chinese Walls” to control the flow of information within the areas, units, divisions, groups, or affiliates of VDSC.
Investing in any non-U.S. securities or related financial instruments (including ADRs) discussed in this research report may present certain risks. The securities of non-U.S. issuers may not be registered with, or be subject to the regulations of, the U.S. Securities and Exchange Commission. Information on such non-U.S. securities or related financial instruments may be limited. Foreign companies may not be subject to audit and reporting standards and regulatory requirements comparable to those in effect within the United States.
The value of any investment or income from any securities or related financial instruments discussed in this research report denominated in a currency other than U.S. dollars is subject to exchange rate fluctuations that may have a positive or adverse effect on the value of or income from such securities or related financial instruments.
Past performance is not necessarily a guide to future performance and no representation or warranty, express or implied, is made by VDSC with respect to future performance. Income from investments may fluctuate. The price or value of the investments to which this research report relates, either directly or indirectly, may fall or rise against the interest of investors. Any recommendation or opinion contained in this research report may become outdated as a consequence of changes in the environment in which the issuer of the securities under analysis operates, in addition to changes in the estimates and forecasts, assumptions and valuation methodology used herein.
No part of the content of this research report may be copied, forwarded or duplicated in any form or by any means without the prior.