Embed Size (px)
Citation preview

DIRECTORATE GENERAL ECONOMICS, STATISTICS AND RESEARCH
Session 3: Financial policies, financial systems and productivity
Discussion
Roberto Blanco
Head of the Financial Analysis Division
BIS-IMF-OECD Conference: Weak productivity: The role of financial factors and policies
Paris, 10-11 January 2018
The views expressed in this presentation are those of the author and do not necessarily coincide with those of the Banco de España or the Eurosystem.

DIRECTORATE GENERAL ECONOMICS, STATISTICS AND RESEARCH
Discussion outline
3 papers:
1) Debt Overhang, Rollover Risk, and Corporate Investment: Evidence from the European
Crisis (S. Kalemli-Özcan, L. Laeven and D. Moreno) [KLM]
2) Distressed Banks, Distorted Decisions? (G. Anderson, R. Riley and G. Young) [ARY]
3) Monetary Policy, Factor Allocation and Growth (R. Banerjee, E. Kharroubi and F.
Zampolli) [BKZ]
• KLM and ARY: Real effects of credit constraints.
• BKZ: Factor allocation and productivity.
• Both topics are very relevant. Banco de España is also doing research in these two areas.
• First, I will discuss papers 1 and 2, and then paper 3.
2

DIRECTORATE GENERAL ECONOMICS, STATISTICS AND RESEARCH
Real effects of credit constraints. What do papers do?
Topic of the papers: Both papers analyse real effects of the dependency of firms on weak
banks during the GFC.
Key identification assumption: Type of bank (weak vs strong) firms borrow from.
Real effects:
KLM focuses on the impact of credit constraints on investment.
ARY focuses on the impact of credit constraints on business failures (exit rates).
Sample of banks:
KLM: EMU banks.
ARY: British banks.
.
3

DIRECTORATE GENERAL ECONOMICS, STATISTICS AND RESEARCH
Real effects of credit constraints. Main findings
1) KLM:
• The decline in investment during the crisis was stronger for firms with high leverage, high debt
service, and for those having a relationship with a weak bank.
• The negative effect of leverage is more pronounced when firms are linked to weak banks.
2) ARY:
• During the crisis, the probability of exit (firm failure) increased for firms borrowing from weak
banks relative to that of firms borrowing from strong banks. However, the effect is very small
(only 0.6 pp).
• The effect is more significant for firms with high leverage.
• There is also some evidence that this effect is more significant for relatively more productive
firms. This is the most interesting result of the paper. However, this result does not seem to be
robust (it is only found for certain horizons and datasets).
4
DIRECTORATE GENERAL ECONOMICS, STATISTICS AND RESEARCH
Coefficients for2005-2007
Coefficients for2008-2013
Coefficients for2014-2015
Coefficients for05-08Q1
Coefficients for08Q2-13Q3
Coefficients for 13Q4-16Q2
Profitabilityit-1 __ 0.030*** -0.006__ ¡0.024***'_ Previous NPLs -0.021 0,003 -0,042***
Debt burdenit-1 _ '-0.009*** -0.012*** -0.009***_' Indebtedness -0,036*** -0,078*** -0,102***
Indebtednessit-1 _''-0.038*** -0.065*** -0.058***''' Debt burden 0,000 -0,002*** -0,003***
Sales growthit-1 __'0.041*** .0.032*** 0.032***'
No. of previous
relationships with banks
0,006*** 0,014*** 0,015***
Total factor
productivityit-1__-0.035*** . 0.010*** 0.041*** Total assets -0.001 0,009*** 0,005**
Age 0,004 0,018*** 0,003
Impact on the probability of a firm obtaining credit from any bank
Impact on the probability of positive net investment
Real effects of credit constraints. BE’sresearch
Some of these results are in line with the results of BE’ research [Herranz and Martínez-
Carrascal (2017), Blanco and Jiménez (forthcoming)]. We find that:
1) Indebtedness and debt burden are two key determinants for both investment decisions
and access to credit.
2) The sensitivity to these variables increased during the crisis.
5
Source: BE Annual Report, 2016, Chapter 2
Source: Blanco and Jiménez (forthcoming)

DIRECTORATE GENERAL ECONOMICS, STATISTICS AND RESEARCH
Real effects of credit constraints. Drivers of results
What seems to be driving these results are the two following hypotheses:
H1: During the crisis, weak banks tightened credit supply conditions relative to strong banks.
H2: The ability of firms to switch from weak banks to strong banks was limited due to
asymmetric information problems.
However, the authors do not analyse that.
Suggestions:
Test for H1 in the sample used in the papers.
Analyse the role of the degree of dependency in weak banks:
KLM could analyse the role of the second main bank and the extent to which the results are
stronger for firms borrowing from a single bank.
ARY could analyse what happened to firms borrowing from both weak and strong banks.
6

DIRECTORATE GENERAL ECONOMICS, STATISTICS AND RESEARCH
Real effects of credit constraints. Definition of weak banks (1)
Definition of weak banks:
KLM: Bank exposure to sovereign debt.
ARY: Banks receiving state funding between 2008 and 2009 or requiring a takeover to survive.
Is bank exposure to sovereign debt a good proxy for the strength of bank balance sheets?
Sovereign exposures do not seem to have been the main source of losses for EMU banks, except
for Greek banks. The role of delinquent loans to the private sector was more important.
7
0
5
10
15
20
25
30
35
40
07 08 09 10 11 12 13 14 15 16 17PRIVATE NON-FINANCIAL SECTORCONSTRUCTION AND REAL ESTATE SERVICES
%
NPL RATIO. SPANISH BANKS. DOMESTIC EXPOSURES
Source: Banco de España's Statistical Bulletin.
Loan losses calculated accumulating quarterly net impairment losses on loans in Spanish banksP&L accounts, since end-2007, for businesses in Spain. Sovereign debt securities lossesestimated accumulating quarterly theoretical losses on banks' holdings of Central Governmentbonds, for the same period. Theoretical quarterly losses are estimated by multiplying previousquarter banks' holdings of Central Government bonds by the quarterly change in SpanishCentral Government Bond Price Return Index (Table 22.17 of Banco de España's StatisticalBulletin).

DIRECTORATE GENERAL ECONOMICS, STATISTICS AND RESEARCH
Real effects of credit constraints. Definition of weak banks (2)
If sovereign exposure is not the main source of bank weakness, why do the results seem
to suggest that banks with a high sovereign exposure have tightened lending conditions
more?
Exposure to sovereign debt can be the result of their weakness and not the cause.
In any case, a more direct measure of bank weakness seems more reasonable.
One alternative would be capital ratios [Banerjee, Gambacorta, Sette (2017) “The real effects of
relationship lending”]
Another would be NPL ratios. Descriptive analyses suggest that NPL ratios are linked to credit
developments.
8
Source: Financial Stability Report November 2017, Banco de España.

DIRECTORATE GENERAL ECONOMICS, STATISTICS AND RESEARCH
Real effects of credit constraints. Definition of weak banks (3)
However, if the aim of the KLM paper is the analysis of the role of bank sovereign
exposure on investment, the following has to be taken into account:
Timing: sovereign risk was not priced in until 2010-11
Heterogeneity: not all countries have been affected in the same way.
9
These facts could have been considered in the specification (for example, by limiting the crisis period to years 2010-2012 or by allowing for differentiated time effects).

DIRECTORATE GENERAL ECONOMICS, STATISTICS AND RESEARCH
Real effects of credit constraints. Definition of weak banks (4)
ARY definition of weak banks makes sense and is in line with the literature [Bentolila et al
(2013)].
However, the fact that banks receiving state funding between 2008 and 2009 were
encouraged not to cut lending could weaken the results and main explain why the
reported effects are so small.
To address this issue and to check the robustness of results, I suggest using alternative
measures of weak banks such as capital ratios [Banerjee, Gambacorta, Sette (2017)].
10

DIRECTORATE GENERAL ECONOMICS, STATISTICS AND RESEARCH
Real effects of credit constraints. Othercomments
KLM:
Panel regression: If exposure to sovereign debt measures the effect of weak sovereigns on
banks only periphery sovereign debt should be considered (as in Table 7), but also including
that part held by non-domestic banks.
ARY:
Sample:
Possibly biased: only firms with collateralised loans are considered. What is the role of this
in the results?
Too small when productivity measures are considered (only 9,000 firms). This might explain
the lack of robust results in the relationship with productivity.
Results: It is far from clear why credit constraints faced by firms borrowing from weak banks
are stronger for more productive firms.
A possible explanation is the higher leverage of more productive firms.
The explanation based on forbearance seems inconsistent with the existence of credit
constraints .
11

DIRECTORATE GENERAL ECONOMICS, STATISTICS AND RESEARCH
Factor allocation and productivity.Methodology to estimate misallocation
• The paper focuses on misallocation across sectors, but there is ample evidence pointing
to within-industry misallocation across firms as the main driver of aggregate productivity
developments [García- Sentana et al. (2016, BE WP), Gopinath et al. (2017, QJE)].
• The measure of misallocation across sectors is based on the covariance between growth
rates of market shares and productivity and resembles the cross-term in the
decomposition by Foster et al. (2006, RES). What is the conceptual difference between
both approaches?
• The measure is estimated using a one-step approach instead of the two-step approach in
Borio et al. (2016). Why is this approach more efficient?
• In the main specification used in equation 10 country-sector plus sector-time fixed effects
are considered. Therefore, only the variation over time is exploited. Are the main findings
robust to the inclusion of other fixed effects (time effects instead of sector-time fixed
effects)?
12

DIRECTORATE GENERAL ECONOMICS, STATISTICS AND RESEARCH
Factor allocation and productivity. The role of monetary policy, main findings
Main finding: factor reallocation is linked to surprises in the slope of the yield curve.
Shocks that flatten the slope tend to have a negative effect on the contribution of reallocation
to aggregate productivity growth and vice versa.
The authors argue that this result implies that QE policies (which flatten the slope of the
yield curve) may have a detrimental impact to productivity growth, whereas conventional
monetary policies (which steepens the slope of the yield curve) have a positive effect.
13

DIRECTORATE GENERAL ECONOMICS, STATISTICS AND RESEARCH
Factor allocation and productivity. The role of monetary policy, my comments (1)
Little variability of the interest rate variables (11 out of 15 countries are EMU countries and
share the same or similar interest rates).
The coefficient of interest could potentially capture other effects.
What is the theoretical justification for the relationship between unexpected changes in
the slope of the yield curve and factor allocation?
Why only unexpected changes do matter?
Expected changes in monetary policy do not have any effect on factor allocation whereas
expected changes do have an impact.
The results are interpreted in terms of the implications for the impact of monetary policy,
but changes in the slope of the yield curve may reflect a variety of shocks other than
monetary policy shocks such as changes in the economic outlook, sovereign risk during
the crisis.
14
DIRECTORATE GENERAL ECONOMICS, STATISTICS AND RESEARCH
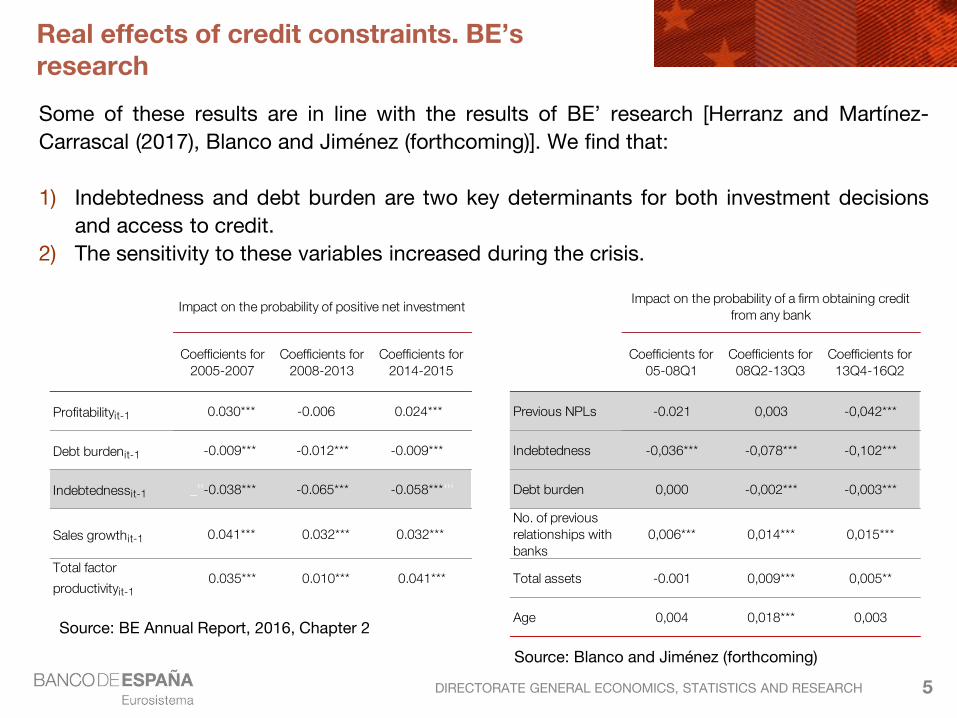
Factor allocation and productivity. The role of monetary policy, my comments (2)
The authors suggest that during the crisis monetary policy has mainly been implemented
using non-conventional policies such as QE whose effect is the flattening of the yield
curve.
However, this is not true, specially for euro area countries. In the euro area, QE was introduced
in 2015. Policies targeting short term interest rates have played an important role until early
2016.
15