Embed Size (px)
Citation preview
The Opportunity to Peek: A Longitudinal Investigation of Unauthorized Access Attempts on IS Applications In a Financial Institution*
Jingguo Wang1, Zhe (Jay) Shan2, Manish Gupta3 and H.Raghav Rao4
1 College of Business, University of Texas at Arlington2 Lindner College of Business, University of Cincinnati
3 School of Management, State University of New York at Buffalo4 University of Texas at San Antonio
Presented at IFSA, University of Delaware, March 18, 2016Acks: This research has been funded by the NSF under grants SES 1420758 and 1419856. The usual disclaimer applies.

2
Agenda
• Introduction• Theory and hypothesis development
• Criminal opportunity theory• Hypothesis development
• Data and measurement• Data analysis and results• Discussion• Implications
3
Introduction
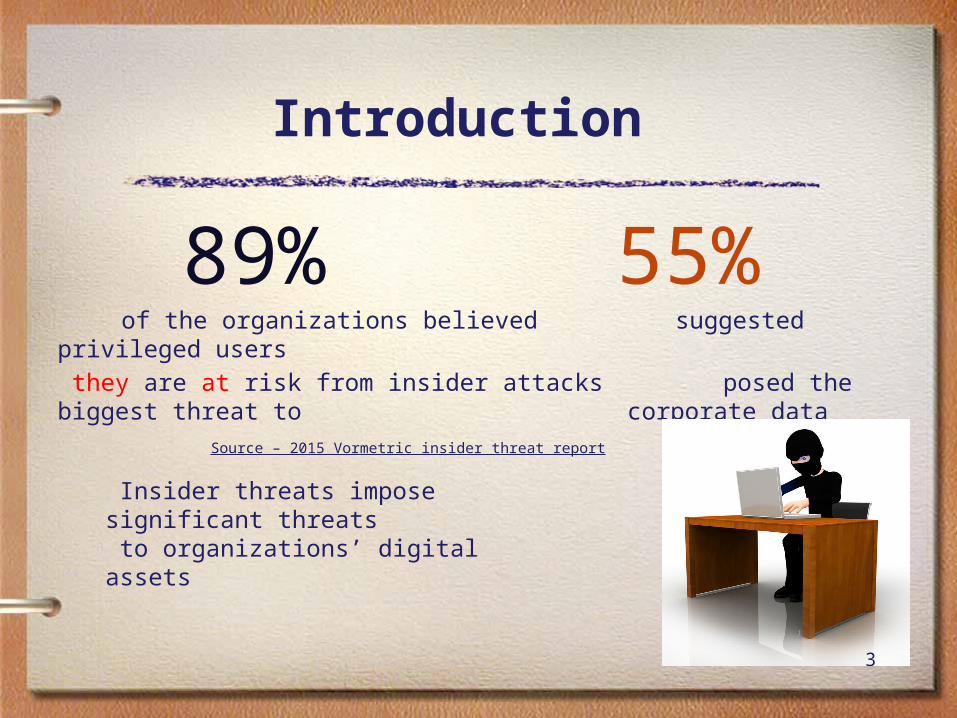
89% 55% of the organizations believed suggested privileged users they are at risk from insider attacks posed the biggest threat to
corporate data Source – 2015 Vormetric insider threat report
Insider threats impose significant threats to organizations’ digital assets
4
Introduction contd.• Studies in behavior information security have revolved around individual
motivation in one or more of its many forms that drive insiders’ behavior• Neutralization• Moral beliefs• Perceived identity match• Perceived risk of shame• Moral reasoning
• However, it is unclear under what kind of circumstances do insider threats to digital assets emerge
5
Criminal opportunity theory
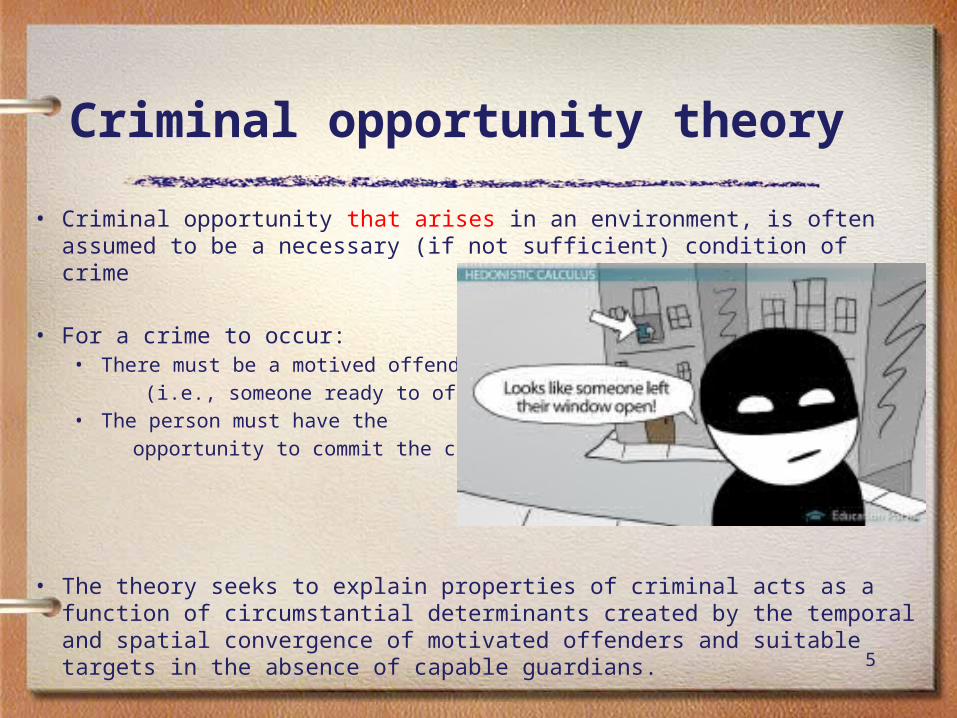
• Criminal opportunity that arises in an environment, is often assumed to be a necessary (if not sufficient) condition of crime
• For a crime to occur:• There must be a motived offender (i.e., someone ready to offend) • The person must have the opportunity to commit the crime
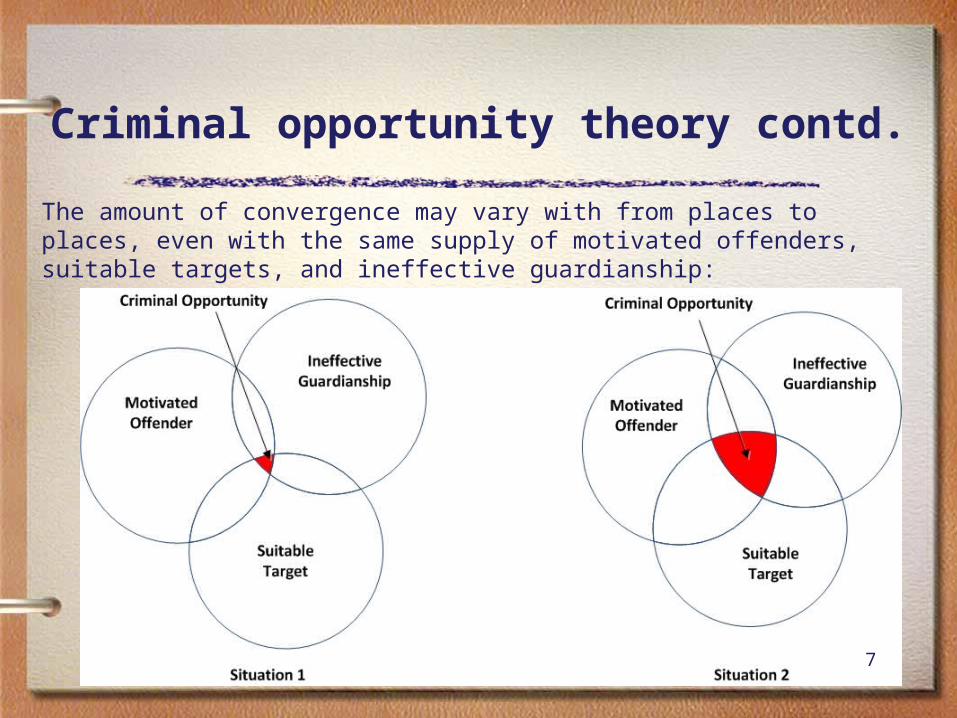
• The theory seeks to explain properties of criminal acts as a function of circumstantial determinants created by the temporal and spatial convergence of motivated offenders and suitable targets in the absence of capable guardians.

6
Criminal opportunity theory contd.
• Criminal opportunity of varying size with the supply of suitable targets and ineffective guardianship:
7
Criminal opportunity theory contd.The amount of convergence may vary with from places to places, even with the same supply of motivated offenders, suitable targets, and ineffective guardianship:
8
Research model & hypotheses
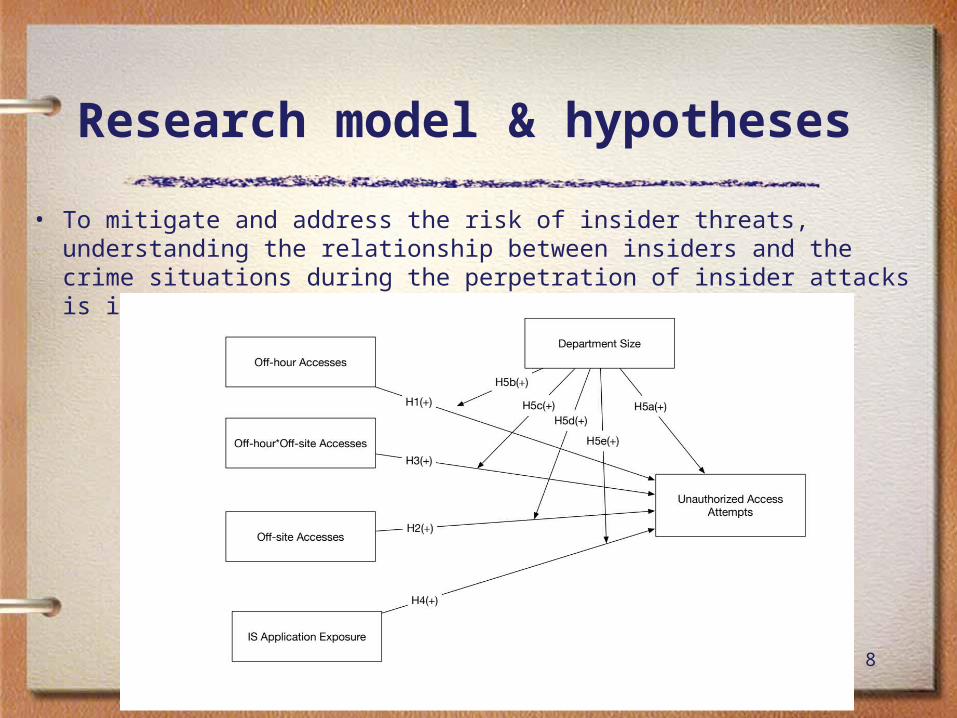
• To mitigate and address the risk of insider threats, understanding the relationship between insiders and the crime situations during the perpetration of insider attacks is important
9
Hypothesis 1
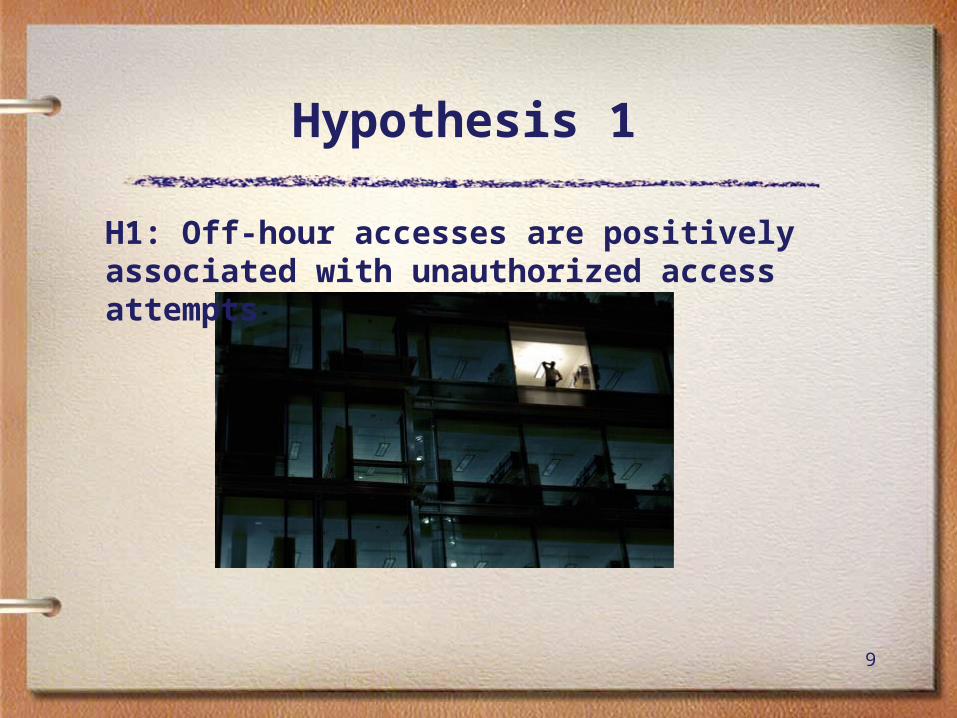
H1: Off-hour accesses are positively associated with unauthorized access attempts

10
Hypothesis 1 contd.
• Insider crimes are usually conducted slowly (tempo) and repeatedly (rhythm) to avoid notice
• Off hour access to systems gives them the opportunity to reduce the effectiveness of detective controls.
• Off hour access allows them to attempt elevation of privileges and expansion of controls
11
Hypothesis 2
H2: Off-site accesses are positively associated with unauthorized access attempts

12
Hypothesis 2 contd.
• The location of individuals or objects affects their accessibility to people and traffic, and thereby affect motivation to criminal behavior
• Moreover, ineffective control or guardianship is a necessary component of a criminal opportunity context
• Nowadays, more and more companies allow their workforces to telecommute or use mobile technologies to remotely access enterprise information systems
13
Hypothesis 3
H3: The interaction between off-time and off-site access is positively associated with unauthorized access
attempts
14
Hypothesis 3 contd.
• Routine activity theory suggests that for a crime to occur, a motivated offender must converge in time and space with a suitable target in the absence of capable guardianship
• The likelihood that these conditions will be met is influenced by the routine activity patterns of potential offenders, victims, and guardians in society
• Off-time and off-site access aggregates criminal opportunities, and gives insider a guardian-free environment to conduct prolonged malicious activities.
15
Hypothesis 4
H4: IS application exposure is positively associated with unauthorized access attempts
16
Hypothesis 4 contd.
• Target vulnerability at the environmental level aggregates across individuals and objects that are susceptible to criminal events
• The more proximate and exposed to a concentration of suitable targets, the more likely an individual or object will experience a criminal event
• Access to a higher number of applications is also typically symptomatic of “access creep”
• The 2008 incident, at Societe Generale which resulted in more than $7 billion in trading losses, was the result of an insider using access from his old role

17
Hypothesis 5
H5a: Employees from a larger department are associated with higher unauthorized attempts
H5b,c,d: Department size reinforces the effect of other variables in unauthorized access
attempts
18
Hypothesis 5 contd.
• An organization is vulnerable to various forms of computer crime, because dishonest employees perceive the organizational context as ‘criminogenic environments’
• Usually, a large department may have a low degree of manager supervision and safeguard controls
• It leads to a bigger number of unhandled staff and hence potential offenders
• The employees in larger departments tend to have wider knowledge of accesses than needed for their own specific functions
19
Data
• Log data from a single sign-on (ESSO) system spanning six months from Feb/2014 to July/2014 was collected in a financial institution in northern USA
• The ESSO system integrated 34 applications within the organization
• Based on an authentication and authorization interaction, the ESSO system allows the employees transverse through different IS applications without repeated sign-in.
20
ESSO architecture
21
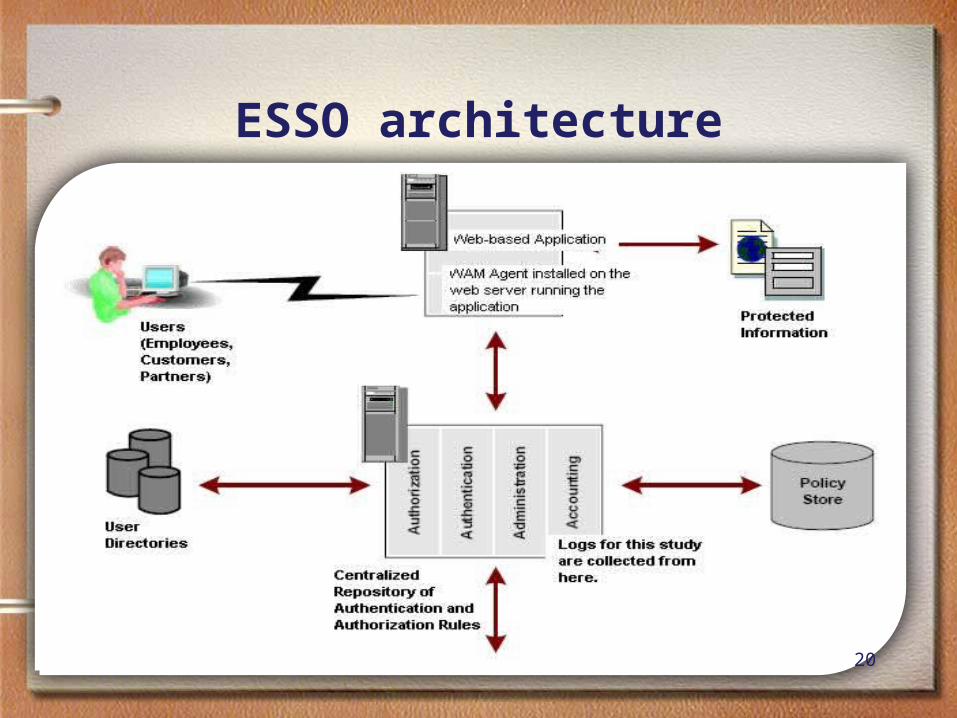
ESSO architecture contd.• Policy Server — This component provides centralized policy management and
decisions on authentication and authorization requests made by WAM agent on behalf of the users attempting to access protected resources. The Policy Server performs key security operations including the following: • Authentication; Authorization; administration; Accounting
• Agent - Installed and configured within context of a standard Web server or application server, ESSO agent enables ESSO system to manage access to Web applications and content according to predefined security policies.
• Policy store – This is a repository where all the information managed by policy server resides.

22
Measurement
• Each entry in the ESSO log contains a user id, a timestamp, the application or resource the user requested, and the result of an event
• The dataset includes a total of 30,571,388 relevant entries spanning 6 months with 14,155 users from 105 departments
• We consider that a user starts a new session after inactive for at least 20 minutes
• In other words, any two log records within a 20-minute interval belong to a same session of a user. Otherwise, they belong to different sessions
• We excluded employees presented in the log for less than a month and minimal system access. The final dataset has a total number of observations of 56,323 emloyees with 9672 users from 78 departments.
23
Measurement contd.
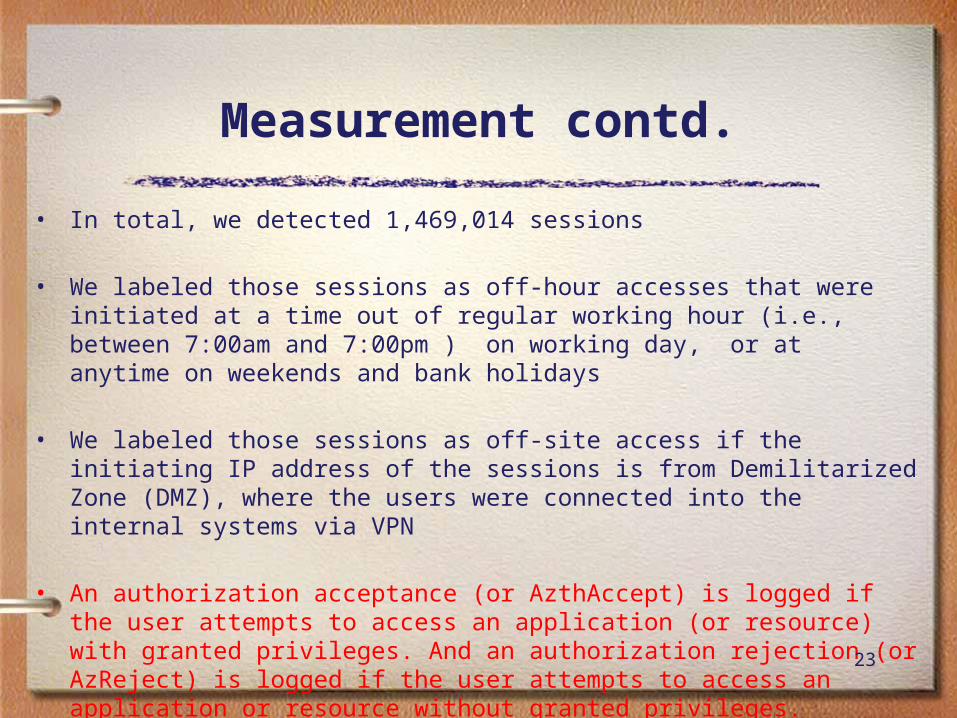
• In total, we detected 1,469,014 sessions
• We labeled those sessions as off-hour accesses that were initiated at a time out of regular working hour (i.e., between 7:00am and 7:00pm ) on working day, or at anytime on weekends and bank holidays
• We labeled those sessions as off-site access if the initiating IP address of the sessions is from Demilitarized Zone (DMZ), where the users were connected into the internal systems via VPN
• An authorization acceptance (or AzthAccept) is logged if the user attempts to access an application (or resource) with granted privileges. And an authorization rejection (or AzReject) is logged if the user attempts to access an application or resource without granted privileges.
24
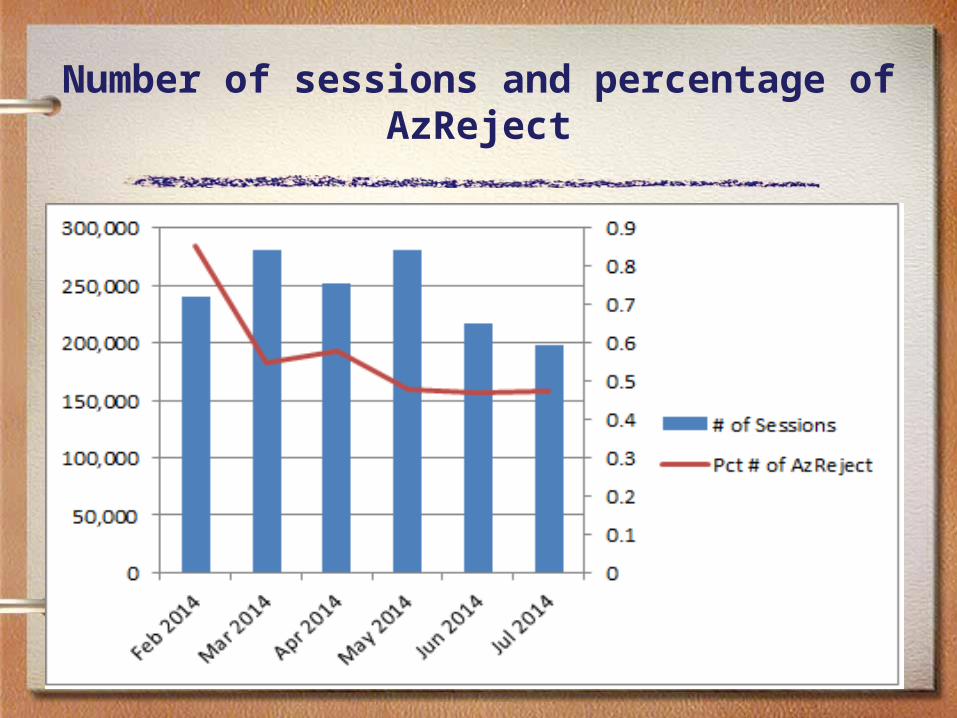
Number of sessions and percentage of AzReject

25
Percentage of Sessions from External IP and at Off-hour
26
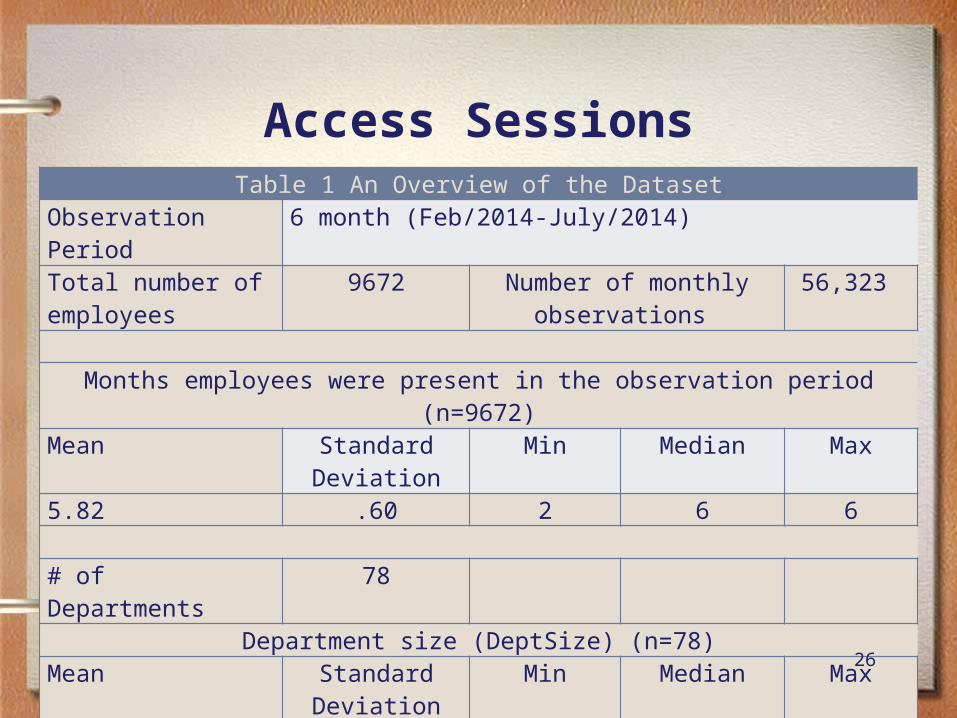
Access SessionsTable 1 An Overview of the Dataset
Observation Period 6 month (Feb/2014-July/2014)
Total number of employees
9672 Number of monthly observations
56,323
Months employees were present in the observation period (n=9672)
Mean Standard Deviation
Min Median Max
5.82 .60 2 6 6
# of Departments 78 Department size (DeptSize) (n=78)
Mean Standard Deviation
Min Median Max
124 430.572 3 25.5 3636 Total # of Apps Tracked 34
27
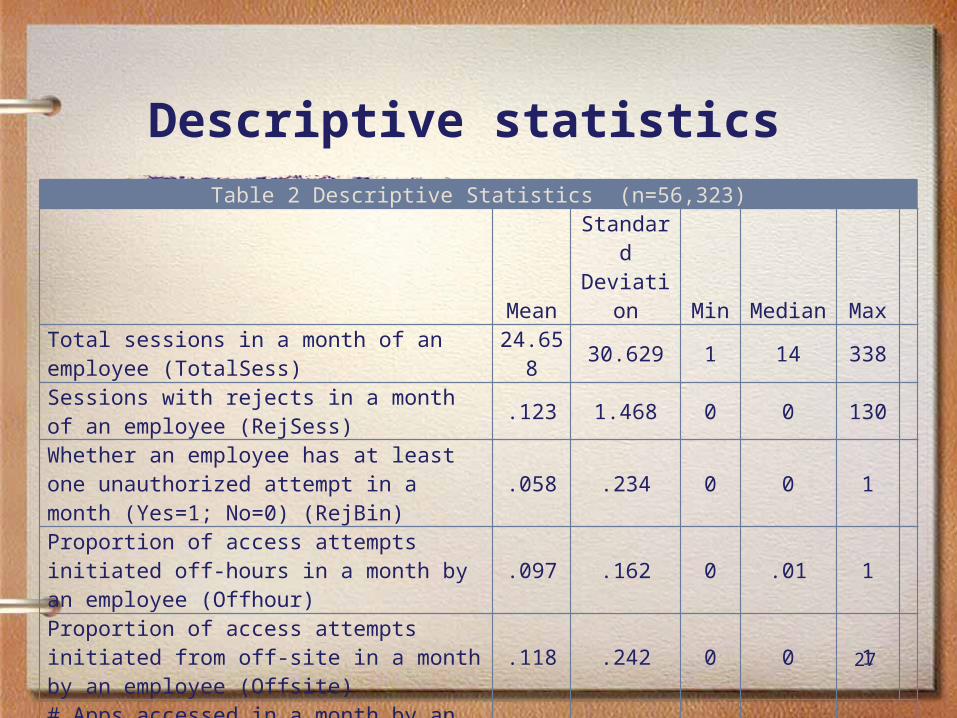
Descriptive statistics Table 2 Descriptive Statistics (n=56,323)
MeanStandard Deviation Min Median Max
Total sessions in a month of an employee (TotalSess)
24.658 30.629 1 14 338
Sessions with rejects in a month of an employee (RejSess)
.123 1.468 0 0 130 Whether an employee has at least one unauthorized attempt in a month (Yes=1; No=0) (RejBin)
.058 .234 0 0 1
Proportion of access attempts initiated off-hours in a month by an employee (Offhour)
.097 .162 0 .01 1
Proportion of access attempts initiated from off-site in a month by an employee (Offsite)
.118 .242 0 0 1
# Apps accessed in a month by an employee (Apps)
2.808 1.287 1 3 9
28
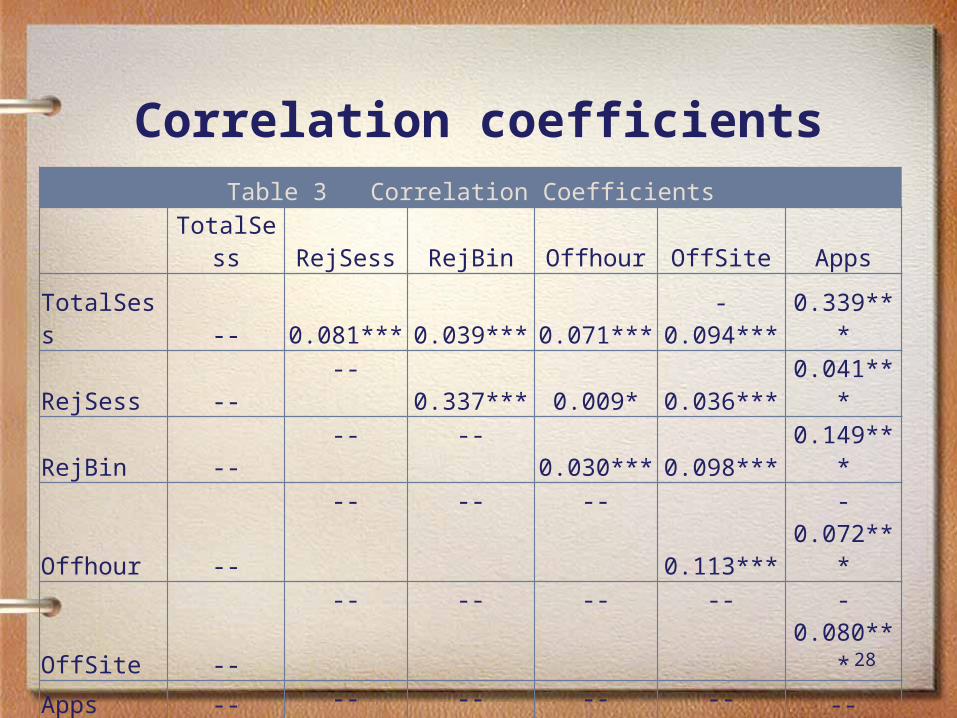
Correlation coefficientsTable 3 Correlation Coefficients
TotalSess RejSess RejBin Offhour OffSite Apps
TotalSess -- 0.081*** 0.039*** 0.071*** -0.094*** 0.339***
RejSess -- -- 0.337*** 0.009* 0.036*** 0.041***
RejBin -- -- -- 0.030*** 0.098*** 0.149***
Offhour --
-- -- --
0.113*** -0.072***
OffSite --
-- -- -- --
-0.080***
Apps -- -- -- -- -- --
***<.001; **<0.01; *<0.05; ^<0.1.

29
Data analysis and results
30
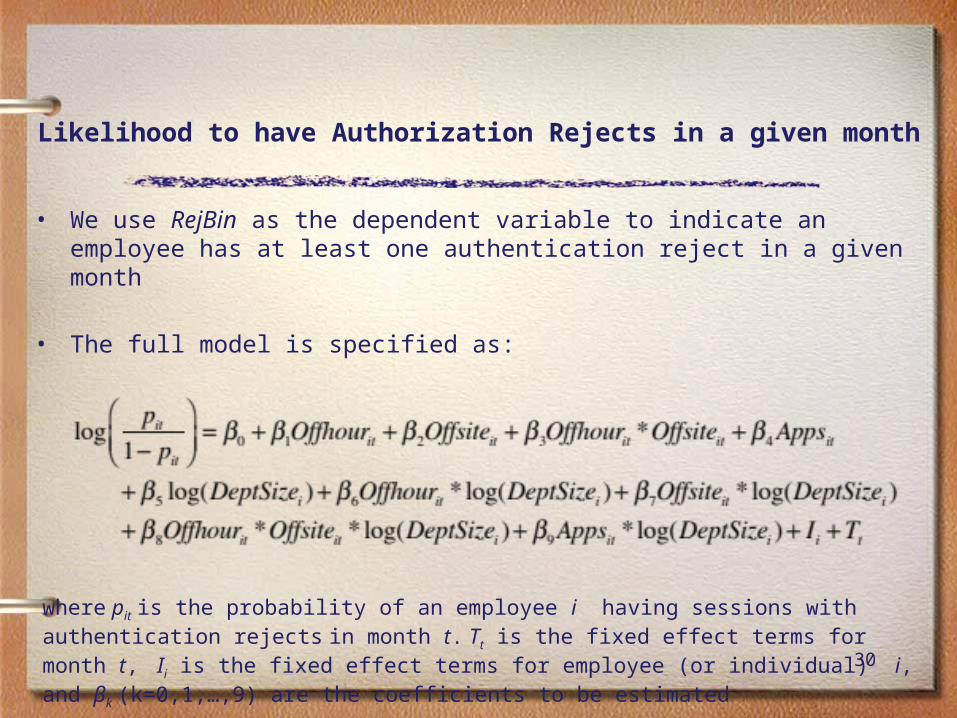
Likelihood to have Authorization Rejects in a given month
• We use RejBin as the dependent variable to indicate an employee has at least one authentication reject in a given month
• The full model is specified as:
where pit is the probability of an employee i having sessions with authentication rejects in month t. Tt is the fixed effect terms for month t, Ii is the fixed effect terms for employee (or individual) i, and βk (k=0,1,…,9) are the coefficients to be estimated

31
Likelihood to have authorization rejects in a given month contd.
Table 4 Likelihood of an employee to have unauthorized attempt(s) in a given month Model Parameters Model 1 Model 2 Model 3 Month Fixed Effect Included Included Included Individual Fixed Effect Included Included Included Off-hour 1.419*** (.221) 1.186*** (.244) 1.614***(.258) Off-site 3.566***(.159) 3.554***(.160) 3.620***(.164) Apps 0.916***(.028) .915***(.028) 0.917***(.028) Off-hour*Off-site -- 1.461**(.587) 3.211***(.750) Off-hour*Log(DeptSize) -- -- 1.190***(.169) Off-site*Log(DeptSize) -- -- .184^(.101) Apps*Log(DeptSize) -- -- 0.027(.018) Off-hour*Off-site*Log(DeptSize) -- -- 1.267***(.470) Model Fit -2LogL 7523.857 7517.473 7428.906 -2LogL (w/o covariates) 9427.15 9427.15 9427.15 AIC 7539.857 7535.473 7454.906 AIC (w/o covariates) 9427.15 9427.15 9427.15
***<.001; **<0.01; *<0.05; ^<0.1. · The number inside the parentheses is the standard error of the estimate.

32
Percentage of sessions with authorization rejects:
• To test how these factors influence the amount of authorization rejects, we use the percentage of sessions with authorization rejects as the dependent variable.
• It is calculated as the ratio between the number of sessions with authorized rejects and the total number of sessions of an employee in a given month

33
Percentage of sessions with authorization rejects: fixed-effects models contd.
Table 5 Percentage of sessions with unauthorized attempts in a given month: fixed-effect models
Model Parameters Model 4 Model 5 Model 6Month Fixed Effect Included Included IncludedIndividual Fixed Effect Included Included IncludedOff-hour 1.667***(.184) 1.304***(.185) 2.147***(.191)Off-site 5.464***(.140) 5.369***(.140) 5.271***(.140)Apps 0.213***(.022) 0.219***(.022) 0.216***(.022)
Off-hour*Off-site -- 8.243***(.527) 14.712***(.591)
Off-hour*Log(DeptSize) -- -- 1.385***(.122)Off-site*Log(DeptSize) -- -- .667***(.086)Apps*Log(DeptSize) -- -- .005(.014)
Off-hour*Off-site*Log(DeptSize) -- -- 6.60***(.332)
Model Fit R2 33.9% 34.2% 35.1% ***<.001; **<0.01; *<0.05
· The number inside the parentheses is the standard error of the estimate.
34
Percentage of sessions with authorization rejects: a multi-level analysis
• An employee’s behavior observed at multiple time points may be correlated and driven by the same individual characteristics other than contextual variables
• Similarly, employees from a department may be driven by the department characteristics
35
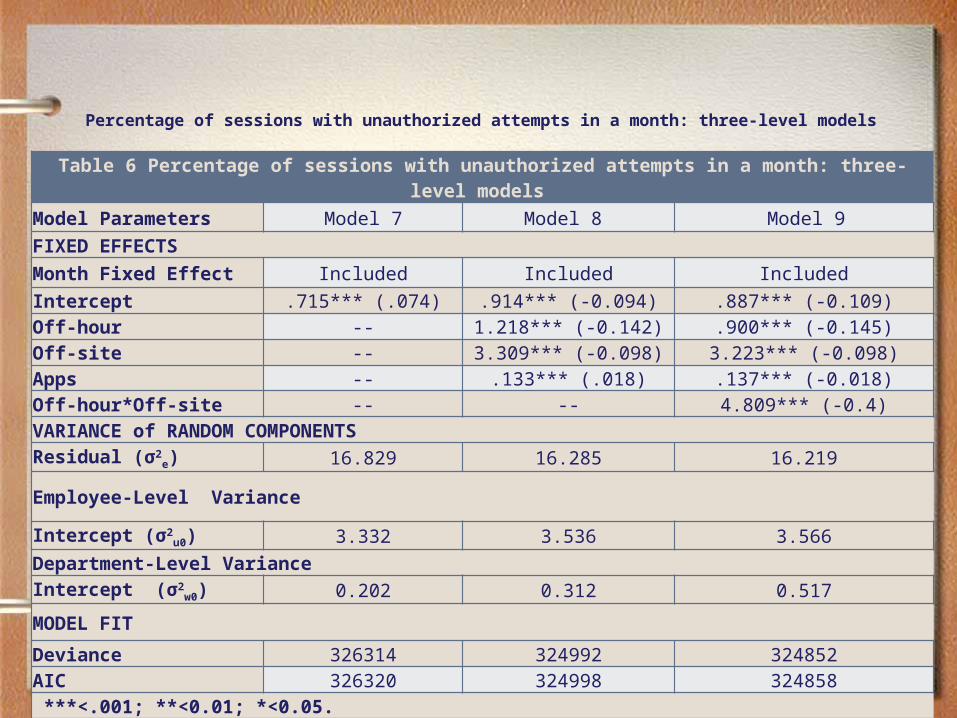
Table 6 Percentage of sessions with unauthorized attempts in a month: three-level models Model Parameters Model 7 Model 8 Model 9FIXED EFFECTSMonth Fixed Effect Included Included IncludedIntercept .715*** (.074) .914*** (-0.094) .887*** (-0.109)Off-hour -- 1.218*** (-0.142) .900*** (-0.145)Off-site -- 3.309*** (-0.098) 3.223*** (-0.098)Apps -- .133*** (.018) .137*** (-0.018)Off-hour*Off-site -- -- 4.809*** (-0.4)VARIANCE of RANDOM COMPONENTSResidual (σ2
e) 16.829 16.285 16.219
Employee-Level Variance
Intercept (σ2u0) 3.332 3.536 3.566
Department-Level VarianceIntercept (σ2
w0) 0.202 0.312 0.517
MODEL FITDeviance 326314 324992 324852AIC 326320 324998 324858 ***<.001; **<0.01; *<0.05.· The number inside the parentheses is the standard error of the estimate.
Percentage of sessions with unauthorized attempts in a month: three-level models
36
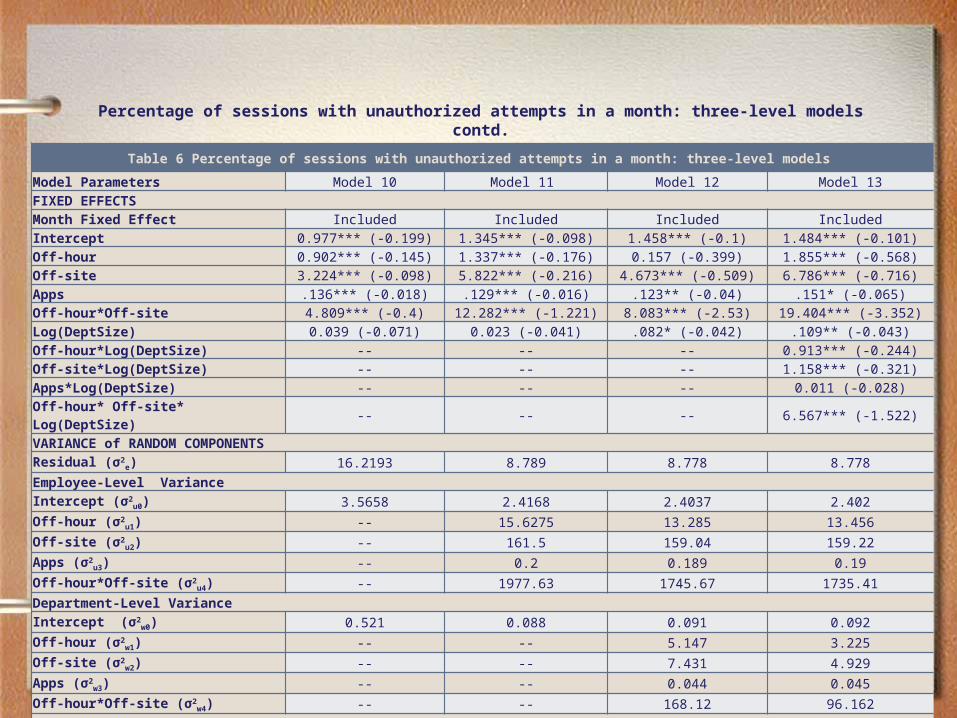
Percentage of sessions with unauthorized attempts in a month: three-level models contd.Table 6 Percentage of sessions with unauthorized attempts in a month: three-level models
Model Parameters Model 10 Model 11 Model 12 Model 13FIXED EFFECTSMonth Fixed Effect Included Included Included IncludedIntercept 0.977*** (-0.199) 1.345*** (-0.098) 1.458*** (-0.1) 1.484*** (-0.101)Off-hour 0.902*** (-0.145) 1.337*** (-0.176) 0.157 (-0.399) 1.855*** (-0.568)Off-site 3.224*** (-0.098) 5.822*** (-0.216) 4.673*** (-0.509) 6.786*** (-0.716)Apps .136*** (-0.018) .129*** (-0.016) .123** (-0.04) .151* (-0.065)Off-hour*Off-site 4.809*** (-0.4) 12.282*** (-1.221) 8.083*** (-2.53) 19.404*** (-3.352)Log(DeptSize) 0.039 (-0.071) 0.023 (-0.041) .082* (-0.042) .109** (-0.043)Off-hour*Log(DeptSize) -- -- -- 0.913*** (-0.244)Off-site*Log(DeptSize) -- -- -- 1.158*** (-0.321)Apps*Log(DeptSize) -- -- -- 0.011 (-0.028)Off-hour* Off-site* Log(DeptSize) -- -- -- 6.567*** (-1.522)VARIANCE of RANDOM COMPONENTSResidual (σ2
e) 16.2193 8.789 8.778 8.778Employee-Level VarianceIntercept (σ2
u0) 3.5658 2.4168 2.4037 2.402Off-hour (σ2
u1) -- 15.6275 13.285 13.456Off-site (σ2
u2) -- 161.5 159.04 159.22Apps (σ2
u3) -- 0.2 0.189 0.19Off-hour*Off-site (σ2
u4) -- 1977.63 1745.67 1735.41Department-Level VarianceIntercept (σ2
w0) 0.521 0.088 0.091 0.092Off-hour (σ2
w1) -- -- 5.147 3.225Off-site (σ2
w2) -- -- 7.431 4.929Apps (σ2
w3) -- -- 0.044 0.045Off-hour*Off-site (σ2
w4) -- -- 168.12 96.162MODEL FITDeviance 324855 305060 304777 304747AIC 324861 305074 304799 304769 ***<.001; **<0.01; *<0.05.· The number inside the parentheses is the standard error of the estimate.
39
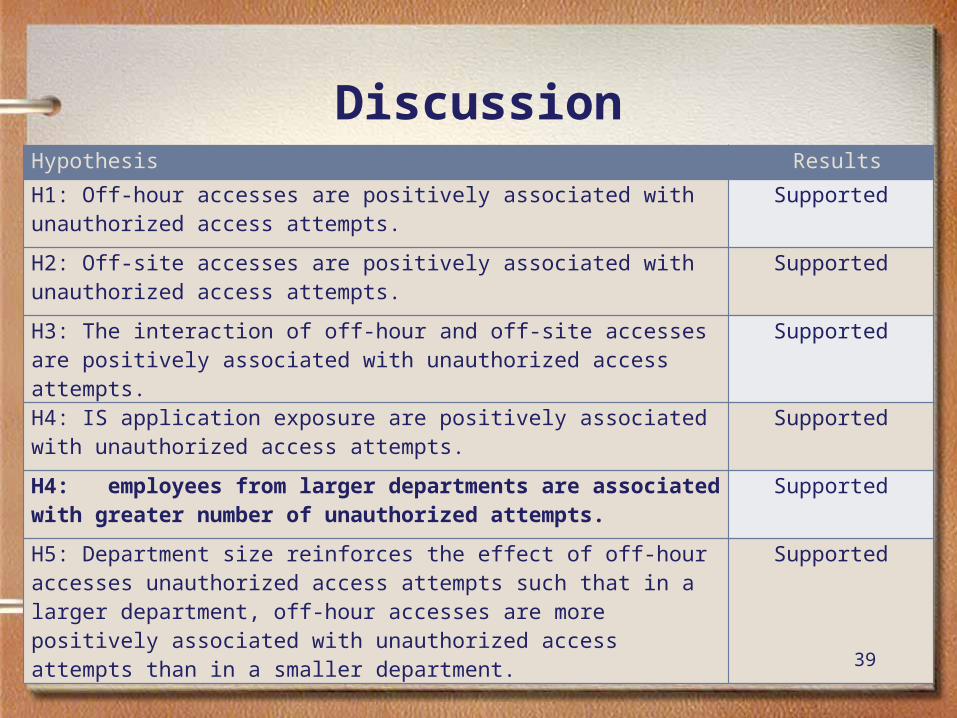
DiscussionHypothesis Results
H1: Off-hour accesses are positively associated with unauthorized access attempts.
Supported
H2: Off-site accesses are positively associated with unauthorized access attempts.
Supported
H3: The interaction of off-hour and off-site accesses are positively associated with unauthorized access attempts.
Supported
H4: IS application exposure are positively associated with unauthorized access attempts.
Supported
H4: employees from larger departments are associated with greater number of unauthorized attempts.
Supported
H5: Department size reinforces the effect of off-hour accesses unauthorized access attempts such that in a larger department, off-hour accesses are more positively associated with unauthorized access attempts than in a smaller department.
Supported

DiscussionHypothesis ResultsH6: Department size reinforces the effect of off-site accesses on unauthorized access attempts such that in a larger department, off-site accesses is more positively associated with unauthorized access attempts than in a smaller department.
Supported
H7: Department size reinforces the effect of the off-hour and off-site interaction on unauthorized access attempts such that in a larger department, the effect of the interaction term is more positively associated with unauthorized access attempts than in a smaller department.
Supported
H8: Department size reinforces the effect of IS application exposure on unauthorized access attempts such that in a larger department, IS application exposure is more positively associated with unauthorized access attempts than in a smaller department.
Not Supported
40

41
Implications• With the increasing trend of allowing employees to work on a more convenient
schedule and location
• The importance of understanding how access related behaviors change when employees are not bound by traditional temporal and spatial bounds has never been higher
• Recent examples from high profile data breaches (Snowden, Target, Societe Generale) highlight the importance of tighter and more secure insider access controls
42
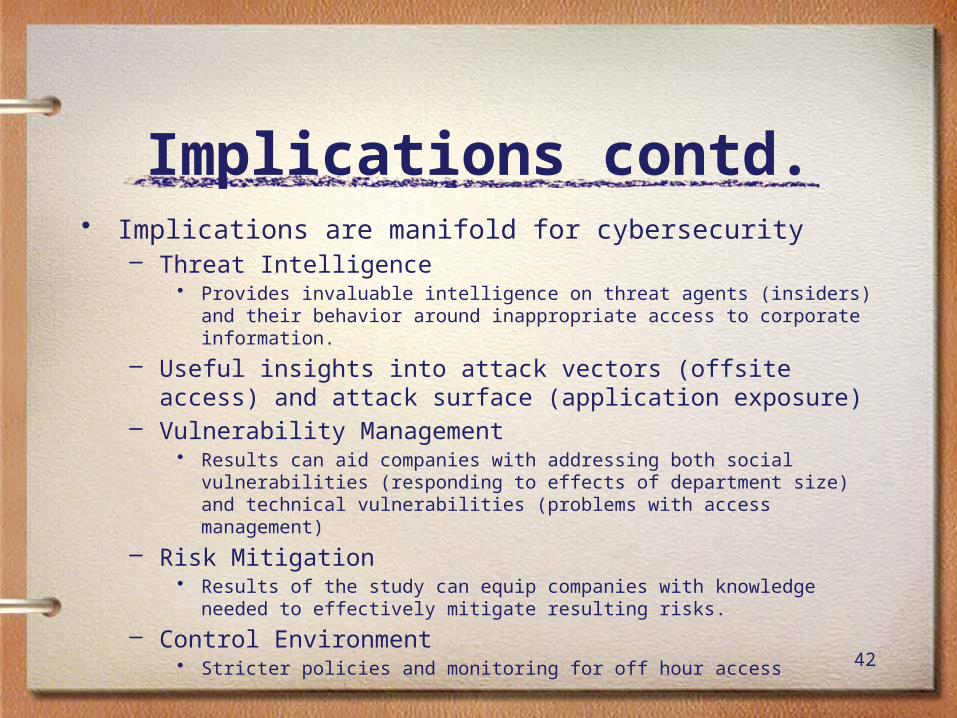
Implications contd.• Implications are manifold for cybersecurity
– Threat Intelligence• Provides invaluable intelligence on threat agents (insiders) and their behavior
around inappropriate access to corporate information.– Useful insights into attack vectors (offsite access) and attack
surface (application exposure)– Vulnerability Management
• Results can aid companies with addressing both social vulnerabilities (responding to effects of department size) and technical vulnerabilities (problems with access management)
– Risk Mitigation• Results of the study can equip companies with knowledge needed to effectively
mitigate resulting risks.– Control Environment
• Stricter policies and monitoring for off hour access

43
44
APPENDIX
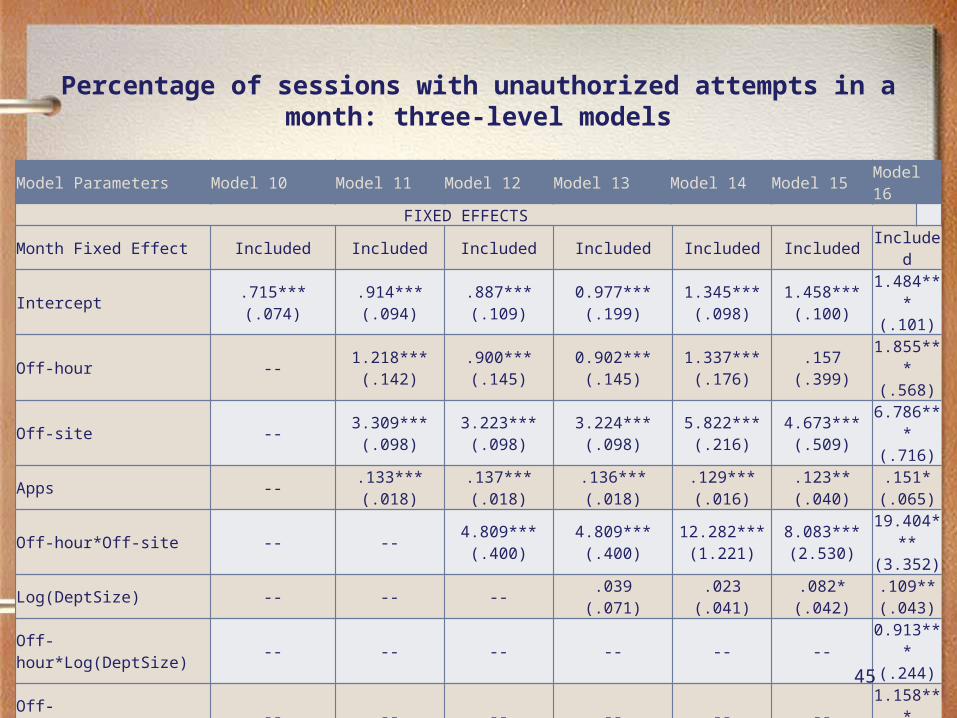
Percentage of sessions with unauthorized attempts in a month: three-level models
Model Parameters Model 10 Model 11 Model 12 Model 13 Model 14 Model 15 Model 16FIXED EFFECTS
Month Fixed Effect Included Included Included Included Included Included Included
Intercept .715*** (.074) .914***(.094)
.887***(.109)
0.977***(.199)
1.345***(.098)
1.458***(.100)
1.484***(.101)
Off-hour -- 1.218***(.142)
.900***(.145)
0.902***(.145)
1.337***(.176)
.157(.399)
1.855***(.568)
Off-site -- 3.309***(.098)
3.223***(.098)
3.224***(.098)
5.822***(.216)
4.673***(.509)
6.786***(.716)
Apps -- .133*** (.018) .137***(.018)
.136***(.018)
.129***(.016)
.123**(.040)
.151*(.065)
Off-hour*Off-site -- -- 4.809***(.400)
4.809***(.400)
12.282***(1.221)
8.083***(2.530)
19.404***(3.352)
Log(DeptSize) -- -- -- .039(.071)
.023(.041)
.082*(.042)
.109**(.043)
Off-hour*Log(DeptSize) -- -- -- -- -- -- 0.913***(.244)
Off-site*Log(DeptSize) -- -- -- -- -- -- 1.158***(.321)
Apps*Log(DeptSize) -- -- -- -- -- -- .011(.028)
Off-hour* Off-site* Log(DeptSize) -- -- -- -- -- -- 6.567***
(1.522)
45

Percentage of sessions with unauthorized attempts in a month: three-level models
Model Parameters Model 10 Model 11 Model 12 Model 13 Model 14 Model 15 Model 16
VARIANCE of RANDOM COMPONENTS
Residual (σ2e) 16.829 16.285 16.219 16.2193 8.789 8.778 8.778
Employee-Level Variance
Intercept (σ2u0) 3.332 3.536 3.566 3.5658 2.4168 2.4037 2.402
Off-hour (σ2u1) -- -- -- -- 15.6275 13.285 13.456
Off-site (σ2u2) -- -- -- -- 161.5 159.040 159.220
Apps (σ2u3) -- -- -- -- .200 .189 .190
Off-hour*Off-site (σ2u4) -- -- -- -- 1977.630 1745.670 1735.41
0
46

Percentage of sessions with unauthorized attempts in a month: three-level models
Model Parameters Model 10 Model 11 Model 12 Model 13 Model 14 Model 15 Model 16
Department-Level Variance
Intercept (σ2w0) 0.202 0.312 0.517 0.521 0.088 0.091 0.092
Off-hour (σ2w1) -- -- -- -- -- 5.147 3.225
Off-site (σ2w2) -- -- -- -- -- 7.431 4.929
Apps (σ2w3) -- -- -- -- -- 0.044 0.045
Off-hour*Off-site (σ2w4) -- -- -- -- -- 168.120 96.162
MODEL FIT
Deviance 326314 324992 324852 324855 305060 304777 304747
AIC 326320 324998 324858 324861 305074 304799 304769
***<.001; **<0.01; *<0.05.
· The number inside the parentheses is the standard error of the estimate. 47
48
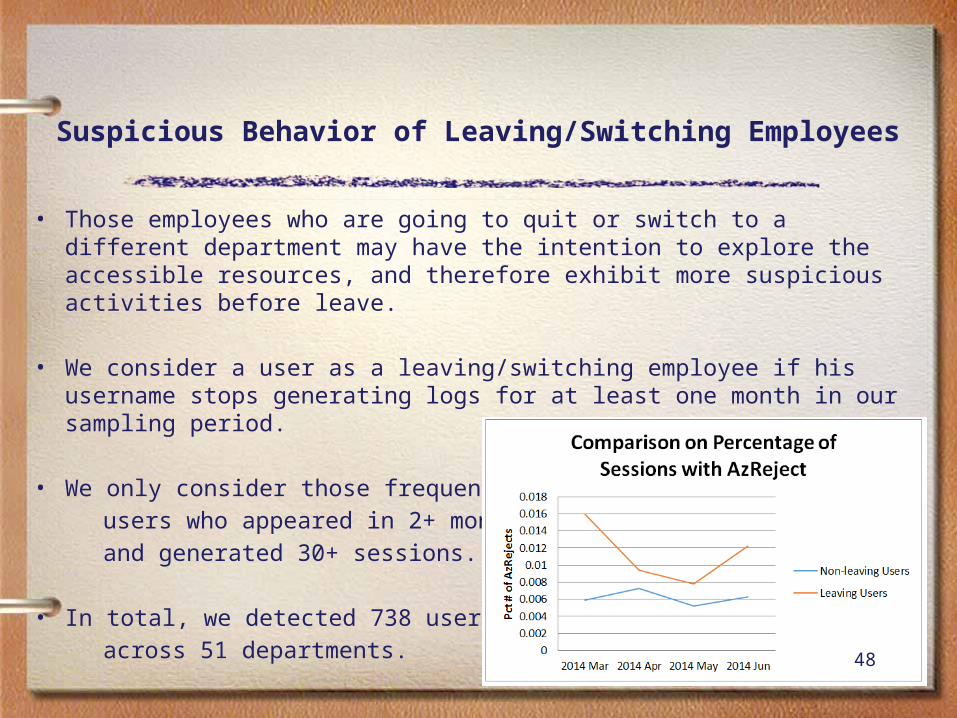
Suspicious Behavior of Leaving/Switching Employees
• Those employees who are going to quit or switch to a different department may have the intention to explore the accessible resources, and therefore exhibit more suspicious activities before leave.
• We consider a user as a leaving/switching employee if his username stops generating logs for at least one month in our sampling period.
• We only consider those frequent users who appeared in 2+ months and generated 30+ sessions.
• In total, we detected 738 users across 51 departments.