Embed Size (px)
Citation preview

FACTSHEETNational investments in cycling
INVESTING IN ACTIVE MOBILITY IS GOOD FOR THE ECONOMY
No other transport mode costs so little, yet produces so many positive externalities as cycling does: improved physical and mental health, reduced air and noise pollu-tion, low demand on scarce (urban) space, a small carbon footprint, reduced fuel dependency etc. Investing in sustain-able transport modes, at the expense of car use, is not only good for the environment and quality of life, it can also give a significant boost to the economy (i).
Against a business-as-usual scenario, an increase by 10 % of walking and cycling in the modal split can increase the German GDP by 1.1 % in 2030. Measured in today’s German GDP: this equals an economic benefit of about € 29 bn for Germany alone.
AN ACTIVE ROLE OF NATIONAL GOVERN-MENTS IN THE TOP-3 CYCLING COUNTRIES IN EUROPEIt is no coincidence that the 3 most cycling-friendly coun-tries in Europe all see a strong central-government financ-ing of cycling projects.
The Netherlands
The national government co-funds local projects, but also has its own budget lines: - Ease congestion with cycle highways: In 2009, the national ministry of transportation and water-ways earmarked € 21 million for building 16 bicycle highways until 2020. Local and regional governments need to invest € 80 million.- Bicycle parking at railway stations: 40 % of daily train travelers arrive by bicycle at the railway station; 15 % grab a bicycle at their destination. A programme of the Dutch railways NS & ProRail (iii) for the period 1999-2012 had the objective to raise the number of parking spots available at the stations from 100,000 to 400,000. In 2007-2012 the allocated budget was € 121 million (€20 million/annum), for 2012-2020 another € 107 million will be invested to expand capacity by another at least 140,000 bicycle parking spaces.
Overview of cycling expenditures of authorities in 2012 (€ million)
Towns and cities
Waterways authorities
City regions
Provinces National level
Total
Direct and indirect expenditures
207 6 60 87 49 410
% of total 50 % 2% 12% 24% 12% 100%
0
5
10
15
20
25
30
35
The
Net
herla
nds
Hun
gary
Den
mar
kSw
eden
Belg
ium
Ger
man
ySl
ovak
iaA
ustri
aLa
tvia
Cze
ch R
epub
licEU
-27
Slov
enia
Rom
ania
Lith
uani
aEs
toni
aIta
lyIre
land
Gre
ece
Fran
ce UK
Bulg
aria
Luxe
mbo
urg
Portu
gal
Spai
nC
ypru
s
% cycling as main mode of transport
Source: Eurobarometer 2010
About ECFWith over 70 members across nearly 40 countries, the European Cyclists’ Federation (ECF) unites cyclists’ associa-tions from across the globe, giving them a voice on the international level. Our aim is to get more people cycling more often by influencing policy in favour of cycling within political, economic, and social institutions.
Notesi - Frauenhofer-Institut für System- und Innovationsforschung ISI, Wirtschaftliche Aspekte nichttechnischer Massnahmen zur Emissionsverminderung im Verkehr, March 2013. Study commissioned by the Federal Environmental Agency, Germany. (English title: Economic aspects of non-technical measures to reduce traffic emissions”.)ii - Ibid, p. 126. And 156. An increase of scenario M1 (+10 % walking and cycling in the modal split) increases the German GDP by 1.11 %. In 2012 the German GDP was around € 2,643 bn.iii - Prorail is a government task organisation that takes care of maintenance and extensions of the national railway network infrastructure, of allocating rail capacity, and of traffic control.
DenmarkIn 2007, the Danish national government presented its first national cycling strategy in an attempt to reverse the downward trend on cycle use. Its financial arm became the ‘Bicycle fund 2009 – 2014’, equipped with DKR 1 bn (€ 133 million) for co-financing bicycling projects that local governments and organisations carry out (40 % national co-funding) and for building and improving bicycling facilities along the national road network.
* Co-funding is available for these topics: - Cycling cities- Commuting and cycling- Cycling to school and leisure activities- Recreational and tourist cycling- Campaigns- Innovation, development and demonstration
Rue Franklin, 28 1000 Brussels, Belgium Phone: +32 2 880 92 74 Fax: +32 2 880 92 75 [email protected]
HungaryIn 2007 Hungary adopted a national cycling strategy 2007 – 2013, accompanying the EU financial perspec-tive in the same period. In total, about € 255 million were spent, mainly into cycle infrastructure in towns and cities. The largest single financing source is the EU (European Regional Development Funds) with about € 170 million, co-funded by the national and local authori-ties. The national co-funding of EU investments is essen-tial – local authorities in Hungary would not have been able on their own to make the required co-funding. In total, the national government invested about € 45 million over a 7 year period, or € 6.5 million/ annually.
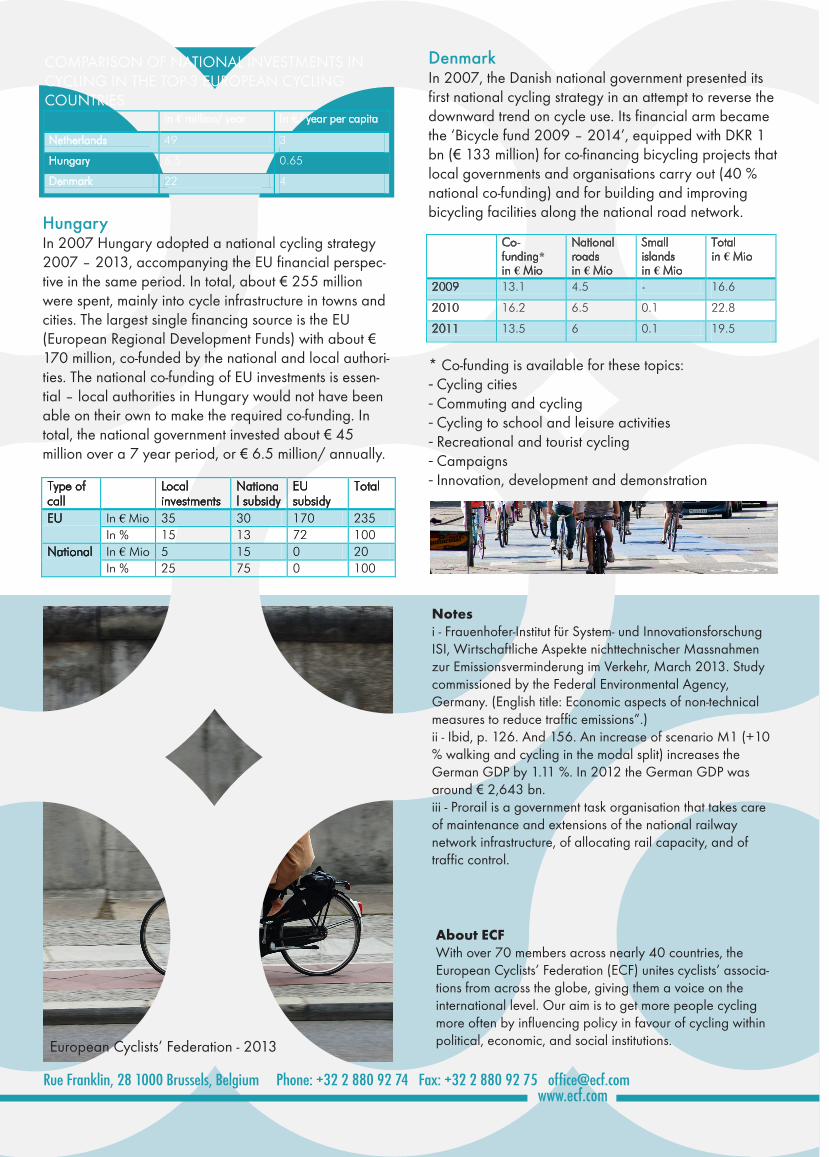
European Cyclists’ Federation - 2013
Co-funding* in € Mio
National roads in € Mio
Small islands in € Mio
Total in € Mio
2009 13.1 4.5 - 16.6
2010 16.2 6.5 0.1 22.8
2011 13.5 6 0.1 19.5
In € million/ year In €/ year per capita
Netherlands 49 3
Hungary 6.5 0.65
Denmark 22 4
COMPARISON OF NATIONAL INVESTMENTS IN CYCLING IN THE TOP-3 EUROPEAN CYCLING COUNTRIES
Type of call
Local investments
National subsidy
EU subsidy
Total
EU In € Mio 35 30 170 235 In % 15 13 72 100
National In € Mio 5 15 0 20 In % 25 75 0 100