Embed Size (px)
Citation preview
Overview Equity Market Overview 1Valuations 2
Publicly Traded Companies 4
C-Store Trends Margins 6Government and Regulatory 8
Recent M&A Activity 10
Segment Focus: Grocery Stores 12
Fuel Pricing & Supply Charts 14
About Mercer Capital 17
Q1: Motor Fuels
Q2: Grocery Stores
Q3: Alternative Fuels & Transportation
Q4: Foodservices
2016
www.mercercapital.com
VALUE FOCUSConvenience Stores
SEGMENT FOCUS Grocery Stores

© 2016 Mercer Capital // www.mercercapital.com 1
Mercer Capital’s Value Focus: Convenience Stores Second Quarter 2016
During the three months ending March 2016, equity market pricing for the convenience store index remained essentially
flat, outperforming the Russell 2000 which fell 2.2% during the quarter. Performance among individual index participants
was mixed. TA continued to endure a steep price decline (-27.7%) as it failed to meet fourth quarter revenue and earnings
expectations. CASY and CST posted relatively smaller declines of 5.2% and 1.9%, respectively. In comparison, CASY’s
stock posted a 17.3% increase during the fourth quarter of 2015. The contrasting first quarter decline is attributable to
declining same-store sales during the first part of 2016. The grocery store index posted a 6.7% decrease during the
quarter. This decline was largely led by Kroger (KR) which posted an 8.7% decrease, spurred by lowering its same-
store sales expectations. KR has the largest market capitalization in our grocery index. The fast food index posted a
quarterly increase of 7.0%. With the exceptions of CMG and JACK, performance was up across the board.
70
80
90
100
110
120
Mar-15 Apr-15 May-15 Jun-15 Jul-15 Aug-15 Sep-15 Oct-15 Nov-15 Dec-15 Jan-16 Feb-16
MCM C-Store Index MCM Grocery Index MCM Food Franchise Index Russell 2000 3/31/15= 100
C-Store, Grocery Store, & QSR Stock Indices
OverviewEquity Market Overview
Data Source: S&P Global Market Intelligence / Bloomberg
© 2016 Mercer Capital // www.mercercapital.com 2
Mercer Capital’s Value Focus: Convenience Stores Second Quarter 2016
4
5
6
7
8
9
10
11
12
Q1 2011
Q2 Q3 Q4 Q1 2012
Q2 Q3 Q4 Q1 2013
Q2 Q3 Q4 Q1 2014
Q2 Q3 Q4 Q1 2015
Q2 Q3 Q4 Q1
Mid-Point
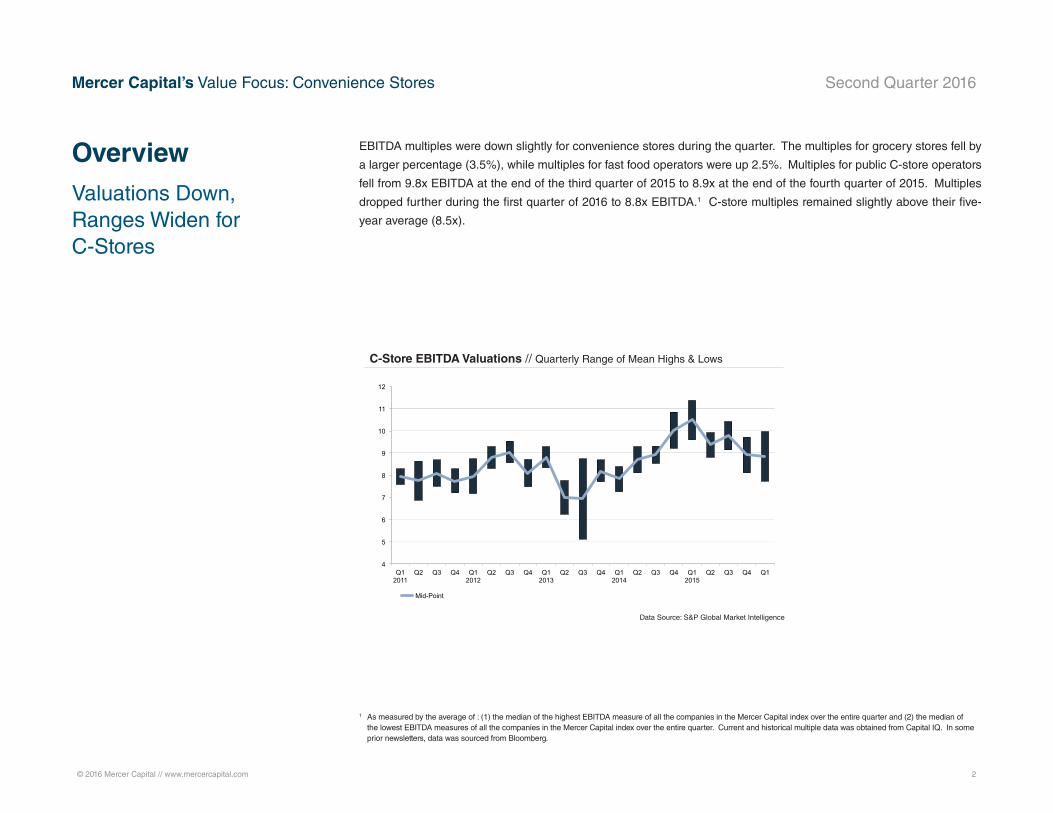
C-Store EBITDA Valuations // Quarterly Range of Mean Highs & Lows
Data Source: S&P Global Market Intelligence
EBITDA multiples were down slightly for convenience stores during the quarter. The multiples for grocery stores fell by
a larger percentage (3.5%), while multiples for fast food operators were up 2.5%. Multiples for public C-store operators
fell from 9.8x EBITDA at the end of the third quarter of 2015 to 8.9x at the end of the fourth quarter of 2015. Multiples
dropped further during the first quarter of 2016 to 8.8x EBITDA.1 C-store multiples remained slightly above their five-
year average (8.5x).
1 As measured by the average of : (1) the median of the highest EBITDA measure of all the companies in the Mercer Capital index over the entire quarter and (2) the median of the lowest EBITDA measures of all the companies in the Mercer Capital index over the entire quarter. Current and historical multiple data was obtained from Capital IQ. In some prior newsletters, data was sourced from Bloomberg.
OverviewValuations Down, Ranges Widen for C-Stores

© 2016 Mercer Capital // www.mercercapital.com 3
Mercer Capital’s Value Focus: Convenience Stores Second Quarter 2016
Fast Food (QSR) EBITDA Valuations // Quarterly Range of Mean Highs & Lows
9
10
11
12
13
14
15
16
17
Q1 2011
Q2 Q3 Q4 Q1 2012
Q2 Q3 Q4 Q1 2013
Q2 Q3 Q4 Q1 2014
Q2 Q3 Q4 Q1 2015
Q2 Q3 Q4 Q1 2016
Mid-Point
Data Source: S&P Global Market Intelligence
3
4
5
6
7
8
9
Q1 2011
Q2 Q3 Q4 Q1 2012
Q2 Q3 Q4 Q1 2013
Q2 Q3 Q4 Q1 2014
Q2 Q3 Q4 Q1 2015
Q2 Q3 Q4 Q1 2016
Mid-Point
Grocery Store EBITDA Valuations // Quarterly Range of Mean Highs & Lows
Data Source: S&P Global Market Intelligence

© 2016 Mercer Capital // www.mercercapital.com 4
Mercer Capital’s Value Focus: Convenience Stores Second Quarter 2016
Ticker
Stock Price at 3/31/16
LTM Price Range Equity Market
CapEnterprise
Value
Revenue EBITDA EBITDA Margins
High Low LTM 2016 Est.
2017 Est. LTM
2016 Est.
2017 Est. LTM
2016 Est.
2017 Est.
Convenience Stores
Alimentation Couche Tard Inc ANCUF $43.97 $47.22 $37.00 $24,885 $27,087 $33,810 $34,734 $35,180 $2,004 $1,909 $2,290 5.9% 5.5% 6.5%
Casey's General Stores Inc CASY $120.22 $129.29 $80.44 $4,689 $5,535 $7,299 $7,754 $7,140 $549 $470 $558 7.5% 6.1% 7.8%
TravelCenters of America LLC TA $9.40 $18.10 $6.41 $365 $1,117 $5,851 $6,137 $6,132 $151 $155 $129 2.6% 2.5% 2.1%
CST Brands Inc CST $39.08 $44.58 $29.68 $2,955 $4,411 $11,444 $9,776 $10,152 $476 $416 $402 4.2% 4.3% 4.0%
Murphy USA Inc MUSA $60.74 $73.64 $47.73 $2,532 $3,022 $12,790 $13,172 $12,765 $342 $369 $406 2.7% 2.8% 3.2%
Average C-Stores $7,085 $8,235 $14,239 $14,315 $14,274 $704 $664 $757 4.6% 4.2% 4.7%
Median C-Stores $2,955 $4,411 $11,444 $9,776 $10,152 $476 $416 $406 4.2% 4.3% 4.0%
Grocery Stores
Fresh Market Inc/The TFM $23.42 $41.70 $17.81 $1,099 $1,131 $1,818 $1,755 $1,857 $169 $188 $193 9.3% 10.7% 10.4%
Village Super Market Inc VLGEA $26.08 $33.30 $23.05 $369 $415 $1,594 na na $67 na na 4.2% na nm
SpartanNash Co SPTN $21.53 $33.34 $17.57 $809 $1,357 $7,847 $7,680 $7,699 $197 $225 $231 2.5% 2.9% 3.0%
Weis Markets Inc WMK $43.95 $49.16 $37.14 $1,182 $1,182 $2,877 na na $161 na na 5.6% na nm
Ingles Markets Inc IMKTA $43.89 $57.43 $31.77 $889 $1,814 $3,765 $3,810 $3,761 $237 $241 $239 6.3% 6.3% 6.4%
Whole Foods Market Inc WFM $33.36 $51.70 $28.07 $11,639 $11,704 $15,388 $15,420 $15,963 $1,300 $1,405 $1,349 8.4% 9.1% 8.4%
SUPERVALU Inc SVU $6.78 $12.00 $3.94 $1,797 $4,511 $17,947 $17,826 $17,601 $769 $774 $779 4.3% 4.3% 4.4%
Kroger Co/The KR $41.71 $42.63 $27.17 $40,292 $51,551 $108,872 $108,541 $109,914 $5,608 $5,096 $5,686 5.2% 4.7% 5.2%
Average Grocery Stores $7,260 $9,208 $20,013 $25,839 $26,132 $1,064 $1,322 $1,413 5.7% 6.4% 6.3%
Median Grocery Stores $1,141 $1,586 $5,806 $11,550 $11,831 $217 $508 $509 5.4% 5.5% 5.8%
Source: Bloomberg
Publicly Traded Companies

© 2016 Mercer Capital // www.mercercapital.com 5
Mercer Capital’s Value Focus: Convenience Stores Second Quarter 2016
Ticker
Stock Price at 3/31/16
LTM Price Range Equity Market
CapEnterprise
Value
Revenue EBITDA EBITDA Margins
High Low LTM 2016 Est.
2017 Est. LTM
2016 Est.
2017 Est. LTM
2016 Est.
2017 Est.
Fast Foods (QSR)
McDonald's Corp MCD $117.25 $126.96 $85.41 $106,324 $130,446 $25,413 $25,331 $24,153 $8,701 $8,781 $9,201 34.2% 34.7% 38.1%
Wendy's Co/The WEN $10.70 $11.50 $8.33 $2,925 $5,328 $1,908 $1,871 $1,320 $383 $396 $386 20.1% 21.2% 29.2%
Yum! Brands Inc YUM $72.57 $94.22 $64.58 $30,478 $34,455 $13,105 $13,195 $13,464 $2,668 $2,744 $2,977 20.4% 20.8% 22.1%
Dunkin' Brands Group Inc DNKN $42.32 $55.77 $36.21 $3,921 $6,374 $811 $810 $851 $365 $416 $448 45.0% 51.3% 52.7%
Krispy Kreme Doughnuts Inc KKD $15.07 $20.45 $12.90 $950 $962 $514 $494 $520 $66 $67 $73 12.9% 13.5% 14.0%
Panera Bread Co PNRA $194.78 $220.44 $162.07 $4,817 $5,223 $2,682 $2,686 $2,809 $377 $392 $404 14.1% 14.6% 14.4%
Chipotle Mexican Grill Inc CMG $479.85 $758.61 $399.14 $14,676 $14,676 $4,501 $4,513 $4,367 $894 $884 $415 19.9% 19.6% 9.5%
Jack in the Box Inc JACK $76.38 $97.10 $61.78 $2,733 $3,448 $1,540 $1,543 $1,607 $287 $291 $321 18.6% 18.9% 19.9%
Restaurant Brands International Inc QSR $37.21 $44.12 $29.16 $8,398 $20,417 $4,050 $4,031 $4,104 $1,368 $1,627 $1,713 33.8% 40.4% 41.7%
Sonic Corp SONC $32.18 $35.27 $22.54 $1,586 $2,092 $612 $605 $630 $165 $164 $178 27.0% 27.0% 28.2%
Average Fast Foods $17,681 $22,342 $5,514 $5,508 $5,382 $1,527 $1,576 $1,612 24.6% 26.2% 27.0%
Median Fast Foods $4,369 $5,851 $2,295 $2,279 $2,208 $380 $406 $410 20.2% 21.0% 25.2%
Source: Bloomberg
Publicly Traded Companies (continued)

© 2016 Mercer Capital // www.mercercapital.com 6
Mercer Capital’s Value Focus: Convenience Stores Second Quarter 2016
According to OPIS, nationwide retail gasoline margins ended the first quarter of 2016 at 12.8 cents per gallon, down from
24.8 cents per gallon 12 weeks earlier, and below the historical five-year average of 19.7 cents.2 Between the end of
the first quarter and the time of this publication, retail fuel margins have rebounded to approximately 25 cents per gallon,
as shown in the chart below. Fuel retailers are facing a difficult environment in which retail price increases cannot keep
pace with wholesale price increases. Fuel prices increased approximately a penny per day during March, but remain
at their lowest levels since 2009. Diesel margins ended the fourth quarter at 26.9 cents per gallon, down from a 54.2
cent margin twelve weeks earlier. The chart below presents the relationship between retail gasoline prices and margin.
C-Store TrendsMargins
2 National Association of Convenience Stores 2016 Retail Fuels Report.
$0.00
$0.50
$1.00
$1.50
$2.00
$2.50
$3.00
$3.50
$4.00
$4.50
$5.00
$0.00
$0.05
$0.10
$0.15
$0.20
$0.25
$0.30
$0.35
1999 2001 2003 2005 2007 2009 2011 2013 2015 May '15
July '15
Sept '15
Nov '15
Jan '16
Mar '16
May '16
July '16
Gasoline Margin Retail Price Sources: NACS, OPIS & EIA
12 Months Ended March 31, 2016
Following the End of Q1
1999 - 2015
Gasoline Price and Spread Per Gallon

© 2016 Mercer Capital // www.mercercapital.com 7
Mercer Capital’s Value Focus: Convenience Stores Second Quarter 2016
C-Store TrendsMargins
Generally, over 70% of a C-store’s sales are motor fuels; however, fuel typically contributes only one-third of total
convenience store gross margin dollars. Despite periodic fluctuations, fuel margins have been relatively consistent on
an annual basis, averaging 19.7 cents per gallon for 2011 through 2015. There is a relatively modest delay between
the time crude prices increase and the time that pump prices rise. Similarly, retail price reductions typically lag when
wholesale prices drop. Retailers tend to reduce their markups when costs are escalating. Conversely, when costs are
declining, retailers tend to leave their pump prices elevated – leading to increased fuel margins – until competition forces
pump pricing downward. The time lag between cost changes and retail price adjustments, as well as the duration of
cost trends, are significant influencers of operator margin. On average, it costs retailers approximately 12 to 16 cents
to dispense a gallon of fuel. Given that the average five-year markup on gasoline was 19.7 cents, this translates to a
typical three to seven cents per gallon of bottom line profit.

© 2016 Mercer Capital // www.mercercapital.com 8
Mercer Capital’s Value Focus: Convenience Stores Second Quarter 2016
Swipe Fees
Walmart, Kroger, and Home Depot have recently filed lawsuits against Visa regarding the rules surrounding chip
debit cards. The retail giants argue that chip and PIN technology is a more secure payment method, and stores should
be able to require a PIN entry. As it stands, the stores are required to accept only a customer signature as validation.
Walmart also argues that the electronic signature verification is more expensive with Visa than the alternative PIN-
based method. Walmart Canada is no longer accepting Visa cards. Home Depot has also filed suit against MasterCard.
The Second Court of Appeals overturned the class-action settlement from 2012 related to Visa/MasterCard lawsuits
regarding the reasonableness of swipe fees. The court ruled that the settlement was inadequate.
H.R. 5465, which would repeal the 2010 Durbin Amendment, was recently introduced. A majority of retailers
(including NACS) are opposed to the repeal as it would likely lead to substantially higher fees being borne by retailers
and ultimately consumers. As it stands, the Durbin Amendment requires that banks impose fees that are reasonable and
proportionate to the cost of processing the transaction. According to the National Retail Federation, 89% of consumers
do not support a repeal of the Durbin Amendment. With the current laws in place, U.S. retailers still pay the highest
swipe fees in the world.
Wages
The DOL finalized its new overtime rules in May. The new rules are slated to go into effect in December 2016. The
current exemption (the dollar compensation level above which overtime rules would not apply) would nearly double
under the new statutes. The NACS and other retail consortiums are opposed to the new rules, and continue to actively
lobby for the rules to be withdrawn.
The Seattle minimum wage is set to increase to $15 per hour. Businesses with more than 500 employees have until
2017 to comply, but companies below this threshold will be given an additional three to four years. The International
Franchise Association argues that the relevant employee count for a franchisee’s business should be the local
franchisee’s employee count, but both the U.S. District Court and the Ninth Circuit Court of appeals determined that
the employee count of the franchisor will be considered the applicable amount. Opponents say that the lower court’s
decision inappropriately burdens franchisees which often operate more like small businesses. SCOTUS elected not
to hear an appeal regarding Seattle’s higher minimum wage law’s applicability to franchises. This effectively ends the
matter, but a similar suit has been filed in New York.
C-Store TrendsGovernment and Regulatory

© 2016 Mercer Capital // www.mercercapital.com 9
Mercer Capital’s Value Focus: Convenience Stores Second Quarter 2016
Tobacco
The FDA issued its new regulations in May. The new regulations put cigars, chewing tobacco, and most, if not
all, e-cigarette and vaping products under the purview of the FDA. Under the terms of the regulations, any product
introduced to the market after February 15, 2007 must file an application for permission to market and sell the product.
A slew of industry associations and individual retailers have filed suit in response alleging government overreach, and
there is some controversy regarding what actually constitutes a “tobacco product”. Some manufacturers utilize nicotine-
like substances obtained from non-tobacco plants to create the vaping liquid, so those manufacturers argue that they
should be exempt from the regulations. There is a movement in Congress to make the February 2007 date more current
in order to exclude additional products.
C-Store TrendsGovernment and Regulatory (continued)

© 2016 Mercer Capital // www.mercercapital.com 10
Mercer Capital’s Value Focus: Convenience Stores Second Quarter 2016
Recent M&A Activity
The following table summarizes M&A activity since the publication of our last newsletter. In addition to the major
transactions listed, there were several transactions involving 50 or fewer units since our last publication. 2014 and 2015
were busy in terms of M&A activity, but overall activity seems to be slowing.
Acquirer Target # of Stores Locations Comments
7-Eleven CST Brands, Inc. 79 c-stores California, WyomingTransaction completed; $408 million closing price
Island Energy Services
Chevron USA58 c-stores and certain other assets
HawaiiExpected to close during the second half of 2016; stations to be rebranded as Texaco stores
7-Eleven Imperial Oil 148 c-stores CanadaThe Esso-branded stations are expected to be converted to 7-Eleven's brand
Croton Holding Co. Par Mar Oil Co.
52 c-stores, several car washes, 16 quick-service restaurants
Ohio, Kentucky, West Virginia
NA
Sun Capital Partners affiliate
Admiral Petroleum 139 c-stores Michigan, Indiana NA
Dollar General Walmart Express 41 c-stores across 11 statesRepresents Dollar General's first foray into the fuel market
Travel Centers of America
Quaker Steak & Lube
10 operated sites; 40 franchisee or licensee sites
North America NA
Western RefiningNorthern Tier Energy
260+ c-storesMost in Minnesota and Wisconsin
Western Refining already owns a majority stake in Northern Tier Energy
Source: Convenience Store Decisions

© 2016 Mercer Capital // www.mercercapital.com 11
Mercer Capital’s Value Focus: Convenience Stores Second Quarter 2016
Acquirer Target # of Stores Locations Comments
Alimentation Couche-Tard
A/S Dansk Shell
286 company-operated stores; 197 dealer owned or operated stores; 211 automated sites
Denmark6th largest acquisition in Couche-Tard's history
NATravel Centers of America
NA NATA rejected a buyout offer from a private equity firm; deal value approximately $540 million
The Guess Corp. is planning to acquire c-stations
1,000+ c-stores North AmericaActual purchaser would be a Guess Corp. subsidiary; purchases will be over the course of the next year
CST Brands, Inc. accepting offers for a potential sale
3,000+ c-stores North AmericaBidders include 7-Eleven, Couche-Tard, several private equity firms
Pilot Flying J and Speedway LLC formed a joint venture - SFJ Southeast
121 travel centers Mostly Southeast41 locations contributed by Speedway; 79 locations contributed by Pilot Flying J
Loblaw Cos. Ltd. looking for buyers of its retail sites
212 retail fuel sites located adjacent to grocery stores
Canada NA
Global Partners, LP looking to sell assets 86 sites Northeastern market NA
Source: Convenience Store Decisions
Recent M&A Activity (continued)
© 2016 Mercer Capital // www.mercercapital.com 12
Mercer Capital’s Value Focus: Convenience Stores Second Quarter 2016
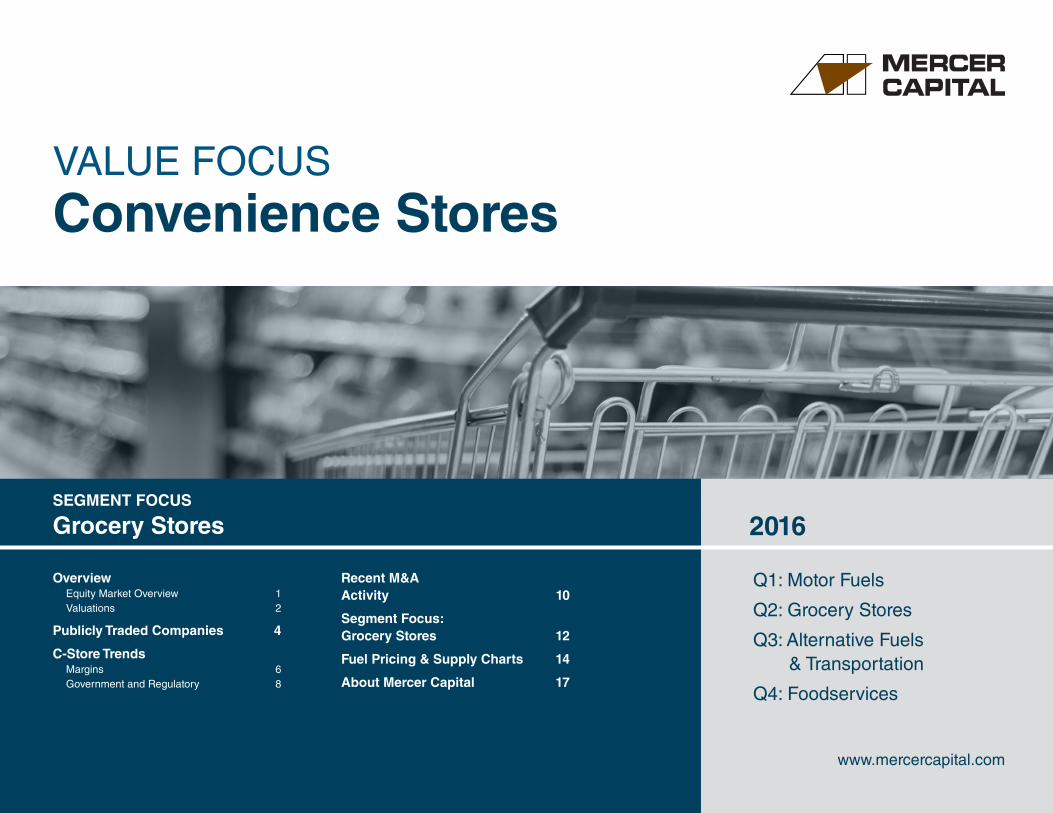
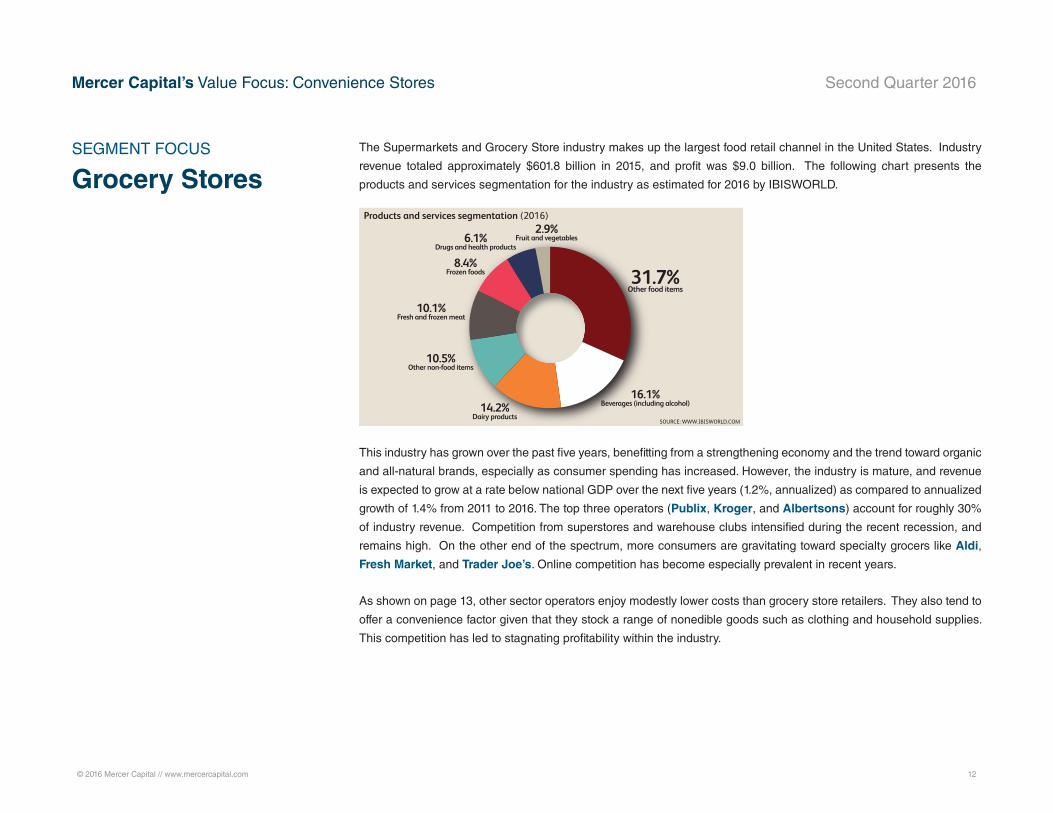
Grocery StoresSEGMENT FOCUS The Supermarkets and Grocery Store industry makes up the largest food retail channel in the United States. Industry
revenue totaled approximately $601.8 billion in 2015, and profit was $9.0 billion. The following chart presents the
products and services segmentation for the industry as estimated for 2016 by IBISWORLD.
This industry has grown over the past five years, benefitting from a strengthening economy and the trend toward organic
and all-natural brands, especially as consumer spending has increased. However, the industry is mature, and revenue
is expected to grow at a rate below national GDP over the next five years (1.2%, annualized) as compared to annualized
growth of 1.4% from 2011 to 2016. The top three operators (Publix, Kroger, and Albertsons) account for roughly 30%
of industry revenue. Competition from superstores and warehouse clubs intensified during the recent recession, and
remains high. On the other end of the spectrum, more consumers are gravitating toward specialty grocers like Aldi,
Fresh Market, and Trader Joe’s. Online competition has become especially prevalent in recent years.
As shown on page 13, other sector operators enjoy modestly lower costs than grocery store retailers. They also tend to
offer a convenience factor given that they stock a range of nonedible goods such as clothing and household supplies.
This competition has led to stagnating profitability within the industry.
WWW.IBISWORLD.COM Supermarkets & Grocery Stores in the US May 2016 4
% c
hang
e
4
-4
-2
0
2
2109 11 13 15 17 19Year
Per capita disposable income
SOURCE: WWW.IBISWORLD.COM
% c
hang
e
4
-2
-1
0
1
2
3
2208 10 12 14 16 18 20Year
Revenue Employment
Revenue vs. employment growth
Products and services segmentation (2016)
31.7%Other food items
8.4%Frozen foods
16.1%Beverages (including alcohol)
6.1%Drugs and health products
2.9%Fruit and vegetables
14.2%Dairy products
10.5%Other non-food items
10.1%Fresh and frozen meat
SOURCE: WWW.IBISWORLD.COM
Key Statistics Snapshot
Industry at a GlanceSupermarkets & Grocery Stores in 2016
Industry Structure Life Cycle Stage Mature
Revenue Volatility Low
Capital Intensity Low
Industry Assistance Low
Concentration Level Low
Regulation Level Medium
Technology Change Medium
Barriers to Entry Medium
Industry Globalization Low
Competition Level High
Revenue
$601.8bnProfit
$9.0bnWages
$59.7bnBusinesses
42,539
Annual Growth 16-21
1.2%Annual Growth 11-16
1.4%
Key External DriversPer capita disposable incomeAgricultural price indexUrban populationHealthy eating index
Market ShareThe Kroger Co. 16.1%
Albertsons LLC 9.7%
Publix Super Markets Inc. 5.6%
p. 25
p. 5
FOR ADDITIONAL STATISTICS AND TIME SERIES SEE THE APPENDIX ON PAGE 35
SOURCE: WWW.IBISWORLD.COM

© 2016 Mercer Capital // www.mercercapital.com 13
Mercer Capital’s Value Focus: Convenience Stores Second Quarter 2016
The industry is mature and continues to consolidate. Merger and acquisition activity among the larger players has been
high in the past few years. The Kroger Company merged with Harris Teeter in 2014 to expand within the Southeast and
Mid-Atlantic market areas and create a network of over 2,600 stores. Kroger also acquired Roundy’s in 2015 adding
151 stores to its network. Safeway and Albertsons merged in early 2015 to create a nationwide network of over 2,200
stores. This is an industry in which economies of scale are crucial; larger size helps enterprises better compete with
mass merchandisers by lowering per-unit costs. The grocery store industry has been facing increasing competition
from superstores and discount warehouse clubs, such as Wal-Mart. According to Wal-Mart’s 10-K for the fiscal year
ended January 31, 2016, grocery store segment revenues were 56% of total company revenues. Supermarkets are also
increasingly facing competition from convenience stores, food service providers, and dollar stores.
Grocery Stores (continued)
WWW.IBISWORLD.COM Supermarkets & Grocery Stores in the US May 2016 22
Competitive Landscape
Basis of Competition Internal competitionSupermarket and grocery store operators fiercely compete for the consumer’s dollar in an increasingly competitive food retailing sector. Due to the homogeneous nature of the goods sold at supermarkets, industry participants compete on price by offering discounts and promotions in addition to customer loyalty awards. Supermarkets rely on a large volume of sales with low markups and offer generic- or store-branded food items that are less expensive than branded products to drive sales. Most stores offer weekly savings on popular products to entice new consumers.
Other than lower prices, grocery stores must attract customers with the range and quality of products they offer. Industry players who offer an extended range of goods cater to a larger consumer
base from both low- and high-income households. However, if grocery stores price their high-quality products too high, they risk losing sales, even from high-income households. In the years following the recession, private label products have maintained their popularity among consumers. In particular, higher-end generic goods, such as Whole Foods’ 365 organic line of products, have enjoyed increasing sales as consumers seek affordability and value. Consequently, retailers that offer a range of private label products have benefited from improved sales and margins.
Supermarkets offer a variety of products and services, aside from traditional grocery and nonedible products. For instance, through its partnership with Starbucks, Safeway
Sector vs. Industry Costs
n Profi tn Wagesn Purchasesn Depreciationn Marketingn Rent & Utilitiesn Other
Average Costs of all Industries in sector (2016)
Industry Costs (2016)
0
20
40
60
Perc
enta
ge o
f rev
enue
80
100
SOURCE: WWW.IBISWORLD.COM
3.2 1.5
9.63.8 1.00.9
73.3
9.9
10.04.3 1.51.1
70.7
9.1
Level & Trend Competition in this industry is High and the trend is Increasing
Cost Structure Benchmarks continued
WWW.IBISWORLD.COM Supermarkets & Grocery Stores in the US May 2016 25
Player Performance The Kroger Company was founded in 1883 and is the largest grocery store chain in the United States. Headquartered in Cincinnati, the retailer employs 431,000 people throughout the United States. The company operates one retail segment, which includes its retail food and drug stores, multidepartment stores, jewelry stores and convenience stores. Along with its retail business, Kroger operates 38 manufacturing facilities where it produces a variety of private label goods, primarily baked goods and dairy products, which are sold at its retail outlets.
Kroger participates in the Supermarkets and Grocery Stores industry through its food and drug stores segment and multidepartment stores. The company operates more than 2,770 supermarkets and grocery stores across the United States. Kroger trades under 24
brand names across 35 states. Also, the company uses private labels as a way to differentiate its products and compete against other industry players. The company sells about 13,000 private-label items in three tiers: Private Selection is the premium-quality private label, offering food and beverages that cater to consumers’ specific gourmet tastes; the midrange Banner brand makes up the majority of private-label sales; and Kroger Value maintains an emphasis on price.
Over the past five years, Kroger has focused on driving sales productivity in markets that it already operates in, as well as expanding through strategic acquisitions. Since Kroger is the largest grocery retailer, it aims to acquire companies in locations where it can expand its market share. For instance, in 2011, the company acquired eight stores
Major CompaniesThe Kroger Co. | Albertsons LLC Publix Super Markets Inc. | Other Companies
68.6%Other
The Kroger Co. 16.1%
Albertsons LLC 9.7%
Publix Super Markets Inc. 5.6%
SOURCE: WWW.IBISWORLD.COM
Major players(Market share)
The Kroger Co. (industry-specifi c, excluding fuel centers) - fi nancial performance
Year*Revenue
($ million) (% change)Operating Income
($ million) (% change)
2011-12 72,742.4 N/C 2,146.8 N/C
2012-13 77,748.8 6.9 2,224.2 3.6
2013-14 76,666.0 -1.4 2,123.7 -4.5
2014-15 86,281.0 12.5 2,495.4 17.5
2015-16 91,310.0 5.8 2,973.0 19.1
2016-17** 96,628.4 5.8 3,285.4 10.5
*Year-end January; **Estimates SOURCE: ANNUAL REPORT
The Kroger Co. Market share: 16.1% Industry Brand Names Dillons Food 4 Less Kroger Owen’s Pay Less Super Markets Smith’s Ralph’s Harris Teeter

© 2016 Mercer Capital // www.mercercapital.com 14
Mercer Capital’s Value Focus: Convenience Stores Second Quarter 2016
Wholesale and Retail Prices
Motor Fuel and Brent Crude Price Fluctuation
$0.00 $0.50 $1.00 $1.50 $2.00 $2.50 $3.00 $3.50 $4.00 $4.50 $5.00
$20
$40
$60
$80
$100
$120
$140
Mar-11
Jun-1
1
Sep-11
Dec-11
Mar-12
Jun-1
2
Sep-12
Dec-12
Mar-13
Jun-1
3
Sep-13
Dec-13
Mar-14
Jun-1
4
Sep-14
Dec-14
Mar-15
Jun-1
5
Sep-15
Dec-15
Mar-16
Price/Gallon Price/Barrel
WTI Brent Gasoline Diesel
-0.2
-0.15
-0.1
-0.05
0
0.05
0.1
0.15
0.2
Mar-11
Jun-1
1
Sep-11
Dec-11
Mar-12
Jun-1
2
Sep-12
Dec-12
Mar-13
Jun-1
3
Sep-13
Dec-13
Mar-14
Jun-1
4
Sep-14
Dec-14
Mar-15
Jun-1
5
Sep-15
Dec-15
Mar-16
Price Volatility
Gasoline Brent Diesel
Data Source: Calculated by Mercer Capital from raw data obtained from the US Energy Information Administration (EIA.gov)
Data Source: Calculated by Mercer Capital from raw data obtained from the US Energy Information Administration (EIA.gov)
Fuel Pricing & Supply Charts

© 2016 Mercer Capital // www.mercercapital.com 15
Mercer Capital’s Value Focus: Convenience Stores Second Quarter 2016
U.S. Ending Stocks of Crude Oil
Thousand Barrels
Prime Supplier Sales Volumes
1,000,000
1,050,000
1,100,000
1,150,000
1,200,000
1,250,000
Jan-1
1
Apr-11
Jul-1
1
Oct-11
Jan-1
2
Apr-12
Jul-1
2
Oct-12
Jan-1
3
Apr-13
Jul-1
3
Oct-13
Jan-1
4
Apr-14
Jul-1
4
Oct-14
Jan-1
5
Apr-15
Jul-1
5
Oct-15
Jan-1
6
Apr-16
U.S. Ending Stocks of Crude Oil (Thousand Barrels)
-
50,000
100,000
150,000
200,000
250,000
300,000
350,000
400,000
Gas
Diesel
Gas
Diesel
Gas
Diesel
Gas
Diesel
Gas
Diesel
Gas
Diesel
Gas
Diesel
Gas
Diesel
Gas
Diesel
Gas
Diesel
Gas
Diesel
Gas
Diesel
Gas
Diesel
Gas
Diesel
Gas
Diesel
Gas
Diesel
Gas
Diesel
Gas
Diesel
Gas
Diesel
Gas
Diesel
Gas
Diesel
Gas
Diesel
Gas
Diesel
Gas
Diesel
Gas
Diesel
2010 2011 2012 2013 2014 2015 Oct '14
Nov '14
Dec '14
Jan '15
Feb '15
Mar '15
Apr '15
May '15
June '15
July '15
Aug '15
Sept '15
Oct '15
Nov '15
Dec '15
Jan '16
Feb '16
Mar '16
Apr '16
000'
s G
allo
ns/D
ay
Regular Mid-Grade Premium Diesel
Data Source: US Energy Information Administration (EIA.gov)
Data Source: US Energy Information Administration (EIA.gov)
Fuel Pricing & Supply Charts (continued)

© 2016 Mercer Capital // www.mercercapital.com 16
Mercer Capital’s Value Focus: Convenience Stores Second Quarter 2016
Non-Motor Fuel Prices
$0.00
$0.50
$1.00
$1.50
$2.00
$2.50
$3.00
$3.50
$4.00
$4.50
Mar-10
Jun-1
0
Sep-10
Dec-10
Mar-11
Jun-1
1
Sep-11
Dec-11
Mar-12
Jun-1
2
Sep-12
Dec-12
Mar-13
Jun-1
3
Sep-13
Dec-13
Mar-14
Jun-1
4
Sep-14
Dec-14
Mar-15
Jun-1
5
Sep-15
Dec-15
Mar-16
Price/Gallon
No. 2 Heating Oil Propane
Data Source: US Energy Information Administration (EIA.gov)
Fuel Pricing & Supply Charts (continued)
Percentage Change in Non-Motor Fuel Spread by Month
-12% -10% -8% -6% -4% -2% 0% 2% 4% 6% 8%
10%
1/4/20
16
1/11/2
016
1/18/2
016
1/25/2
016
2/1/20
16
2/8/20
16
2/15/2
016
2/22/2
016
2/29/2
016
3/7/20
16
3/14/2
016
3/21/2
016
3/28/2
016
% +/- in Heating Oil Spread % +/- Inc/Dec in Propane Spread
Data Source: US Energy Information Administration (EIA.gov)

Mercer CapitalConvenience Store Industry Services
Contact Us
Copyright © 2016 Mercer Capital Management, Inc. All rights reserved. It is illegal under Federal law to reproduce this publication or any portion of its contents without the publisher’s permission. Media quotations with source attribution are encouraged.
Reporters requesting additional information or editorial comment should contact Barbara Walters Price at 901.685.2120. Mercer Capital’s Industry Focus is published quarterly and does not constitute legal or financial consulting advice. It is offered as an
information service to our clients and friends. Those interested in specific guidance for legal or accounting matters should seek competent professional advice. Inquiries to discuss specific valuation matters are welcomed. To add your name to our mailing list
to receive this complimentary publication, visit our web site at www.mercercapital.com.
Mercer Capital provides the multi-unit retailing and QSR industries with corporate valuation, financial reporting, transaction advisory, and related services.
Industry Segments
Mercer Capital serves the following industry segments:
• Motor Fuels
• Grocery Stores
• Alternative Fuels & Consumer Transportation
• Foodservices
Mercer Capital Experience
• Family and management succession planning
• Buy-side and sell-side transaction advisory assistance
• Conflict resolution and litigation support
• Trust and estate planning
• Buy-sell agreement valuation, design, and funding advisory
Contact a Mercer Capital professional to discuss your needs in confidence.
Eden G. Stanton, CFA
901.270.7250
Timothy R. Lee, ASA
901.322.9740
MERCER CAPITAL
Memphis
5100 Poplar Avenue, Suite 2600
Memphis, Tennessee 38137
901.685.2120
Dallas
12201 Merit Drive, Suite 480
Dallas, Texas 75251
214.468.8400
Nashville
102 Woodmont Blvd., Suite 231
Nashville, Tennessee 37205
615.345.0350
www.mercercapital.com
BUSINESS VALUATION & FINANCIAL ADVISORY SERVICES