Embed Size (px)
Citation preview
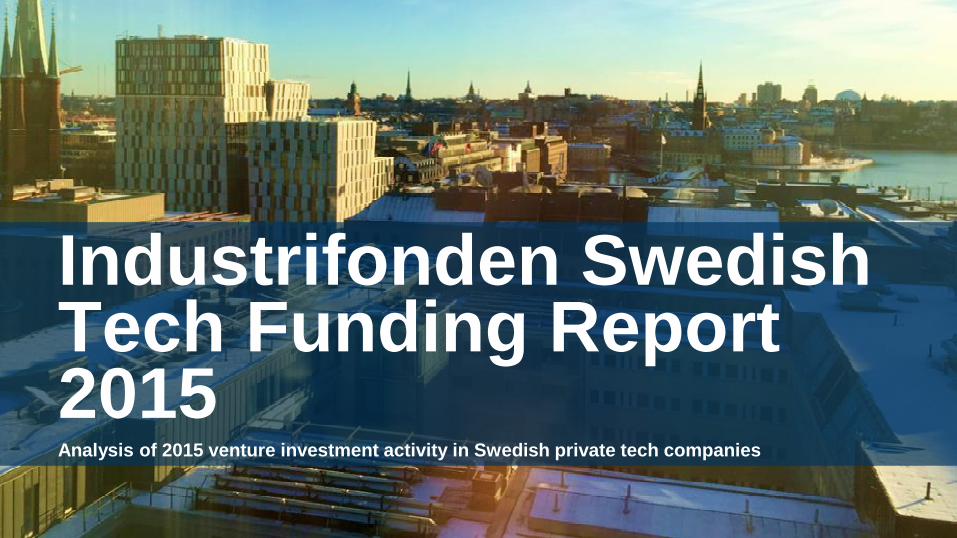
Analysis of 2015 venture investment activity in Swedish private tech companies
Industrifonden Swedish Tech Funding Report 2015
2
Industrifonden is a Swedish venture capital fund, investing in early-stage tech and
life science growth companies. Founded in 1979, Industrifonden is a reinvesting
evergreen fund with SEK 4 billion (~$480M) in assets.
About Industrifonden.
industrifonden.com
@industrifonden
/company/industrifonden
Copyright Industrifonden

3
With 2015 in the books, we look back on a year where the Swedish
startup scene truly consolidated its position as a force to be reckoned
with. 2015 saw countless publications naming Sweden the new startup
center and records were broken over and over again.
As always, building a global company requires deep pockets and 2015
saw a massive influx of venture capital to Swedish tech companies
looking to do just that. In the wake of negative interest rates combined
with a number of high profile tech startups reaching unicorn status,
asset managers from all sectors and geographies turned to tech
companies in search of returns. Adding to this, a number of large
venture funds aiming to cover the Nordic tech scene launched during
the year, resulting in more capital invested and more deals per capita
than the rest of Europe’s top performing countries.
The last quarter of the year did show a cool-down in terms of larger
funding rounds, while the high levels of smaller rounds seen in Q2 and
Q3 remained and even increased further. Companies in the seed
stage had a range of investors to choose from – it was rather the later-
stage companies that could experience difficulties in raising their next
round. Whether this was just a small hiccup or a response to soaring
valuations in the tech sector combined with general apprehension in
capital markets following increased volatility will be determined in the
first half of 2016.
The year ended with a total of $1.1 billion invested across 175
disclosed funding rounds. More than 250 investors participated in
funding Swedish tech startups. The majority of the deals were made
by local angel investors and VC firms.
Summary.
Copyright Industrifonden
Note: This report only covers investment activity, not exits. Therefore, the terms ‘deal’ and ‘funding round’ are used interchangeably throughout the report.

4
Q4 Highlights
Copyright Industrifonden

5
Q4 brought a record number of disclosed investments, but also a notable
shift towards smaller rounds. Q4 saw 30 percent more funding rounds
compared to Q3 and the quarter accounted for 35 percent of all
disclosed deals in 2015.
However, the investment sizes plunged with an average Q4 funding
round size of $1.9M. This is a significant decrease, indicating a 65
percent drop compared to the average Q3 funding round. Noteworthy is
that it was not just the increase in smaller funding rounds that pushed
down Q4 averages. Looking at the top five largest deals for each
quarter, Q4 is at the very bottom in terms of deal sizes. Q4 is also at the
bottom in terms of median deal sizes, with a median round of $0.7M –
half the size of the Q2 median of $1.4M but closer to the Q3 median
round of $0.8M.
As total deal count shows, it is clear that interest in the Swedish tech
scene remains at record-high levels. The clear decrease of larger deals
in Q4 is noteworthy however, as it could be a first indication of a gap in
expectations between founders and institutional investors following
soaring valuations throughout the year.
Q4: More deals, less cash
0
10
20
30
40
50
60
70
Q1 Q2 Q3 Q4
Increasing number of deals…Deal count
0%
10%
20%
30%
40%
50%
60%
70%
Q1 Q2 Q3 Q4
…but less capital raised compared to Q2-Q3% of total
Copyright Industrifonden

6
2015: The juggernaut year
Copyright Industrifonden

7
$1.1B(SEK 9.4B) raised during 2015
175Funding rounds
$1MMedian deal size
2011Median year a company that received
investment during 2015 was founded
57%Increase in mentions of ’startup’ or ’start-up’
in Swedish media compared to 2014
Source: Industrifonden database, Dow Jones EMEA Venture Capital Report, Dealroom.co, Retriever
1.7xCapital invested per capita in Swedish tech
startups 2015 compared to the UK
Copyright Industrifonden
8
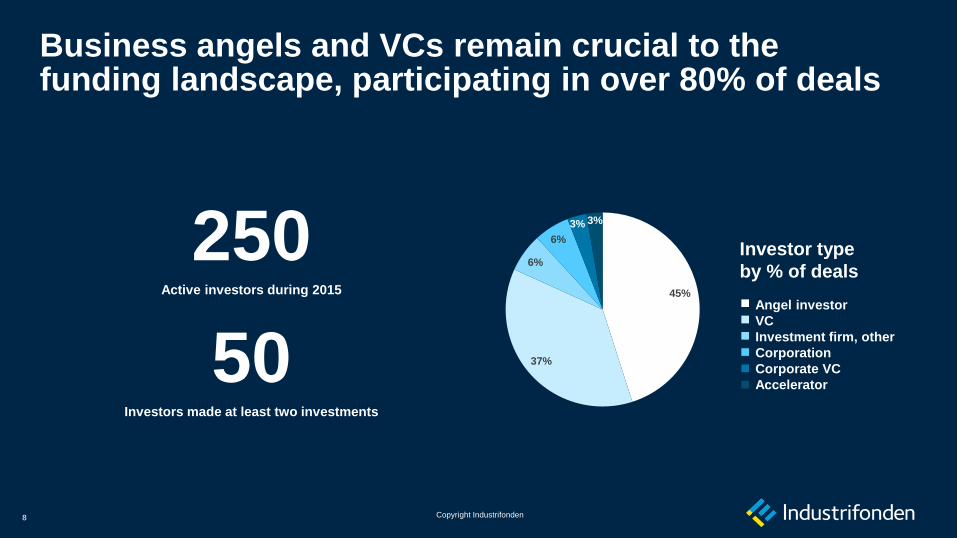
250Active investors during 2015
50Investors made at least two investments
Investor type
by % of deals
Angel investor
VC
Investment firm, other
Corporation
Corporate VC
Accelerator
45%
37%
6%
6%
3% 3%
Business angels and VCs remain crucial to the funding landscape, participating in over 80% of deals
Copyright Industrifonden

9
60%
Top 20 most active investors involved in 60% of all deals
Top 20 funding rounds make up 80% of total disclosed deal value
80%
Top 20 funding rounds as % of total deal value Top 20 most active investors’ deal count as % of total deal count
Copyright Industrifonden 2015Copyright Industrifonden

10
Quarterly breakdown: Increasing total deal count quarter-over-quarter, but fewer large funding rounds
Note: The inflated average (mean) deal size in Q2 2015 is mainly due to Spotify’s >$500m Series G financing
Deal count$M Deal count
0
10
20
30
40
50
60
70
0
2
4
6
8
10
12
14
16
Q1 2015 Q2 2015 Q3 2015 Q4 2015
Average deal size Median deal size Deal count
0
5
10
15
20
25
30
35
Q1 2015 Q2 2015 Q3 2015 Q4 2015
≤$1M $1.1 - 5M $5.1-25M >$25M
Copyright Industrifonden

11
Finance, Media, and SaaS most popular verticals by number of funding rounds
Top 3 verticals by deal count
12% 11% 11%
Note: Deal count as percentage of total
Software-as-a-Service (SaaS)MediaTechFinTech
Copyright Industrifonden

12
The international context
Copyright Industrifonden

13
Foreign investors active in later stages – founders rely on local investors for launch and early growth
Average share of
funding rounds
with foreign
participation 2015
Foreign
investors
by country
USA
UK
Rest of World
Germany
Denmark
Finland
32%
33%
25%
19%
10%
7%
6%
0
10
20
30
40
50
60
70
80
90
0%
10%
20%
30%
40%
50%
60%
70%
80%
90%
100%
≤$1M $1.1 - 5M $5.1 - 25M >$25M
Funding rounds with foreign participation
Foreign participation % Total deal count
Deal count
Deal size
Copyright Industrifonden

14
Sweden ranks #1 in invested capital and deals per capita compared to peers
0
20
40
60
80
100
120
Sweden UK Germany France
$ raised per capita Q1-Q4 2015
0,000000
0,000002
0,000004
0,000006
0,000008
0,000010
0,000012
0,000014
Sweden UK France Germany
Deals per capita Q1-Q3 2015
Source: Industrifonden database, Dow Jones EMEA Venture Capital Reports 1Q-3Q 2015, Dealroom.co. Note: UK, France and Germany ranked top three in Europe on deal count and
capital raised. Data for amount raised for UK, Germany and France calculated as average of Dow Jones’ and Dealroom’s data for Q1-Q3 and Dealroom’s for Q4. Data for number of deals
for UK, France and Germany: Dow Jones. Differences in data collection methods and level of completeness may impact the comparison
Copyright Industrifonden

15
What’s included• This report covers disclosed venture investments in Swedish
private tech companies
• Analysis primarily based on proprietary database with 175
funding rounds from 2015, sorted on date of disclosure
• 10+ parameters including deal size, stage, investors and
vertical
• Both first-time and follow-on investments
• Deals are tracked in SEK. If originally reported in other
currencies, conversion is based upon exchange rate per date
of disclosure. Aggregate figures are subject to change due to
currency fluctuation
What’s not included• Investments in life science, med tech, bio tech, retail, and consulting
• Secondary investments and M&A deals
• Investments in public companies of any kind
• Grants, bank loans and other types of funding that is not intended to
result in ownership
For more information, contact:Björn Bergström, [email protected]
The information contained in this report has not been independently verified as to its accuracy. No representation or
warranty, express or implied, is given by Industrifonden or any of its directors, partners, officers, affiliates, employees,
advisers or agents as to the accuracy or completeness of the contents of this report or any other document or
information supplied or any opinions or projections expressed herein or therein, nor is any such party under any
obligation to update the report or correct any inaccuracies or omissions in it which may exist or become apparent.
Methodology
Copyright Industrifonden

Stay in touch.industrifonden.com
@industrifonden
/company/industrifonden