Embed Size (px)
Citation preview

aegon.com
Individual Savings & Retirement
Analyst & Investor Conference
New York City – June 25, 2014
Tom Swank David Hopewell
CEO CFO

2
Transformed and positioned for future success
Individual Savings & Retirement has made the transition to fee based businesses
► Mutual funds: accelerating earnings and rising sales
► Variable annuities: 2013 saw all time high sales with strong margins
► Adding enterprise value: nearly half of 2013 fee sales managed by Aegon Asset Management
Variable Annuity has been managed into a higher earning and lower risk business
► Strong new business benefiting from product transformation, rapid repricing, and good macro conditions
► Inforce management has improved both earnings and tail risk without substantially impacting sales
Fixed annuity spreads remain strong – liquidity needs building as block matures
► Earnings have exceeded expectations as lower rates drive lower liability costs
► Operational free cash flow benefits from high margins and stable balance decline
3
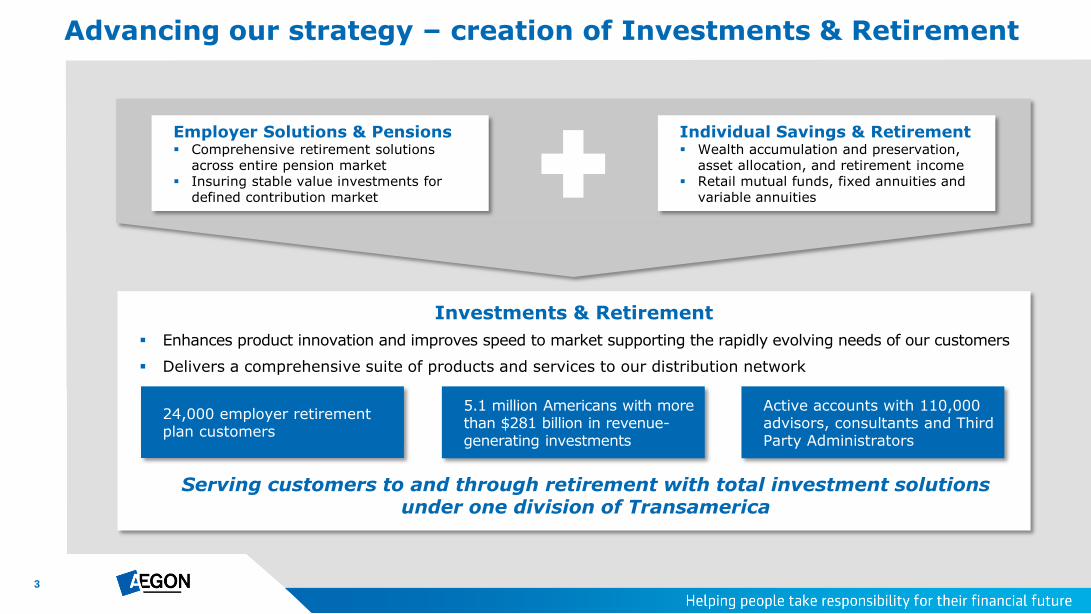
Advancing our strategy – creation of Investments & Retirement
Investments & Retirement
Enhances product innovation and improves speed to market supporting the rapidly evolving needs of our customers
Delivers a comprehensive suite of products and services to our distribution network
Individual Savings & Retirement Wealth accumulation and preservation,
asset allocation, and retirement income Retail mutual funds, fixed annuities and
variable annuities
Employer Solutions & Pensions Comprehensive retirement solutions
across entire pension market Insuring stable value investments for
defined contribution market
24,000 employer retirement plan customers
Active accounts with 110,000 advisors, consultants and Third Party Administrators
Serving customers to and through retirement with total investment solutions under one division of Transamerica
5.1 million Americans with more than $281 billion in revenue-generating investments

4
Effective execution supports strong current results with momentum
Execution of our strategic priorities
Execution in product portfolio
management innovation
First to market with tiered VA equity pricing
First to market with volatility adjusted funds
Rapid VA re-pricing
Focused on unique retail sub-advised mutual funds
Alternative Lump Sum Offering approach is successful in transforming outcomes from the GMIB book
Maintain low-cost position in the annuity industry through targeted non-customer-facing and back-office efficiency
Continued focus on mutual fund operating efficiency
Improve customer service by segmenting service proposition and instituting loyalty programs – Platinum advisors sales up 126% 2013 over 2012
Predictive modeling to increase sales effectiveness and influence customer behavior
Continued focus on operational excellence
Private label product in channels that do not conflict with existing customers or distributors
Introduced variable annuity in the 401(k) market with SecurePath for Life product
Pioneered new partnership relationship with ARIA
Adding new mutual fund channels – added 25 retirement platforms in 2013
Develop new channels to leverage platform
Deepening relationships with existing advisors – VA sales up 59%, MF sales up 26% 2013 vs. 2012
Growing number of producers selling VAs – up 77% 2013 vs. 2012 – not buying share but winning converts
Cross-selling both product lines - # cross-selling producers up 29% and sales up 88% 2013 vs. 2012
Strong service and administration teams increasing segmentation to improve loyalty
Grow in traditional distribution channels

5
Variable annuity: a higher earning and lower risk business
Strong new business profile continues to add to value of inforce
► Product transformation has benefited both margin and risk of new business
► Rapid repricing effectively balances volume and margin, maintaining appetite for growth
► Good macro conditions with firm product pricing
Inforce management has improved earnings and tail risk with little impact on sales
Settlement option results to date support long term improvement in cost, equity risk, and rate sensitivity of 2002-2003 GMIB block
Improved capital protection from broad use of volatility control funds and capital targeted hedging

6
2.0 2.2 2.7 2.9 3.4 4.6 4.5
7.5
0.9 1.0 0.7 0.4 0.4
0.7 0.9
1.0
0%
2%
4%
6%
Traditional
Alternative channels
VA market share*
-35%
0%
35%
70%
2006 2007 2008 2009 2010 2011 2012 2013
Transamerica Industry*
Growth at the right time in variable annuities
Growth in traditional and alternative channels
Higher market share: solutions focused wholesaling force
Growing productivity through a targeted firm strategy and Advisor Intelligence Model (AIM)
Increasing private label production partners to 6 with most recent addition of Voya
Testing new markets – 401(k), ARIA, and high benefit lower comp traditional product
Higher margins: process innovation and platform extension
Repricing speed to market reduces low ROA sales and allows for opportunistic growth, as in 2013
Over 40% of variable annuity sales to internally managed funds in 2013
First to market with:
– Pricing by fund risk level – still a unique advantage
– Volatility adjusted funds – Transamerica led approach that has become the standard
Transamerica variable annuity sales (USD billion)
Variable annuity sales (Annual percentage growth)
* Industry and market share source: Morningstar (VARDS)
2006 2007 2008 2009 2010 2011 2012 2013

7
Transamerica plots its own course as market conditions evolve
Transamerica business value is created by selling well priced product into firm demand
► Past discipline has maintained both capacity and appetite for new sales
Transamerica accounts for a substantial percentage of industry net flows
► The high rate of positive net flows in this market speeds the transformation of the book
Effective sales and marketing execution allows for growth at the right price
Source: Morningstar (VARDS); industry net flows is an estimate made by Morningstar
VA net flows as a % of total inflows (%)
-30%
0%
30%
60%
2008 2009 2010 2011 2012 2013
Transamerica Industry

8
Strong pricing in today’s market
Variable annuity margins are primarily driven by consumer demand for income rider
Transamerica Sample variable annuity market consistent pricing results* As of March 31, 2014
Revenues based on account value B-share with
Retirement Income Choice B-share with
no income rider
Mortality and expense fees 1.30% 1.30%
Fund management revenue 0.62% 0.62%
Living benefit fees 1.87% 0.00%
Other revenue (surrender charges, policy fees) 0.06% 0.15%
Total revenue 3.85% 2.07%
Benefits and disbursements on account value
Death benefits 0.16% 0.33%
Living benefit claims & hedge cost 1.16% 0.00%
General expenses 0.34% 0.29%
Distribution costs 1.15% 1.18%
Total benefits and disbursements 2.81% 1.80%
Product profit margin 1.04% 0.27%
Return from capital 0.05% 0.01%
Priced for market consistent ROA 1.09% 0.28%
Rollforward from market consistent pricing to IFRS ROA
Adjustment from market consistent to IFRS management best estimate 0.31% 0.14%
Expected IFRS ROA 1.40% 0.42%
Wtd average ~1.20%
* Assumes B-share VA with return of premium death benefit on an average mix of business sold (issue ages, asset allocation, gender, etc.); revenue on asset management for funds managed by Aegon Asset Management (AAM) is reflected in AAM results

9
Inforce fee increase on income guarantee reset or step up*
► Step up requires opt-in and applies to 2004-2007 GMWB riders
► Reset happens automatically, unless policyholders opt-out, in rising equity markets for 2008 and later business sold
► 95% acceptance rate for opt-out eligible policyholders in first 4 months in effect
Most of the GMIB claims activity is Alternative Lump Sum Offer (ALSO) rather than annuitization
► After higher initial activity, the proportion of total claims electing the option has been stable
► Stable ratio indicates sustained appeal of offer, good response from different behavioral starting points, and lower risk that program pulls favorable future behavior forward
Strong results driven by two inforce management initiatives
0%
25%
50%
75%
100%
-
10
20
30
40
50
60
70
5/2
1/2
012
6/1
8/2
012
7/1
5/2
012
8/1
2/2
012
9/9
/2012
10/7
/2012
11/4
/2012
12/2
/2012
12/3
0/2
012
1/2
7/2
013
2/2
4/2
013
3/2
4/2
013
4/2
1/2
013
5/1
9/2
013
6/1
6/2
013
7/1
4/2
013
8/1
1/2
013
9/8
/2013
10/6
/2013
11/3
/2013
12/1
/2013
12/2
9/2
013
1/2
6/2
014
% o
f to
tal cla
ims
Cla
im a
mounts
(in
$ m
illions)
Annuitization (in amounts)
ALSO (in amounts)
Proportion of total claims choosing ALSO
ALSO vs. annuitization trends
* Effective November 2013

10
Broad adoption of volatility adjusted funds: ~ 30% of GMIB account value - reduces equity risk
Impact from ALSO to date
► Lower equity tail risk - adds to benefit from volatility adjusted funds
► Lower rate sensitivity as liability duration falls
► Minimal earnings impact, primarily from lower required capital
Expansion of ALSO focused on entire block rather than only in the money portion
Expected impact of expanded offer
► ~20% shrinkage of target block over two years
► Impact to IFRS results expected to be limited to earnings from lower required capital
► Acceleration of improvement in VA ROC and decline in macro hedge cost
Management actions driving improvement in GMIB cost and risk
21%
14%
~11%
3Q 2011 4Q 2013 2015 target*
VA in-force moving away from GMIB (% GMIB account balance vs. total VA separate account balance)
In-force VA, excl. GMIB GMIB
Account balance 86% 14%
IFRS equity** ~50% ~50%
* As released at the December 2011 A&I conference ** IFRS equity fluctuates with market conditions and sales

11
Fair value hedging without an accounting match
Protection of capital continues to be main purpose
► Hedge payoff helps fund increase in capital if equity declines
► 2002-2003 GMIB block primary driver of hedged exposure
IFRS accounting mismatch between hedges and liabilities
► GMIB liability carried at amortized cost (SOP 03-1)
► Macro hedge carried at fair value
Hedging remains effective with stable cost
* Fair value results are reported outside of underlying earnings in Fair Value Items
-80
-60
-40
-20
0
20
40
60
1Q10 2Q10 3Q10 4Q10 1Q11 2Q11 3Q11 4Q11 1Q12 2Q12 3Q12 4Q12 1Q13 2Q13 3Q13 4Q13 1Q14
Fair Value Quarterly Fair Value Cumulative Average
Fair value hedging with an accounting match (USD million)
Fair Value results expected to be near zero over time
Quarterly volatility due to: IFRS sensitivity to equity and
rates is lower than hedge target
Some long term volatility not hedged
Most quarterly volatility due to timing issues that offset over time

12
1.0 0.8 0.5 1.0
(0.5) 0.3 0.5
2.8 2.8
2.4
3.4
2.8
3.4
4.3
MF net deposits MF gross deposits
2007 2008 2009 2010 2011 2012 2013
Consumer value: offer best in breed sub-advised mutual funds
► 41% of funds offered by Transamerica are rated 4-star or 5-star vs. industry average of 33%*
Distributor value: broader product mix and new distribution lead to higher sales and net flows
Enterprise value: leveraging capabilities
► VA provides scale = cost advantage for fund business relative to size
► Over 50% of 2013 mutual fund sales to Aegon Asset Management managed funds
Diversification supports growth in all market conditions
► Tripled the number of funds available since 2010
Mutual funds: creating value today with upside potential
Sales momentum creating positive net flows with improving margins
* Morningstar
Transamerica mutual fund deposits (USD billion)

13
Fixed annuity balance decline expected to stabilize at or slightly below recent levels due to end of shock lapses from 2009 five-year guarantee business
Margins have stabilized as policy rate resets and portfolio yield fall in tandem while low rates reduce lapse potential, supporting inforce balances
Operational Free Cash Flow tracks earnings plus required capital release
OFCF generated as fixed annuity balances decline and margins hold
34.6
28.3 27.1
21.0
17.8 16.0
2008 2009 2010 2011 2012 2013
Fixed annuity balances (USD billion)

14
Guaranteed income is our business
Living benefit riders are widely available on
Fixed Indexed Annuity (FIA)
► In 2013, 88% of FIA sales had a living benefit rider
available, up from 80% in 2010
New generation of products use custom as well as traditional indices
► New indices similar to VA volatility adjusted funds
► Lowers costs of market performance and improves value proposition for consumers, despite low current rates
Distributors want fresh, consumer friendly offerings
► FIA markets are aligning with our strategic objectives and FIA product leverages our competencies
► Transamerica to launch a new FIA in 4Q14
Fixed indexed annuity: another approach to guaranteed income
Source: LIMRA data; internal analysis
15%
20%
25%
30%
35%
Full
Year
2010
Full
Year
2011
1Q12 2Q12 3Q12 4Q12 1Q13 2Q13 3Q13 4Q13 1Q14
0%
20%
40%
60%
80%
Fixed indexed annuity sales as a % of VA
FIA living benefit election rate trend
15
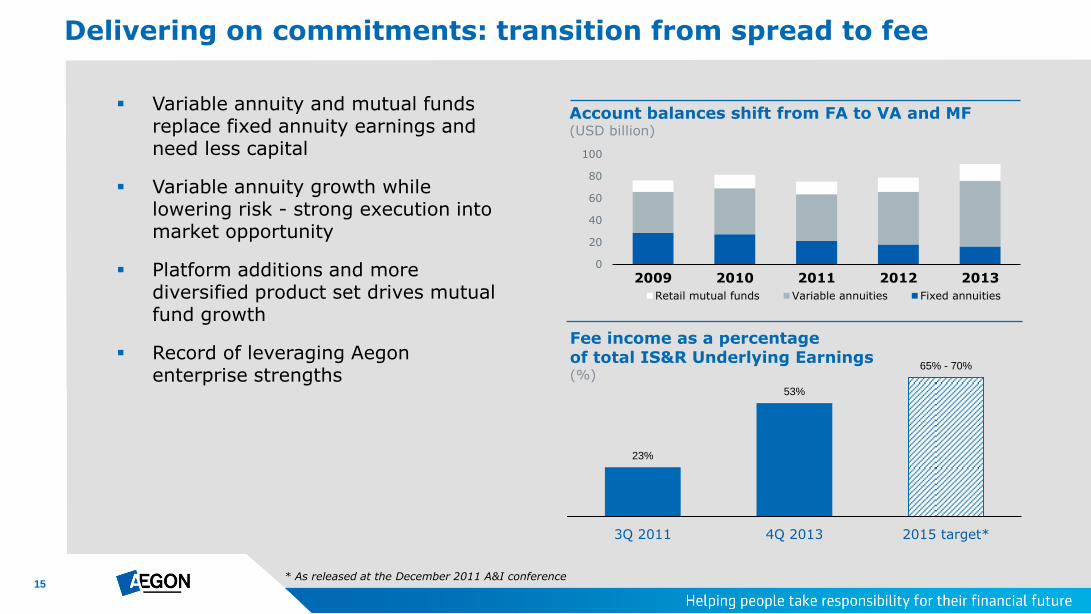
Variable annuity and mutual funds replace fixed annuity earnings and need less capital
Variable annuity growth while lowering risk - strong execution into market opportunity
Platform additions and more diversified product set drives mutual fund growth
Record of leveraging Aegon enterprise strengths
Delivering on commitments: transition from spread to fee
Fee income as a percentage of total IS&R Underlying Earnings (%)
Account balances shift from FA to VA and MF (USD billion)
23%
53%
65% - 70%
3Q 2011 4Q 2013 2015 target*
* As released at the December 2011 A&I conference
0
20
40
60
80
100
2009 2010 2011 2012 2013
Retail mutual funds Variable annuities Fixed annuities

16
Variable annuity ROA reiterated at 80 bps
► Impact of accounting policy change a reduction of 4-5 bps in 2014
► Impact of new sales are expected to raise ROA over time
Mutual funds reiterated at 30bps as Q114 results hit target
Fixed annuity maintained at 100bps – outperformance continues
Strong ROA in all lines
Variable annuity balances and margin* (%, USD billion)
* Variable annuities margin adjusted for one-offs ** Underlying earnings before tax are annualized
Margin (UEBT** / Assets) Targeted margin
28 27 21 18 16 15 0.5%
1.0%
1.5%
2.0%
2009 2010 2011 2012 2013 1Q14**
Fixed annuity balances and margin (%, USD billion)
10 12 11 13 15 16 -0.4%
-0.2%
0.0%
0.2%
0.4%
2009 2010 2011 2012 2013 1Q14**
Retail mutual fund balances and margin (%, USD billion)
38 42 43 48 60 61 0.0%
0.5%
1.0%
2009 2010 2011 2012 2013 1Q14**

17
Transformed and positioned for future success
Individual Savings & Retirement has made the transition to fee based businesses
► Mutual funds: accelerating earnings and rising sales
► Variable annuities: 2013 saw all time high sales with strong margins
► Adding enterprise value: nearly half of 2013 fee sales managed by Aegon Asset Management
Variable Annuity has been managed into a higher earning and lower risk business
► Strong new business benefiting from product transformation, rapid repricing, and good macro conditions
► Inforce management improves both earnings and tail risk without substantially impacting sales
• ALSO program changes expectation of equity and rate sensitivity while reducing GMIB tail risk
• Inforce pricing actions already taken will strengthen margins
• Macro hedging successfully protects the capital base
Fixed annuity spreads remain strong – liquidity needs building as block matures
► Earnings have exceeded expectations as lower rates drive lower liability costs
► Operational free cash flow benefits from high margins and stable balance decline

18
Appendix

19
Positioned for success in traditional, non-traditional and emerging at-retirement markets
Annuities – variable and fixed Wealth accumulation, preservation and retirement income
Retail mutual funds Wealth accumulation and asset allocation
Overview Transamerica Capital Management (TCM)
Manufactures variable and fixed annuities
Distributes variable and fixed annuities
Variable annuities: Dedicated wholesaling team
Fee-based earnings retain some capital markets leverage post-hedging
Fixed annuities: Profitability managed over time through rate setting
Back book management through select reinsurance transactions
Transamerica Asset Management (TAM) Investment advisor to all AEGON USA mutual funds
Manufactures mutual funds
Provides asset allocation
Offers a continuum of asset allocation and partner funds/asset management – effectively a “manager of managers”
Dedicated wholesaling team and award winning shareholder servicing
Fee-based earnings with low required capital
Distribution
Focused on third-party distribution (advisors) Banks
Wires
Independent broker dealers
Adding new channels
Focused on third party distribution (advisors) Banks
Wires
Independent broker dealers
Adding new channels
Competitive advantages
Highly recognized brand – Transamerica Distribution capabilities and execution Customer service Advanced Markets support for advisors on complex
planning concepts and strategies Advisor Intelligence Model (AIM) Low maintenance costs Innovative approach: speed to market, pricing discipline
and back book management
Open architecture - focus on unique retail sub-advised mutual funds
Manager research and selection capabilities Diversified channels with strong wholesaling distribution Advisor Intelligence Model (AIM) Customer service focus - 10 consecutive
DALBAR awards and 13 overall Asset allocation capabilities

20
Variable annuity remains the dominant income protection product
► Income guarantee is a planned purchase of future income linked to market returns
► Balance of liquidity and guarantee is a unique and valuable feature
► Flexibility to adjust to changing needs or plans over time
► Although the income guarantee is a key feature today, nearly 20% of current Transamerica sales have no income guarantee
Customer value proposition: why buy a variable annuity?
Source: LIMRA
Variable Annuity
65%
Fixed Annuity (book value)
10%
Fixed Annuity (market value
adjusted) 2%
Fixed Indexed Annuity
16%
Deferred Income Annuity
1%
Single Premium
Immediate Annuity
4%
Structured Settlements
2%
Industry annuity sales (% in 2013)

21
Defined contribution plans (usually employer-based) are the largest single pot of wealth in the US
At the point of retirement, there are a variety of ways to create income from those assets; these include:
► Annuities
► Systematic withdrawals of assets
► Income-oriented mutual funds
► Dividend-paying stocks
► Laddered corporate bonds, bank certificates of deposit (CDs), municipals or Treasuries
Only annuities offer guaranteed income, and for a large segment of retirees some annuity is an efficient investment – Variable Annuities are the most popular bridge between accumulated wealth and guaranteed income
Variable annuity: bridge to guaranteed retirement income

22
From a customer-needs viewpoint, the Variable Annuity purchase relieves worries of:
► Retiring at the “wrong time” in the equity market cycle
► Converting assets into income
► Outliving that income
► Uncertainty of future plans and income
More technically, Variable Annuities allow customers to:
► Diversify exposure to mortality, longevity and market path by outsourcing risk to VA writers: sequence of returns and time diversification can be pooled through intermediaries
► Accumulate wealth on a tax-preferred basis
► Convert wealth into guaranteed income for life at retirement
► Manage the conflict between the need to commit to an income guarantee and the loss aversion driven by:
• Unexpected death and loss of principal
• Missing equity market rallies
• Experiencing equity market sell offs
What the variable annuity product provides
Variable annuities provide a guarantee that puts a floor on known needs and provides flexibility for the unknowns

For questions please contact
Investor Relations
+31 70 344 8305
P.O. Box 85
2501 CB The Hague
The Netherlands
Thank you

24
Cautionary note regarding non-IFRS measures This document includes the non-IFRS financial measures: underlying earnings before tax, income tax, income before tax and market consistent value of new business. These non-IFRS measures are calculated by consolidating on a proportionate basis Aegon’s joint ventures and associated companies. The reconciliation of these measures, except for market consistent value of new business, to the most comparable IFRS measure is provided in note 3 ‘Segment information’ of Aegon’s Condensed Consolidated Interim Financial Statements. Market consistent value of new business is not based on IFRS, which are used to report Aegon’s primary financial statements and should not be viewed as a substitute for IFRS financial measures. Aegon may define and calculate market consistent value of new business differently than other companies. Aegon believes that its non-IFRS measures, together with the IFRS information, provide meaningful information about the underlying operating results of Aegon’s business including insight into the financial measures that senior management uses in managing the business. In addition, return on equity is a ratio using a non-GAAP measure and is calculated by dividing the net underlying earnings after cost of leverage by the average shareholders’ equity excluding the preferred shares, the revaluation reserve and the reserves related to defined benefit plans. Local currencies and constant currency exchange rates This document contains certain information about Aegon’s results, financial condition and revenue generating investments presented in USD for the Americas and GBP for the United Kingdom, because those businesses operate and are managed primarily in those currencies. Certain comparative information presented on a constant currency basis eliminates the effects of changes in currency exchange rates. None of this information is a substitute for or superior to financial information about Aegon presented in EUR, which is the currency of Aegon’s primary financial statements. Forward-looking statements The statements contained in this document that are not historical facts are forward-looking statements as defined in the US Private Securities Litigation Reform Act of 1995. The following are words that identify such forward-looking statements: aim, believe, estimate, target, intend, may, expect, anticipate, predict, project, counting on, plan, continue, want, forecast, goal, should, would, is confident, will, and similar expressions as they relate to Aegon. These statements are not guarantees of future performance and involve risks, uncertainties and assumptions that are difficult to predict. Aegon undertakes no obligation to publicly update or revise any forward-looking statements. Readers are cautioned not to place undue reliance on these forward-looking statements, which merely reflect company expectations at the time of writing. Actual results may differ materially from expectations conveyed in forward-looking statements due to changes caused by various risks and uncertainties. Such risks and uncertainties include but are not limited to the following: Changes in general economic conditions, particularly in the United States, the Netherlands and the United Kingdom; Changes in the performance of financial markets, including emerging markets, such as with regard to:
► The frequency and severity of defaults by issuers in Aegon’s fixed income investment portfolios; ► The effects of corporate bankruptcies and/or accounting restatements on the financial markets and the resulting decline in the value of equity and debt securities Aegon holds; and ► The effects of declining creditworthiness of certain private sector securities and the resulting decline in the value of sovereign exposure that Aegon holds;
Changes in the performance of Aegon’s investment portfolio and decline in ratings of Aegon’s counterparties; Consequences of a potential (partial) break-up of the euro or the potential independence of Scotland from the United Kingdom The frequency and severity of insured loss events; Changes affecting longevity, mortality, morbidity, persistence and other factors that may impact the profitability of Aegon’s insurance products; Reinsurers to whom Aegon has ceded significant underwriting risks may fail to meet their obligations; Changes affecting interest rate levels and continuing low or rapidly changing interest rate levels; Changes affecting currency exchange rates, in particular the EUR/USD and EUR/GBP exchange rates; Changes in the availability of, and costs associated with, liquidity sources such as bank and capital markets funding, as well as conditions in the credit markets in general such as changes in borrower and counterparty creditworthiness; Increasing levels of competition in the United States, the Netherlands, the United Kingdom and emerging markets; Changes in laws and regulations, particularly those affecting Aegon’s operations, ability to hire and retain key personnel, the products Aegon sells, and the attractiveness of certain products to its consumers; Regulatory changes relating to the insurance industry in the jurisdictions in which Aegon operates; Changes in customer behavior and public opinion in general related to, among other things, the type of products also Aegon sells, including legal, regulatory or commercial necessity to meet changing customer expectations; Acts of God, acts of terrorism, acts of war and pandemics; Changes in the policies of central banks and/or governments; Lowering of one or more of Aegon’s debt ratings issued by recognized rating organizations and the adverse impact such action may have on Aegon’s ability to raise capital and on its liquidity and financial condition; Lowering of one or more of insurer financial strength ratings of Aegon’s insurance subsidiaries and the adverse impact such action may have on the premium writings, policy retention, profitability and liquidity of its insurance subsidiaries; The effect of the European Union’s Solvency II requirements and other regulations in other jurisdictions affecting the capital Aegon is required to maintain; Litigation or regulatory action that could require Aegon to pay significant damages or change the way Aegon does business; As Aegon’s operations support complex transactions and are highly dependent on the proper functioning of information technology, a computer system failure or security breach may disrupt Aegon’s business, damage its reputation and adversely affect its
results of operations, financial condition and cash flows; Customer responsiveness to both new products and distribution channels; Competitive, legal, regulatory, or tax changes that affect profitability, the distribution cost of or demand for Aegon’s products; Changes in accounting regulations and policies or a change by Aegon in applying such regulations and policies, voluntarily or otherwise, may affect Aegon’s reported results and shareholders’ equity; The impact of acquisitions and divestitures, restructurings, product withdrawals and other unusual items, including Aegon’s ability to integrate acquisitions and to obtain the anticipated results and synergies from acquisitions; Catastrophic events, either manmade or by nature, could result in material losses and significantly interrupt Aegon’s business; and Aegon’s failure to achieve anticipated levels of earnings or operational efficiencies as well as other cost saving and excess capital and leverage ratio management initiatives. Further details of potential risks and uncertainties affecting Aegon are described in its filings with the Netherlands Authority for the Financial Markets and the US Securities and Exchange Commission, including the Annual Report. These forward-looking statements speak only as of the date of this document. Except as required by any applicable law or regulation, Aegon expressly disclaims any obligation or undertaking to release publicly any updates or revisions to any forward-looking statements contained herein to reflect any change in Aegon’s expectations with regard thereto or any change in events, conditions or circumstances on which any such statement is based.
Disclaimers