Embed Size (px)
Citation preview
How Important Are The Rules Used To
Create Smart Beta Portfolios?• How much did portfolio construction rules affect
performance?
• How should investors proceed?
Presented by:
Amitabh Dugar, Ph.D.
Ralph Goldsticker, CFA
Introduction
Most Smart Beta presentations are about: “What and Why?”
Presentation addresses: “Do the rules used to construct a Smart Beta portfolio matter?”
Approach:
� Use alternative portfolio construction rules to simulate multiple 25-year return histories for Low Volatility, Fundamental Indexing and Momentum strategies.
� Compare average returns, risks, drawdowns and factor exposures.
Source: 2

Proliferation of Smart Beta offerings
Number of US Large Cap Smart Beta ETFs
Smart Beta # of ETFs
Value 39
Dividends 29
Fundamental 6
Earnings 3
Revenues 1
Low Volatility, Low Risk 12
Equal Weight, Small Cap Tilt 7
Momentum 5
Quality 3
Total 66
Source: Dugar & Goldsticker classifications, ETF.com data, as of 5/1/2015 3
� How do you choose?
� How much does it matter?
Designing a smart beta strategy
Smart beta strategies are intended to provide additional exposure to attractive characteristics.
But,• True factors behind smart betas are not
observable.• Investors also care about other portfolio
characteristics.
Managers design portfolio construction rules to:• Maximize exposure to target characteristic • Manage other characteristics and behavior• Have attractive backtests
4

Large number of ways to construct any Smart
Beta strategy
5
Choices include:• Metric and formula
• Universe: Geography and capitalization range
• Subset: All stocks, top 20%, top 50%, etc.
• Weighting: heuristic, optimized, cap, equal
• Tracking error aware: optimized, sector neutral
• Constraints, concentration, liquidity
• Reconstitution frequency
� How do you decide?
� How much does it matter?
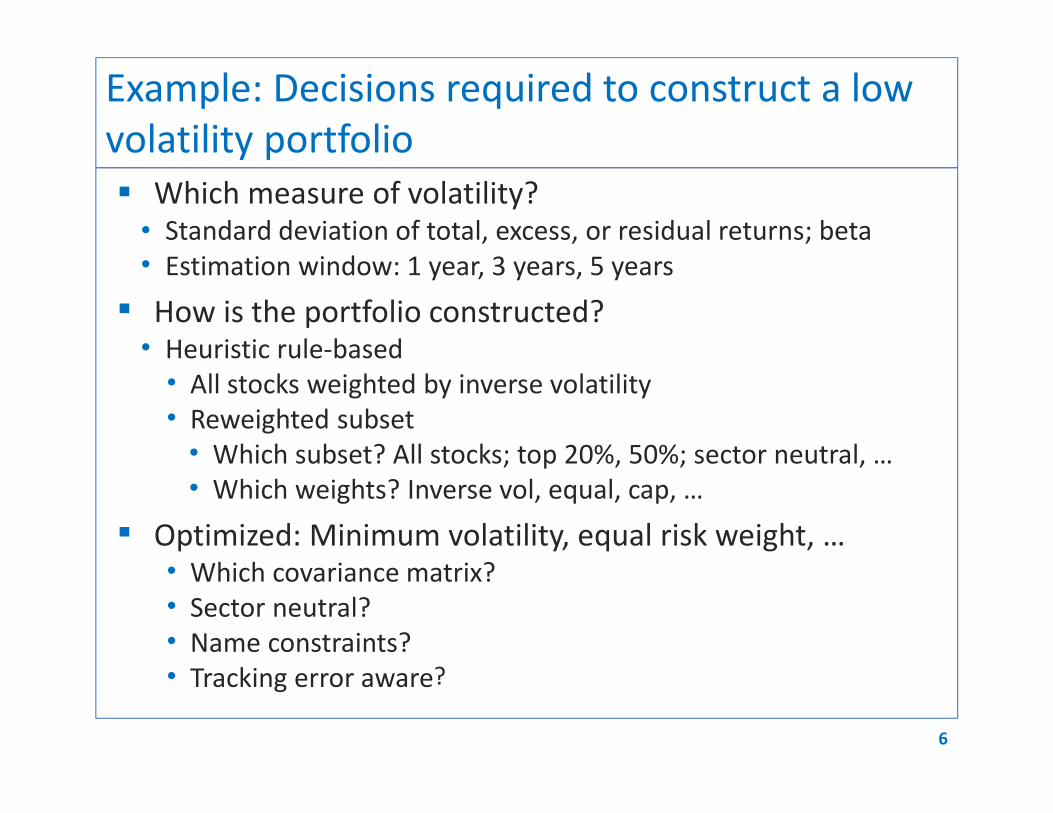
Example: Decisions required to construct a low
volatility portfolio
6
� Which measure of volatility?• Standard deviation of total, excess, or residual returns; beta
• Estimation window: 1 year, 3 years, 5 years
� How is the portfolio constructed?• Heuristic rule-based
• All stocks weighted by inverse volatility
• Reweighted subset
• Which subset? All stocks; top 20%, 50%; sector neutral, …
• Which weights? Inverse vol, equal, cap, …
� Optimized: Minimum volatility, equal risk weight, …• Which covariance matrix?
• Sector neutral?
• Name constraints?
• Tracking error aware?

Similar issues with other Smart Betas
� Fundamental indexing• Which measure of value?
• Earnings, revenues, sales, cash flow, composite• Which time period?
� Momentum• Which return window?
• Exclude most recent period?• Scale returns by volatility?
• Which volatility?• Which weighting scheme?
� Quality• Which measure of quality?• Which weighting scheme
7
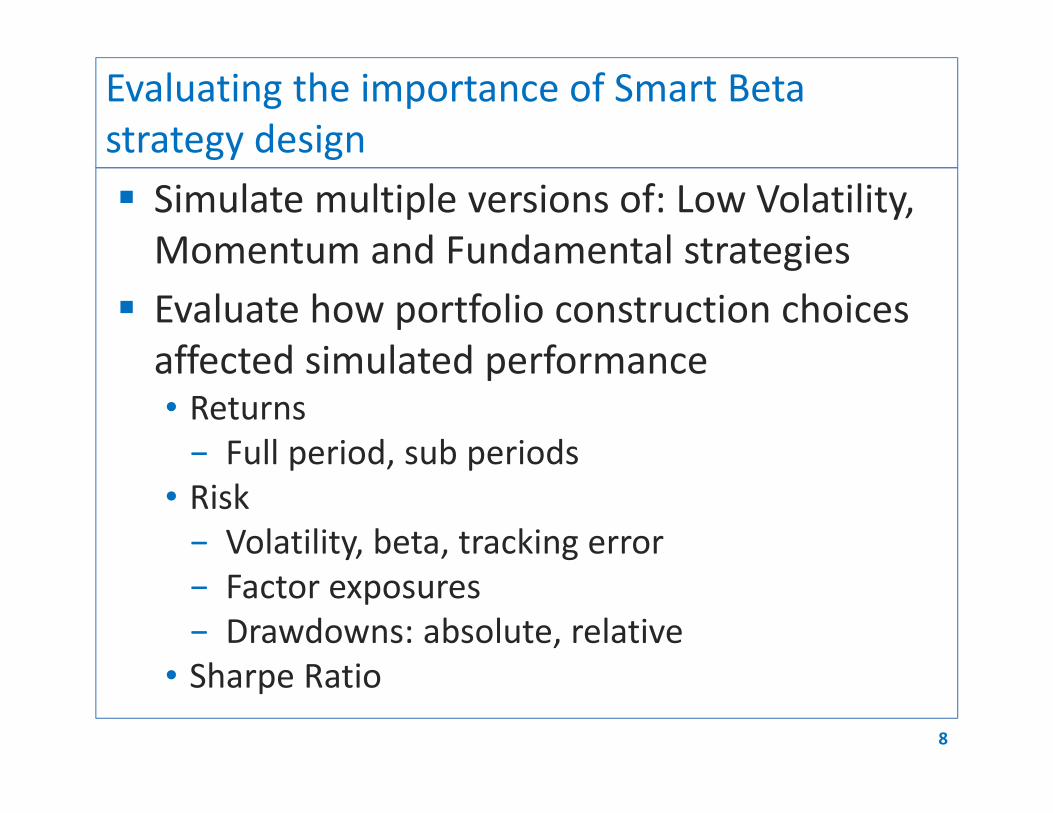
Evaluating the importance of Smart Beta
strategy design
� Simulate multiple versions of: Low Volatility,
Momentum and Fundamental strategies
� Evaluate how portfolio construction choices
affected simulated performance• Returns
− Full period, sub periods
• Risk
− Volatility, beta, tracking error
− Factor exposures
− Drawdowns: absolute, relative
• Sharpe Ratio
8

1. Low Volatility case study
� Metrics: standard deviation, residual risk,
beta• Calculated using 1, 3 & 5 year windows
� Universe: 500 largest US stocks
� All 500 stocks, 250 lowest risk, 100 lowest risk
� With and without sector neutrality constraint
� 25 years: 1989 – 2013, rebalanced quarterly
9
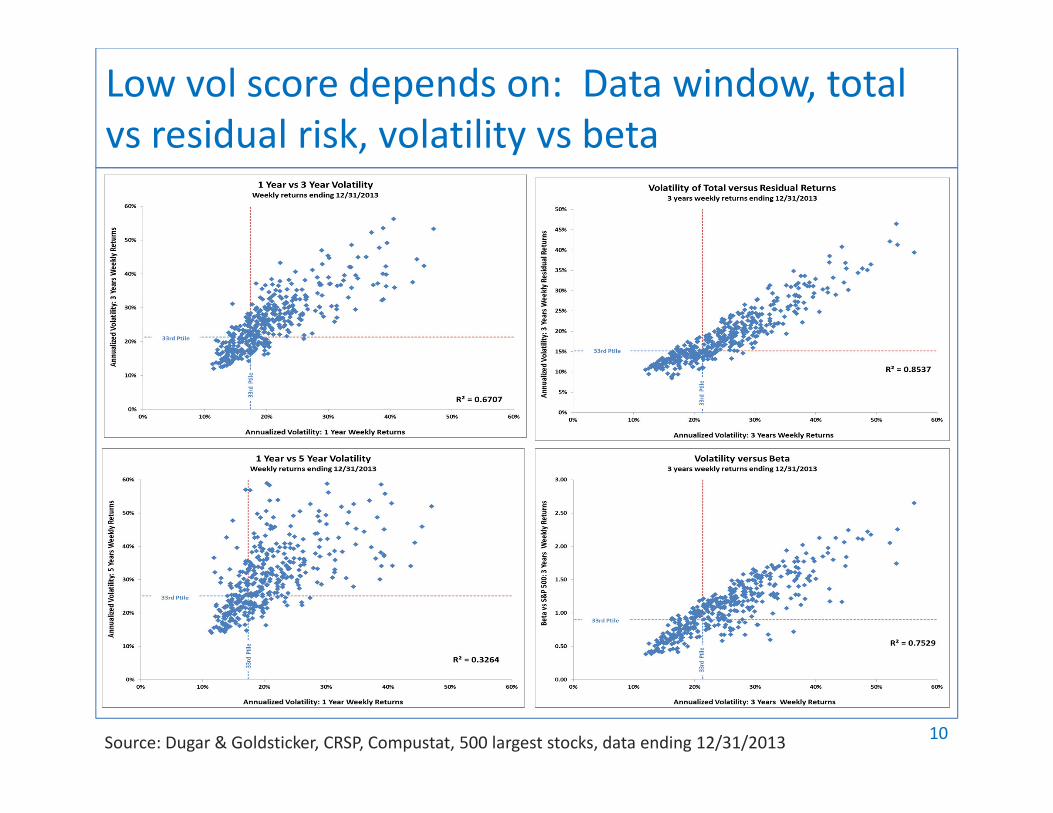
Low vol score depends on: Data window, total
vs residual risk, volatility vs beta
10Source: Dugar & Goldsticker, CRSP, Compustat, 500 largest stocks, data ending 12/31/2013
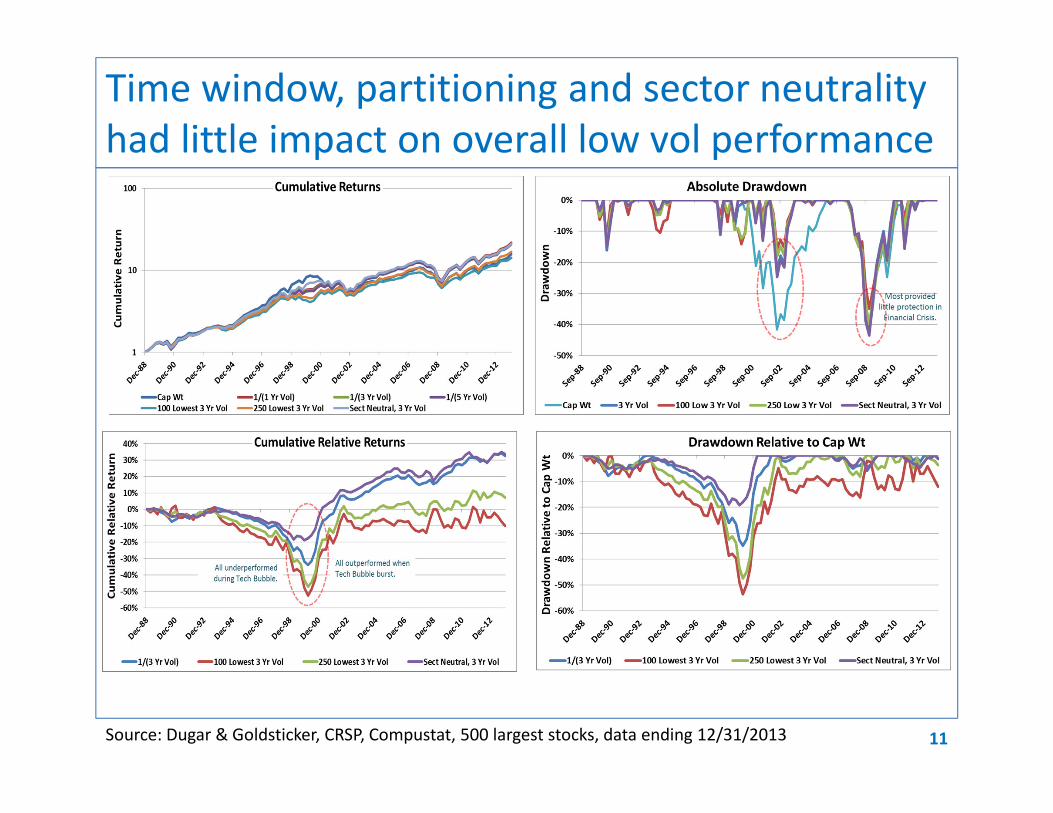
Time window, partitioning and sector neutrality
had little impact on overall low vol performance
Source: Dugar & Goldsticker, CRSP, Compustat, 500 largest stocks, data ending 12/31/2013 11
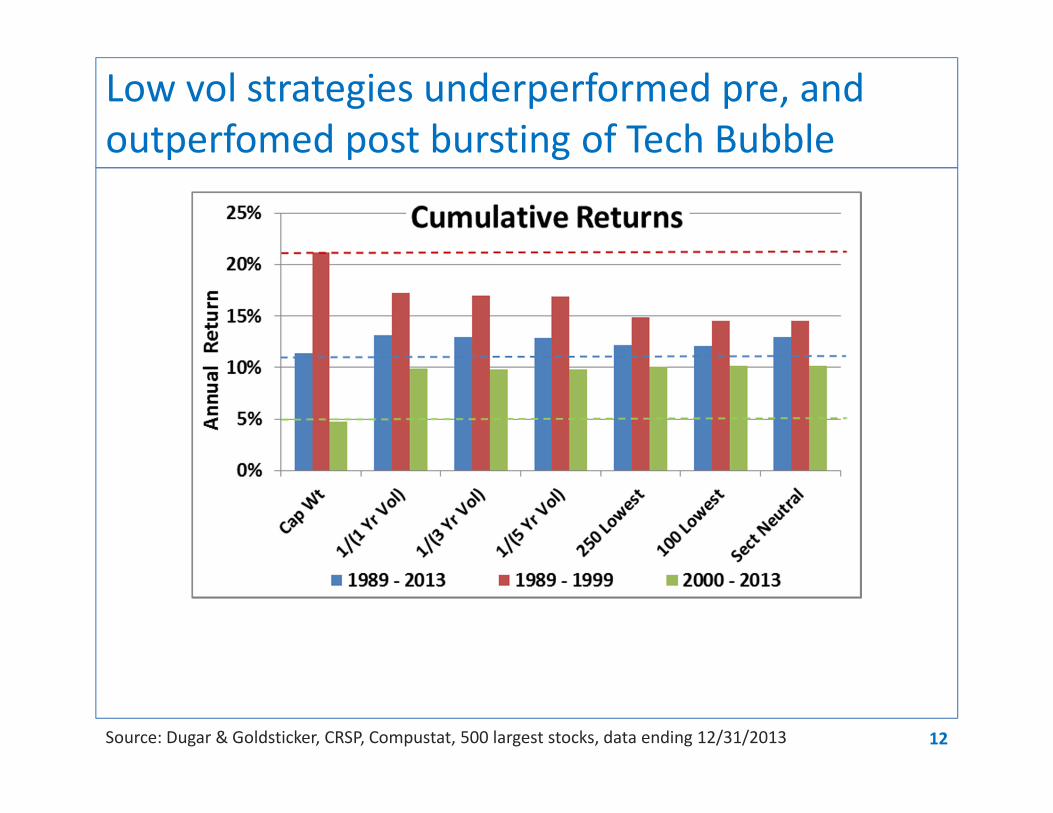
Low vol strategies underperformed pre, and
outperfomed post bursting of Tech Bubble
12Source: Dugar & Goldsticker, CRSP, Compustat, 500 largest stocks, data ending 12/31/2013

Differences in portfolio characteristics of low vol
strategies were not large
Cap
Weight
Change Window used to Calculate Vol Partition Sector
Netural,
3 Yr Vol1/(1 Yr Vol) 1/(3 Yr Vol) 1/(5 Yr Vol)250 Stocks
3 Yr Vol
100 Stocks
3 Yr Vol
Annual Return 11.34% 13.09% 12.92% 12.87% 11.97% 11.19% 12.96%
1989 - 1999 21.15% 17.27% 17.00% 16.85% 15.12% 14.18% 18.89%
2000 - 2013 4.73% 9.91% 9.82% 9.84% 9.55% 8.89% 8.51%
Volatility 16.1% 15.2% 15.4% 15.5% 13.3% 12.1% 16.0%
R-Square 94% 94% 94% 86% 76% 98%
Tracking Error 5.07% 5.31% 5.45% 6.84% 7.94% 3.45%
Sharpe Ratio 0.49 0.63 0.61 0.61 0.64 0.64 0.59
Beta 1.00 0.89 0.89 0.90 0.71 0.57 0.97
Up Beta 0.85 0.86 0.86 0.62 0.43 0.96
Down Beta 0.97 0.99 0.98 0.75 0.57 1.03
Max Drawdown -43% -42% -43% -43% -40% -35% -44%
Max Rel DD -38% -40% -41% -52% -56% -30%
Source: Dugar & Goldsticker, CRSP, Compustat, 500 largest stocks, data ending 12/31/2013 13

Fama-French Factor Exposures
Market
Size
Small - Big
Value
High - Low Momentum
Cap Weighted 0.98 -0.16 0.01 -0.01
1 Year Volatility 0.89 0.00 0.27 -0.03
3 Year Volatility 0.90 -0.01 0.29 -0.05
5 Year Volatility 0.90 -0.01 0.30 -0.06
250 Stocks, 3 Year 0.76 -0.12 0.38 -0.02
100 Stocks, 3 Year 0.65 -0.21 0.37 0.01
Sector Neutral, 3 Yr 0.95 0.00 0.15 -0.02
Source: Dugar & Goldsticker, CRSP, Compustat, Ken French, 500 largest stocks, data ending 12/31/2013 14
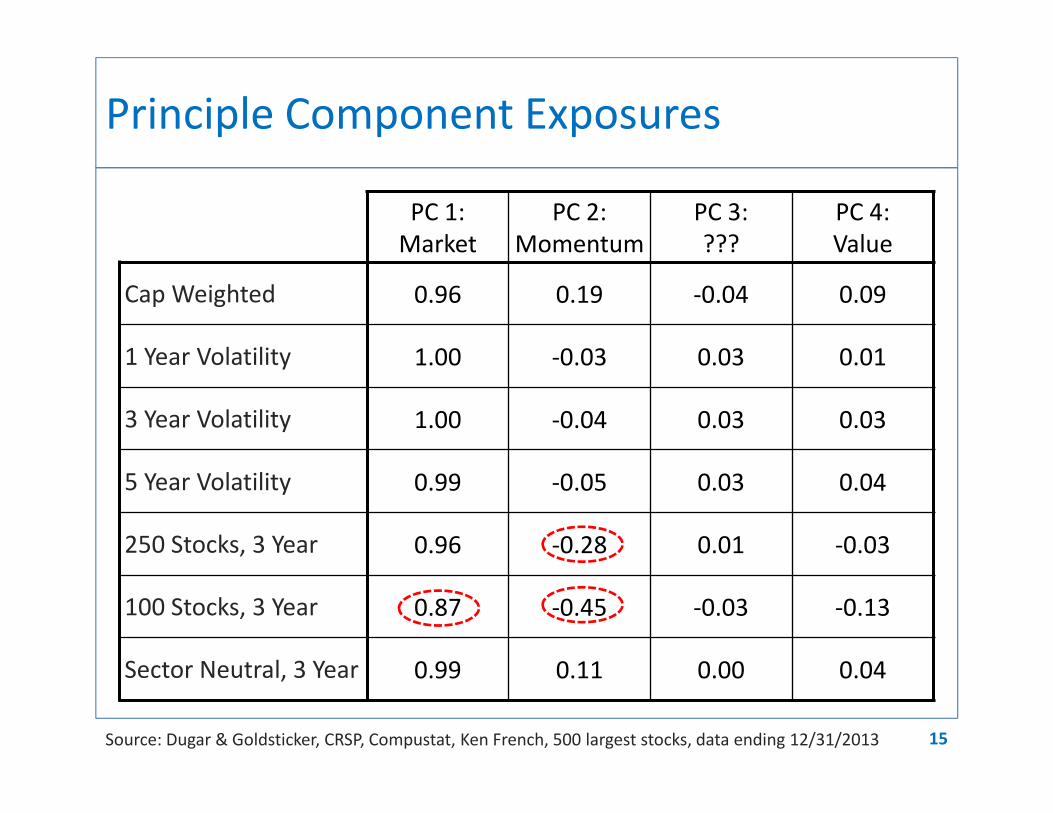
Principle Component Exposures
PC 1:
Market
PC 2:
Momentum
PC 3:
???
PC 4:
Value
Cap Weighted 0.96 0.19 -0.04 0.09
1 Year Volatility 1.00 -0.03 0.03 0.01
3 Year Volatility 1.00 -0.04 0.03 0.03
5 Year Volatility 0.99 -0.05 0.03 0.04
250 Stocks, 3 Year 0.96 -0.28 0.01 -0.03
100 Stocks, 3 Year 0.87 -0.45 -0.03 -0.13
Sector Neutral, 3 Year 0.99 0.11 0.00 0.04
Source: Dugar & Goldsticker, CRSP, Compustat, Ken French, 500 largest stocks, data ending 12/31/2013 15

Low volatility case study findings:
Simulated returns:
� All of the low volatility strategies we examined exhibited similar patterns of returns.
Underperformed through 1999, outperformed since.
� Investing in only the least volatile stocks produced less volatile portfolios.
But, also lower returns, higher tracking error and larger drawdowns.
Comparison of metrics:
� Standard deviation, beta and tracking error produced similar results.
� 1, 3 and 5 year statistics produced similar results.
Correlation between 1 and 5 year vol is only .5, but dispersion is in higher vol stocks (low weights).
16
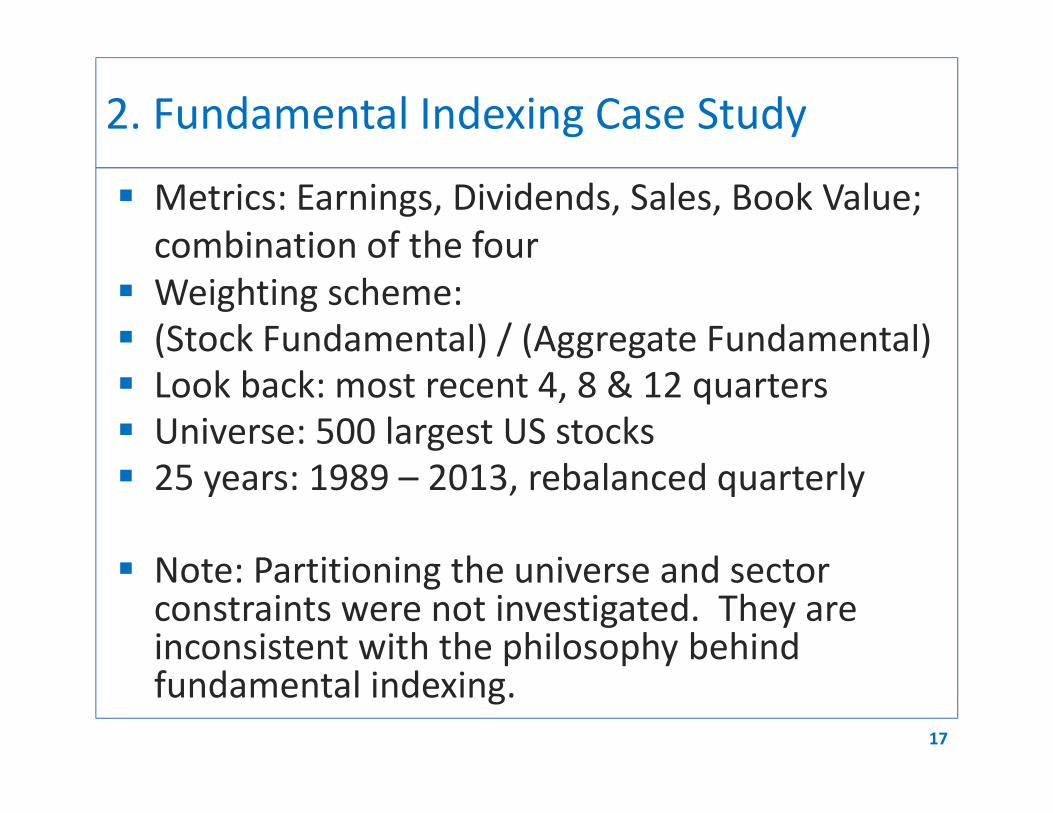
2. Fundamental Indexing Case Study
� Metrics: Earnings, Dividends, Sales, Book Value;
combination of the four
� Weighting scheme:
� (Stock Fundamental) / (Aggregate Fundamental)
� Look back: most recent 4, 8 & 12 quarters
� Universe: 500 largest US stocks
� 25 years: 1989 – 2013, rebalanced quarterly
� Note: Partitioning the universe and sector constraints were not investigated. They are inconsistent with the philosophy behind fundamental indexing.
17
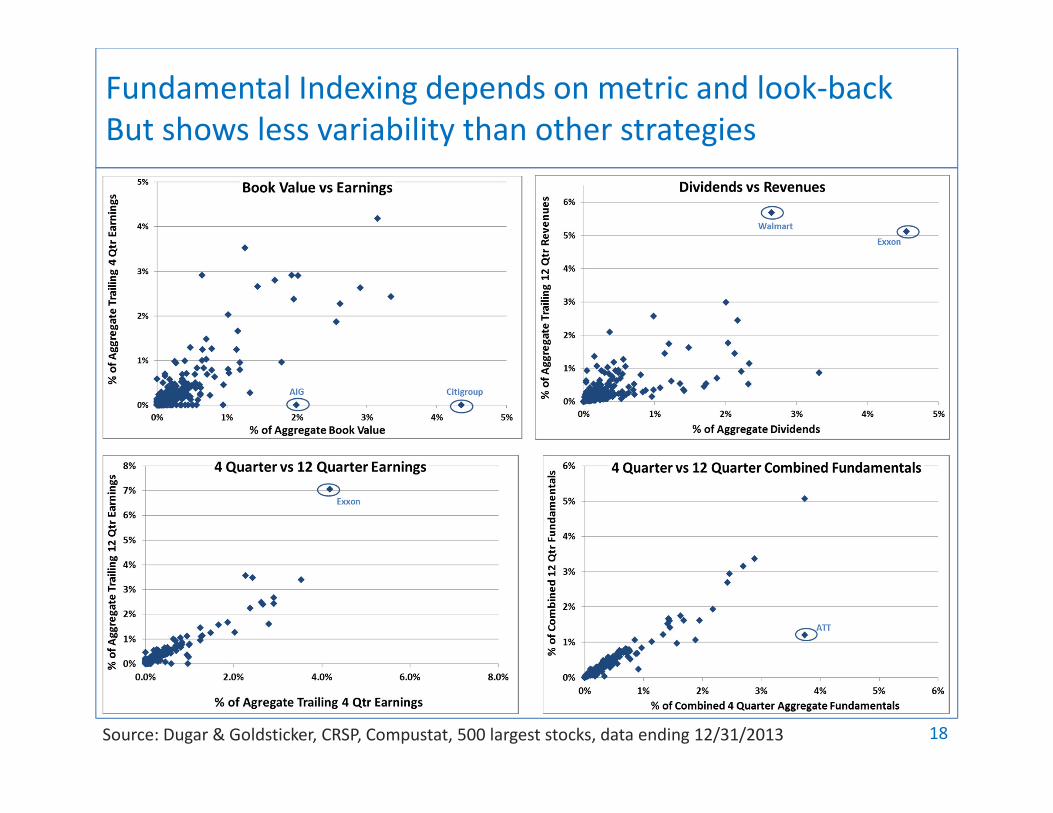
Fundamental Indexing depends on metric and look-back
But shows less variability than other strategies
18Source: Dugar & Goldsticker, CRSP, Compustat, 500 largest stocks, data ending 12/31/2013
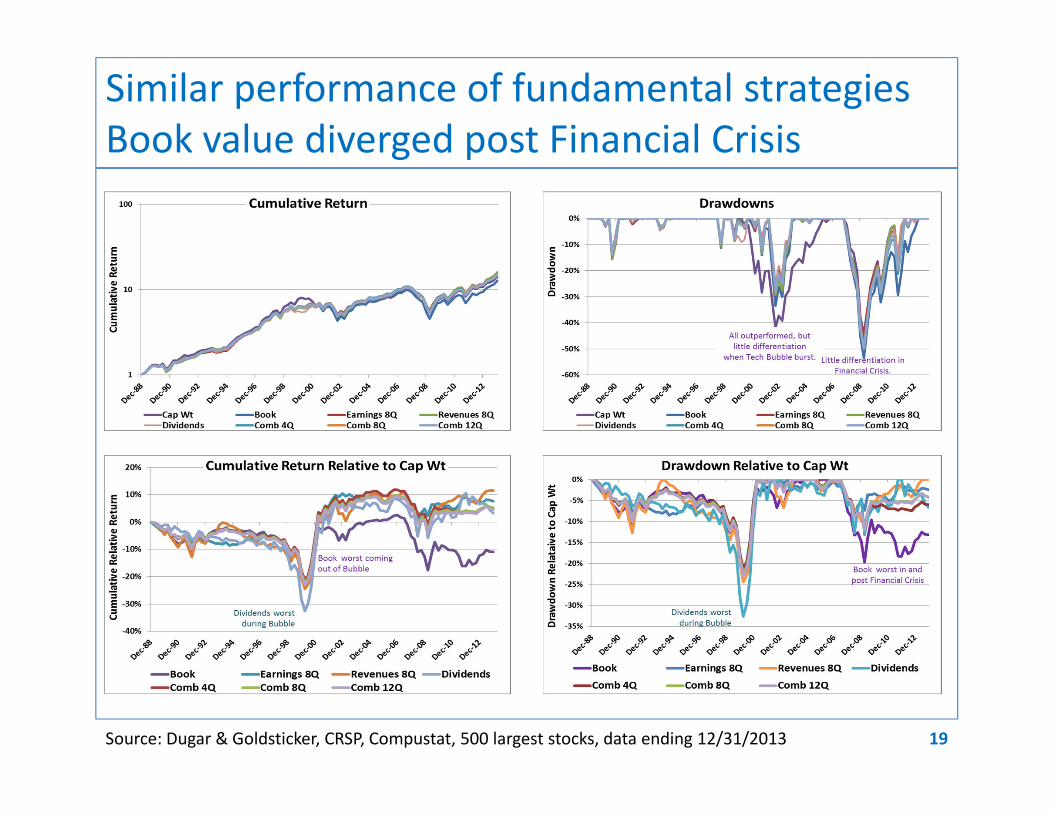
Similar performance of fundamental strategies
Book value diverged post Financial Crisis
Source: Dugar & Goldsticker, CRSP, Compustat, 500 largest stocks, data ending 12/31/2013 19

Fundamental strategies underperformed pre,
and outperfomed post bursting of Tech Bubble
20Source: Dugar & Goldsticker, CRSP, Compustat, 500 largest stocks, data ending 12/31/2013

Characteristics of fundamentally weighted
strategies were similar
Cap Wt Book Earnings Revenues Dividends Comb 8Q
Annual Return 11.21% 10.70% 11.54% 11.71% 11.36% 11.44%
1989 - 1999 20.36% 17.77% 17.73% 17.40% 16.21% 17.67%
2000 - 2013 4.25% 5.23% 6.71% 7.26% 7.53% 6.59%
Volatility 16.2% 17.4% 15.5% 16.4% 15.0% 16.0%
R-Square 91% 92% 90% 81% 92%
Tracking Error 5.2% 4.3% 5.3% 6.6% 4.6%
Sharpe Ratio 0.48 0.42 0.52 0.51 0.53 0.50
Beta 1.00 1.02 0.91 0.95 0.83 0.94
Up Beta 1.02 0.92 0.97 0.82 0.95
Down Beta 1.04 0.89 1.01 0.76 0.93
Max Draw Down -44.3% -53.6% -47.9% -49.0% -50.1% -49.9%
Max Rel DD -21.7% -22.0% -24.5% -32.6% -22.4%
Source: Dugar & Goldsticker, CRSP, Compustat, 500 largest stocks, data ending 12/31/2013 21

Fama-French Factor Exposures
Market
Size
Small - Big
Value
High - Low Momentum
Cap Weighted 0.98 -0.16 0.01 -0.01
Book 1.01 -0.12 0.30 -0.16
Earnings 0.91 -0.18 0.23 -0.12
Revenue 0.94 -0.04 0.30 -0.11
Dividend 0.87 -0.25 0.37 -0.12
Comb 8Q 0.94 -0.15 0.28 -0.13
Source: Dugar & Goldsticker, CRSP, Compustat, Ken French, 500 largest stocks, data ending 12/31/2013 22

Principle Component Exposures
PC 1:
Market
PC 2:
Momentum
PC 3:
???
PC 4:
Value
Cap Weighted 0.96 0.19 -0.04 0.09
Book 0.97 0.04 0.02 0.22
Earnings 0.98 -0.03 0.00 0.19
Revenue 0.97 0.01 0.03 0.17
Dividend 0.95 -0.20 -0.01 0.17
Comb 8Q 0.98 -0.02 0.01 0.19
Source: Dugar & Goldsticker, CRSP, Compustat, Ken French, 500 largest stocks, data ending 12/31/2013 23
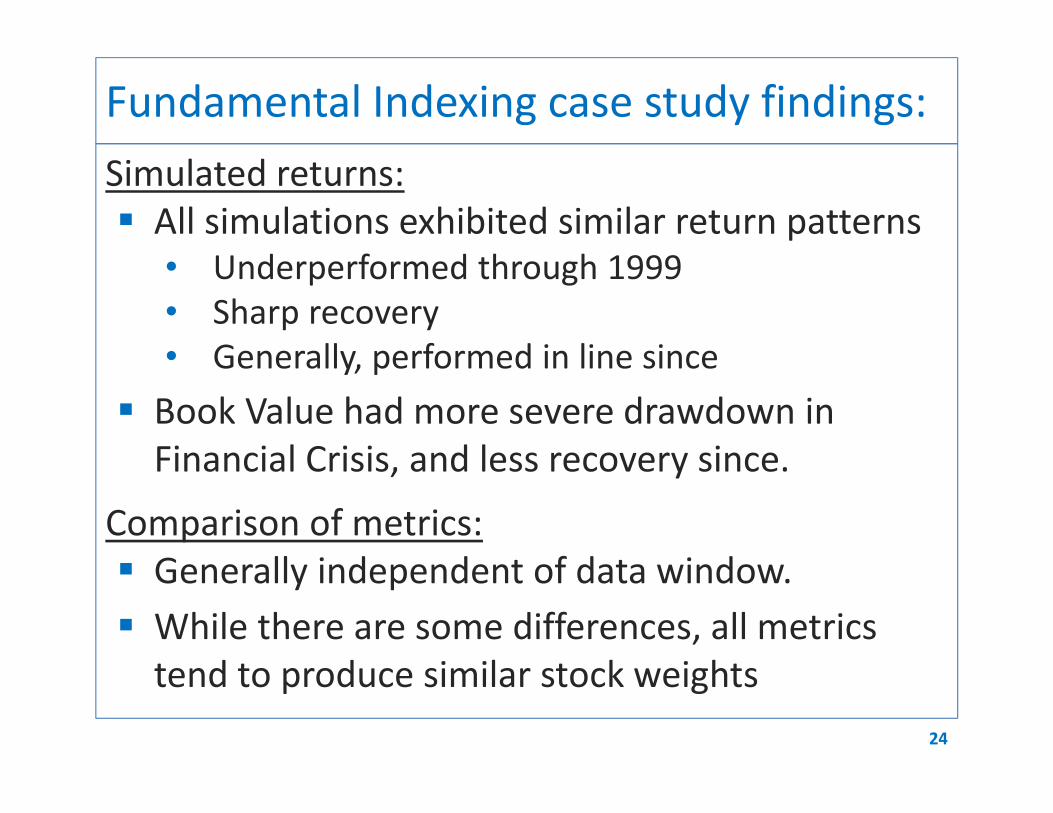
Fundamental Indexing case study findings:
24
Simulated returns:
� All simulations exhibited similar return patterns
• Underperformed through 1999
• Sharp recovery
• Generally, performed in line since
� Book Value had more severe drawdown in
Financial Crisis, and less recovery since.
Comparison of metrics:
� Generally independent of data window.
� While there are some differences, all metrics
tend to produce similar stock weights
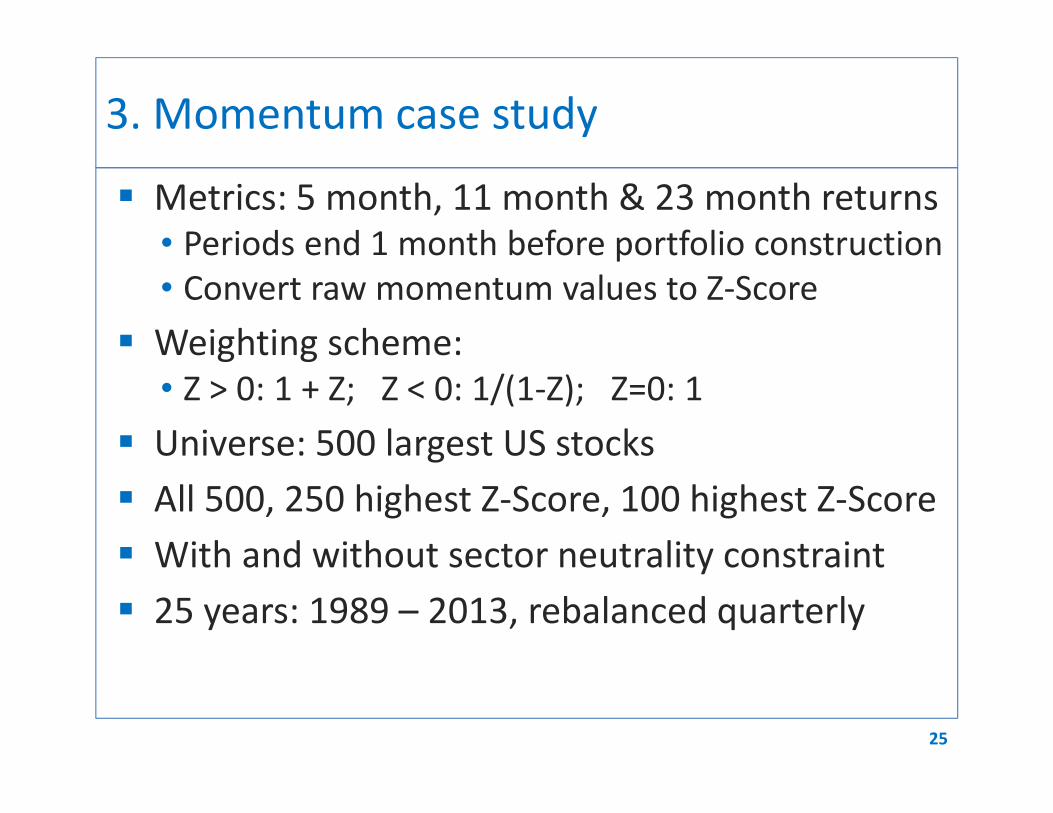
3. Momentum case study
� Metrics: 5 month, 11 month & 23 month returns
• Periods end 1 month before portfolio construction
• Convert raw momentum values to Z-Score
� Weighting scheme:
• Z > 0: 1 + Z; Z < 0: 1/(1-Z); Z=0: 1
� Universe: 500 largest US stocks
� All 500, 250 highest Z-Score, 100 highest Z-Score
� With and without sector neutrality constraint
� 25 years: 1989 – 2013, rebalanced quarterly
25

Momentum weights depend on look-back
window and return vs Z-Score
26Source: Dugar & Goldsticker, CRSP, Compustat, 500 largest stocks, data ending 12/31/2013
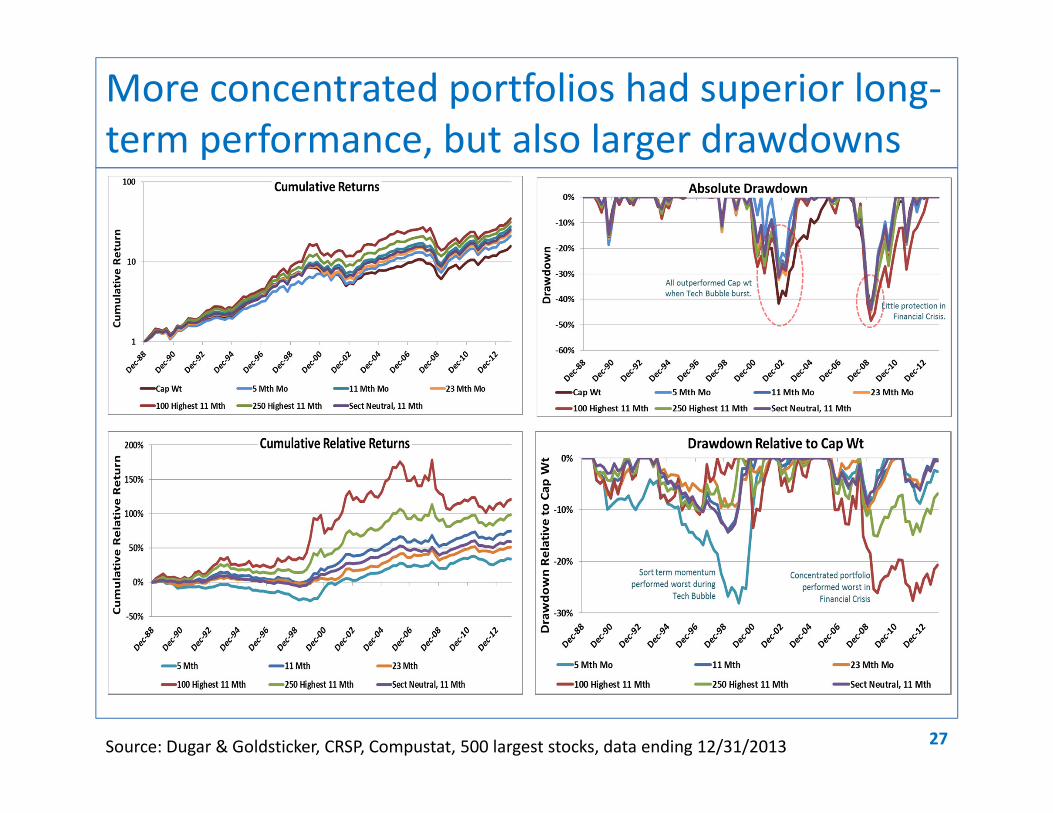
More concentrated portfolios had superior long-
term performance, but also larger drawdowns
Source: Dugar & Goldsticker, CRSP, Compustat, 500 largest stocks, data ending 12/31/2013 27
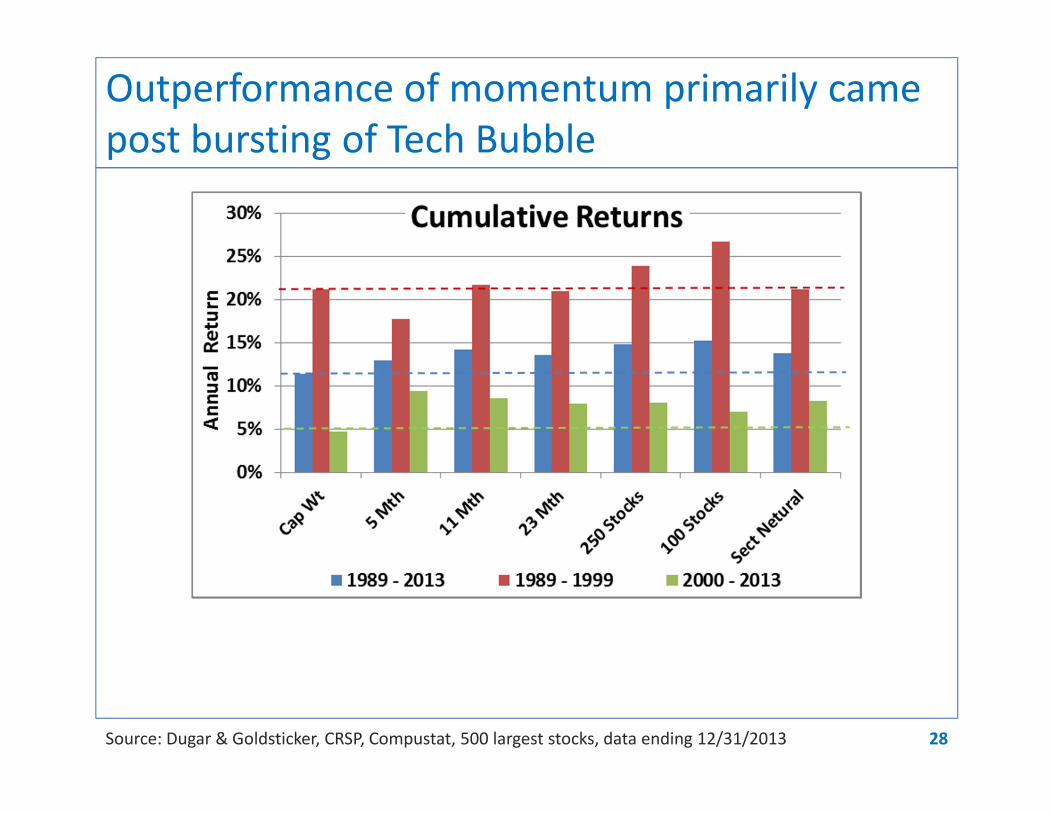
Outperformance of momentum primarily came
post bursting of Tech Bubble
28Source: Dugar & Goldsticker, CRSP, Compustat, 500 largest stocks, data ending 12/31/2013

Differences in portfolio characteristics of
momentum strategies were not large.
Cap
Weight
Window used to Calculate Momentum Partition 11 Month Sector
Netural,
11 Mth5 Month 11 Month 23 Month 250 Stocks 100 Stocks
Annual Return 11.34% 12.98% 14.17% 13.52% 12.83% 12.48% 13.8%
1989 - 1999 21.15% 17.72% 21.69% 20.97% 17.35% 17.01% 21.12%
2000 - 2013 4.73% 9.38% 8.59% 8.00% 9.39% 9.04% 8.30%
Volatility 16.1% 17.2% 17.5% 17.7% 17.4% 18.4% 17.2%
R-Square 95% 96% 97% 93% 88% 98%
Tracking Error 5.26% 4.62% 4.05% 6.40% 8.73% 3.69%
Sharpe Ratio 0.49 0.55 0.61 0.57 0.54 0.49 0.60
Beta 1.00 1.02 1.04 1.07 1.00 1.00 1.06
Up Beta 0.97 1.03 1.05 0.93 0.92 1.09
Down Beta 1.14 1.15 1.16 1.13 1.13 1.08
Max Drawdown -43% -44% -44% -45% -43% -46% -44%
Max Rel DD -37% -31% -30% -41% -48% -32%
Source: Dugar & Goldsticker, CRSP, Compustat, 500 largest stocks, data ending 12/31/2013 29
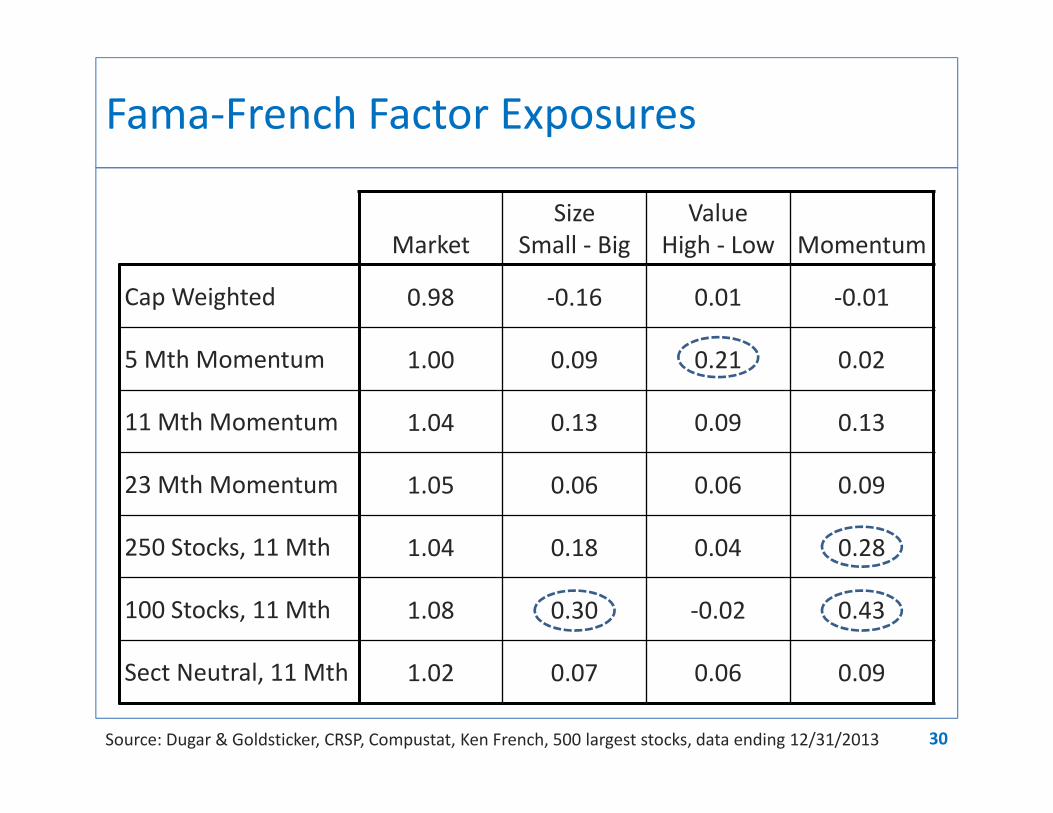
Fama-French Factor Exposures
Market
Size
Small - Big
Value
High - Low Momentum
Cap Weighted 0.98 -0.16 0.01 -0.01
5 Mth Momentum 1.00 0.09 0.21 0.02
11 Mth Momentum 1.04 0.13 0.09 0.13
23 Mth Momentum 1.05 0.06 0.06 0.09
250 Stocks, 11 Mth 1.04 0.18 0.04 0.28
100 Stocks, 11 Mth 1.08 0.30 -0.02 0.43
Sect Neutral, 11 Mth 1.02 0.07 0.06 0.09
Source: Dugar & Goldsticker, CRSP, Compustat, Ken French, 500 largest stocks, data ending 12/31/2013 30
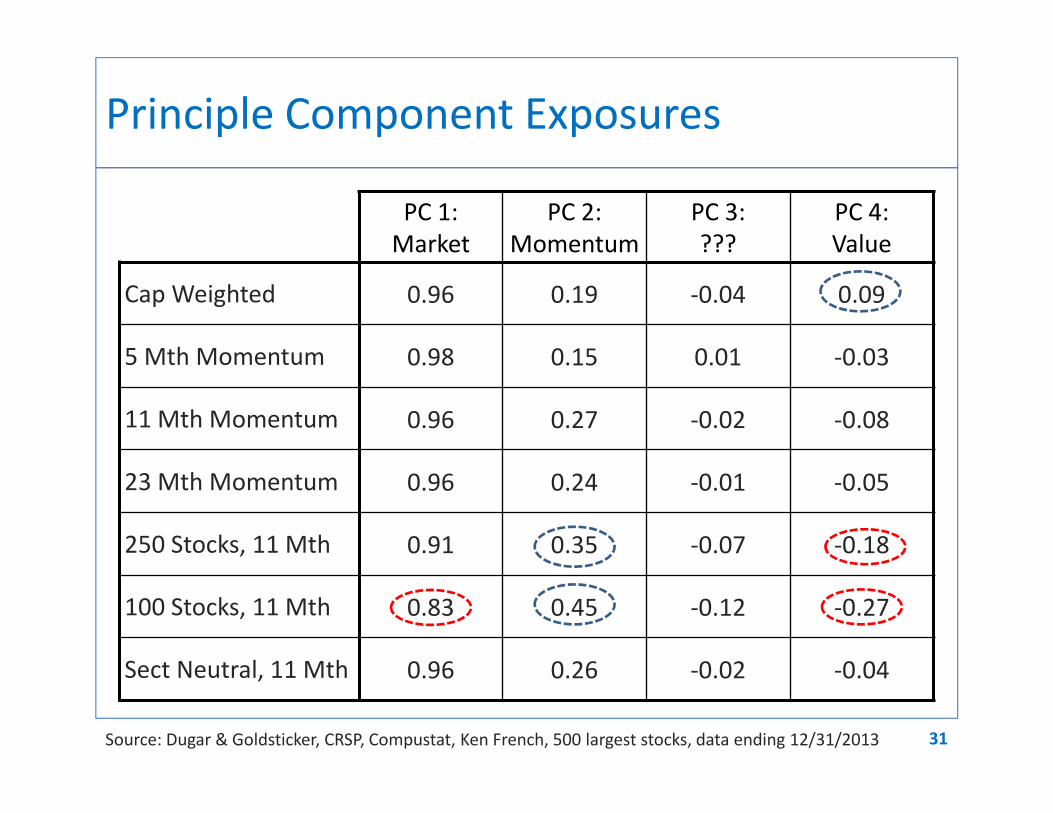
Principle Component Exposures
PC 1:
Market
PC 2:
Momentum
PC 3:
???
PC 4:
Value
Cap Weighted 0.96 0.19 -0.04 0.09
5 Mth Momentum 0.98 0.15 0.01 -0.03
11 Mth Momentum 0.96 0.27 -0.02 -0.08
23 Mth Momentum 0.96 0.24 -0.01 -0.05
250 Stocks, 11 Mth 0.91 0.35 -0.07 -0.18
100 Stocks, 11 Mth 0.83 0.45 -0.12 -0.27
Sect Neutral, 11 Mth 0.96 0.26 -0.02 -0.04
Source: Dugar & Goldsticker, CRSP, Compustat, Ken French, 500 largest stocks, data ending 12/31/2013 31

Momentum case study findings
32
Simulated returns:� All of the momentum strategies we examined
exhibited similar patterns of returns
• Most of outperformance came post Tech Bubble
• Underperformance during Financial Crisis
• Outperformance since
Comparison of metrics:
� Full simulation: 11 month outperformed 5
� 5 month momentum worst performer before and during Tech Bubble.
� More concentrated portfolios had larger factor exposures and performance cycles.

Smart Beta factor exposures across sleeves
� Fama-French
� Principle Components
Source: 33
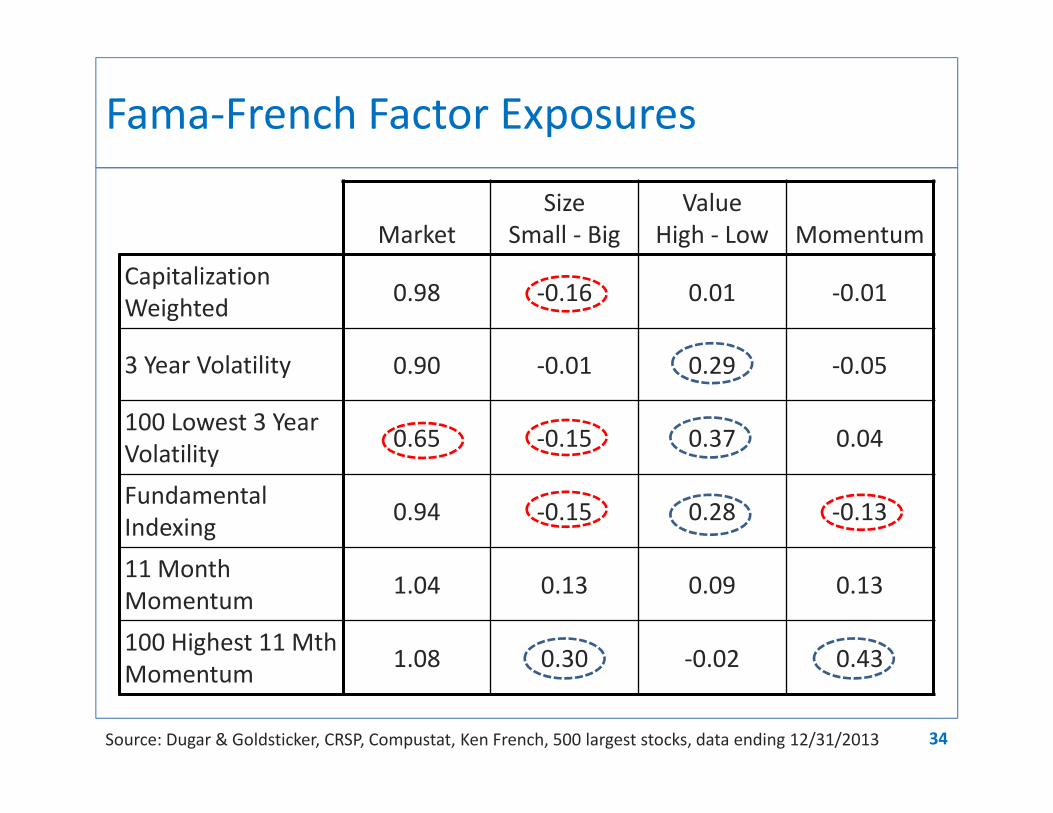
Fama-French Factor Exposures
Market
Size
Small - Big
Value
High - Low Momentum
Capitalization
Weighted0.98 -0.16 0.01 -0.01
3 Year Volatility 0.90 -0.01 0.29 -0.05
100 Lowest 3 Year
Volatility0.65 -0.15 0.37 0.04
Fundamental
Indexing0.94 -0.15 0.28 -0.13
11 Month
Momentum1.04 0.13 0.09 0.13
100 Highest 11 Mth
Momentum1.08 0.30 -0.02 0.43
Source: Dugar & Goldsticker, CRSP, Compustat, Ken French, 500 largest stocks, data ending 12/31/2013 34

Principle Components Analysis
PC 1:
Market
PC 2:
Momentum
PC 3:
???
PC 4:
Value
Capitalization
Weighted0.96 0.19 -0.04 0.09
3 Year Volatility 1.00 -0.04 0.03 0.03
100 Lowest 3 Year
Volatility0.87 -0.45 -0.03 -0.13
Fundamental
Indexing0.98 -0.02 0.01 0.19
11 Month
Momentum0.96 0.27 -0.02 -0.08
100 Highest 11 Mth
Momentum0.83 0.45 -0.12 -0.27
Source: Dugar & Goldsticker, CRSP, Compustat, 500 largest stocks, data ending 12/31/2013 35
Summary of simulated returns
� For each Smart Beta, results were largely
insensitive to the portfolio construction rules.• Average returns
• Drawdowns
• Behavior during Tech Bubble and Financial Crisis
� 100 and 250 stock portfolios• Larger drawdowns and cycles of relative
performance
• More extreme factor exposures
� Sector neutral portfolios• Less tracking error
Source: 36
Conclusions:
Pick the approach for economic reasons.� Don’t rely on backtests.� Why do you want the exposure?
• What risk or behavior is it intended to capture?• Pick approach most closely aligned with objective.
� Consider exposures to unintended risks.
How does the strategy fit into your aggregate portfolio?� Factor exposures� Is its behavior complimentary?
Pay attention to other portfolio characteristics.� Capacity, liquidity and concentration� Turnover and transactions costs� Management fees
37

Questions?
38